working paper 3 facility requirements - sd airport … paper 3 facility requirements ... the major...
TRANSCRIPT

Montgomery-Gibbs Executive Airport Master Plan
Working Paper 3 Facility Requirements
Table of Contents
3.1 Facility Requirements Overview .................................................................. 1
3.2 Airfield Facility Requirements ...................................................................... 1
Airspace Capacity ......................................................................................................................................................1 Airside Capacity......................................................................................................................................................... 2 Aircraft Mix Index .................................................................................................................................................... 3 Arrivals Percentage .................................................................................................................................................. 4 Touch-and-Go Percentage................................................................................................................................... 4 Taxiway Access Factors ......................................................................................................................................... 4 Instrument Approach Capabilities .................................................................................................................... 4 Weather Influences .................................................................................................................................................. 5 Airfield Capacity Calculations ............................................................................................................................. 8
3.3 Critical Aircraft ............................................................................................. 11
3.4 Airside Facility Requirements .................................................................... 11
Runway Design Code (RDC) ................................................................................................................................ 11 Airport Reference Code (ARC) ........................................................................................................................... 12 Runway Requirements ......................................................................................................................................... 12 Runway Protective Surfaces ............................................................................................................................... 16 Taxiway Requirements ......................................................................................................................................... 19 Airfield Pavement .................................................................................................................................................. 22 Airfield Lighting ..................................................................................................................................................... 25 Signage ...................................................................................................................................................................... 25 Airfield Marking ..................................................................................................................................................... 25
3.5 Landside Facility Requirements ................................................................. 25
Taxilanes ................................................................................................................................................................... 25 Aircraft Hangars .................................................................................................................................................... 26 Aircraft Parking Apron ........................................................................................................................................ 28 Fueling Facilities.................................................................................................................................................... 30 Terminal/Airport Administration Building ................................................................................................ 30 Support Facilities ....................................................................................................................................................32 Perimeter/Security Fencing and Access Gates ...........................................................................................32 Utilities ....................................................................................................................................................................... 33 Vehicle Access and Parking ................................................................................................................................ 33 Land Use .................................................................................................................................................................... 34
3.6 Advisory Committee Input .......................................................................... 37
Airside Facility Requirements Feedback ....................................................................................................... 37 Landside Facility Requirements Feedback ................................................................................................... 37 Summary .................................................................................................................................................................... 37

Montgomery-Gibbs Executive Airport Master Plan
Working Paper 3 Facility Requirements
Figures Figure 3.1 – Runway Utilization VFR Wind Observations Figure 3.2 – Runway Utilization IFR Wind Observations Figure 3.3 – Annual Service Volume vs. Annual Demand Figure 3.4 – Example Performance Curve Figure 3.5 – Fleet Mix Landing Distance Required (FT) Figure 3.6 – Example RSA, ROFA, and RPZ Dimensions Figure 3.7 – Existing and Proposed Hotspots Figure 3.8 – Preliminary Pavement Condition Index (PCI) Figure 3.9 – Apron Area Measurements Figure 3.10 – Non-Aeronautical Land Uses
Tables Table 3.1 – Montgomery-Gibbs Executive Airport Demand Forecast Summary Table 3.2 – FAA Aircraft Certifications Table 3.3 – Taxiway Exit Ranges Table 3.4 – Airfield Operating Configurations Table 3.5 – Annual Service Volume vs. Annual Demand Table 3.6 – Aircraft Approach Category Table 3.7 – Airplane Design Group Table 3.8 – Visibility Minimums Table 3.9 – MYF Runway Design Codes Table 3.10 – Runway Width Table 3.11 – Surveyed Jet Fleet Mix Table 3.12 – Runway Safety Area Dimensions Table 3.13 – Runway Object Free Area Dimensions Table 3.14 – Runway Protection Zones (RPZ's) Table 3.15 – Runway Magnetic Bearing Table 3.16 – Fair and Poor Pavement Sections Table 3.17 – Average Aircraft Space Requirements Table 3.18 – Aircraft Storage Assumptions Table 3.19 – Hangar Demand Summary Table 3.20 – Apron Area Demand Summary Table 3.21 – General Aviation Terminal Space Requirements Table 3.22 – Public Vehicle Parking Requirements

1
Working Paper 3 Facility Requirements
Montgomery-Gibbs Executive Airport Master Plan
3.1 Facility Requirements Overview
Working Paper 3 – Facility Requirements, identifies the specific types and quantities of infrastructure and facilities needed at Montgomery-Gibbs Executive Airport (MYF or Airport) to meet the Federal Aviation Administration’s (FAA) approved forecasted aviation demand presented in Working Paper 2. The results of a capacity and demand analysis, aviation demand forecasts, and other planning methodologies, determined the requirements for the airfield, landside, and support areas of the Airport. In addition to objective analyses, considerations were given to recommendations and feedback from airport personnel, tenants, airport businesses, and other stakeholders. The 20-year planning period for the Airport Master Plan begins with the base year of 2017 and extends through 2037. Development needs are broken down into short-term (1-5 years), mid-term (6-10 years), and long-term (11-to-20 years) planning periods. Short-term planning is focused on addressing immediate deficiencies, mid-term planning focuses on a more detailed assessment of needs, and long-term planning primarily focuses on the ultimate role and needs of the Airport. It is important to keep in mind that actual activity at MYF may vary over the 20-year planning period and may be higher or lower than what the aviation demand forecast predicted. However, using the three planning periods (short-, mid-, and long-term), the City of San Diego (City) can make informed decisions regarding the timing of development, which will result in fiscally responsible and demand-based development of MYF. For review, a summary of the FAA approved aviation demand forecast for each planning period for Montgomery-Gibbs Executive Airport is provided in Table 3.1.
Table 3.1 - Montgomery-Gibbs Executive Airport Demand Forecast Summary
2017 2022 2027 2032 2037
Based Aircraft 605 608 611 614 617
Annual Operations 201,631 206,517 211,521 216,647 221,896
Source: C&S Engineers, Inc.
Facility requirements at MYF have been broken down into two general groupings, Airfield Facility Requirements and Landside Facility Requirements. The Airfield Facility Requirements section relates to the runways, taxiways, and NAVAIDS, while the Landside Facility Requirements deals with aircraft parking and storage needs and other support facilities such as the Airport terminal building, fueling facilities, and any non-aeronautical facilities.
3.2 Airfield Facility Requirements
Airspace Capacity
Airspace is defined as the navigable space that is used by pilots to navigate from one airport to another. Airspace capacity can become constrained when flight paths of air traffic at nearby airports, or local navigational aids (NAVAIDS), interact to add operations to the airspace that surrounds an individual airport. This creates the possibility of congestion within MYF’s airspace. The need to alter flight paths of arriving and departing aircraft in order to avoid obstructions is also of concern. There are numerous public general aviation (GA) and commercial airports identified within 30 nautical miles of MYF; most notably San Diego International Airport (SAN) and Miramar Marine Corps Air Station (NKX), both of which have Class B airspace. The largest contributor to airspace capacity issues in the immediate region is located approximately three miles to the north of MYF. The Miramar Marine Corps Air Station is responsible for a majority of the military operations occurring in the
2
Working Paper 3 Facility Requirements
Montgomery-Gibbs Executive Airport Master Plan
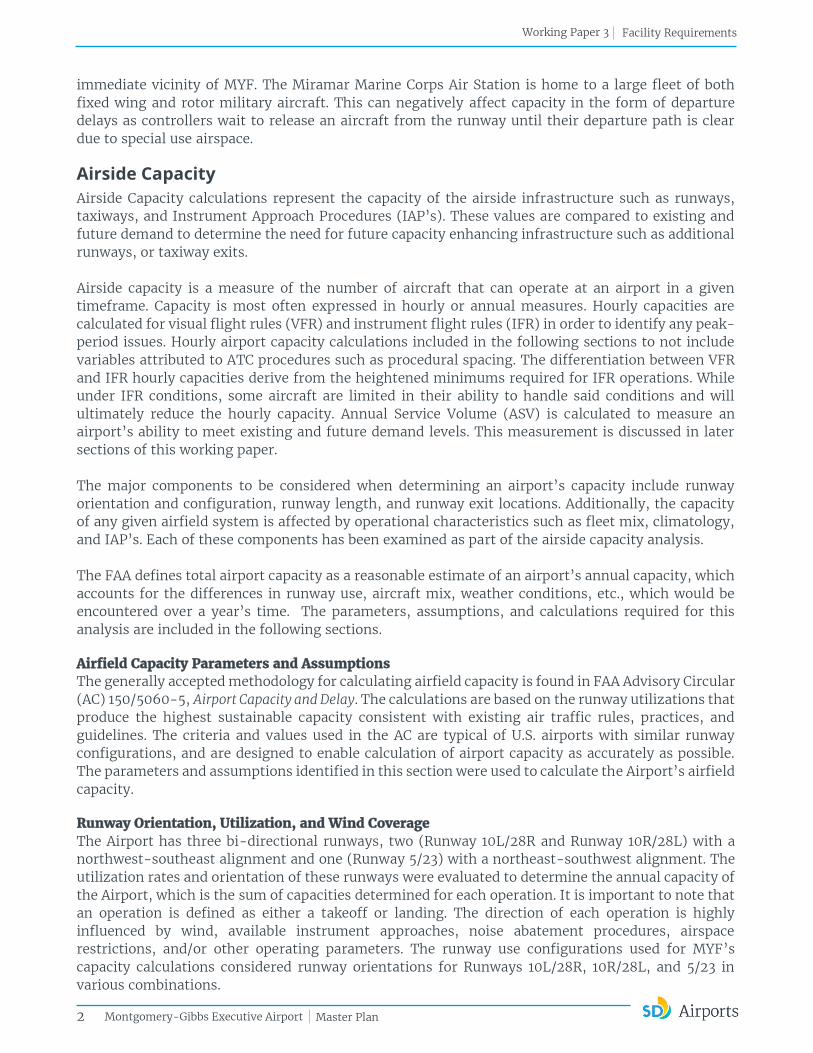
immediate vicinity of MYF. The Miramar Marine Corps Air Station is home to a large fleet of both fixed wing and rotor military aircraft. This can negatively affect capacity in the form of departure delays as controllers wait to release an aircraft from the runway until their departure path is clear due to special use airspace.
Airside Capacity
Airside Capacity calculations represent the capacity of the airside infrastructure such as runways, taxiways, and Instrument Approach Procedures (IAP’s). These values are compared to existing and future demand to determine the need for future capacity enhancing infrastructure such as additional runways, or taxiway exits. Airside capacity is a measure of the number of aircraft that can operate at an airport in a given timeframe. Capacity is most often expressed in hourly or annual measures. Hourly capacities are calculated for visual flight rules (VFR) and instrument flight rules (IFR) in order to identify any peak-period issues. Hourly airport capacity calculations included in the following sections to not include variables attributed to ATC procedures such as procedural spacing. The differentiation between VFR and IFR hourly capacities derive from the heightened minimums required for IFR operations. While under IFR conditions, some aircraft are limited in their ability to handle said conditions and will ultimately reduce the hourly capacity. Annual Service Volume (ASV) is calculated to measure an airport’s ability to meet existing and future demand levels. This measurement is discussed in later sections of this working paper. The major components to be considered when determining an airport’s capacity include runway orientation and configuration, runway length, and runway exit locations. Additionally, the capacity of any given airfield system is affected by operational characteristics such as fleet mix, climatology, and IAP’s. Each of these components has been examined as part of the airside capacity analysis. The FAA defines total airport capacity as a reasonable estimate of an airport’s annual capacity, which accounts for the differences in runway use, aircraft mix, weather conditions, etc., which would be encountered over a year’s time. The parameters, assumptions, and calculations required for this analysis are included in the following sections.
Airfield Capacity Parameters and Assumptions The generally accepted methodology for calculating airfield capacity is found in FAA Advisory Circular (AC) 150/5060-5, Airport Capacity and Delay. The calculations are based on the runway utilizations that produce the highest sustainable capacity consistent with existing air traffic rules, practices, and guidelines. The criteria and values used in the AC are typical of U.S. airports with similar runway configurations, and are designed to enable calculation of airport capacity as accurately as possible. The parameters and assumptions identified in this section were used to calculate the Airport’s airfield capacity.
Runway Orientation, Utilization, and Wind Coverage The Airport has three bi-directional runways, two (Runway 10L/28R and Runway 10R/28L) with a northwest-southeast alignment and one (Runway 5/23) with a northeast-southwest alignment. The utilization rates and orientation of these runways were evaluated to determine the annual capacity of the Airport, which is the sum of capacities determined for each operation. It is important to note that an operation is defined as either a takeoff or landing. The direction of each operation is highly influenced by wind, available instrument approaches, noise abatement procedures, airspace restrictions, and/or other operating parameters. The runway use configurations used for MYF’s capacity calculations considered runway orientations for Runways 10L/28R, 10R/28L, and 5/23 in various combinations.
3
Working Paper 3 Facility Requirements
Montgomery-Gibbs Executive Airport Master Plan
Providing adequate wind coverage is an important factor in enhancing an airports capacity. Runways should be constructed to maximize the opportunity for aircraft to take-off and land heading into the wind. The FAA recommends that each airports primary runway has 95 percent or greater wind coverage in all weather conditions. According to FAA AC 150/5300-13A, Airport Design, the 95 percent wind coverage is met for a B-II runway when the crosswind component does not exceed 13 knots. The all-weather wind rose and IFR wind rose identified that the existing runway system exceeds the 95 percent combined wind coverage requirement. Furthermore, the wind analysis revealed that each of the two bi-directional runways exceed the 95 percent wind coverage independently for the classes1 of aircraft most regularly accommodated.
Aircraft Mix Index
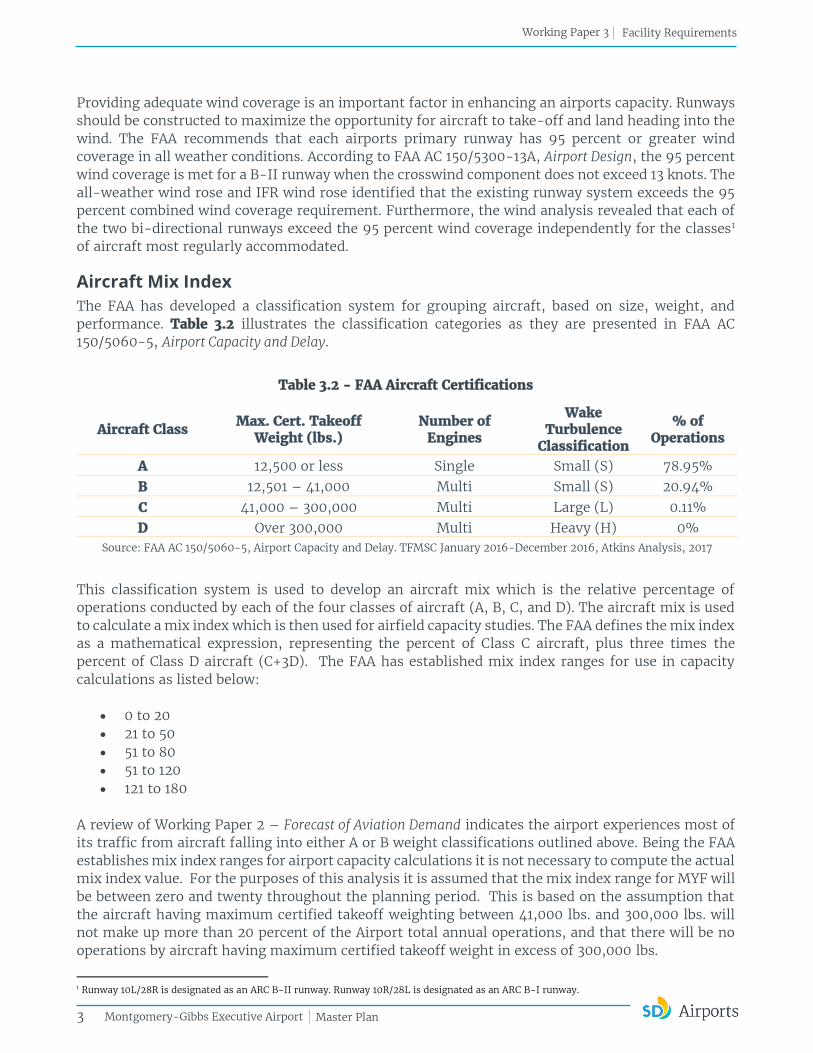
The FAA has developed a classification system for grouping aircraft, based on size, weight, and performance. Table 3.2 illustrates the classification categories as they are presented in FAA AC 150/5060-5, Airport Capacity and Delay.
Table 3.2 - FAA Aircraft Certifications
Aircraft Class Max. Cert. Takeoff Weight (lbs.)
Number of Engines
Wake Turbulence
Classification
% of Operations
A 12,500 or less Single Small (S) 78.95% B 12,501 – 41,000 Multi Small (S) 20.94% C 41,000 – 300,000 Multi Large (L) 0.11% D Over 300,000 Multi Heavy (H) 0%
Source: FAA AC 150/5060-5, Airport Capacity and Delay. TFMSC January 2016-December 2016, Atkins Analysis, 2017
This classification system is used to develop an aircraft mix which is the relative percentage of operations conducted by each of the four classes of aircraft (A, B, C, and D). The aircraft mix is used to calculate a mix index which is then used for airfield capacity studies. The FAA defines the mix index as a mathematical expression, representing the percent of Class C aircraft, plus three times the percent of Class D aircraft (C+3D). The FAA has established mix index ranges for use in capacity calculations as listed below:
0 to 20 21 to 50 51 to 80 51 to 120 121 to 180
A review of Working Paper 2 – Forecast of Aviation Demand indicates the airport experiences most of its traffic from aircraft falling into either A or B weight classifications outlined above. Being the FAA establishes mix index ranges for airport capacity calculations it is not necessary to compute the actual mix index value. For the purposes of this analysis it is assumed that the mix index range for MYF will be between zero and twenty throughout the planning period. This is based on the assumption that the aircraft having maximum certified takeoff weighting between 41,000 lbs. and 300,000 lbs. will not make up more than 20 percent of the Airport total annual operations, and that there will be no operations by aircraft having maximum certified takeoff weight in excess of 300,000 lbs.
1 Runway 10L/28R is designated as an ARC B-II runway. Runway 10R/28L is designated as an ARC B-I runway.
4
Working Paper 3 Facility Requirements
Montgomery-Gibbs Executive Airport Master Plan
Arrivals Percentage
The percent of arrivals is the ratio of arrivals to total operations. It is typically safe to assume that the total annual arrivals will equal total departures, and that average daily arrivals will equal average daily departures. Therefore, a factor of 50 percent arrivals will be used in the capacity calculations for the Airport. This percentage is based on operational understandings.
Touch-and-Go Percentage
The touch and go percentage is the ratio of landings with an immediate takeoff to total operations. This type of operation is typically associated with flight training. The number of touch and go operations normally decreases as jet operations increase, the demand for service and number of total operations approach runway capacity, and/or weather conditions deteriorate. Typically, touch-and-go operations are assumed to be between zero and 50 percent of total operations. Given the large flight training and general aviation presence at MYF, touch-and-go operations were found to account for 49.2 percent of all operations at the airport.
Taxiway Access Factors
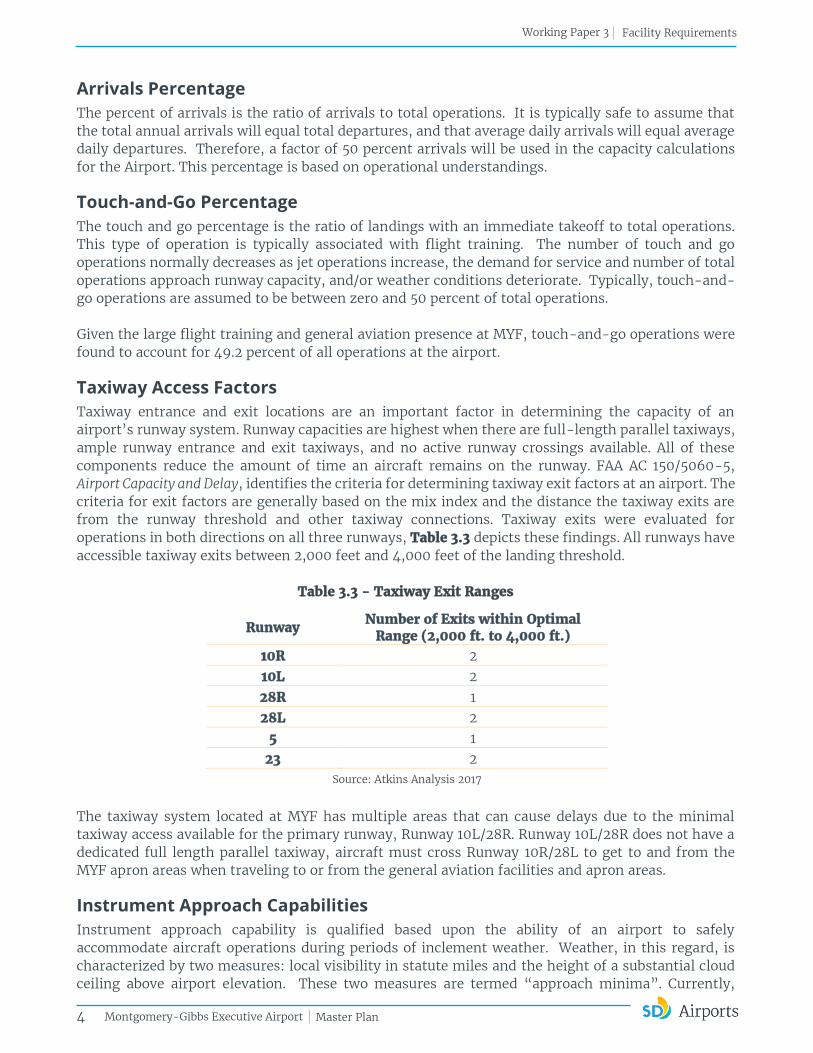
Taxiway entrance and exit locations are an important factor in determining the capacity of an airport’s runway system. Runway capacities are highest when there are full-length parallel taxiways, ample runway entrance and exit taxiways, and no active runway crossings available. All of these components reduce the amount of time an aircraft remains on the runway. FAA AC 150/5060-5, Airport Capacity and Delay, identifies the criteria for determining taxiway exit factors at an airport. The criteria for exit factors are generally based on the mix index and the distance the taxiway exits are from the runway threshold and other taxiway connections. Taxiway exits were evaluated for operations in both directions on all three runways, Table 3.3 depicts these findings. All runways have accessible taxiway exits between 2,000 feet and 4,000 feet of the landing threshold.
Table 3.3 - Taxiway Exit Ranges
Runway Number of Exits within Optimal Range (2,000 ft. to 4,000 ft.)
10R 2 10L 2 28R 1 28L 2
5 1 23 2
Source: Atkins Analysis 2017
The taxiway system located at MYF has multiple areas that can cause delays due to the minimal taxiway access available for the primary runway, Runway 10L/28R. Runway 10L/28R does not have a dedicated full length parallel taxiway, aircraft must cross Runway 10R/28L to get to and from the MYF apron areas when traveling to or from the general aviation facilities and apron areas.
Instrument Approach Capabilities
Instrument approach capability is qualified based upon the ability of an airport to safely accommodate aircraft operations during periods of inclement weather. Weather, in this regard, is characterized by two measures: local visibility in statute miles and the height of a substantial cloud ceiling above airport elevation. These two measures are termed “approach minima”. Currently,

5
Working Paper 3 Facility Requirements
Montgomery-Gibbs Executive Airport Master Plan
Runway 28R is the only runway which has a published Instrument Approach Procedure (IAP). This runway has both an ILS (LOC) approach as well as a RNAV (GPS) approach with approach minima as low as 200 FT AGL cloud cover and 1 SM visibility. The remaining runways at MYF are classified as visual and have no straight in approaches. However, a circle to land approach is available which allows pilots to fly the ILS or RNAV approach into Runway 28R, and circle around to land at another runway once the Airport is in sight. The approach minima for this procedure are 500 FT AGL cloud cover and at least 1 SM visibility.
Weather Influences
Weather data Operational limitations during such times of inclement weather were accounted for in Airport Capacity computations. Weather data obtained from the National Climatic Data Center (NCDC) is broken up into VFR and IFR observations. The data identified that IFR conditions (ceilings greater than 200 feet or less than 1,000 feet above ground level [AGL] and/or visibility greater than ½ mile but less than 3 miles) occur approximately 15.41% percent of the time at the airport. Wind data was obtained and analyzed to accurately depict the most appropriate operational traffic flow during various wind conditions. This wind data was utilized to understand runway utilization scenarios and to better understand the most favorable operational scenarios. Figures 3.1 and 3.2 depict the VFR and IFR wind observations over the past ten years and corresponding runway traffic flows. Table 3.4 depicts the airfield operating condition assumptions at MYF based on the NCDC weather data.
Table 3.4 - Airfield Operating Configurations
030° through 210° 210° through 030° 210° through 030°
030° through
210°
Arrivals 10L, 10R, 5 28L, 28R, 23* Runway 28 Only* No Arrivals
Arrival Traffic Flows
N/A
IFR/VFR VFR VFR IFR IFR Occurrence 17.44% 67.15% 11.19% 4.22%
Note: *Scenario includes calm wind observations
Source: NCDC Wind & Weather Operations, 2017, Atkins Analysis 2017
The NCDC data analyzed in this process does not identify specific visibility measurements, only that the observation met VFR or IFR criteria. Therefore, it is impossible to determine from the data set the percentage of time that the winds are from 030° and 210° in IFR conditions and meet the circling IAP approach minima of 1 statute mile and 500 feet for Runways 10L 10R and Runway 5. A conservative approach was adopted assuming that when these conditions occur, roughly 4.22% of the time, zero arrivals occur at MYF.

Figure 3.1
Runway UtilizationVFR Wind ObservationsMontgomery-Gibbs Executive
Airport Master Plan
Source: Data reported at MYF for theperiod between 2007-2016 and providedby the National Ocean & AtmosphericAdministration, National Climatic DataCenter

Figure 3.2
Runway UtilizationIFR Wind ObservationsMontgomery-Gibbs Executive
Airport Master Plan
Source: Data reported at MYF for theperiod between 2007-2016 and providedby the National Ocean & AtmosphericAdministration, National Climatic DataCenter

8
Working Paper 3 Facility Requirements
Montgomery-Gibbs Executive Airport Master Plan
Airfield Capacity Calculations
The airfield capacity calculations in this section were performed using the parameters and assumptions discussed in the previous sections. These calculations also utilize data from the aviation demand forecast, as presented within Working Paper 2 for portions of the capacity calculations. The following sections outline the hourly capacities in VFR and IFR conditions, as well as the Airport’s ASV. Hourly Capacity Calculations The hourly capacity of the runway facilities is determined by analyzing the appropriate VFR and IFR figures in AC 150/5060, Airport Capacity and Delay. The equation used to obtain the hourly capacity was taken from the FAA AC 150/5060-5, and is presented below. Hourly Capacity = (C*) x (T) x (E) Hourly Capacity Base (C*)
Hourly Capacity Base (C*) is calculated for both VFR conditions and IFR conditions utilizing FAA provided diagrams provided in AC 150/5060. By first imputing a combination of Mix Index, and Arrivals Percentage, the Hourly Capacity is determined. At MYF the following hourly capacity bases were utilized:
VFR - Operating Runway 10L, 10R, and Runway 5, (C*) = 200 VFR – Operating Runway 28R, 28L, and Runway 23, (C*) = 200 IFR – Operating Runway 28R Only, (C*)=59 IFR – No Arrivals
Touch & Go Factor (T)
The Touch and Go Factor (T) is an expression of touch and go activity and its effect on capacity. The value is derived using tables within AC 150/5060. The factors in calculating (T) include the percent of operations which are touch and go, and the mix index.
In VFR scenarios at MYF, (T)= 1.14 For IFR scenarios (T) is always assumed to be 1.00
Exit Factor (E)
Exit Factor (E) is an expression of the availability of taxiway exists within an appropriate range for the mix of aircraft operating at the airport, derived by selecting the appropriate tables provided within AC 150/5060. The primary factors in calculating (E) are the mix index, the number of exists which are within an appropriate exit range for arriving aircraft, and the percent arrivals (50%). To calculate capacity at MYF for various scenarios the following exit factors (E) were utilized: Operating Runways 10L, 10R & 5, (E)= .94 Operating Runways 28R, 28L & 23, (E)= 1.0 Operating Runway 28R only, (E)= .94
Hourly VFR Capacity Hourly VFR capacities at MYF were calculated to be 228 when winds favor the use of Runways 28L and 28R, and Runway 23, and 214 when winds favor the use of Runways 10L, 10R and 5.
Hourly IFR Capacity Hourly IFR capacities used similar assumptions to those used in the VFR hourly capacity calculations.
9
Working Paper 3 Facility Requirements
Montgomery-Gibbs Executive Airport Master Plan
However, maintaining greater separation between aircraft is generally required during IFR operations. And given that there are limited instrument approach capabilities at the airport, the hourly capacity base variable of the equation is lowered. This adjustment reduces the overall hourly capacity during IFR operations. When winds favor operations on Runway 28L, 28R, and Runway 5 the hourly IFR Capacity is 55 due to the availability of specific instrument approach capabilities on Runway 28R. Hourly IFR capacities were calculated to be zero when winds favor the use of Runway 10L, 10R, and Runway 5 during IFR conditions, due to weather and operating characteristics assumptions.
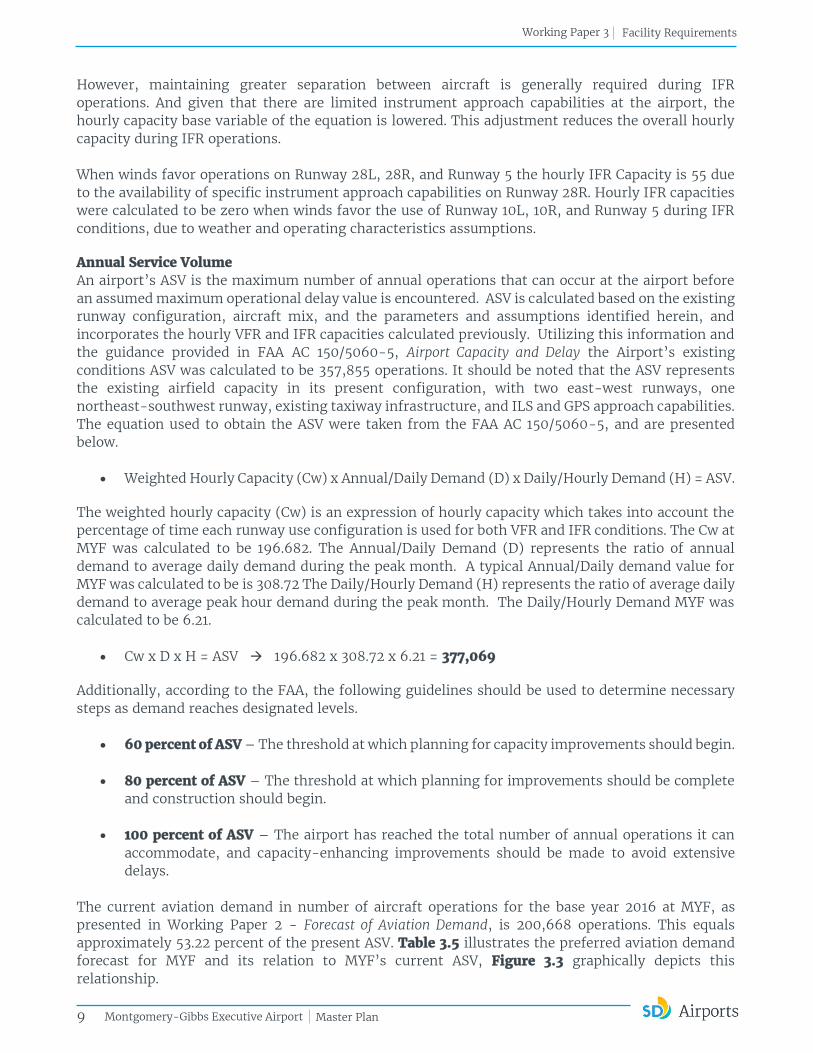
Annual Service Volume An airport’s ASV is the maximum number of annual operations that can occur at the airport before an assumed maximum operational delay value is encountered. ASV is calculated based on the existing runway configuration, aircraft mix, and the parameters and assumptions identified herein, and incorporates the hourly VFR and IFR capacities calculated previously. Utilizing this information and the guidance provided in FAA AC 150/5060-5, Airport Capacity and Delay the Airport’s existing conditions ASV was calculated to be 357,855 operations. It should be noted that the ASV represents the existing airfield capacity in its present configuration, with two east-west runways, one northeast-southwest runway, existing taxiway infrastructure, and ILS and GPS approach capabilities. The equation used to obtain the ASV were taken from the FAA AC 150/5060-5, and are presented below.
Weighted Hourly Capacity (Cw) x Annual/Daily Demand (D) x Daily/Hourly Demand (H) = ASV.
The weighted hourly capacity (Cw) is an expression of hourly capacity which takes into account the percentage of time each runway use configuration is used for both VFR and IFR conditions. The Cw at MYF was calculated to be 196.682. The Annual/Daily Demand (D) represents the ratio of annual demand to average daily demand during the peak month. A typical Annual/Daily demand value for MYF was calculated to be is 308.72 The Daily/Hourly Demand (H) represents the ratio of average daily demand to average peak hour demand during the peak month. The Daily/Hourly Demand MYF was calculated to be 6.21.
Cw x D x H = ASV 196.682 x 308.72 x 6.21 = 377,069
Additionally, according to the FAA, the following guidelines should be used to determine necessary steps as demand reaches designated levels.
60 percent of ASV – The threshold at which planning for capacity improvements should begin.
80 percent of ASV – The threshold at which planning for improvements should be complete and construction should begin.
100 percent of ASV – The airport has reached the total number of annual operations it can
accommodate, and capacity-enhancing improvements should be made to avoid extensive delays.
The current aviation demand in number of aircraft operations for the base year 2016 at MYF, as presented in Working Paper 2 - Forecast of Aviation Demand, is 200,668 operations. This equals approximately 53.22 percent of the present ASV. Table 3.5 illustrates the preferred aviation demand forecast for MYF and its relation to MYF’s current ASV, Figure 3.3 graphically depicts this relationship.

10
Working Paper 3 Facility Requirements
Montgomery-Gibbs Executive Airport Master Plan
Table 3.5 - Annual Service Volume vs. Annual Demand
Year Annual Operations Annual Service Volume Percent of Annual Service
Volume
2016 200,668 377,069 53.22%
2022 206,517 377,069 54.77%
2027 211,521 377,069 56.10%
2032 216,647 377,069 57.46%
2037 221,896 377,069 58.85% Sources: FAA AC 150/5060-5, Airport Capacity and Delay, and analysis by Atkins, 2017
Figure 3.3 Annual Service Volume vs. Annual Demand
Sources: FAA AC 150/5060-5, Airport Capacity and Delay, and analysis by Atkins, 2017.
Prepared by: Atkins, 2017.
Based on the calculated relationship between the Airport’s existing ASV and forecast of aviation demand, the airport does not have a need to plan for capacity enhancing runway and taxiway projects within the forecast period.
Aircraft Delay Although the analysis indicated that MYF’s current and forecast level of aeronautical activity is not anticipated to exceed the airfield’s calculated capacity, the potential for aircraft delay still exists due to other factors such as ATC procedures and weather conditions.
0
50000
100000
150000
200000
250000
300000
350000
400000
2016 2017 2022 2027 2031
AN
NU
AL
OP
ER
AT
ION
S
YEAR
ASV
80% ASV
60% ASV
Total Operations
11
Working Paper 3 Facility Requirements
Montgomery-Gibbs Executive Airport Master Plan
3.3 Critical Aircraft
An initial step in identifying the Airport’s potential runway and taxiway facility requirements is the establishment of fundamental development guidelines for the largest or most demanding aircraft anticipated to make regular use of the airport facilities. Airport improvements are planned and developed per the established ARC for the airport and then for each runway. The critical aircraft that consistently makes substantial use of the Airport determines an airport’s ARC. FAA Order 5090.3B, Field Formulation of the National Plan of Integrated Airport Systems (NPIAS), defines “substantial use” as 500 or more annual aircraft operations. An airports critical aircraft affects key aspects of design, such as the sizing of runways, taxiways/lanes, and the location of aircraft parking areas, hangar facilities, and protected airspace surfaces. As discussed in more detail in Working Paper 2 – Forecasts of Aviation Demand, MYF has two critical aircraft identified for the three runways. Per the approved FAA forecast, the Beechcraft King Air 350 was selected as the critical aircraft for Runway 10L/28R and Runway 5/23. The Cessna 421 was identified as the critical aircraft for Runway 10R/28L.
3.4 Airside Facility Requirements
FAA standards are utilized in this analysis for developing airport facilities capable of meeting both existing and forecasted levels of aviation activity. FAA AC 150/5300-13A, Airport Design, uses coding systems to relate airport design criteria to the operational and physical characteristics of the aircraft that operate, or are projected to operate, at an airport. These airport design criteria will further dictate the future need for expanded airfield infrastructure and operational parameters to best plan and meet the forecasted future operations.
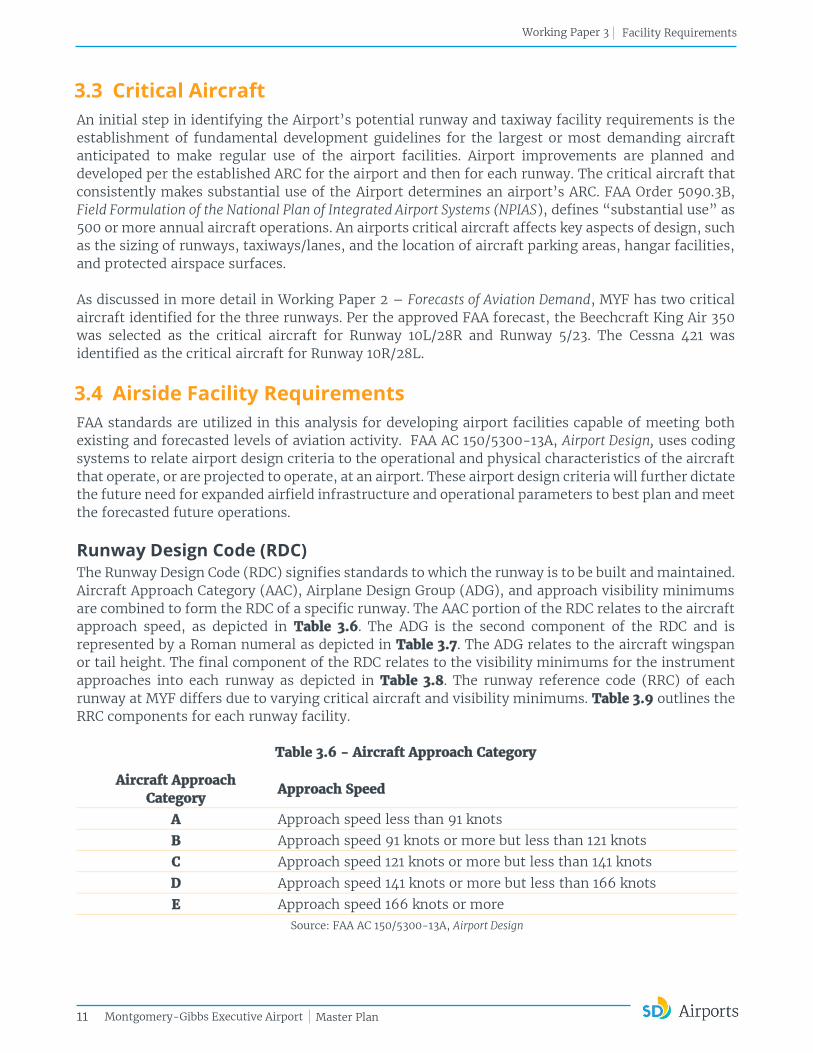
Runway Design Code (RDC) The Runway Design Code (RDC) signifies standards to which the runway is to be built and maintained. Aircraft Approach Category (AAC), Airplane Design Group (ADG), and approach visibility minimums are combined to form the RDC of a specific runway. The AAC portion of the RDC relates to the aircraft approach speed, as depicted in Table 3.6. The ADG is the second component of the RDC and is represented by a Roman numeral as depicted in Table 3.7. The ADG relates to the aircraft wingspan or tail height. The final component of the RDC relates to the visibility minimums for the instrument approaches into each runway as depicted in Table 3.8. The runway reference code (RRC) of each runway at MYF differs due to varying critical aircraft and visibility minimums. Table 3.9 outlines the RRC components for each runway facility.
Table 3.6 - Aircraft Approach Category
Aircraft Approach Category
Approach Speed
A Approach speed less than 91 knots
B Approach speed 91 knots or more but less than 121 knots
C Approach speed 121 knots or more but less than 141 knots
D Approach speed 141 knots or more but less than 166 knots
E Approach speed 166 knots or more Source: FAA AC 150/5300-13A, Airport Design

12
Working Paper 3 Facility Requirements
Montgomery-Gibbs Executive Airport Master Plan
Table 3.7 - Airplane Design Group
Group # Tail Height (FT) Wingspan (FT)
I < 20 < 49
II 20 - < 30 49 - < 79
III 30 - < 45 79 - < 118
IV 45 - < 60 118 - < 171
V 60 - < 66 171 - < 214
VI 66 - < 80 214 - < 262 Source: FAA AC 150/5300-13A, Airport Design
Table 3.8 - Visibility Minimums
RVR (FT) Flight Visibility Category (statute mile)
VIS Visual Approach
5000 Greater than or equal to 1 mile
4000 Lower than 1 mile but not lower than ¾ mile
2400 Lower than 3/4 mile but not lower than 1/2 mile
1600 Lower than 1/2 mile but not lower than 1/4 mile
1200 Lower than 1/4 mile Source: FAA AC 150/5300-13A, Airport Design
Table 3.9 - MYF Runway Design Codes
Runway Critical Aircraft AAC ADG Visibility Minimums
(RVR) (FT)
10L/28R King Air 350 B II 2,400
10R/28L Cessna 421 B I(S) VIS
5/23 King Air 350 B II VIS Source: AC150/5300-13A, Airport Design, C&S Engineers, Inc., Atkins Analysis 2017
Airport Reference Code (ARC) Per FAA AC 150/5300-13A, the ARC is a system used to relate airport design criteria to the planner or designer and is based on the Airport’s highest RDC. Airport improvements can be planned and developed per the established ARC for an entire airport. The ARC is based on a combination of AAC and ADG, described in Table 3.6 and Table 3.7 respectively. The existing and future ARC for MYF is B-II.
Runway Requirements This section of the report will look at MYF’s three runways and whether or not they meet both existing and future requirements. Specifically, the runways’ general characteristics will be analyzed with respect to FAA design and safety requirements and conformance with the recommendations. Runway designation and length requirements will also be reviewed.

13
Working Paper 3 Facility Requirements
Montgomery-Gibbs Executive Airport Master Plan
Runway Width Runway width standards are established in FAA AC 150/5300-13A and are based on RDC criteria. Table 3.10 outlines the FAA runway width standards, and the existing runway facilities at MYF. Currently MYF meets or exceeds the existing and future FAA requirements for runway width on all runways.
Table 3.10 -Runway Width
Runway RDC FAA Requirement
Width (FT) Existing Width (FT)
10L/28R B-II-2400 100 150
10R/28L B-I-VIS 60 60
5/23 B-II-VIS 75 75 Source: 150/5300-13A, Airport Design, C&S Engineers, Inc., Atkins Analysis 2017
Runway Length: Takeoff Distance Runway length requirements are based on a variety of factors, the most notable of which is the takeoff distance of the critical aircraft operating on the runway. The departure requirements are often the most critical for measuring runway length required since departing aircraft have a full fuel load thus increasing the amount of runway required. Average high temperatures and the elevation of the runway are other factors that affect runway length requirements. The mild temperatures and low elevation of MYF make these factors less important. FAA AC 150/5325-4B, Runway Length Requirements of Airport Design, provides guidance that suggests recommending runway lengths based on a family grouping of aircraft. This grouping method is used when the critical aircraft has a maximum takeoff weight (MTOW) less than 60,000 pounds.
Fleet Mix and Critical Aircraft In accordance with AC 150/5325-4B, the existing fleet mix was analyzed in detail to verify the type of runway length analysis required. Table 3.11 lists the aircraft fleet mix obtained from an analysis of FAA Traffic Flow Management System Count (TFMSC) data of aircraft operations for the 2016 calendar year by aircraft type, ARC, MTOW. Most of the aircraft outlined in Table 3.11 fall within the range of 12,500 pounds to 60,000 pounds. Therefore, a family grouping of aircraft design approach was used when to calculate runway length requirements.
Table 3.11 - Surveyed Jet Fleet Mix
Aircraft ARC MTOW Aircraft Type
Eclipse 500 A-I 5,950 Jet
Cessna Citation I B-I 11,850 Jet
Cessna Citation II B-II 13,300 Jet
Cessna Citation CJ3 B-II 13,870 Jet
Bombardier Learjet 35/36 D-I 18,000 Jet
Cessna Citation CJ4 C-I 17,110 Jet Source: TFMSC data January 2016-December-2016, C&S Engineers, Inc., Atkins Analysis 2017
14
Working Paper 3 Facility Requirements
Montgomery-Gibbs Executive Airport Master Plan
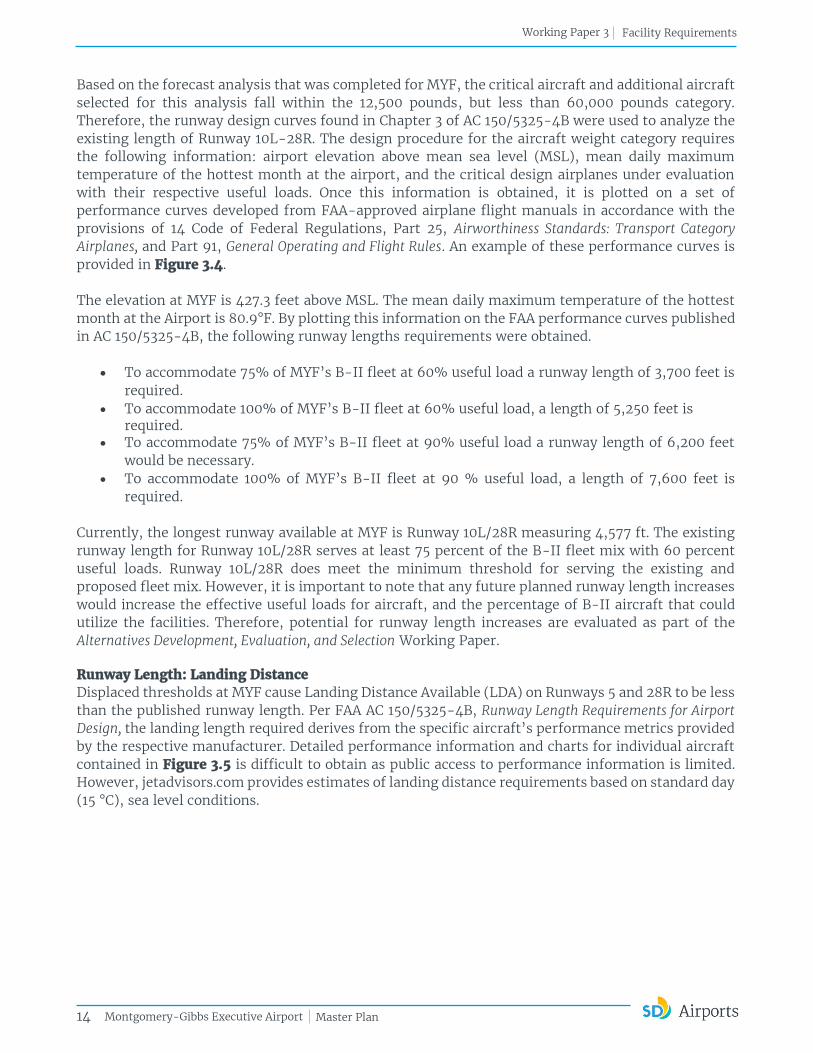
Based on the forecast analysis that was completed for MYF, the critical aircraft and additional aircraft selected for this analysis fall within the 12,500 pounds, but less than 60,000 pounds category. Therefore, the runway design curves found in Chapter 3 of AC 150/5325-4B were used to analyze the existing length of Runway 10L-28R. The design procedure for the aircraft weight category requires the following information: airport elevation above mean sea level (MSL), mean daily maximum temperature of the hottest month at the airport, and the critical design airplanes under evaluation with their respective useful loads. Once this information is obtained, it is plotted on a set of performance curves developed from FAA-approved airplane flight manuals in accordance with the provisions of 14 Code of Federal Regulations, Part 25, Airworthiness Standards: Transport Category Airplanes, and Part 91, General Operating and Flight Rules. An example of these performance curves is provided in Figure 3.4. The elevation at MYF is 427.3 feet above MSL. The mean daily maximum temperature of the hottest month at the Airport is 80.9°F. By plotting this information on the FAA performance curves published in AC 150/5325-4B, the following runway lengths requirements were obtained.
To accommodate 75% of MYF’s B-II fleet at 60% useful load a runway length of 3,700 feet is required.
To accommodate 100% of MYF’s B-II fleet at 60% useful load, a length of 5,250 feet is required.
To accommodate 75% of MYF’s B-II fleet at 90% useful load a runway length of 6,200 feet would be necessary.
To accommodate 100% of MYF’s B-II fleet at 90 % useful load, a length of 7,600 feet is required.
Currently, the longest runway available at MYF is Runway 10L/28R measuring 4,577 ft. The existing runway length for Runway 10L/28R serves at least 75 percent of the B-II fleet mix with 60 percent useful loads. Runway 10L/28R does meet the minimum threshold for serving the existing and proposed fleet mix. However, it is important to note that any future planned runway length increases would increase the effective useful loads for aircraft, and the percentage of B-II aircraft that could utilize the facilities. Therefore, potential for runway length increases are evaluated as part of the Alternatives Development, Evaluation, and Selection Working Paper.
Runway Length: Landing Distance Displaced thresholds at MYF cause Landing Distance Available (LDA) on Runways 5 and 28R to be less than the published runway length. Per FAA AC 150/5325-4B, Runway Length Requirements for Airport Design, the landing length required derives from the specific aircraft’s performance metrics provided by the respective manufacturer. Detailed performance information and charts for individual aircraft contained in Figure 3.5 is difficult to obtain as public access to performance information is limited. However, jetadvisors.com provides estimates of landing distance requirements based on standard day (15 °C), sea level conditions.
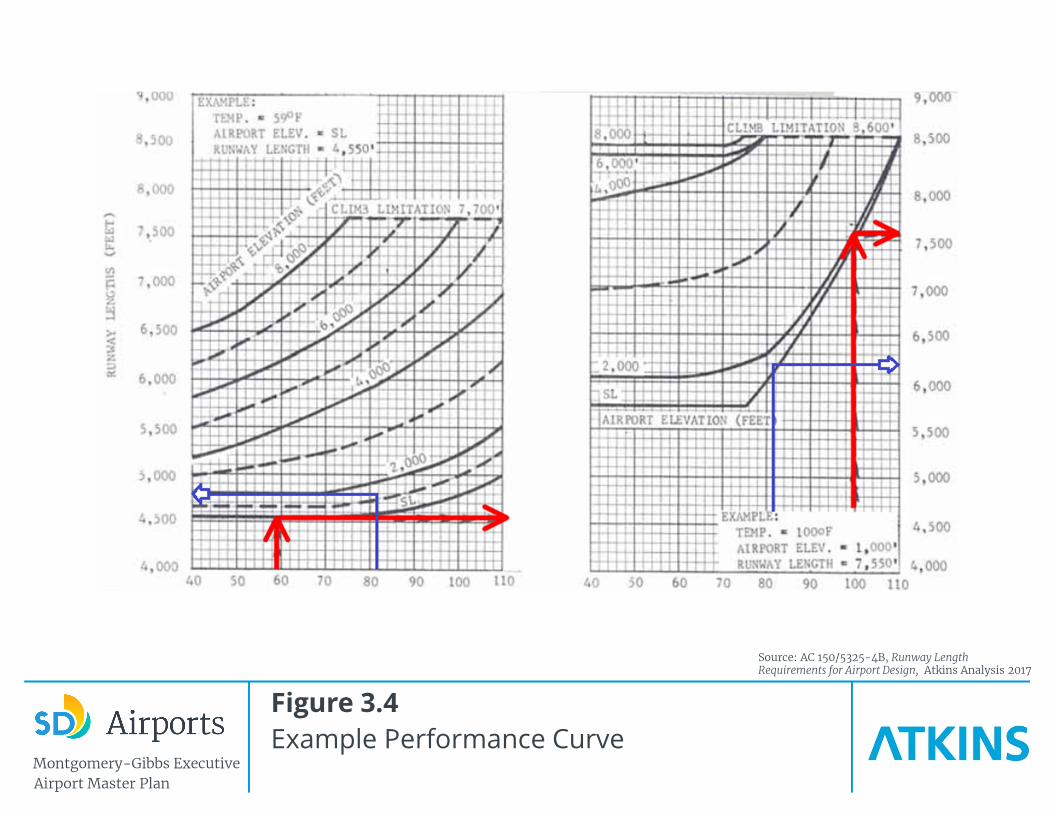
Figure 3.4
Example Performance CurveMontgomery-Gibbs Executive
Airport Master Plan
Source: AC 150/5325-4B, Runway Length Requirements for Airport Design, Atkins Analysis 2017
16
Working Paper 3 Facility Requirements
Montgomery-Gibbs Executive Airport Master Plan
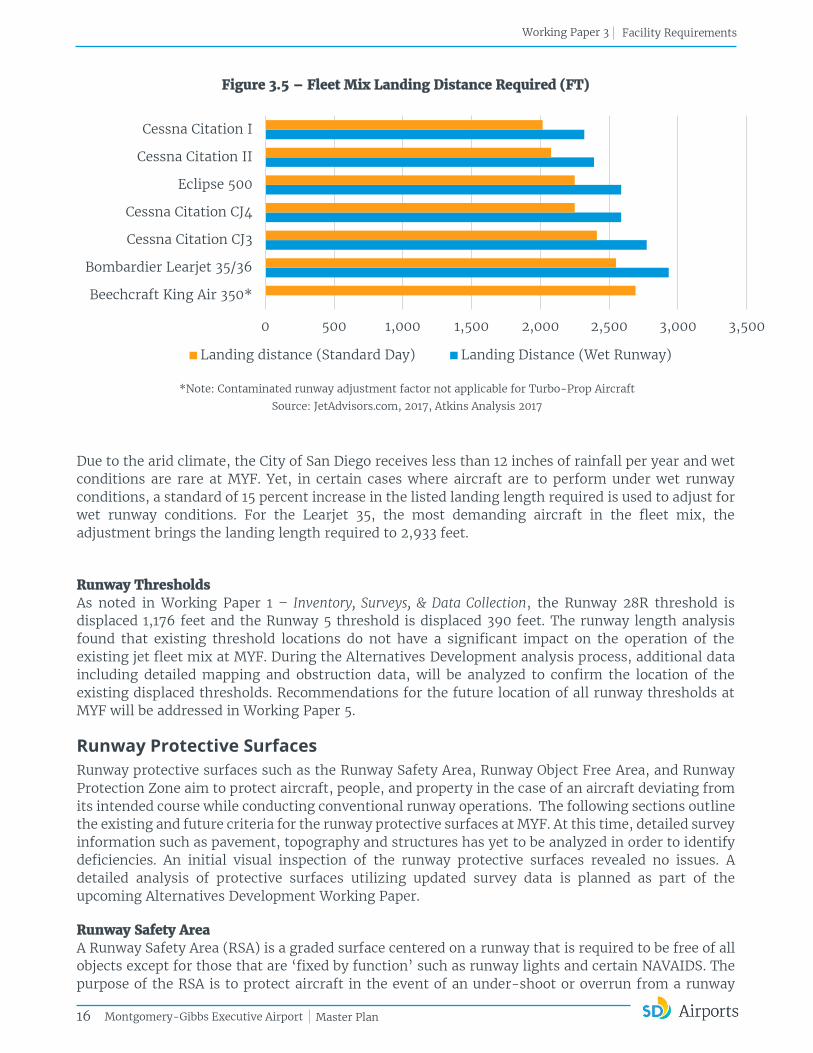
Figure 3.5 – Fleet Mix Landing Distance Required (FT)
*Note: Contaminated runway adjustment factor not applicable for Turbo-Prop Aircraft
Source: JetAdvisors.com, 2017, Atkins Analysis 2017
Due to the arid climate, the City of San Diego receives less than 12 inches of rainfall per year and wet conditions are rare at MYF. Yet, in certain cases where aircraft are to perform under wet runway conditions, a standard of 15 percent increase in the listed landing length required is used to adjust for wet runway conditions. For the Learjet 35, the most demanding aircraft in the fleet mix, the adjustment brings the landing length required to 2,933 feet.
Runway Thresholds As noted in Working Paper 1 – Inventory, Surveys, & Data Collection, the Runway 28R threshold is displaced 1,176 feet and the Runway 5 threshold is displaced 390 feet. The runway length analysis found that existing threshold locations do not have a significant impact on the operation of the existing jet fleet mix at MYF. During the Alternatives Development analysis process, additional data including detailed mapping and obstruction data, will be analyzed to confirm the location of the existing displaced thresholds. Recommendations for the future location of all runway thresholds at MYF will be addressed in Working Paper 5.
Runway Protective Surfaces
Runway protective surfaces such as the Runway Safety Area, Runway Object Free Area, and Runway Protection Zone aim to protect aircraft, people, and property in the case of an aircraft deviating from its intended course while conducting conventional runway operations. The following sections outline the existing and future criteria for the runway protective surfaces at MYF. At this time, detailed survey information such as pavement, topography and structures has yet to be analyzed in order to identify deficiencies. An initial visual inspection of the runway protective surfaces revealed no issues. A detailed analysis of protective surfaces utilizing updated survey data is planned as part of the upcoming Alternatives Development Working Paper.
Runway Safety Area A Runway Safety Area (RSA) is a graded surface centered on a runway that is required to be free of all objects except for those that are ‘fixed by function’ such as runway lights and certain NAVAIDS. The purpose of the RSA is to protect aircraft in the event of an under-shoot or overrun from a runway
0 500 1,000 1,500 2,000 2,500 3,000 3,500
Beechcraft King Air 350*
Bombardier Learjet 35/36
Cessna Citation CJ3
Cessna Citation CJ4
Eclipse 500
Cessna Citation II
Cessna Citation I
Landing distance (Standard Day) Landing Distance (Wet Runway)

17
Working Paper 3 Facility Requirements
Montgomery-Gibbs Executive Airport Master Plan
during landing or take-off operations. The area must be able to support emergency vehicle operations and maintenance vehicles and is required to be graded to slope away from the runway at 1.5 to 5.0 percent. The width and length of an RSA depend upon an airport’s RDC and approach visibility minimums. Meeting RSA requirements is one of the FAA’s highest priorities in maintaining safety at the Nation’s airports. Table 3.12 lists the Airport’s existing and future RSA requirements. The compliance of the RSA with all relevant FAA standards is discussed in Working Paper 5.
Table 3.12 – Runway Safety Area Dimensions
Runway RDC RSA Width (FT) Length Beyond Runway End
(FT)
10L/28R B-II-2400 300 600
10R/28L B-I-VIS 120 240
5/23 B-II-VIS 150 300 Source: FAA AC 150/5300-13A, Airport Design, Atkins Analysis 2017
Runway Object Free Area - ROFA Similar to the RSA, the Runway Object Free Area (ROFA) must be free of objects except those required to support air navigation and ground maneuvering operations. The function of the ROFA, also centered on the runway, is to enhance the safety of aircraft operating on the runway. It is not permissible to park an airplane within the ROFA. The width and length of the ROFA depend upon an airport’s specific RDC and approach visibility minima. The ROFA does not have specific slope requirements, but the terrain within the ROFA must be relatively smooth and graded to be at or below the edge of the RSA. The compliance of the ROFA with all relevant FAA standards is discussed in Working Paper 5. Table 3.13 notes the ROFA dimensions for MYF:
Table 3.13 - Runway Object Free Area Dimensions
Runway RDC ROFA Width (FT) Length Beyond Runway End
(FT)
10L/28R B-II-2400 800 600
10R/28L B-I-VIS 250 240
5/23 B-II-VIS 500 300 Source: FAA AC 150/5300-13A, Airport Design, Atkins Analysis 2017
Runway Protection Zones A Runway Protection Zone (RPZ) is an area centered symmetrically on an extended runway centerline. The RPZ has a trapezoidal shape and extends prior to each runway end. The RPZ is aimed at enhancing the safety of people and property on the ground by limiting and/or restricting the construction of certain structures within its bounds. This area should be free of land uses that create glare, smoke, or other hazards to air navigation. Additionally the FAA requires that no vertical structures are constructed within the extents of the RPZ. The dimensions of an RPZ depend on each runway’s RDC. With no proposed reductions in instrument approach visibility minimums, the size and dimensions of the existing RPZ’s at MYF are not anticipated to change throughout the planning period. Table 3.14 illustrates the RPZ requirements for B-I and B-II RDC’s. Figure 3.6 displays the dimensions for RSA, ROFA, and RPZ.

18
Working Paper 3 Facility Requirements
Montgomery-Gibbs Executive Airport Master Plan
Table 3.14 - Runway Protection Zones (RPZ's)
RDC Length (FT) Inner Width (FT)
Outer Width (FT)
Approach RPZ
10L/28R B-II-2400 1000 / 2,500 500 / 1,000 700 / 1,750
10R/28L B-I-VIS 1,000 250 450
5/23 B-II-VIS 1,000 500 700
Departure RPZ
10L/28R B-II-2400 1000 500 700
10R/28L B-I-VIS 1,000 250 450
5/23 B-II-VIS 1,000 500 700 Source: FAA AC 150/5300-13, Airport Design, Atkins Analysis 2017
Figure 3.6 – Example RSA, ROFA, and RPZ Dimensions
Source: FAA AC 150/5300-13, Airport Design
19
Working Paper 3 Facility Requirements
Montgomery-Gibbs Executive Airport Master Plan
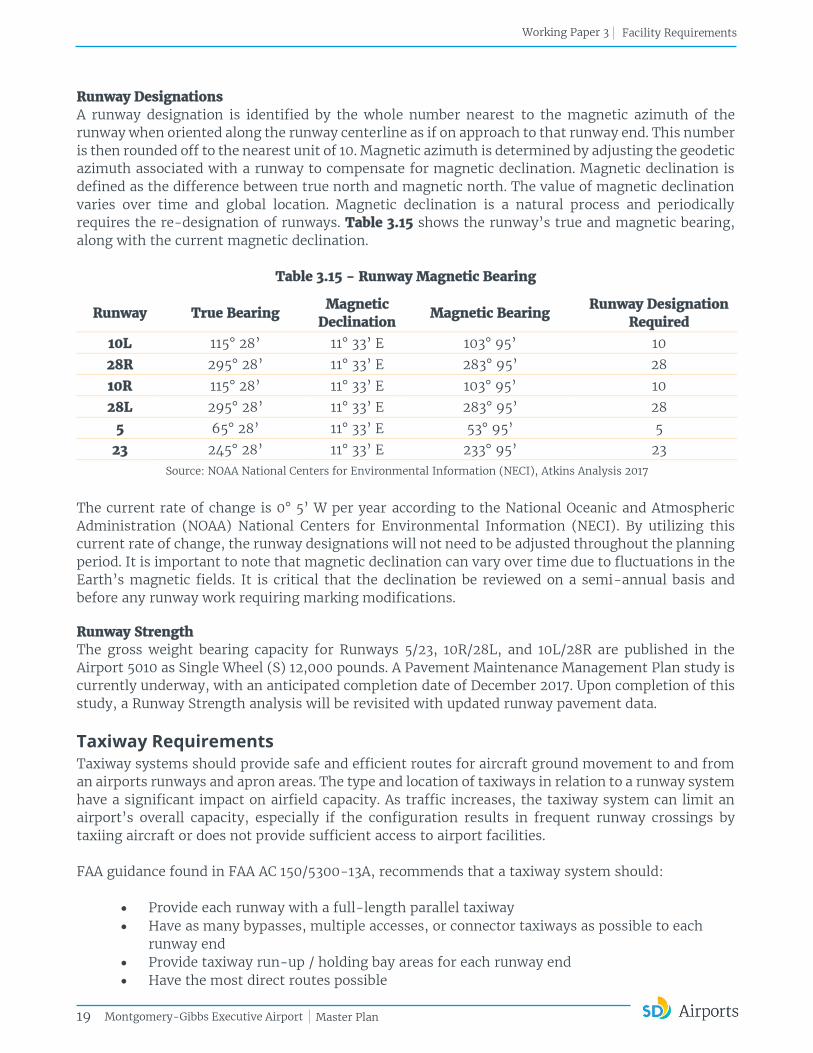
Runway Designations A runway designation is identified by the whole number nearest to the magnetic azimuth of the runway when oriented along the runway centerline as if on approach to that runway end. This number is then rounded off to the nearest unit of 10. Magnetic azimuth is determined by adjusting the geodetic azimuth associated with a runway to compensate for magnetic declination. Magnetic declination is defined as the difference between true north and magnetic north. The value of magnetic declination varies over time and global location. Magnetic declination is a natural process and periodically requires the re-designation of runways. Table 3.15 shows the runway’s true and magnetic bearing, along with the current magnetic declination.
Table 3.15 - Runway Magnetic Bearing
Runway True Bearing Magnetic
Declination Magnetic Bearing
Runway Designation Required
10L 115° 28’ 11° 33’ E 103° 95’ 10
28R 295° 28’ 11° 33’ E 283° 95’ 28
10R 115° 28’ 11° 33’ E 103° 95’ 10
28L 295° 28’ 11° 33’ E 283° 95’ 28
5 65° 28’ 11° 33’ E 53° 95’ 5
23 245° 28’ 11° 33’ E 233° 95’ 23 Source: NOAA National Centers for Environmental Information (NECI), Atkins Analysis 2017
The current rate of change is 0° 5’ W per year according to the National Oceanic and Atmospheric Administration (NOAA) National Centers for Environmental Information (NECI). By utilizing this current rate of change, the runway designations will not need to be adjusted throughout the planning period. It is important to note that magnetic declination can vary over time due to fluctuations in the Earth’s magnetic fields. It is critical that the declination be reviewed on a semi-annual basis and before any runway work requiring marking modifications.
Runway Strength The gross weight bearing capacity for Runways 5/23, 10R/28L, and 10L/28R are published in the Airport 5010 as Single Wheel (S) 12,000 pounds. A Pavement Maintenance Management Plan study is currently underway, with an anticipated completion date of December 2017. Upon completion of this study, a Runway Strength analysis will be revisited with updated runway pavement data.
Taxiway Requirements Taxiway systems should provide safe and efficient routes for aircraft ground movement to and from an airports runways and apron areas. The type and location of taxiways in relation to a runway system have a significant impact on airfield capacity. As traffic increases, the taxiway system can limit an airport’s overall capacity, especially if the configuration results in frequent runway crossings by taxiing aircraft or does not provide sufficient access to airport facilities. FAA guidance found in FAA AC 150/5300-13A, recommends that a taxiway system should:
Provide each runway with a full-length parallel taxiway Have as many bypasses, multiple accesses, or connector taxiways as possible to each
runway end Provide taxiway run-up / holding bay areas for each runway end Have the most direct routes possible
20
Working Paper 3 Facility Requirements
Montgomery-Gibbs Executive Airport Master Plan
Have adequate curve and fillet radii Avoid areas where ground congestion may occur
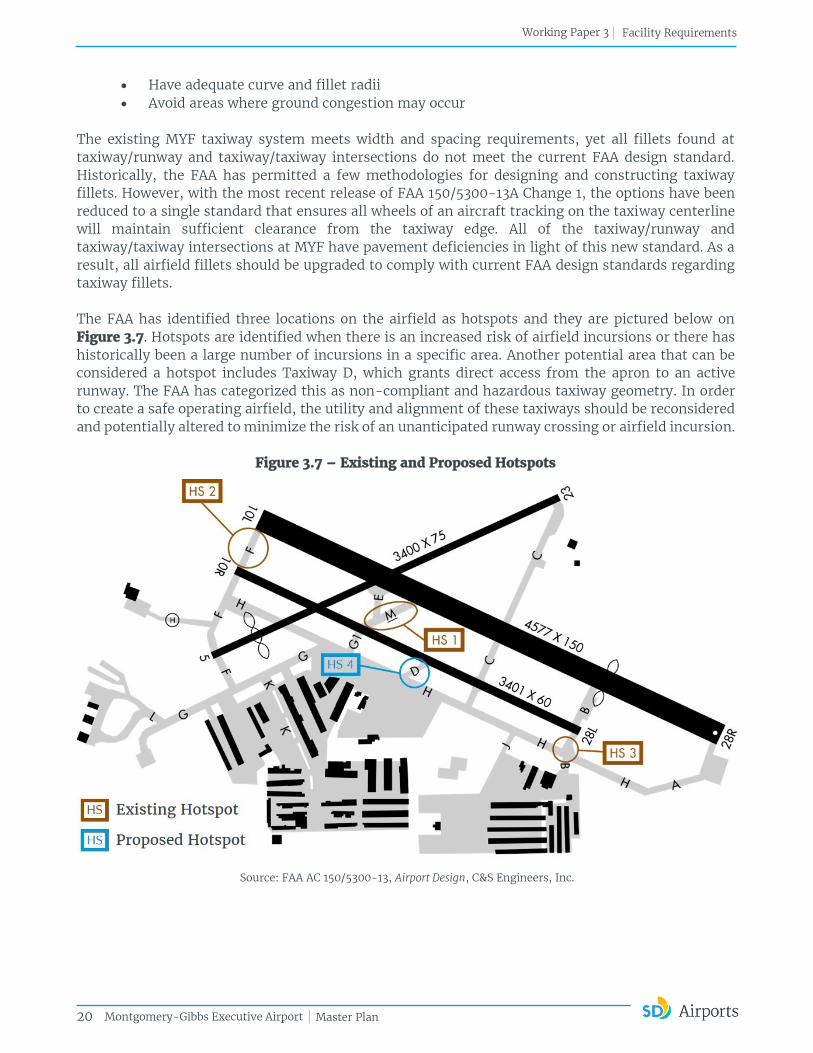
The existing MYF taxiway system meets width and spacing requirements, yet all fillets found at taxiway/runway and taxiway/taxiway intersections do not meet the current FAA design standard. Historically, the FAA has permitted a few methodologies for designing and constructing taxiway fillets. However, with the most recent release of FAA 150/5300-13A Change 1, the options have been reduced to a single standard that ensures all wheels of an aircraft tracking on the taxiway centerline will maintain sufficient clearance from the taxiway edge. All of the taxiway/runway and taxiway/taxiway intersections at MYF have pavement deficiencies in light of this new standard. As a result, all airfield fillets should be upgraded to comply with current FAA design standards regarding taxiway fillets. The FAA has identified three locations on the airfield as hotspots and they are pictured below on Figure 3.7. Hotspots are identified when there is an increased risk of airfield incursions or there has historically been a large number of incursions in a specific area. Another potential area that can be considered a hotspot includes Taxiway D, which grants direct access from the apron to an active runway. The FAA has categorized this as non-compliant and hazardous taxiway geometry. In order to create a safe operating airfield, the utility and alignment of these taxiways should be reconsidered and potentially altered to minimize the risk of an unanticipated runway crossing or airfield incursion.
Figure 3.7 – Existing and Proposed Hotspots
Source: FAA AC 150/5300-13, Airport Design, C&S Engineers, Inc.
21
Working Paper 3 Facility Requirements
Montgomery-Gibbs Executive Airport Master Plan
Full Length Parallel Taxiway Currently, only Runway 10R/28L has a full-length parallel taxiway. Runway 10L/28R can be seen as the primary runway due to its IFR capabilities on Runway 28R and its larger weight bearing characteristics. Aircraft need to ultimately cross Runway 10R/28L in order to reach the airfield’s primary apron. This can possibly cause delay and congestion due to the necessary holding before crossing said runway. As stated previously, it is preferable to have a full-length parallel taxiway to accommodate every active runway on the airfield. This is to keep traffic flow from becoming congested in any single location and to ultimately increase the Airport’s capacity and minimize delays.
Aircraft Run Up Areas At MYF, there are currently two designated aircraft run up areas and two additional areas that are utilized as such. These are used by pilots to preform pre-takeoff procedures including instrument and engine performance checks as well as to hold while waiting for clearance from ATC. Ideally they should be designed to provide a clearly marked area for pilots to park that will keep their aircraft clear of the active taxiway. The designated run up areas are located south of the Runway 28R end on Taxiway A, and south of the Runway 10R end at the intersection of Taxiway F and Taxiway H. The other locations used as run up areas are found south of the Runway 23 end on Taxiway C, and south of the Runway 28L end on Taxiway B. Ideally, run up areas are located at the runway ends directly off the taxiway and clear of any protected runway or taxiway areas. General design of holding bays include assured wingtip clearance of established critical aircraft, and proper markings to guide pilots safely. Markings should be labeled to have a specified area where aircraft can turn within the holding bays to not line up nose to tail with other aircraft. This will allow for aircraft to easily enter and exit the holding bay without interfering with other aircraft in the same holding bay. The existing run up areas at MYF have several deficiencies. Both of the designated run up areas lack the proper markings to guide aircraft in and out. The boundaries to the area south of 28R should be adjusted to clear the Taxiway A TOFA, and the boundaries of the area south of the Runway 10R end should be adjusted to remain clear of the Runway 5/23 Runway Obstacle Free Zone. Additionally, the two other areas mentioned above that are being used as run up areas, should cease to be used for this purpose until widening the area as both of them lack sufficient depth to clear the TOFA. During the upcoming Alternatives Development Working Paper, any proposed hold bay modifications aim to meet the following criteria:
Markings should be placed to direct aircraft to turn perpendicular or angled to the taxiway, which will create independent standing areas so aircraft can enter and exit at ease and avoid prop wash during run up, and ensure proper wingtip clearance.
Pavement area should be increased to address capacity issues and ensure proper hold bay depth.
Identify additional hold bay locations to maximize run up area availability for each runway end.

22
Working Paper 3 Facility Requirements
Montgomery-Gibbs Executive Airport Master Plan
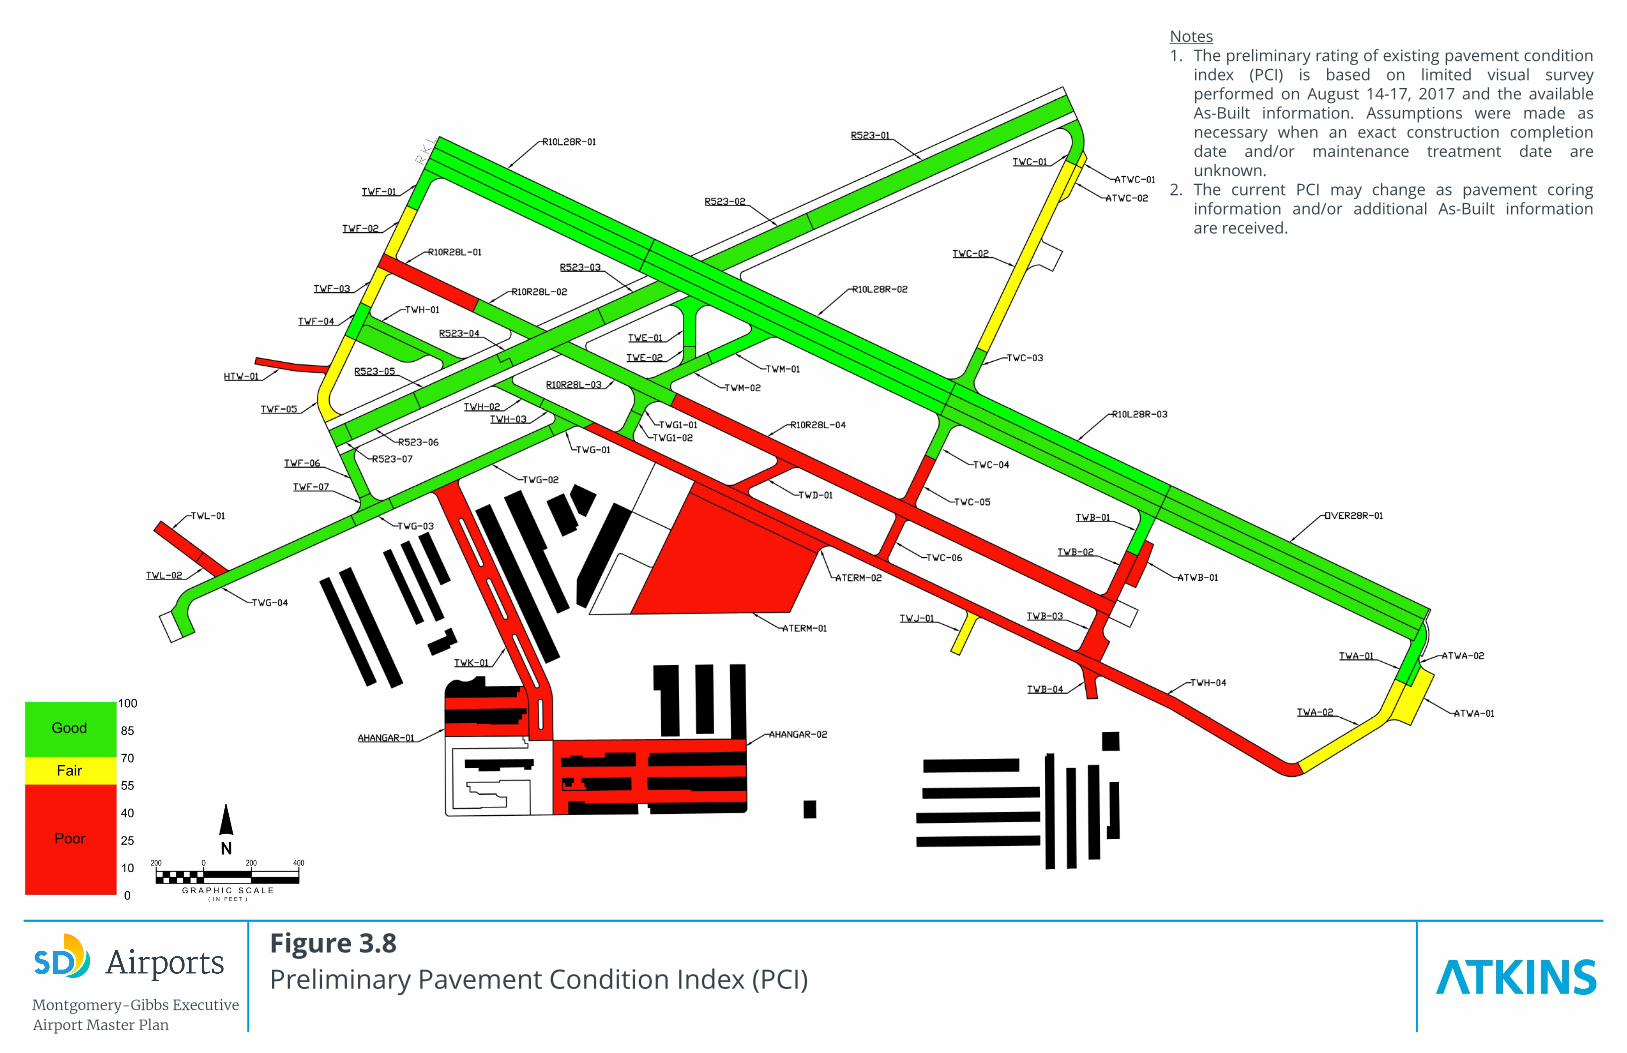
Airfield Pavement An airfield pavement condition analysis is being conducted as part of the Pavement Maintenance Management Plan currently underway at MYF. The intent of this study is to present comprehensive classifications for all airfield pavement sections utilizing the industry standard Pavement Condition Index (PCI) metric. In this method, pavement sections are inspected for distress types and their severities. The inspection data is evaluated to determine the PCI of the pavement. Pavement is then classified using its PCI in categories of good, fair, or poor. Given that the Pavement Maintenance Management Plan is currently underway, only preliminary PCI information is available for MYF. The following pavement condition findings depicted in Figure 3.8 are preliminary in nature, and it is anticipated they will be updated and refined as the Pavement Maintenance Management Plan is finalized. It is recommended during capital improvement program development efforts that pavement condition be utilized as a factor in prioritizing future pavement rehabilitation projects. Table 3.16, lists the pavement sections that have been classified as having a “fair” or “poor” condition in the preliminary Pavement Investigation Study findings.
Runway Pavement The initial data for the on-going pavement condition analysis shows that portions of Runway 10R-28L has been classified as having a “poor” PCI rating. The sections include Runway 28L end to Taxiway M.
Taxiway Pavement The initial data for the on-going Pavement Maintenance Management Plan shows that portions of the taxiway pavement are currently in need of rehabilitation. The specific sections of taxiway pavement that has been classified as “poor” condition is as follows:
Taxiway H: From the connection of Taxiway A to Taxiway G Taxiway B: In between Runway 28L end and Taxiway A. As well as half way starting at the
Runway 28L end and proceeding towards Runway 10L-28R Taxiway D: All of Taxiway D Taxiway C: All the pavement between Taxiway A and Runway 10R-28L. As well as starting
at Runway 10R-28L and proceeding halfway towards Runway 10L-28R Taxiway L: All of Taxiway L Taxiway K: All of Taxiway K Helicopter Taxiway: All pavement
MYF Template
Montgomery-Gibbs Executive
Airport Master Plan
Figure 3.8
Preliminary Pavement Condition Index (PCI)
Notes1. The preliminary rating of existing pavement condition
index (PCI) is based on limited visual surveyperformed on August 14-17, 2017 and the availableAs-Built information. Assumptions were made asnecessary when an exact construction completiondate and/or maintenance treatment date areunknown.
2. The current PCI may change as pavement coringinformation and/or additional As-Built informationare received.
24
Working Paper 3 Facility Requirements
Montgomery-Gibbs Executive Airport Master Plan
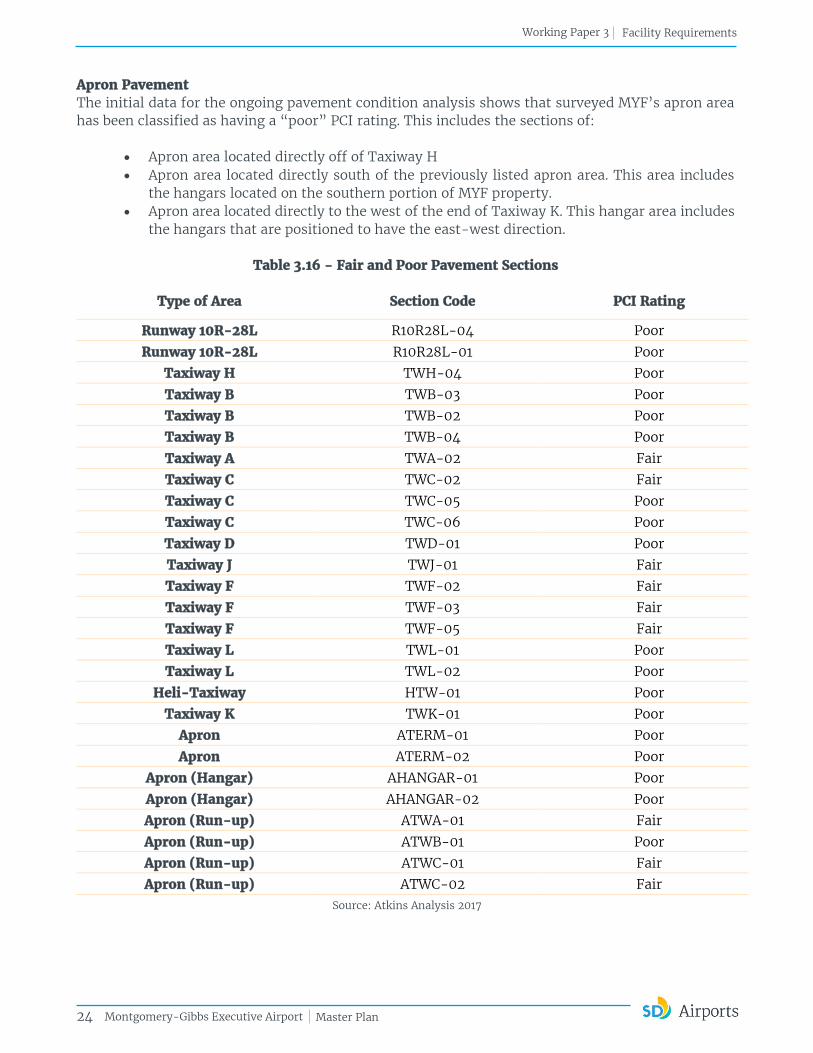
Apron Pavement The initial data for the ongoing pavement condition analysis shows that surveyed MYF’s apron area has been classified as having a “poor” PCI rating. This includes the sections of:
Apron area located directly off of Taxiway H Apron area located directly south of the previously listed apron area. This area includes
the hangars located on the southern portion of MYF property. Apron area located directly to the west of the end of Taxiway K. This hangar area includes
the hangars that are positioned to have the east-west direction.
Table 3.16 - Fair and Poor Pavement Sections
Type of Area Section Code PCI Rating
Runway 10R-28L R10R28L-04 Poor
Runway 10R-28L R10R28L-01 Poor
Taxiway H TWH-04 Poor
Taxiway B TWB-03 Poor
Taxiway B TWB-02 Poor
Taxiway B TWB-04 Poor
Taxiway A TWA-02 Fair
Taxiway C TWC-02 Fair
Taxiway C TWC-05 Poor
Taxiway C TWC-06 Poor
Taxiway D TWD-01 Poor
Taxiway J TWJ-01 Fair
Taxiway F TWF-02 Fair
Taxiway F TWF-03 Fair
Taxiway F TWF-05 Fair
Taxiway L TWL-01 Poor
Taxiway L TWL-02 Poor
Heli-Taxiway HTW-01 Poor
Taxiway K TWK-01 Poor
Apron ATERM-01 Poor
Apron ATERM-02 Poor
Apron (Hangar) AHANGAR-01 Poor
Apron (Hangar) AHANGAR-02 Poor
Apron (Run-up) ATWA-01 Fair
Apron (Run-up) ATWB-01 Poor
Apron (Run-up) ATWC-01 Fair
Apron (Run-up) ATWC-02 Fair Source: Atkins Analysis 2017
25
Working Paper 3 Facility Requirements
Montgomery-Gibbs Executive Airport Master Plan
Airfield Lighting
Working Paper 1 – Inventory, Surveys, & Data Collection, describes the existing condition of airfield lighting equipment at MYF. Currently, MYF has appropriate lighting equipment including a Medium Intensity Approach Lighting System (MALSR), Runway End Identifier Lights (REIL), and Runway and Taxiway Edge Lighting where required. Therefore, no major lighting deficiencies currently exist at MYF. However, lighting will be analyzed in the upcoming alternatives analysis when making any proposed improvements to instrument approach minima. Finally, future any improvements to or implementation of lighting equipment should feature LED technologies where able and when practical.
Signage
Working Paper 1 – Inventory, Surveys, & Data Collection, describes existing conditions of airfield signage at MYF. While no specific recommendations for signage improvement are identified, airfield signage should be expanded and updated as necessary in conjunction with any airfield improvement projects.
Airfield Marking
Working Paper 1 – Inventory, Surveys, & Data Collection, describes existing conditions of airfield markings at MYF. While no specific recommendations for marking improvements are identified, airfield markings should be expanded and updated as necessary in conjunction with any airfield improvement projects.
3.5 Landside Facility Requirements
The planning of landside facilities is based on both airside and landside capacity. The requirements for terminal and support area facilities has been determined for the 20-year planning period. The principal operating elements covered under these analyses for general aviation requirements include:
Taxilanes Aircraft Hangars Aircraft Parking Apron Fueling Facilities Terminal/Airport Administration Building Support Facilities Perimeter/Security Fencing and Access Gates Utilities Vehicle Access and Parking Land Use
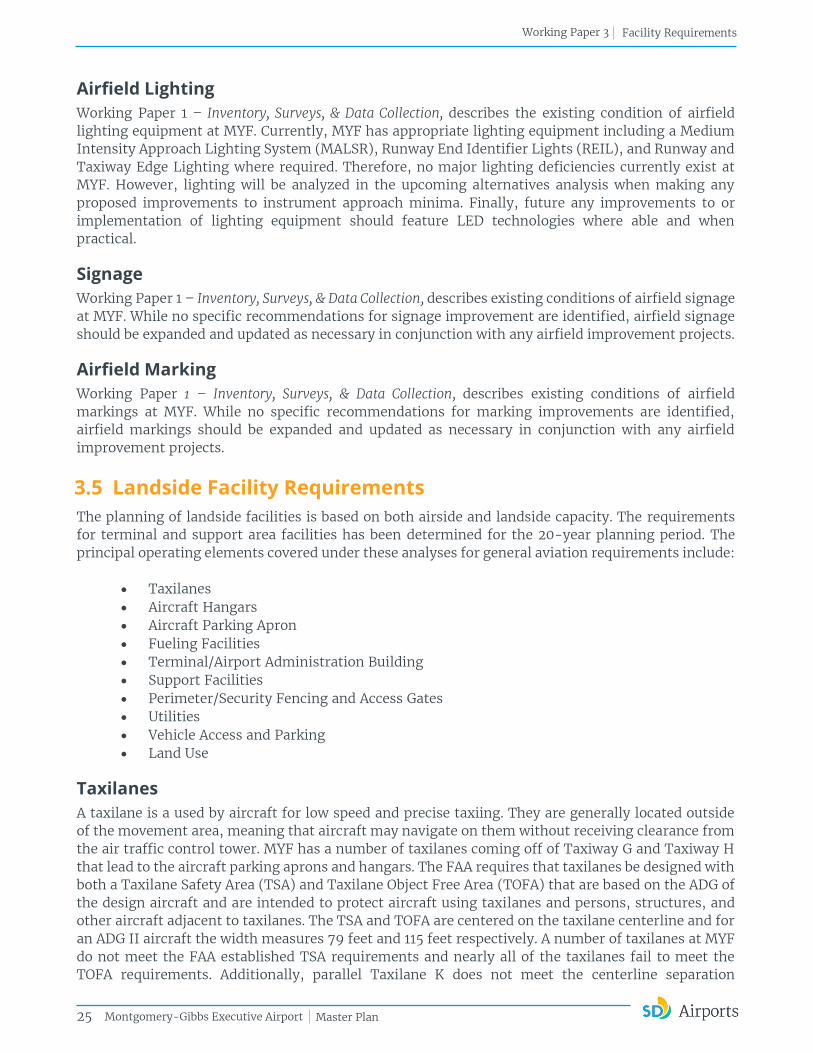
Taxilanes
A taxilane is a used by aircraft for low speed and precise taxiing. They are generally located outside of the movement area, meaning that aircraft may navigate on them without receiving clearance from the air traffic control tower. MYF has a number of taxilanes coming off of Taxiway G and Taxiway H that lead to the aircraft parking aprons and hangars. The FAA requires that taxilanes be designed with both a Taxilane Safety Area (TSA) and Taxilane Object Free Area (TOFA) that are based on the ADG of the design aircraft and are intended to protect aircraft using taxilanes and persons, structures, and other aircraft adjacent to taxilanes. The TSA and TOFA are centered on the taxilane centerline and for an ADG II aircraft the width measures 79 feet and 115 feet respectively. A number of taxilanes at MYF do not meet the FAA established TSA requirements and nearly all of the taxilanes fail to meet the TOFA requirements. Additionally, parallel Taxilane K does not meet the centerline separation
26
Working Paper 3 Facility Requirements
Montgomery-Gibbs Executive Airport Master Plan
requirement of 97 feet. General aviation airports often do not meet the full FAA design standards in regards to taxilane safety areas as they are frequently designed with hangar rows and taxilanes that are specifically intended for use by an aircraft significantly smaller than the design aircraft. Additionally, the FAA will often allow non-compliant taxilanes to remain, but will require full compliance on any newly constructed taxilanes that accept FAA funding. While it may not be necessary to correct all of the TSA and TOFA issues, the feasibility of this action and the impact it would have on Airport circulation and capacity are discussed in Working Paper 4 – Alternatives Development, Evaluation, and Selection.
Aircraft Hangars
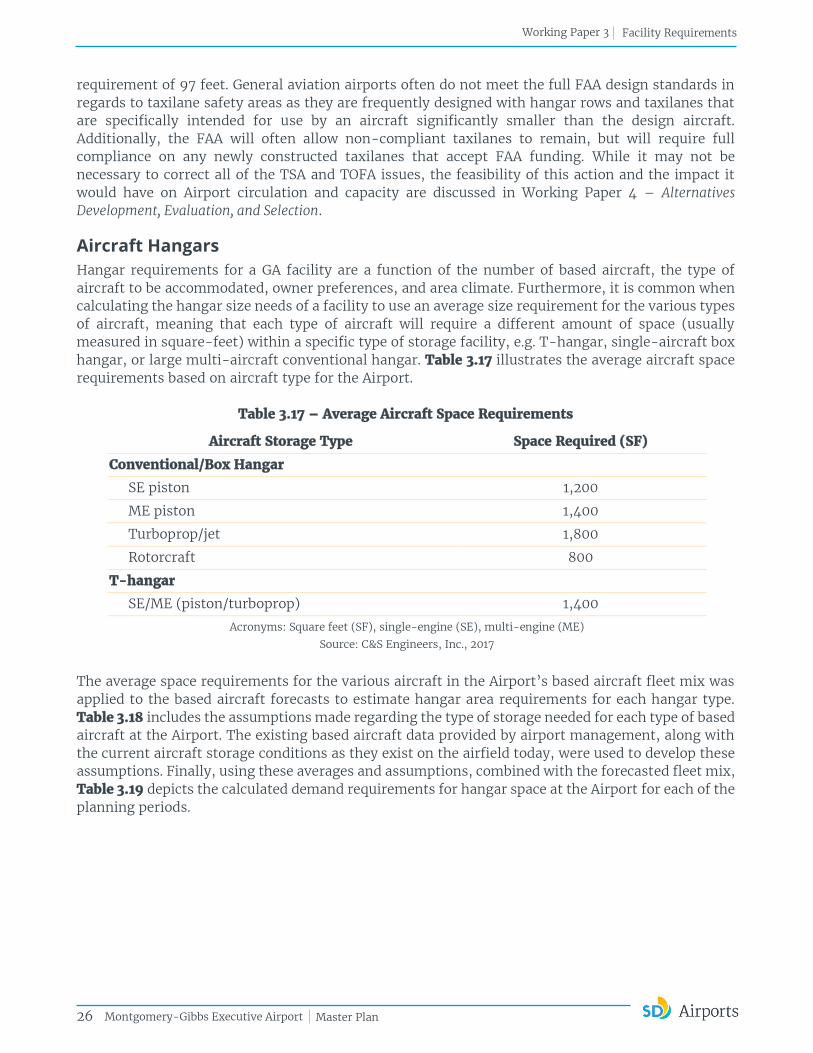
Hangar requirements for a GA facility are a function of the number of based aircraft, the type of aircraft to be accommodated, owner preferences, and area climate. Furthermore, it is common when calculating the hangar size needs of a facility to use an average size requirement for the various types of aircraft, meaning that each type of aircraft will require a different amount of space (usually measured in square-feet) within a specific type of storage facility, e.g. T-hangar, single-aircraft box hangar, or large multi-aircraft conventional hangar. Table 3.17 illustrates the average aircraft space requirements based on aircraft type for the Airport.
Table 3.17 – Average Aircraft Space Requirements
Aircraft Storage Type Space Required (SF)
Conventional/Box Hangar
SE piston 1,200
ME piston 1,400
Turboprop/jet 1,800
Rotorcraft 800
T-hangar
SE/ME (piston/turboprop) 1,400
Acronyms: Square feet (SF), single-engine (SE), multi-engine (ME)
Source: C&S Engineers, Inc., 2017
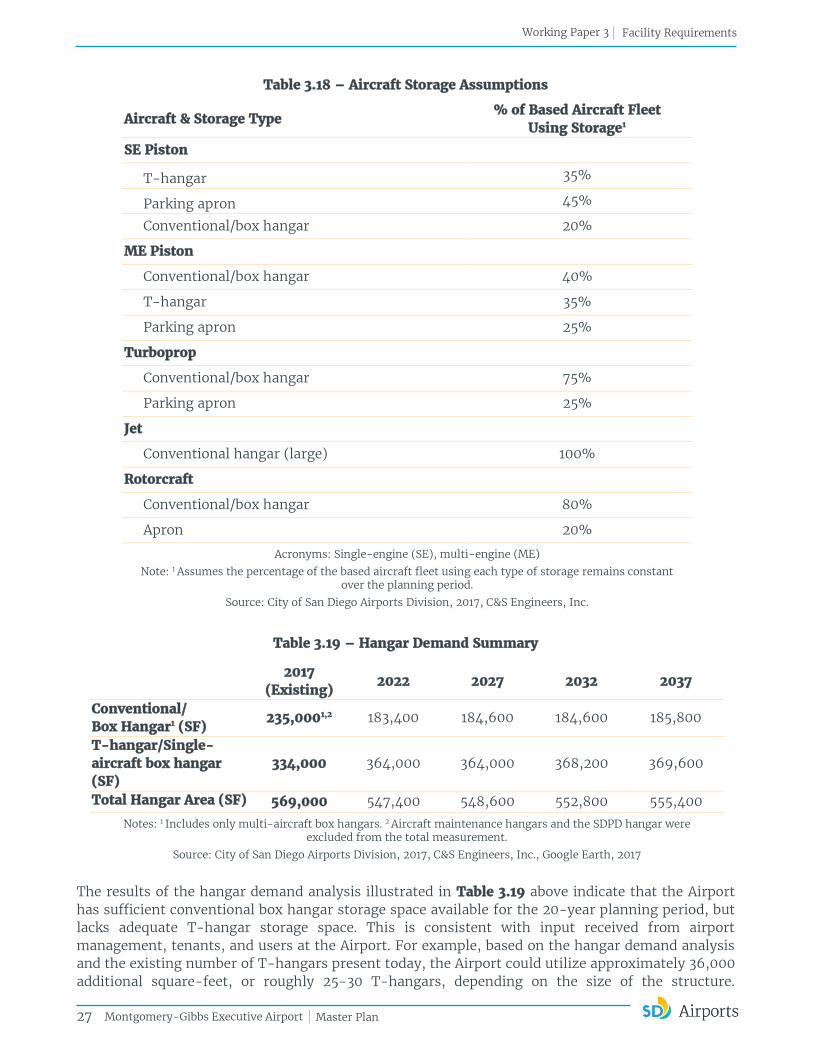
The average space requirements for the various aircraft in the Airport’s based aircraft fleet mix was applied to the based aircraft forecasts to estimate hangar area requirements for each hangar type. Table 3.18 includes the assumptions made regarding the type of storage needed for each type of based aircraft at the Airport. The existing based aircraft data provided by airport management, along with the current aircraft storage conditions as they exist on the airfield today, were used to develop these assumptions. Finally, using these averages and assumptions, combined with the forecasted fleet mix, Table 3.19 depicts the calculated demand requirements for hangar space at the Airport for each of the planning periods.
27
Working Paper 3 Facility Requirements
Montgomery-Gibbs Executive Airport Master Plan
Table 3.18 – Aircraft Storage Assumptions
Aircraft & Storage Type % of Based Aircraft Fleet
Using Storage1
SE Piston
T-hangar 35%
Parking apron 45%
Conventional/box hangar 20%
ME Piston
Conventional/box hangar 40%
T-hangar 35%
Parking apron 25%
Turboprop
Conventional/box hangar 75%
Parking apron 25%
Jet
Conventional hangar (large) 100%
Rotorcraft
Conventional/box hangar 80%
Apron 20%
Acronyms: Single-engine (SE), multi-engine (ME)
Note: 1 Assumes the percentage of the based aircraft fleet using each type of storage remains constant over the planning period.
Source: City of San Diego Airports Division, 2017, C&S Engineers, Inc.
Table 3.19 – Hangar Demand Summary
2017 (Existing)
2022 2027 2032 2037
Conventional/ Box Hangar1 (SF)
235,0001,2 183,400 184,600 184,600 185,800
T-hangar/Single-aircraft box hangar (SF)
334,000 364,000 364,000 368,200 369,600
Total Hangar Area (SF) 569,000 547,400 548,600 552,800 555,400
Notes: 1 Includes only multi-aircraft box hangars. 2 Aircraft maintenance hangars and the SDPD hangar were excluded from the total measurement.
Source: City of San Diego Airports Division, 2017, C&S Engineers, Inc., Google Earth, 2017
The results of the hangar demand analysis illustrated in Table 3.19 above indicate that the Airport has sufficient conventional box hangar storage space available for the 20-year planning period, but lacks adequate T-hangar storage space. This is consistent with input received from airport management, tenants, and users at the Airport. For example, based on the hangar demand analysis and the existing number of T-hangars present today, the Airport could utilize approximately 36,000 additional square-feet, or roughly 25-30 T-hangars, depending on the size of the structure.

28
Working Paper 3 Facility Requirements
Montgomery-Gibbs Executive Airport Master Plan
Therefore, recommendations for the number and location of additional T-hangars will be explored during the Alternatives Development analysis and ultimately displayed on the Airport Layout Plan (ALP). It is important to note that hangars of all types are not normally eligible for FAA Airport Improvement Plan (AIP) funding, and therefore are usually funded by the sponsor, private investor, or a combination thereof. Thus, it is also recommended that the City continue to monitor the actual demand for hangars at the Airport, and make adjustments in the types and number of hangars as needed over the course of the planning horizon.
Aircraft Parking Apron
Multiple aircraft parking areas are also located at the Airport. In order to identify the required parking space needed for based aircraft not stored in a hangar, as well as transient aircraft requiring temporary parking, a demand analysis was conducted. Transient aircraft are those that are visiting an airport on a temporary basis and do not remain at an airport for an extended period. Areas designated for the parking of transient aircraft are usually identified as "itinerant aprons.” There are approximately 260 designated paved parking spaces available for based and transient aircraft on a total of approximately 60,000 square yards of aircraft parking apron at the Airport, the majority of which is reserved for based aircraft. Figure 3.9 depicts the designated itinerant and based aprons at MYF. The paved parking area requirements calculated utilized an average of 200 square yards per based aircraft and 400 square yards per itinerant aircraft. Table 3.18 in the preceding section illustrates the assumptions made for calculating the based aircraft that require apron parking or tie-down space. Table 3.20 summarizes the based and transient aircraft apron needs for the 20-year planning period at the Airport.
Table 3.20 – Apron Area Demand Summary
Existing Area (SY)1 Estimate of Apron Area Needed (SY)
2022 2027 2032 2037 Itinerant Apron 20,000 38,000 38,800 40,000 41,200
Based Apron 40,000 40,200 40,400 40,600 40,600
Total Apron 60,000 78,200 79,200 80,600 81,800
Note: 1 Existing apron areas were measured using aerial imagery and are approximate; taxilanes were not included in the measurements of the parking apron.
Source: City of San Diego Airports Division, C&S Engineers, Inc., Google Earth, 2017
The results of the apron area demand analysis indicate that the Airport is in need of both itinerant and based aircraft apron area over the course of the 20-year planning period and is consistent with reports by Airport management, flight schools, fixed base operators (FBOs), and other tenants. The based aircraft apron is nearly at capacity, or depending on the location on the airfield, at capacity. Currently, 56 of the total based aircraft on the airfield are operated by the six flight schools located at the Airport. Furthermore, 45 out of the 56 flight school aircraft, or 80 percent, are parked on the based aircraft aprons. Should any of the flight schools expand in the future, adequate space to park an additional aircraft will become more difficult. In addition, during peak activity periods for the FBOs, adequate temporary parking space for some of the larger, transient turbine aircraft, is difficult. The majority of the transient apron parking is located adjacent to the terminal building and the Crownair FBO on the south side of the airfield. Overflow of based aircraft parking has begun to encroach upon the limited transient apron parking available for the Airport. This also makes it increasingly more difficult for transient visitors to temporarily park their aircraft in a convenient location, such as in front of the terminal building in the designated transient/visitor parking area.

Gibbs Dr.
Aero Dr.
Jo
hn
J M
on
tg
om
ery D
r.
Glen
n H
C
urtiss R
d.
Gibbs Flying Service
National Air College
Crownair
Marigold
Spots
Coast
Aircraft
Flattop
West
Flattop
East
Montgomery-Gibbs ExecutiveAirport Master Plan
Figure 3.9Apron Area Measurements
400'0' 200'200'
Itinerant Apron
±16,000 SY.
Based Aircraft Apron
± 40,000 SY.

30
Working Paper 3 Facility Requirements
Montgomery-Gibbs Executive Airport Master Plan
The forecasted aviation activity is the basis for the additional itinerant and based aircraft parking apron space at the Airport. For example, the itinerant apron requirements were determined using the forecasted design hour operations and the projected level of itinerant aircraft utilization during the busiest hour of an average day in the peak month. Likewise, determining the based aircraft apron requirements involved applying the forecasted based aircraft and the likely percentages of those based aircraft utilizing apron parking versus hangar parking. Both the design hour operations and the based aircraft are forecasted to grow conservatively during the planning period, which is reflected in the total additional apron needed. Furthermore, both calculations use assumptions that may change depending on actual activity at the Airport. The Airport should plan to add approximately 22,000 – 25,000 square yards of aircraft parking apron area over the course of the 20-year planning period, but should also realize this amount will depend on actual aviation activity and demand at the Airport. Therefore, this number may need to be adjusted accordingly. The most beneficial and logical locations for additional aircraft parking apron at the Airport will be identified in the Alternatives Development Working Paper in this study.
Fueling Facilities
As previously discussed in Working Paper 1 – Inventory, Surveys, & Data Collection, between the two FBOs at the Airport, a total of 32,000 gallons of Jet A and 100LL fuel are stored within four underground tanks. Furthermore, an additional total of 11,000 gallons of Jet A and 3,800 gallons of 100LL contained within nine fuel trucks is available for fueling aircraft. This totals 43,000 gallons of Jet A and 35,800 gallons of 100LL Avgas fuel available at the Airport at full capacity. A review of the fuel sales data from 2011-2016 indicates that the FBOs sell on average approximately 20,000 gallons of Jet A and 13,000 gallons of Avgas on a weekly basis. Thus, the existing aircraft fueling facilities at the Airport appear to be adequate for existing demand. However, it is likely that the fueling capacity at the Airport may need to increase, especially for 100LL fuel, to accommodate future demand. Airport management indicates that the underground fuel storage tanks and their various components are in fair condition, although the entire system is inspected and serviced as required on a regular basis. Management also indicated that there has been interest in possibly constructing a central fuel farm that would be accessible to all fueling trucks on the airfield. Should this concept move forward, potential locations of an above ground central fuel farm and its logistics would be further explored in the Alternatives Development Working Paper of the Master Plan.
Terminal/Airport Administration Building
The terminal building at the Airport is a multi-functional building. It has undergone several updates since its original construction in 1969; the most recent occurred in 2016. The building is approximately 10,000 square-feet in size. The methodology used to determine the terminal building facility requirements for general aviation airports is based on the number of airport users anticipated to use the facility during the design hour operations. The design hour is defined as the peak hour of an average day of the peak month. The design hour can be used to determine the number of passengers and pilots departing or arriving on an aircraft in an elapsed hour of a typical busy day (design day). In the case of MYF, given that the design hour operations measure the activities for the Airport as a whole, this methodology may not reflect the most accurate way to calculate the size requirements of the facility; the reasoning is the flight school and FBO customers do not routinely use the terminal building. Therefore, a modified design hour derived from the total itinerant operations during the peak month was calculated for the Airport over the course of the planning period.

31
Working Paper 3 Facility Requirements
Montgomery-Gibbs Executive Airport Master Plan
In order to accommodate the peak-hour traffic and to determine the building size requirements, conventional planning practices use a factor of 2.5 people (passengers and pilots) per peak-hour (design hour) and an average area of 150 square-feet of space per person for airports similar in size and activity as MYF. For MYF, applying these standards to the modified itinerant operations design hour produced the terminal size requirements for each planning period. Additionally, combining the square-footage of the City’s terminal building and the shared public space of the FBOs produced the total “terminal” space available at the Airport today. The logic being that the majority of GA itinerant users are likely to use the FBOs over the City terminal; thus, the FBO shared public space in fact adds to the overall “terminal” space at the Airport, even though the space is located in physically different locations. The existing terminal space combined with the existing FBOs’ common shared space today totals approximately 16,60o square-feet. Table 3.21 summarizes the GA terminal requirements for MYF using the methodologies described herein.
Table 3.21 – General Aviation Terminal Space Requirements
Year Itinerant Design Hour
Operations1
Peak-Hour Pilot & Passengers
Terminal Size Required (Approx. SF)
2017 55 138 16,6002
20,7003
2022 57 143 21,450 2027 58 145 21,750 2032 60 150 22,500 2037 61 153 22,950
Notes: 1 Assumes that the total itinerant operations remain 51 percent of the total operations throughout the planning period. 2 Existing total square-footage of MYF terminal building and the FBOs’ shared common areas is 16,600 SF (10,000 SF
+ 6,600 SF). 3 The calculated terminal size required using the existing itinerant design hour and peak-hour pilot and passenger factor.
Source: City of San Diego Airports Division, C&S Engineers, Inc.
According to the calculated requirements above, the existing 10,000-square foot terminal building does not meet the space requirements either by itself or with the combined shared space from the two FBOs on the airfield through the planning period. In fact, the 2017 data indicates that the Airport presently is short on space by approximately 4,100 square-feet (20,700 recommended square-feet minus 16,600 actual square-feet). Although the terminal building appears to be in overall good condition, it is somewhat dated. Airport management reports that typical energy and water efficiency improvements are needed, such as mechanical, electrical, and plumbing upgrades. Thus, the Alternatives Development Working Paper will consider various terminal concepts and will present additional recommendations such as size and potential locations for a new airport terminal building.

32
Working Paper 3 Facility Requirements
Montgomery-Gibbs Executive Airport Master Plan
Support Facilities
ARFF & Other Emergency Services Although MYF is not required to provide aircraft rescue and firefighting (ARFF) services as per 14 CFR Part 139 certificated airport (airports that serve scheduled and unscheduled air carriers), as previously mentioned, the Airport does have an agreement with Fire Station 28 located adjacent to airport property to provide assistance for both fire and emergency medical services as needed. FAA AC 150/5210-6D, Aircraft Fire and Rescue Facilities and Extinguisher Agents, recommends general aviation airports have 190-gallons of aqueous film forming foam (AFFF) supplemented with 300-pounds of dry chemical, in addition to aviation rated fire extinguishers immediately available in the vicinity of the aircraft apron and fueling facilities. Thus, it is recommended that the City continue its agreement with the local Station 28 as long as they are able to provide the recommended minimum protection as outlined above.
City Maintenance and Equipment Building The existing City maintenance garage is located adjacent to the Crownair line service building just south of Taxiway H. The building measures approximately 1,400-square feet and is in fair condition. Typical items stored here for airport operations and maintenance personnel include tools, janitorial supplies, airfield equipment such as the foreign object debris (FOD) Boss, signs, lighting, and other aviation and employee related equipment. Although the building adequately serves the storage needs of the airport today, the City has expressed concerns with its size as growth continues at the Airport. As part of Crownair’s redevelopment plan, a dedicated 3,600-sqaure foot space has been allocated for the City’s use as a new operations and maintenance garage. As such, this dedicated space will be carried forward into the Alternatives Development Working Paper, and the proposed location, and possibly alternative locations, will be further reviewed in later sections of this report.
Airfield Electrical Vault As noted in Working Paper 1 – Inventory, Surveys, & Data Collection, the airfield electrical vault is located just north of the Administration building and is in good condition. The current size of the building and the equipment inside are adequate to meet the Airport’s current demand. However, the City should continue to monitor and maintain the equipment and replace as needed.
Airport Traffic Control Tower The FAA currently maintains and operates the ATCT located on the northeast corner of the airfield. Although the structure itself is outdated, it remains functional. The ATCT is currently 470 feet above mean sea level (MSL); verification of the line-of-sight requirements as outlined in FAA Order 6480.4A, Airport Traffic Control Tower Siting Criteria will occur once the aerial survey is complete. The ATCT is anticipated to remain in its current location over the course of the planning period.
Perimeter/Security Fencing and Access Gates
The primary function of airport fencing is to restrict inadvertent and intentional unauthorized entry to the Airport by unauthorized individuals or wildlife. As mentioned above, MYF is not a 14 CFR Part 139 certificated airport, and therefore does not require any security measures; however, at a minimum, most general aviation airports usually maintain some type of perimeter fencing, especially when located in busy urban areas. The Airport currently has fencing and access control measures in place that provide a layer of security and safety for its users and the public. Overall, the eight-foot high, galvanized chain-link perimeter fencing is in good condition; the majority of it replaced in 2001 funded through an FAA grant. However, a portion of the fencing near the Spiders-Sorbi hangars is only four feet high, and one recommendation is to replace this fencing with eight-foot high fencing in the short-term planning period. Furthermore, according to airport management, there is some erosion under the fencing on the north side of the airport, which may inadvertently allow wildlife to

33
Working Paper 3 Facility Requirements
Montgomery-Gibbs Executive Airport Master Plan
access the airfield. Aside from continued monitoring of the area, a Wildlife Hazard Assessment (WHA) is recommended to be completed. Among other valuable findings, a WHA will be able to inform the Airport where vulnerabilities are present in the perimeter fencing that allows wildlife to breach the perimeter and suggest measures to correct or prevent future breaches. The Environmental Baseline element of this report provides a more in-depth description of the WHA and its benefits.
Utilities
The current capacity for all utilities discussed in the Inventory element is adequate for present day demands. However, future development may require additional electrical or water capacity to meet the power needs of the operation or to meet fire codes (usually for new hangar developments). As such, during the planning phase of all future proposed development, coordination with the local utility providers should occur to insure sufficient capacity exists. Furthermore, to determine the adequacy of the existing infrastructure at MYF, it is recommended that a general utility study be performed to gauge the Airport’s current systems, which in turn should assist in estimating the future utility demands needed to support the proposed future development contained in this Master Plan update.
Vehicle Access and Parking
Vehicle Access Vehicular traffic accounts for the majority of congestion during peak business hours on Aero Drive, Balboa Avenue, Clairemont Mesa Boulevard, and Convoy Street, the major roadways in the immediate area of the Airport. Although multiple street improvements have been proposed under the 2011 Kearny Mesa Community Plan, there is no immediate need to reduce congestion surrounding MYF. Additionally, in the early stages of the Airport Multimodal Accessibility Plan (AMAP), the surrounding roadways near MYF were considered for potential ground access improvements. However, due to constraints (runway expansion, environmental, etc.) further research into the potential for ground access improvements were deemed unnecessary to the study. Additional concerns regarding vehicle access around the Airport that may arise from community input will be further examined in the Alternatives Development.
Vehicle Parking The Airport has numerous vehicle parking lots available, both to the public and for its based aircraft users and business tenants. From discussions with Airport management, the vehicle parking provided for based aircraft users and business tenants is adequate at this time; based aircraft owners normally park their vehicles in their hangar or tie-down space when using their aircraft, and designated employee and tenant parking is available near the FBOs and other major businesses on the airfield. Parking needs for business tenants and based aircraft owners will be analyzed more as the various development alternatives are presented in subsequent portions of this report. Thus, provided here are calculations only for the public vehicle parking needs over the course of the 20-year planning period.
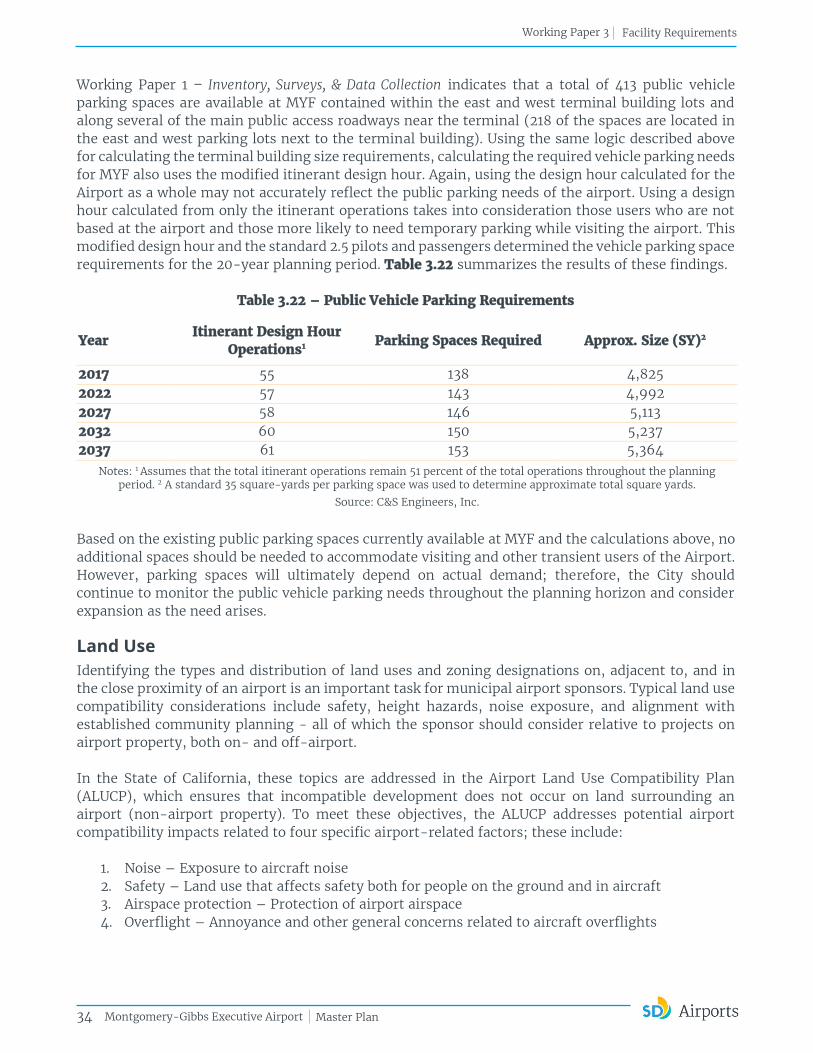
34
Working Paper 3 Facility Requirements
Montgomery-Gibbs Executive Airport Master Plan
Working Paper 1 – Inventory, Surveys, & Data Collection indicates that a total of 413 public vehicle parking spaces are available at MYF contained within the east and west terminal building lots and along several of the main public access roadways near the terminal (218 of the spaces are located in the east and west parking lots next to the terminal building). Using the same logic described above for calculating the terminal building size requirements, calculating the required vehicle parking needs for MYF also uses the modified itinerant design hour. Again, using the design hour calculated for the Airport as a whole may not accurately reflect the public parking needs of the airport. Using a design hour calculated from only the itinerant operations takes into consideration those users who are not based at the airport and those more likely to need temporary parking while visiting the airport. This modified design hour and the standard 2.5 pilots and passengers determined the vehicle parking space requirements for the 20-year planning period. Table 3.22 summarizes the results of these findings.
Table 3.22 – Public Vehicle Parking Requirements
Year Itinerant Design Hour
Operations1 Parking Spaces Required Approx. Size (SY)2
2017 55 138 4,825 2022 57 143 4,992 2027 58 146 5,113 2032 60 150 5,237 2037 61 153 5,364
Notes: 1 Assumes that the total itinerant operations remain 51 percent of the total operations throughout the planning period. 2 A standard 35 square-yards per parking space was used to determine approximate total square yards.
Source: C&S Engineers, Inc.
Based on the existing public parking spaces currently available at MYF and the calculations above, no additional spaces should be needed to accommodate visiting and other transient users of the Airport. However, parking spaces will ultimately depend on actual demand; therefore, the City should continue to monitor the public vehicle parking needs throughout the planning horizon and consider expansion as the need arises.
Land Use
Identifying the types and distribution of land uses and zoning designations on, adjacent to, and in the close proximity of an airport is an important task for municipal airport sponsors. Typical land use compatibility considerations include safety, height hazards, noise exposure, and alignment with established community planning - all of which the sponsor should consider relative to projects on airport property, both on- and off-airport. In the State of California, these topics are addressed in the Airport Land Use Compatibility Plan (ALUCP), which ensures that incompatible development does not occur on land surrounding an airport (non-airport property). To meet these objectives, the ALUCP addresses potential airport compatibility impacts related to four specific airport-related factors; these include:
1. Noise – Exposure to aircraft noise 2. Safety – Land use that affects safety both for people on the ground and in aircraft 3. Airspace protection – Protection of airport airspace 4. Overflight – Annoyance and other general concerns related to aircraft overflights
35
Working Paper 3 Facility Requirements
Montgomery-Gibbs Executive Airport Master Plan
The Airport’s current ALCUP was last amended in December 2010. Any proposed development surrounding the airport (not on airport property) would need to conform to the guidelines as outlined by the 2010 ALUCP. It is imperative that the Airport continue to work in conjunction with other City departments and the surrounding communities on controlling the land uses and development formats surrounding the Airport via zoning and other measures, such as avigation easements and airport overlay zones, in order to meet the ALUCP requirements. For example, The Kearny Mesa Community Plan designates the land use directly south of the airport property on the other side of Aero Drive as industrial and business parks and recommends that these areas maintain this designation. Recent development activity in the Kearny Mesa community has included mixed-use projects, which contribute to an increase in available housing and corresponding population, according to the forthcoming 2019 update to the Kearny Mesa Community Plan. The density of development surrounding MYF has increased over time, and it is important to continue joint efforts between the Airport and City officials to protect the Airport from incompatible land uses and obstructions. From an on-airport perspective, the City has expressed interest in exploring aeronautical and non-aeronautical uses for some areas of the airport property. Non-aeronautical land uses at the Airport are concentrated on both sides of Aero Drive, a high-volume road that connects traffic to Kearny Mesa’s extensive freeway network. The San Diego Police Department occupies a non-aeronautical property owned by the airport on the opposite side of Aero Drive to the southeast. According to the Kearny Mesa Community Plan, existing land uses surrounding the Airport consist primarily of industrial, office, and retail centers along the Aero Drive corridor. The Four Points by Sheraton Hotel is a non-aeronautical use located on MYF property adjacent to the Airport, at the intersection of Aero Drive and Kearny Villa Road. In 2015, the hotel’s operator filed for bankruptcy. Although the hotel is no longer in active bankruptcy as of 2017, the Airport is considering reacquiring portions of the existing leasehold, specifically parts of the golf course east of the hotel, to facilitate potential development on this site. This land is contiguous to a currently vacant [2.9 acres of non-aeronautical land use area] Airport-owned property at the forefront of Aero Drive and Glenn H Curtiss Rd. If reacquired, this land would enhance the site’s redevelopment potential by providing additional land area. Redevelopment options being considered by the City include both aeronautical and non-aeronautical uses. Figure 3.10 depicts non-aeronautical land uses on Airport property at the forefront of Aero Drive. In either case, the airport stands to benefit from redevelopment of the site: Aeronautical uses would potentially enhance revenues and/or improve the airport’s services, and non-aeronautical commercial development would provide supplemental ground lease revenues. The redevelopment site is located along the high-volume Aero Drive corridor, providing freeway access and visibility in an area that does not appear to offer many comparable development sites. Given these favorable site characteristics, further study is recommended to evaluate the site’s market potential for non-aeronautical commercial use, and to identify appropriate uses given site and market conditions. Environmental constraints may exist on the redevelopment site east of the hotel, potentially including hydrologic features that would require study under environmental review, prior to development. The Alternatives Development Working Paper will explore the aeronautical and non-aeronautical potential uses of this property, in which input from the PAC and City will ultimately determine how the property is designated on the ALP for future use.

Redevelopment
Area ± 2.9 Acres
The Four Points
by Sheraton Hotel
±19.7 Acres
Offices/Retail/Commercial Businesses
±6.4 Acres
K
e
a
r
n
y
V
i
l
l
a
R
d
.
Aero Dr.
Gibbs Dr.
Jo
hn
J
M
on
tg
om
ery
D
r.
Gle
nn
H
C
urtis
s R
d.
P
r
o
p
e
r
t
y
L
i
n
e
Property Line
Montgomery-Gibbs ExecutiveAirport Master Plan
Figure 3.10Non-Aeronautical Land Uses
400'0' 200'200'
37
Working Paper 3 Facility Requirements
Montgomery-Gibbs Executive Airport Master Plan
3.6 Advisory Committee Input
As with the previous two Working Papers, the Montgomery-Gibbs Executive Airport Public Advisory Committee (PAC) had the opportunity to review Working Paper No. 3 and provide comments to the project team during the third scheduled committee meeting held on October 16, 2017. Committee members provided several comments regarding both the airside and landside facility requirements presented within Working Paper No. 3. The more notable comments include the following:
Airside Facility Requirements Feedback
The main focus of the PAC’s comments regarding the airside component of the Airport had to do with the capacity of the airfield. It was agreed that any improvements that can potentially increase the efficiency of the existing runway system configuration to avoid bottlenecks should be evaluated. The capacity of the airfield is a key focus of the airside alternatives, and will be thoroughly examined within Working Paper 5. Although not defined as an airside facility, the noise monitoring system’s current condition was discussed, and a suggestion included making recommendations in the planning period to upgrade the system to ensure it accurately captures the aircraft noise generated at the Airport. Likewise, although the noise monitoring system may not be a part of any of the alternatives development directly, it will be included in the proposed airport capital improvement plan found later in this report.
Landside Facility Requirements Feedback
The main focus of the discussion on the landside component for the Airport revolved around hangars and the terminal facility. There was concern that some of the newer aircraft models have larger wingspans, and thus the existing T-hangars on-site may not accommodate them; a PAC member proposed the City look at adding more single-aircraft box hangars, and the majority of the committee concurred. Overall, PAC members agreed that the Airport is in need of a variety of additional hangar space over the course of the planning period in order to attract more pilots and aircraft to the Airport. Secondly, most PAC members agreed that the existing terminal facilities are in need of an upgrade. Possible amenities suggested for a future facility include larger restrooms with showers, a pilot’s lounge with computer and internet access, conference rooms, and rental car options. The outcome of the facility requirements indicated that the Airport is in need of additional T-hangars and a larger terminal facility within the 20-year planning period. Thus, all landside alternatives proposed in the subsequent Working Paper 5 will include recommended additions and improvements in these areas, and ultimately will be incorporated into the preferred alternative for the Airport Master Plan.
Summary
This phase of the AMP captured the required facility requirements as a result of the Airport’s existing conditions and its projected aviation demand over the course of the 20-year planning period. Input from the FAA, AMP Advisory Committee, and the public is a vital component in this process. Under Working Paper 5 - Alternatives Development, Evaluation and Selection; various airside, airfield, and landside improvements will be presented for evaluation. After further review and input from airport stakeholders and the surrounding community, a recommended preferred alternative for the Airport’s airside and landside improvements will be proposed for further evaluation.