working paper dipartimento di economia pubblica … · working paper dipartimento di economia...
TRANSCRIPT

1
WORKING PAPER DIPARTIMENTO DI ECONOMIA PUBBLICA
Working Paper n. 158
Eleonora Cavallaro, Piero Esposito, Alessia Matano and Marcella Mulino
Technological catching up, quality of exports and competitiveness: a
sectoral perspective
Roma, Novembre 2012

2
Technological catching up, quality of exports and competitiveness:
a sectoral perspective
Eleonora Cavallaro, Piero Esposito
,
Alessia Matano
and Marcella Mulino1
Abstract
In the paper we focus on emerging market economies’ pattern of trade, with a view to explaining
the different features of competitiveness for high skill- and low skill-intensive firms. We consider a
theoretical dynamical setup where high-skill firms engage in innovation activity and gain market
shares in high-income ”quality dominated” markets thanks to technological catching up, whereas
low-skill firms face price competition for their exports. On the basis of the theoretical model, we
run econometric estimations for trade between CEECs and EU economies over the period 2000-
2007. In the econometric analysis we first test the assumption that UVR is an adequate indicator of
quality in trade, showing that in high skill-intensive firms it is systematically correlated to domestic
and foreign technological variables; we then use the fitted UVR in the estimation of the role of
preference for quality in the evolution of CEECs’ market shares. The estimations support the results
of the theoretical model as to the role of non-price competitiveness stemming from quality-supply as
well as quality-demand factors.
Keywords: Vertical innovation, Knowledge spillovers, Product quality, International
competitiveness.
JEL: F120, F140, F150, O320
We wish to thank S. De Nardis, B. Maggi, the participants in the 11th
Bi-Annual EACES Conference (Tartu, 26-28
August 2010), the 51 SIE Conference (Catania, 15-16 October 2010), the international workshop “The Role of Business
Services for Innovation, Internationalization and Growth” (Sapienza University of Rome, 2-3 December 2010) and an
anonymous referee for helpful comments and suggestions. The usual disclaimer applies. Financial support by the
Sapienza University of Rome and the University of L’Aquila is gratefully acknowledged.
Sapienza University of Rome, Department of Economics and Law, Via del Castro Laurenziano 9, 00161, Roma.
Email: [email protected] (corresponding author).
Scuola Superiore Sant'Anna, DIRPOLIS , Pisa. Email: [email protected]
Universitat de Barcelona. Email: [email protected]
Università dell’Aquila, Dipartimento di Ingegneria Industriale e dell’Informazione e di Economia. Email:

3
1. Introduction
In explaining patterns of international specialisation economists commonly refer to the
benchmark cases of North-North and North-South trade. In North-North trade frameworks,
economies manufacture and export similar products, and market competition is ruled by the ability
to introduce a new variety or to step up the quality ladder. In North-South trade cases, high-skill
endowed economies manufacture and export innovative products, whereas low-skill endowed
countries specialize in low-cost, imitated products. Very little is said about emerging market
economies (EMEs) that are placed in between the two cases above. In fact, despite their lower level
of per-capita income compared to the rich countries of the North, EMEs generally feature high
growth rates of output and a catching-up process on the run; notwithstanding the differences with
respect to advanced economies, these economies show a tendency towards a convergence in trade
patterns. All this makes EMEs an attractive case study for international economists. Of special
interest is the case of the Central and Eastern European countries (CEECs) that have recently joined
the European Union (EU). Understanding the evolution of CEECs’ structure of trade and export
competitiveness is particularly highlighting in the debate on the European enlargement process as a
driver of economic convergence. Indeed, economic integration has fostered the exchange in goods
and services, business contacts, and so on, and is thus expected to have promoted the dissemination
of knowledge which provides the mechanism for accelerating the economic catching-up.2 The
enlargement process is thus likely to have induced an increasing economic similarity between
CEECs and the more advanced EU countries, which ought to be reflected in the evolution of trade
patterns. A number of contributions in the literature addresses the issue of CEECs’ trade structure
convergence towards EU’s patterns; yet, limited attention has been drawn to the role of the
2 Yet, economic integration per se is not sufficient for a successful catching up; the so-called “advantage of relative
backwardness” takes place only in the presence of “absorptive capacity” (Abramovitz 1986), i.e., the availability of
technological capabilities, particularly in terms of skilled workers. This factor ultimately determines the ability or
inability of any given country to exploit the dynamical gains from trade.
4
enlargement process as a driver of CEECs’ technological catching up and export performance.3
With this paper we add to the above strand of literature. by providing a theoretical and empirical
contribution to the analysis of the relationship between the evolution of CEECs’ competitiveness at
the industry-level and the process of technological catching up induced by economic integration
with more advanced EU economies. The novelty of our paper is the explanation of sectoral
differences in export competitiveness and market shares’ growth as the result of a skill endowment-
driven specialization that makes high skill-intensive (HS) firms able to benefit by economic
integration, catch up technologically with more advanced European foreign firms, and succeed in
“quality- dominated” market”.
In view of validating the idea pursued in the paper, we develop a theoretical setup where we
explicitly take into account sectoral differences in technological capabilities and skill intensities.
This allows us to explain the different features of competitiveness in trade: HS firms face a “non-
price” competition in European markets based on the ability to succeed in the quality upgrading of
manufactured products, whereas low-skill (LS) firms face a traditional price competition,
fundamentally centred on the ability to preserve a lower labour cost dynamics. Hence, our analysis
is set in a dynamical perspective, with a view to explaining market penetration for HS firms as the
result of an innovation-driven quality upgrading process. To this end, we first derive analytically
export functions where the relative quality content of any product determines its share in importer’s
expenditure; we then explain market shares’ growth with firms’ ability to improve the relative
quality content of their exports. In this respect, we differ from Hallak (2006), since we model
analytically the technological catching-up fuelled by economic integration as the engine of a
dynamical process of increasing competitiveness in “quality-dominated markets”. To our
knowledge, this aspect is completely new in the literature.
As to the empirical analysis of the paper, we first test at the sectoral level the assumption
that unit value ratios (UVR) provide an adequate proxy for quality in trade; we then assess the role
3 Among the most recent contributions on this topic are the works by Cavallaro and Mulino (2008 and 2009a), Caporale
et al. (2009).

5
of preference for quality in explaining trends in market shares. In the empirical literature the use of
UVR to proxy quality is not new (Schott 2004, Hummels and Klenow 2005, Hallak 2006, Hallak
and Schott 2011), but the appropriateness of such a choice could well be questioned. We thus
preliminary regress UVR changes against several variables measuring domestic and foreign
knowledge that in our theoretical setup drive the process of quality upgrading. In a second step, on
the basis of the estimation results that validate our assumption for HS industries, we use the fitted
UVR changes to proxy product quality changes in the estimation of the evolution of HS’s market
shares. Our econometric procedure differs from Hallak (2010) that uses per-capita income to
measure exports’ quality content. Indeed, here we are interested in emphasizing the evolution of
CEECs’ trade patterns and understanding its determinants, and for this purpose the use of a sectoral
UVR is more appropriate, given that CEECs’ level of per-capita income is lower than EU
members’, even though the quality content of their advanced products is comparable to EU’s.
The paper is organized as follows. Section 2 presents an overview of the literature on
product quality and trade; section 3 develops the basic relationships of the theoretical model, and
derives export functions for HS and LS industries. Section 4 analyses the dynamical implications
for market penetration of price or quality competitiveness, and formalizes the role of international
knowledge diffusion as driver of a successful competitiveness in “quality-dominated” markets.
Sections 5 develops the empirical analysis of the paper with reference to the CEECs. We first
provide empirical evidence related to market penetration and price and non-price competitiveness,
at the industry level, for the period 2000-2007; we then test at the sectoral level the assumption that
UVR provides an adequate proxy for quality in trade and finally estimate the role of quality
upgrading in HS firms’ market shares changes over the period considered. Section 6 draws some
final conclusions.

6
2. Product quality and trade: a survey of the literature
This paper contributes to the existing theoretical and empirical literature on the role of
product quality in trade, pioneered by Linder (1961). Linder predicted that similar countries would
trade more intensely with one other, as they share similar production and consumption patterns.
Since firms in the manufacturing sector respond primarily to domestic demand, high-income
countries specialize in high-quality goods for the domestic market, and then become exporters of
such goods to countries with similar per-capita income.
Although the “Linder hypothesis” encloses both a supply- and a demand-side explanation of
the relationship between product quality and trade, research in this area has focused distinctively on
the two aspects. As to the production side, some authors point to the relationship between per-capita
income and quality production, and find evidence of a strong correlation between export prices and
countries’ per-capita income, in that richer countries export higher quality goods at higher prices
(Hummels and Klenow, 2005). The explanation, as in Murphy and Shleifer (1997) and Schott
(2004), is based on factor endowments considerations: capital- and skill-abundant countries exploit
their advantage in the production of higher quality goods, that command a relatively higher market
price. In the same vein, but in a North-South context, Flam and Helpman (1987) and Stokey (1991)
present a quality-based product cycle model where Northern countries that engage in R&D activity
manufacture and export innovative, higher quality products, whereas Southern countries have a
comparative advantage in low-cost, labour-intensive productions and export imitated products. As a
result, rich countries’ endowment-driven comparative advantage in the production of vertically
superior varieties brings about differences in per-capita income, which are reflected in the observed
international patterns of consumption. As to the demand-side, most contributions investigate the
relationship between per-capita income and demand for quality; evidence of wealthier countries
consuming high-quality goods in larger proportions than poorer countries is provided by Bils and
Klenow (2001), Brooks (2006), Hallak (2006), Verhoogen (2008). The last two authors offer a

7
theoretical foundation of the empirical results based on non-homotheticities in the demand for
quality, that makes countries differ in their willingness to pay for vertically superior varieties.
Despite the numerous empirical validations of the role of quality in trade, the Linder
hypothesis as such has found scarce empirical support. Hallak (2010) shows that the above failure is
due to the systematic bias induced by the aggregation across sectors. Hallak’s theoretical framework
includes both quality demand and supply: countries’ expenditure shares on different quality
products varies with per-capita income, whereas quality supply is assumed to be systematically
related to per capita income. The combination of the above demand and supply determinants into a
gravitational-type specification leads to the estimation of bilateral trade flows at the sectoral level,
where differences in cross-country income per capita represent the Linder term. This turns out to be
significant and with the correct sign.
As to the role of quality in trade with specific reference to the CEECs, the contributions in
the literature are not numerous. Aturupane et al. (1999) find that trade of similar goods of different
quality (vertical intra-industry trade) have been gaining a predominant role in two-way trade
between CEECs and richer EU-15, as early as the first half of the 1990s. The authors link the above
evolution to inward FDI as well as skill intensity of production and imports of intermediate goods.
Subsequent contributions emphasize that CEECs exports’ improvement have been due especially to
the specialization in up-market, up-quality products. In fact, with reference to a sub-set of these
countries, Dullek et al. (2005) show that over the period 1995-2000 the composition of exports
towards EU-15 has shifted towards higher-quality segments within industries. Benkovskis et al.
(2010) confirm that the above is an on-going process, showing that a large part of the increase in the
prices of CEECs’ exports towards the EU in the period 1999-2009 results from improving quality,
albeit the quality level of CEECs’ exports is still lagging behind in comparison with German
exports. The link between CEECs’ quality upgrading in manufactured products and competitiveness
in EU markets is addressed by Cavallaro and Mulino (2008) who find that CEECs’ success in
“quality-dominated” markets is based on technology spillovers linked to deeper economic relations

8
among European partners, as well as their capability to absorb foreign technology. The association
between CEECs’ quality upgrading and increase of (world) market shares is also highlighted by
Fabrizio et al. (2007).
3. The theoretical model
We consider an emerging economy that trades with a technologically more advanced foreign
country, where we distinguish between HS firms that engage in research activity and manufacture
advanced products, and LS firms that manufacture traditional products. As in recent trade theory,
the framework considered is that of a semi-small open economy, where imported goods are
purchased at given world prices, and producers of final goods compete monopolistically in
international markets, given that traded products substitute imperfectly for each other in
households’ demand. We assume no tariffs, transportation costs or other trade barriers, and that all
factors of production are immobile.
3.1 The supply side
We distinguish between two types of final products: advanced and traditional. The N
differentiated advanced goods - indexed by n, with Nin ,...,,...,1 - are manufactured with high-
skilled labour and an aggregate of advanced intermediate inputs that embody quality improvements
stemming from research activity. As in new-Schumpeterian quality ladder models, firms that
manufacture innovative intermediates engage in research activity in order to create blueprints.
When they succeed in up-front research they have the ability to gain industry leadership for the
innovative product. We characterize the typical HS firm that manufactures the advanced final
product, iY , by the following technology:
1
iiii AHFY (1)

9
where iH is employment of high-skilled labour, iA the amount of intermediates in the manufacture
of the final product by firm i and iF is an arbitrary constant reflecting the choice of units.4 We
follow Grossman and Helpman (1991) in modeling the intermediate goods sector and assume that
firms employ a fixed assortment of vertically differentiated intermediate inputs, indicated by the
following index:
dzZqlogAlogz
zz
1
0
(2)
where zZ represents the component z , of the th
generation, in the index A, whose quality is zq
. To simplify we let the innovation process be such that each new intermediate provides
additional services with respect to the good of the previous generation, that is 1 zz qq , with
1 .
The research sector is portrayed as in the patent-race literature. Firms target their research
effort at the quality upgrading of any leading-edge production process; they issue equity to finance
the R&D race and use a constant-return-to-scale technology where skilled labour is the only input.
Any firm that engages RH labour resources in industry z at time t is able to produce the new good
with probability H .5 The probability of gaining success in lab activity is proportional to the
resources devoted: to achieve a research intensity of H , it is necessary to invest HHRH units
of labour services per unit of time, where H is a parameter reflecting the productivity of labour in
research. Firms will invest labour in research activity up to the amount for which the cost of R&D
activity equals the expected revenues.
As to the manufacture of advanced intermediates A, firms use a constant-return-to-scale
technology that employs only labour. Given monopolistic competition and limit pricing outcome,
4 To save on notation we have omitted the time index. 5 The arrival of research successes is guided by a Poisson process, with denoting the parameter of the density
function. Although the arrival of research successes among firms is guided by independent Poisson processes, by the
law of large numbers, the process of technological advance at the aggregate level is smooth and non-random. See
Grossman and Helpman (1991).

10
all intermediates bear the same price. Since better quality inputs are more productive, in that they
allow to produce a higher-quality final good, producers of final goods buy only state-of-the-art
varieties. Given that all demanded components zZ are employed in equal quantities, the aggregate
intermediate A can be expressed as ZqA where Z denotes the aggregate volume of intermediates
and q is an index of the productivity of intermediates which is proportional to the total “number” of
R&D successes. Hence, the resulting quality content embodied in advanced final products reflects
the country’s state of knowledge, at a given time t.
In addition, in the economy there are M differentiated traditional products - indexed by m, with
Mjm ,...,,...,1 - that are manufactured with low-skilled workers. The representative LS firm that
manufactures a traditional product j is characterized by the following technology:
BLFY jjj (3)
where jF is an arbitrary constant reflecting the choice of units, jL is employment of low-skilled
labour and B denotes a learning-by-doing process that increases workers’ productivity. In
particular, we assume learning by doing to be linked to the stock of knowledge accumulated in the
economy. The idea is that the innovative activity taking place in the HS industry leads to the spread
of general knowledge that may be partly seized by LS firms. Since domestic knowledge is
embodied in advanced intermediate inputs, we assume the learning-by-doing process to be linked to
the production of these intermediates. At the same time, economic integration with more advanced
economies favours the diffusion of foreign knowledge, in particular through the channel of foreign
direct investments. We thus posit 1AAB , with 0,0 , where is a function
denoting the LS firm’s ability to absorb externally generated knowledge present in the public
domain. We assume that the contribution of the accumulated knowledge to LS firms’ productivity
growth exhibits decreasing returns due to the difficulties of learning in the presence of growing
complexity of advanced intermediates and sectoral specificities. Parameters and 1 are the
weights of the domestic and foreign sources of learning, that is, A and A , respectively.

11
3.2 The demand side
Preferences of any domestic household h are described by the following intertemporal utility
function
dtueU h
t
th log
(4)
where represents the subjective discount rate and htu the following instantaneous utility function:
1h
T
h
A
h
t CCu (5)
where
AAA
n
nFF
n
nHH
h
A CqCqC
1
*)*,(*,
(6)
TTTT
m Fmm Hm
h
T CCMMC 1
*
1
(7)
In equation (5) h
AC denotes consumption of advanced goods and h
TC of traditional
products. Equation (6) states that h
AC is a function of the level of consumption of each domestic
advanced good n, ),( nHC , and of each foreign advanced good n , **,nFC , where
Nin ,...,,...,1 . Each distinct advanced product may be manufactured in an infinite number of
ways, corresponding to a different vintage ; different vintages of a given product substitute
perfectly for one other, once the appropriate adjustment is made for the different quality levels;
)(Hq is the quality level embodied in vintage of any domestic advanced good, and analogously
*Fq is the quality level embodied in vintage of any foreign high-tech good. Equations (5)-(7)
state that each consumer maximizes static utility by devoting a fraction of her expenditure to the
set of advanced goods and the remaining fraction to the set of traditional goods; within the
advanced set, preferences over home and foreign products are modelled according to a quality-
adjusted CES function, so that the whole set of the N domestic and N foreign varieties, are
12
demanded. Thus, once the distribution of expenditure across advanced and traditional goods has
been set, the consumer first selects among generations of any available domestic and foreign
product, n and n , the brand of vintage ̂ and ̂ that carries the lowest quality-adjusted price; she
then allocates expenditure among the whole set of NN products according to the relative prices
and relative quality content.6 The functional form (6) implies a constant elasticity of substitution
between advanced goods, given that A
AA
1 , where A is the constant elasticity of
substitution between each pair of advanced goods. The weight of each good in the consumption of
the advanced bundle is proportional to its quality level )(Hq or *)(Fq ; is a positive parameter
that measures the household’s intensity of preference for quality, as in Crinò and Epifani (2008),
Hallak (2006).
As to traditional goods, h
TC is a function of the level of consumption of each traditional
domestic good m, HmC , and each foreign good m , *FmC , where Mjm ,...,,...,1 . Equation (7)
assumes a constant elasticity of substitution between traditional goods, given that T
TT
1 ,
where T is the constant elasticity of substitution between each pair of traditional goods; moreover,
all traditional goods enter h
TC symmetrically.
Optimal allocation of expenditure across the N domestic and N foreign (state-of-the-art)
products implies the following demand function for domestic advanced consumption good i, iHC ,
with quality Hq and price HiP (see Appendix for details):
A
h
HA
Hih
HiP
EQ
P
PC
A
A
1
(8)
6 Once the above two static maximization problems have been solved, the optimal allocation of expenditure across time
is readily obtained as the solution to a standard intertemporal maximization problem. The occurrence of a two-stage
static optimization problem stems from the presence of both a vertical and a horizontal dimension in consumer’s
preferences. See Grossman and Helpman (1991).

13
where hE denotes the representative consumer’s share of expenditure over advanced goods, AP
the advanced goods price index consistent with the quality-adjusted CES type of preferences, and
where
N
n
N
n
FH
HH
1
. Equation (8) shows the role of the relative quality content of
goods in the structure of demand for advanced products. In fact, HQ
is a “distribution” parameter
in that it gives the share of the (advanced goods) expenditure devoted to domestic good i , for given
relative prices.
Analogously, with respect to the demand for any domestic traditional good ,j we obtain a
demand function of the form:
T
h
T
Hjh
HjPMM
E
P
PC
T
1 (9)
where hE1 represents the representative consumer’s share of expenditure over traditional
goods and TP is the traditional goods price index consistent with the CES-type of preferences.
Comparison of equations (8) and (9) makes clear the implications of the inclusion of the
quality dimension in consumers’ preferences. To see this clearly, we re-express relative demand
between any domestic and foreign advanced product and between any domestic and foreign
traditional product, respectively, as:
1
AA
F
H
Fi
Hi
h
Fi
h
Hi
q
q
P
P
C
C
T
Fj
Hj
h
Fj
h
Hj
P
P
C
C
The above equations show that for given relative prices and elasticity of substitution, relative
demand for advanced goods depends on products’ quality ratio; moreover the higher is the intensity
of quality preference, , the more relative quality matters. Our result is in line with Hallak (2006)
that argues that high-quality products have easy access to rich markets where high-income
consumers are more quality oriented. On the contrary, relative demand for traditional products

14
depends only on relative prices, for any given elasticity of substitution, just as in traditional CES-
type preferences.
We now focus on the emerging country’s exports, that is, on foreign demand for advanced
and traditional products. To this end we let the structure of foreign preferences to be symmetric to
the one given in equation (5) so that, at each time t, the representative foreign household’s demand
for any (domestic) advanced product i is given by substituting her intensity of preference for
quality, , and her expenditure,
hE . Same applies to non-residents’ demand for any domestic
traditional product j .
At each time t, exports of high-tech domestic goods are obtained by aggregating the
individual demand functions for the whole set of N domestic advanced goods:
*
1
h n A
h
HA
Hn
Hn
A
P
EQ
P
PPX A
A
(10)
Correspondingly, exports of traditional domestic goods are given by:
*
1h m T
h
T
Hm
Hm
T
PMM
E
P
PPX
T
(11)
4. Market penetration and quality dynamics
The focus now is on the dynamical implications of the different kind of competitiveness
faced by HS and LS firms, as resulting from the two functional forms obtained above ( equations 10
and 11). To see this we look at the evolution of HS and LS market shares. We define the market
share of domestic HS firms as the ratio of non-residents’ imports, AX , to non-residents’ purchases
of advanced products produced in their country, AG . Given the monopolistic competition setting,
where all domestic firms producing high-tech goods have identical technology and face the same

15
demand, we have a symmetric equilibrium,7 where all domestic firms of the advanced industries fix
the same price, A
HHi PP . Thus, we may reformulate equation (10) as
EQ
P
PNX A
A
HA
A
HA
1
1
(12)
where, now, E denotes aggregate foreign expenditure over the EME’s advanced products,
expressed in terms of the domestic currency. In turn, by assuming A
FFiPP , the equation for non-
residents’ purchases of advanced products manufactured in their own country is
EQ
P
PNG A
A
FA
A
FA
1
1
*
(13)
The evolution of high-tech products’ market shares is then readily derived by taking the
logarithmic differentiation with respect to time of the ratio of equations (12) and (13):
FH
A
F
A
HA
AA qqPPGX ~~~~1
~~ (14)
Same applies to traditional products, where equation (11) for non-residents’ imports is restated as
E
P
P
MM
MX
T
T
T
HT
1
1
(15)
where T
HHj PP and where E1 denotes aggregate foreign expenditure over the EME’s
traditional products, expressed in terms of the domestic currency. Given T
FFjPP , the equation for
non-residents’ purchases of traditional products manufactured in their own country is
E
P
P
MM
MG
T
T
T
FT
1
1
(16)
so that the evolution of market shares for low-tech products is
T
F
T
HT
TT PPGX~~
1~~
(17)
7 The authors develop the general equilibrium analysis for a similar model in a previous paper (Cavallaro and Mulino, 2009);
interested readers may refer to that paper for details.

16
It appears clearly that, in the case of advanced products, market penetration abroad depends
on the evolution of both the pure price term and the quality differential term; the weight of the latter
depends on the intensity of foreign consumers’ preference for quality. The implications for
competitiveness and export orientation are twofold: firms that well-perform in “quality dominated
markets” are able to expand along the “intensive margin”, that is, to gain market shares even at
constant or increasing relative prices. Moreover, were the intensity of quality demand related to
consumers’ income as stated in Hallak (2006), high-tech innovative goods would find easier
markets in high-income countries.
On the other hand, firms of traditional industries can only engage in a traditional “price
competition” in order to penetrate foreign markets. In this respect, the learning-by-doing technology
brings about labour productivity increases that loosen the pressure on wages which is required to
keep market shares constant. It turns out that the innovation activity in the advanced sector has
positive external effects on the traditional firms too, and hence the determinants of the pace of
innovation in the advanced sector of the economy are important for the overall evolution of the
country’s performance in international markets.
As standard in neo-Schumpeterian growth models, we assume that firms step up the quality
ladder thanks to innovations resulting from the devotion of labour resources to research activity. In
our analysis we consider international spillovers as important factors in the building up of an
emerging economy’s stock of knowledge, and hence take as relevant for the process of quality
upgrading a concept of knowledge capital that includes both domestic and foreign know-how.8
Some contributions in the literature9 include international knowledge spillovers in models where
innovation activity is conceived as a horizontal process of increasing varieties. Here, we focus on a
vertical innovation process and assume the following technology for quality upgrading (see
Cavallaro and Mulino 2008):
8 We consider international R&D spillovers, FDI, business contacts, as the means that may convey technology transfers
in our model. As suggested in Keller (2004), the above are among the strongest form of knowledge diffusion. 9 Among the others, Grossman and Helpman (1991), Smulders (2004), Leon-Ledesma (2005).

17
logH
RH
H HK
dt
dq
(18)
where HK is the economy’s overall stock of knowledge capital, at a given time t, specified as
FHH qqKK , . Equation (18) states that the research intensity in the domestic R&D sector is
increased by the overall stock of knowledge capital, as standard in innovation-driven endogenous
growth models with international knowledge spillovers. We take )(K to be increasing in both
arguments and homogeneous of degree one. The latter assumption allows us to define the
“intensive” function HF qqK /,1 such that HFHH qqqK / . The function reflects
the existence of international spillovers. The case of no international spillovers is one where
1/ HF qq - or any positive constant.
Rearranging, we can express the growth rate of quality in the research sector as:
log~1
H
R
F
HH
H
q
(19)
where
F
H
q
q is a measure of the knowledge gap between the two countries. Equation (19)
emphasizes the convergence pattern of integrated economies: the growth of quality over time is
positively related to the technological disadvantage of the laggard country, given its capacity to
benefit by the international dissemination of knowledge. The specific functional form adopted for
represents analytically the country’s absorptive capacity.
In conclusion, economic integration with more advanced countries exerts a twofold positive
effect: from the supply side, it facilitates the spread of general scientific knowledge and the
diffusion of more product-specific information, thus speeding up the technological catching up;
from the demand side, it encourages foreign expansion of domestic firms that, thanks to their
engagement in R&D activity, are able to compete in “quality-dominated markets”. The model

18
predicts that the positive impulses to the modern, dynamic industries are also indirectly beneficial to
the traditional sectors of the economy.
5. Export quality, technology and market penetration of CEECs: econometric analysis
In this section we aim at validating equation (14) of the theoretical model, i.e., that CEECs
high-tech products’ export penetration in high-income EU markets10
is driven by quality upgrading
stemming from the accumulation of knowledge capital.
Given the focus on the role of product quality in trade, our preliminary concern is the
appropriate measure of quality to be used in the econometric estimation. The empirical literature
suggests two alternative possibilities: the use of either a total factor productivity parameter (Crinò
and Epifani, 2010), or the UVR (Schott, 2004, Hummels and Klenow, 2005, Hallak and Schott,
2011). In our analysis we follow the latter approach by assuming the UVR to be an adequate proxy
for relative quality. However, despite their common use, UVRs are also affected by factors not
related to product quality, such as the unit labour cost, and this may lead to biased results.11
We
validate the use of UVR as a proxy measure for product quality by testing the influence on UVR
changes of several technological variables lying behind the accumulation of knowledge capital, that
in our analysis are at the root of the process of quality upgrading.12
On the basis of the estimation
results that confirm our assumption for high-skill industries, we then use the fitted values for UVRs
changes in our successive estimation of the role of preference for quality in explaining market
shares changes between 2000 and 2007. The choice of performing regressions on the overall
changes instead of using panel data techniques is due to the high number of missing sectoral data,
10
For the CEECs we only consider the Czech Republic, Hungary, Poland and Slovenia, because of missing data on
technological variables for the other countries, whereas among the EU-15 countries we do not consider Luxembourg,
owing to its small dimension. 11
In addition, unit values suffer from measurement errors because values are collected using data from invoices,
whereas quantities are often approximated or measured with error. See Deaton (1997) and Nielsen and Lüthje (2002). 12 Differently, Hallak and Schott (2011) deduce countries’ product quality relative to a numeraire country by
decomposing observed export prices into quality and pure price components, thanks to the use of information on
consumers’ valuation of products inferred from countries’ trade balances.

19
especially for domestic R&D expenditure. Given our focus on basic long–term trends we leave
aside data referring to 2008 onward for the adverse impact of the recent global financial crisis on
output growth and the volumes of trade, as well as other important variables considered in our
estimation, such as FDI flows and R&D expenditure.
5.1 Data and descriptive evidence
Trade data are taken from Eurostat COMEXT database, which reports values and quantities
for industrial products according to the 8-digit level Combined Nomenclature classification (CN8).
The breakdown of exports according to skill intensities is based on the NACE (DA-DN)
classification that divides manufactured products into 14 industries. Following a standard
classification, we consider as high-tech/high-quality industries Chemical Products (DG), Machinery
and Equipments (DK), Electrical and Optical Equipments (DL) and Transport Equipments (DM). In
addition, some studies (Esposito and Stehrer 2009; Landesmann et al. 2009) suggest that CEECs
are relatively skill intensive in Paper, Printing and Publishing (DE) as well as Coke and Refined
Petroleum Products (DF) industries, whereas skill-biased technical change has been strongly
concentrated in skill-intensive industries (Esposito and Stehrer 2009). Accordingly, we also include
these industries among the high quality/high technology ones. All other industries are classified as
low-tech/traditional. As common in most empirical contributions, we define the market share of a
given industry as the ratio of exports of the reporter country to the total imports of the partner
country from the EU-25 area.13
We consider only intra-EU trade because of the strong linkages in
manufacturing processes and the relevance of trade relationship for CEECs. We obtain trade at
constant values by evaluating 2000 quantities at 2007 unit values; we then aggregate them into
high-skill and traditional industries.
Consistently with our definition of market shares, the UVR is the ratio between reporter k
exports towards partner j and total intra-EU imports of the partner, for each type of industry i
13
We exclude from the sample Cyprus and Malta due to their small size.

20
(jk
iUVR,
), and is built as a weighted average of the relative unit values at product level,14
where the
weights are the shares of each product’s export in the industry’s total exports. We dropped
observations belonging to the upper and lower 5% of the distribution, since large differences in unit
values point to a composition effect within product categories, that is, to the presence of
heterogeneous goods; in this case, it is likely that price differences are not associated with
differences in the goods’ quality content. In addition, we consider that aggregate UVR of a fixed-
products dataset can change either because of changes in the relative prices of products (within
product changes), or because of the changing composition of the basket (between products changes)
with the latter denoting changes in the export specialisation towards a different composition of the
basket. Therefore, in order to isolate “pure” relative price changes, we purge composition effects by
computing the within-product component of the UVR growth (UVRw henceforth) by weighting
product-level relative prices with the initial export volume:
r
vEU
r
vEU
r
r
vEU
r
vEU
tr
r
vk
r
vk
r
r
vk
r
vk
trvk
tsp
p
p
p
UVRw,
*,
2000,
,*
,
,
,*
,
2000,
,*
,
,,
,
with
r
rr
rr
ryp
yp
2000,2000,
2000,2000, (20)
where t is the time period, p is the price of the generic product r belonging to industry s, is the
share of each product in total industry’s export value and the superscripts indicate the origin (k, EU)
and destination (v) markets.
As to the variables related to the accumulation of knowledge capital, we consider R&D
expenditure for both CEECs4 and EU. Data are from Eurostat15
and OECD, respectively. We then
use FDI data from the WIIW database on Foreign Direct Investments, that includes FDI stocks and
flows in each industry for Central and Eastern European countries. As to the variables referring to
the demand side, we include a “Linder term”16
(QDEM) where changes in quality, proxied by
14
We consider narrowly defined product categories at the CN8 level. 15
We filled missing values of R&D expenditure by imputing the average value calculated for high-tech and traditional
industries separately. 16
In Linder (1961) the demand for high-quality goods depends on the consumer’s level of income.

21
changes in UVRw, interact with foreign per-capita GDP in order to capture the intensity of
preference for quality. Per-capita GDP is from Eurostat.
In Table 1 we present data on UVR, market shares and prices’ determinants, i.e., unit labour
costs and innovation costs, over the period 2000-2007. These trends highlight the different features
of competitiveness in trade for HS and LS industries. In particular, the figures related to the UVR,
UVRw and market shares point to a striking different performance between the two kind of
industries. It is worth noticing the sizeable increase in market shares for HS industries, slightly
below 75%, matched by the positive change in both UVR indexes which is stronger for the within
products component (29%). Albeit starting from a lower level, at the end of the period HS industries
recorded higher market shares than low-tech industries. The fact that firms in HS industries gain
market shares at increasing UVRs is an evidence of the ability to penetrate foreign markets not so
much by reducing prices as by innovating. This points to an innovation-driven successful
competition in “quality dominated markets” (Aiginger 1997; Cavallaro and Mulino 2008, 2009a).
On the other hand, firms in LS industries record a modest 16% increase in their market shares,
associated with approximately the same price changes.
Table 1 – Unit value ratios, market shares, prices’ determinants: levels and growth rates, CEECs-4
High-skill industries Low-skill industries
2000 2007 growth
rate
2000 2007 growth
rate
UVR*
1.04 1.20 15% 0.95 1.07 13%
UVRw*
1.04 1.34 29% 0.95 1.09 15%
Market shares*
2.15 3.74 74% 2.89 3.35 16%
Wages (annual) (€)**
5972 7848 31% 4548 6033 33%
Lab Prod. (€)**
57204 94609 65% 35808 57699 61%
Real R&D (mn€)***
730 1157 58% 252 196 -22%
Real FDI (mn€)****
15339 37103 142% 14390 30193 110%
Sources: *Own elaboration on COMEXT data;
**WIIW Industrial database on Eastern Europe;
***Eurostat;
****WIIW
Foreign Direct Investment Database.
Wages, productivity, R&D and market shares are expressed in constant (2000) prices.

22
Table 1 shows the sizeable increases in wages both in HS and LS industries, coupled with a
remarkable favourable evolution of labour productivity; overall, over the period considered, the
CEECs-4 exports wellperform in terms of traditional price competitiveness. As to innovation costs,
R&D expenditure records a noticeable growth in HS industries, and a sizeable fall in traditional
industries. In addition, the Table also reports data on the growth rate of inward FDI for both types
of industries. As known, this variable acts as a technological vehicle for domestic innovation
activity, by means of both “pure” knowledge spillovers and spillovers passing through vertical and
horizontal linkages (van Pottelsberghe and Lichtenberg 2001, Keller 2004). The Table shows a
faster increase for HS industries than for LS industries. Summing up, data point to a sound
evidence of increasing competitiveness in EU markets for CEECs’ high-tech industries. In addition,
data provide a clear indication that domestic and foreign technology have played a role in fostering
export penetration, thanks to quality improvements, particularly for HS industries.
5.2 The effect of domestic and foreign technology on export unit values
The first estimation aims at capturing the part of the UVRw change due to quality
upgrading in HS industries. Following equation (19) we assume that this process is positively
influenced by both domestic and foreign knowledge.
Among the regressors, we include the initial value of the relative price, in order to test the
effect of the initial quality gap: according to equation (19) of the theoretical model, a country’s
relative technological disadvantage can be a positive determinant of a catching-up process among
integrated economies. As to technological variables, domestic knowledge is proxied by the
domestic sectoral R&D expenditure (RD), whereas foreign knowledge is accounted for by
considering the stock of inward FDI and foreign R&D expenditure. Our assumption that knowledge
spillovers’ effects are fostered by the absorptive capacity of the exporting industry is tested by
including an interaction term between inward FDI and domestic RD: the expected sign of the
coefficient of this interaction term is positive. In addition, we interact inward FDI with R&D

23
expenditure of the partner country, as in Léon-Ledesma (2005), in order to take into account the
FDI technological content; also the expected influence of the latter interaction term is positive.
The resulting equation is the following:
vs
k
k
s
s
vvk
s
k
s
k
s
k
s
k
s
vk
s
vk
s
RDRDFDI
RDFDIRDFDIUVRwUVRw
,65
432
,
10
,
lnln*ln
ln*lnlnlnlnln
(21)
where subscript s refers to the industry while superscripts k and v refer to the reporter and partner
countries, respectively. We estimate the above equation by carrying out both OLS and Instrumental
Variables regressions on the overall changes between 2000 and 2007. The use of the IV estimator is
justified by measurement errors and the possibility of a mean-reversion bias arising from symmetric
shocks specific to the initial year and from sectoral asymmetric shocks, that would affect the
coefficient of the initial UVRw. In order to address this problem we run IV estimates using the
average manufacturing unit value ratio of 1999 as instrument. We include sector- and reporter-
specific dummies ( s and k ) while partner-specific fixed effects are not included as they are
jointly not significant and cause multicollinearity. Obviously, the evolution of relative prices
depends also on traditional cost determinants; consequently, we run the above estimation adding the
growth rate of real wages and labour productivity. However, the results are not affected by the
additional variables, since most of their effects are captured by the reporter- and sector-specific
dummies.17
The results are presented in Table 2. As a control, we estimate equation (21) also for the
sub-sample of LS industries where, according to our model, quality plays no role, so that changes in
relative prices only reflect changes in unit labour costs.
By looking at Table 2, it appears that the instrument works fine, both the weak identification
and under identification tests are rejected and the instrument is strongly significant (not shown).
With reference to IV estimates for HS industries, from column (3) we see that the stock of inward
FDI is not significant even after controlling for both domestic and foreign R&D. Similarly, the
latter two variables do not exert a significant impact either. On the contrary, when we add the
17
The results are available upon request.

24
interaction terms the coefficient for the inward FDI stock (column (4)) turns significant at 1% level
and with the expected positive sign. In addition, both the interaction terms are positive and
significant. The above result confirms the importance of CEECs-4 absorptive capacity for the
effective ability to exploit foreign know how. The positive sign of the interaction term between FDI
and the partner’s R&D suggests that spillovers arising from the stock of foreign technology through
inward FDI are positively correlated with the partner’s research activity. Overall, UVRw changes
respond positively to technological variables, thus validating the hypothesis that changes in product
quality may be proxied by changes in the UVRw. Finally, the OLS estimates in columns (1) and (2)
do no differ from the corresponding IV ones, indicating that the endogeneity problem does not
affect the results.
Table 2 - Technological determinants of “within” relative prices changes.
High-skill industries Low-skill industries
OLS OLS IV IV OLS OLS IV IV
lnUVRwsk,v
-0.727*** -0.738*** -0.785*** -0.768*** -0.832*** -0.828*** -0.695*** -0.710***
[0.094] [0.092] [0.120] [0.117] [0.066] [0.065] [0.132] [0.128]
lnFDIsk 0.006 0.100* 0.010 0.103** -0.074** -0.124** -0.062 -0.120*
[0.044] [0.061] [0.043] [0.051] [0.037] [0.056] [0.039] [0.065]
R&Dsk -0.009 -0.022 -0.009 -0.022 -0.007 -0.004 -0.009 -0.006
[0.017] [0.016] [0.014] [0.015] [0.011] [0.010] [0.012] [0.012]
lnFDIsk *lnR&Ds
k 0.017* 0.017* 0.016 0.016
[0.009] [0.010] [0.011] [0.011]
lnR&Dv 0.035 -0.046 0.033 -0.048 0.017 0.035 0.023 0.044
[0.046] [0.058] [0.047] [0.056] [0.049] [0.054] [0.042] [0.050]
lnFDIsk *lnR&D
v 0.502** 0.504** -0.15 -0.171
[0.230] [0.201] [0.151] [0.158]
Dummies yes yes yes yes yes yes yes yes
Obs 263 263 263 263 372 372 357 357
R-sq 0.37 0.37 0.37 0.39 0.39 0.44 0.44 0.44
Under-id§ 70.0*** 71.6*** 56.6*** 58.8***
Weak-id§§
90.6 92.7 64.4 67 . Standard errors in Brackets; * significant at 10%; **significant at 5%; *** significant at 1%.
§Anderson canonical
correlation LM statistic; §§
Cragg-Donald Wald statistic. Instrument used: average unit value.
25
Turning to LS industries (columns (5) to (8)), we see that none of the regressors exerts a
positive and significant impact on the “within” relative unit value, and this confirms that price
changes are not systematically related to innovation costs in these industries. The only significant
variables are the initial relative price and the stock of inward FDI, both with a negative sign. The
negative sign of inward FDI is explainable in terms of the unit-cost reduction effect of this
investment activity, a result in line with the theoretical assumption of learning-by-doing driven
productivity gains in these industries. Overall, the results obtained for LS industries validate the
assumption of market penetration based on a traditional price competition.
Summing up, we find evidence that in high-tech industries UVRw is positively influenced by
technological variables. The estimates confirm the theoretical assumptions that technological
spillovers are effective in fostering quality upgrading in CEECs-4’ HS industries and that the
former are larger the higher the absorptive capacity. The above results, as expected, do not apply to
LS industries.
5.3 Demand for quality and market shares
We are now able to estimate equation (14) of the theoretical model that underlines the
relevance of both price and quality competitiveness in the trends of CEECs-4’ market shares with
respect to each EU-14 partner country. Given the theoretical assumption, validated by the
econometric analysis of section 5.2, that quality matters only for trade in advanced products, we
perform the estimates only for HS industries.
We regress the growth rates of market shares on the growth rates of relative prices and on a
measure of trade partners’ “preference for quality”. In this respect, as in Hallak (2006 and 2010)
and Epifani (2010), we posit that the intensity of preference for quality – represented by ω in
equation (14), is a logarithmic function of the importer per-capita income. This amounts to
assuming that richer countries spend a larger fraction of their income on goods with a higher quality
content. Given the results obtained in the first step, we are able to use the fitted values of
26
vk
sUVRw ,ln , obtained from the full OLS estimates, as the proxy for goods’ quality ratio.
Consequently, in the estimation of the impact of the preference for quality on market share changes
we take into account the technological variables through their impact on the UVRw.18
We now denote the fitted values of UVRw as vk
swUVR ,ln . We thus build a measure of the
preference for quality (the ‘Linder term’) by interacting each industry’s vk
swUVR ,ln with the
growth rate of per-capita GDP of the partner country. The above specification accounts for the
dynamical perspective of our analysis that focuses on the innovation-driven changes in the pattern
of trade. This calls for two differences with respect to Hallak (2010). First, we use the fitted values
of UVRw to proxy quality, instead of per-capita income, given our focus on countries that feature a
relatively lower per-capita income than EU members’, despite the quality level of HS products is
comparable to EU’s. In addition, since we showed that changes in the UVRw are closely related to
the technological catching up of each sector, this variable represents more faithfully the underling
dynamical tendencies taking place in the given sector. Secondly, we consider that the intensity of
preference for quality may change between the initial and final year. Consequently, the preference-
for-quality term we consider in our estimation of the market shares changes is:
vk
s
vvk
s
v
vvk
s
vk
s
vvk
s
wUVRGDPwUVRGDP
GDPwUVRwUVRGDPQDEMw
,,
,,,
lnlnlnln
lnlnlnln
The first two terms of the RHS are not significant because their impact is captured by the fixed
effects; accordingly, we use only the term vk
s
v wUVRGDP ,lnln as a measure of the change in
preference for quality.
The equation we estimate is the following:
vsvsk
vk
s
vk
s
vk
s
DCDCDC
QDEMwwUVRMKTsh
,321
,
2
,
10
, lnln
(22)
18
The use of the fitted values from the first step estimation has the additional advantage to correct the endogeneity bias
of the UVRw coefficient.
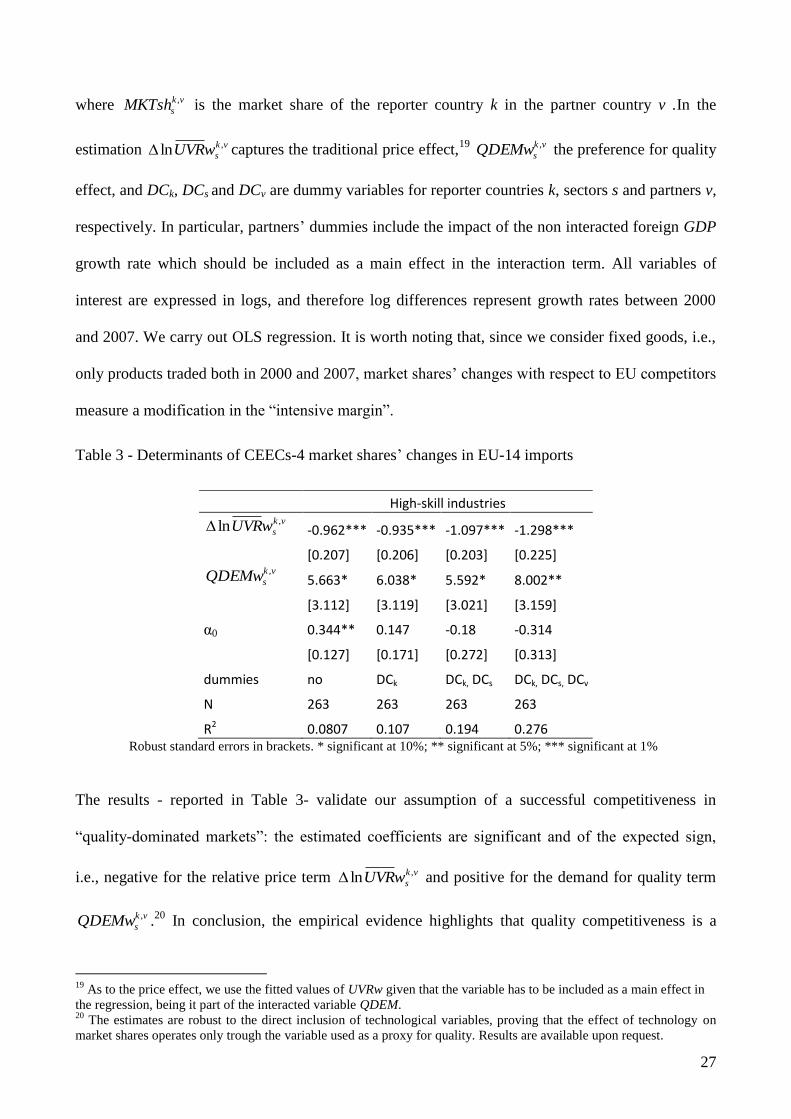
27
where vk
sMKTsh , is the market share of the reporter country k in the partner country v .In the
estimation vk
swUVR ,ln captures the traditional price effect,19
vk
sQDEMw , the preference for quality
effect, and DCk, DCs and DCv are dummy variables for reporter countries k, sectors s and partners v,
respectively. In particular, partners’ dummies include the impact of the non interacted foreign GDP
growth rate which should be included as a main effect in the interaction term. All variables of
interest are expressed in logs, and therefore log differences represent growth rates between 2000
and 2007. We carry out OLS regression. It is worth noting that, since we consider fixed goods, i.e.,
only products traded both in 2000 and 2007, market shares’ changes with respect to EU competitors
measure a modification in the “intensive margin”.
Table 3 - Determinants of CEECs-4 market shares’ changes in EU-14 imports
High-skill industries
vk
swUVR ,ln -0.962*** -0.935*** -1.097*** -1.298***
[0.207] [0.206] [0.203] [0.225]
vk
sQDEMw , 5.663* 6.038* 5.592* 8.002**
[3.112] [3.119] [3.021] [3.159]
α0 0.344** 0.147 -0.18 -0.314
[0.127] [0.171] [0.272] [0.313]
dummies no DCk DCk, DCs DCk, DCs, DCv
N 263 263 263 263
R2 0.0807 0.107 0.194 0.276 Robust standard errors in brackets. * significant at 10%; ** significant at 5%; *** significant at 1%
The results - reported in Table 3- validate our assumption of a successful competitiveness in
“quality-dominated markets”: the estimated coefficients are significant and of the expected sign,
i.e., negative for the relative price term vk
swUVR ,ln and positive for the demand for quality term
vk
sQDEMw , .20
In conclusion, the empirical evidence highlights that quality competitiveness is a
19
As to the price effect, we use the fitted values of UVRw given that the variable has to be included as a main effect in
the regression, being it part of the interacted variable QDEM. 20
The estimates are robust to the direct inclusion of technological variables, proving that the effect of technology on
market shares operates only trough the variable used as a proxy for quality. Results are available upon request.

28
strong determinant of CEECs market shares changes with respect to high-income EU-14 countries
over the period considered.
6. Concluding remarks
In the paper we consider the role of vertical innovation in the evolution of competitiveness
in trade for emerging market economies undergoing a process of economic integration with
technologically advanced countries. We first address the issue from a theoretical point of view, and
then provide some empirical evidence of the main theoretical results by considering trade between
CEECs and EU.
In the theoretical part of the work we distinguish between HS industries where firms
produce technologically advanced goods, thanks to research activity, and LS industries where firms
manufacture traditional products. Households derive utility by consuming both advanced and
traditional products, manufactured home and abroad, and preferences are such that relative demand
for advanced products depends on relative prices and the relative quality content of domestic and
foreign products, whereas relative demand for traditional products depends solely on relative prices.
Hence, HS firms compete in “quality dominated markets” and non-price effects stemming from
quality differences matter for market penetration, whereas traditional firms rely on a standard cost
competition. The model shows the role of supply of and demand for quality in shaping the pattern
of trade; this turns out to depend, on one side, on the emerging economy’s ability to reduce its
quality gap with respect to rich competitors, also thanks to knowledge spillovers fuelled by
economic integration and, on the other side, on the partner’s intensity of quality preference.
Our empirical investigation is carried out with reference to changes in market shares of
CEECs products in EU markets over the period 2000-2007. Descriptive evidence suggests that
CEECs-4 have engaged successfully in innovation-driven competition in EU “quality dominated
markets”. We run an econometric analysis in two successive steps. We first test the assumption that
UVRw is an adequate measure of quality, showing the existence of a systematic correlation with
29
domestic and foreign technological variables. We then use this measure of quality to assess the role
of preference for quality in CEECs-4’ exports towards EU markets, finding that the increase in
advanced products’ market shares is significantly correlated to the intensity of quality preference of
high-income EU countries. Our estimations definitely support the conclusions obtained in the
theoretical model.
References
Abramovitz, M. 1986. “Catching Up, Forging Ahead, and Falling Behind.” Journal of Economic
History 46, no. 2:385-406.
Aiginger, K. 1997. “The use of unit values to discriminate between price and quality competition.”
Cambridge Journal of Economics 21, no. 5:571–592.
Aturupane, C., S. Djankov and B. Hoekman. 1997. “Determinants of Intra-Industry Trade between
East and West Europe.” CEPR Discussion Paper, no. 1721, October.
Benkovskis, K., and R. Rimgailaite. 2010. “The Quality and Variety of Exports from New EU
Member State: Evidence from Very Disaggregated Data.” Latvijas Banka Working Paper,
no. 2.
Bils, M. and P.J. Klenow. 2001. “Quantifying Quality Growth.” American Economic Review 91, no.
4:1006-1030.
Brooks, E. L. 2006. “Why Don’t Firms Export More? Product Quality and Colombian Plants.”
Journal of Development Economics 80, no. 1:160-178.
Caporale, G.M., C. Rault, R. Sova and A. Sova. 2009. "Trade Specialisation and Economic
Convergence: Evidence from Two Eastern European Countries." DIW Discussion Papers
no. 875.
Cavallaro, E., and M. Mulino. 2008. “Vertical Innovation and Catching-Up: Implications of EU
Integration for CEECs-5.” International Advances in Economic Research 14, no. 3:265-
279.

30
Cavallaro, E., and M. Mulino. 2009a. “Innovation, Competitiveness and Growth: The Case of
Central and Eastern European Countries” in H. Marques, E. Soukiazis and P. Cerqueira
(eds.) Integration and Globalization. Edward Elgar, Cheltenham, UK .
Cavallaro, E., and M. Mulino. 2009b. “Technological catching up, competitiveness and growth.”
Journal of International Trade & Economic Development 18, no. 4:505–525.
Crinò, R., and P. Epifani. 2008. “Productivity and Export Intensity to High-Income and Low-
Income Countries.” mimeo, Bocconi University, Milan.
Crinò, R., and P. Epifani. 2010. “Productivity, Product Quality and Export Intensities.” mimeo,
Bocconi University, Milan.
Deaton, A. 1997. The analysis of household surveys: a microeconometric approach to development
policy. London: J. Hopkins University Press.
Dulleck, U., N. Foster, R. Stehrer and J. Woerz. 2005. “Dimensions of Quality Upgrading.
Evidence from CEECs.” Economics of Transition 13, no. 1:51-76.
Esposito, P., and R. Stehrer. 2009. “The Sector Bias of Skill-Biased Technical Change and the
Rising Skill Premium in Transition Economies.” Empirica 36, no. 3:351-364.
Fabrizio, S., D. Igan and A. Mody. 2007. “The Dynamics of Product Quality and International
Competitiveness.” IMF Working Paper no. 97, April.
Flam, H., and E. Helpman. 1987. “Vertical Product Differentiation and North-South Trade.”
American Economic Review, 77, no. 5:810–822.
Grossman, G.M., and E. Helpman. 1991. Innovation and Growth in the Global Economy.
Cambridge MA: MIT Press.
Hallak, J.C. 2006. “Product Quality and the Direction of Trade.” Journal of International
Economics 68 no. 1:238-265.
Hallak, J.C. 2010. “A Product-quality view of the Linder Hypothesis.” The Review of Economics
and Statistics XCII, no. 3:453-466.

31
Hallak, J.C., and P.K. Schott. 2011. “Estimating Cross-Country Differences in Product Quality.”
Quarterly Journal of Economics 126, no. 1:417-474.
Hummels, D., and P.J. Klenow. 2005. “The Variety and Quality of a Nation's Exports.” American
Economic Review 95, no. 3:704-723.
Keller, W. 2004. “International Technology Diffusion.” Journal of Economic Literature 42, no.
3:752-782.
Landesmann, M.; S. Leitner; R. Stehrer; and T. Ward. 2009. “Skills and Industrial
Competitiveness.” WIIW Research Report no. 356.
Léon-Ledesma, M.A. 2005. “Exports, Product Differentiation and Knowledge Spillovers.” Open
Economies Review 16, no. 4:363-379.
Linder, S. 1961. An Essay on Trade and Transformation. Stockholm: Almqvist and Wiksell.
Murphy, K., and A. Shleifer. 1997. “Quality and Trade”. Journal of Development Economics 53,
no. 1:1–15.
Nielsen, J.U.M., and T. Lüthje. 2002. “Test of Empirical Classifications of Horizontal and Vertical
Intra Industry Trade.” Review of World Economics 138, no. 4:587-604.
Schott, P. 2004. “Across-Product versus Within-Product Specialization in International Trade.” The
Quarterly Journal of Economics 119, no. 2:647-678.
Smulders, S. 2004. “International capital market integration: Implications for convergence, growth
and welfare.” International Economics and Economic Policy 1, no. 2-3:173-194.
Stokey, N.L. 1991. “The Volume and Composition of Trade Between Rich and Poor Countries.”
Review of Economic Studies 58, no. 1:63-80.
van Pottelsberghe de la Potterie, B., and F. Lichtenberg. 2001. “Does Foreign Direct Investment
Transfer Technology across Borders?” Review of Economics and Statistics 83, no. 3:490-
497.
Verhoogen, E.A. 2008. “Trade, Quality Upgrading, and Wage Inequality in the Mexican
Manufacturing Sector.” Quarterly Journal of Economics 123, no. 2:489-530.

32
Appendix - Solution to the consumer’s static maximization problems.
A) Allocation of expenditure for each product across quality levels
In the first stage of utility maximization each consumer h allocates expenditure within-product
quality levels, and , by solving the following static problem:
nHHC
CqH
,(..)
max for Nn ,.....,1
s.t.
nHnH
h
n CPE ,,
and
nFFC
CqF
,(..)
max
for Nn ,.....,1
s.t. *
,,
nFnF
h
nCPE
where h
nE and h
nE
are consumer’s expenditures in advanced domestic and foreign industries n and
n , respectively, at time t, with h
n n
h
n
h
n EEE
, and where nHP , and nFP
, are the prices
of the brands and , and hE is consumer’s expenditure on advanced products.
For any good n, utility maximization implies a positive demand only for the brand h
nHC ,̂ that
carries the lowest quality-adjusted price:
),ˆ
,ˆ
nH
nh
nHP
EC
,
0, h
nHC for all vintages ˆ .
where nHP ,̂ is the price of the brand ̂ that carries the lowest quality-adjusted price.
The consumer is thus indifferent between quality vintages and 1 of any domestic product n if
and only if
nH
nH
P
P
,1
,, where
1
H
H
q
q is the increase in quality between two successive
vintages. Same reasoning applies to choice among quality vintages of any foreign product n .

33
B) Allocation of expenditure across (state-of-the-art) products
In the second stage, each consumer optimally allocates expenditure across the N domestic and N
foreign (state-of-the-art) advanced products. The demand function in equation (9) follows from the
solution to the following static optimization programme:
AAA
FH n nnFFnHH
CCCqCq
1
),ˆ(ˆ,ˆˆ, ....
max
s.t.
*ˆ *,ˆ,ˆ
ˆ
,ˆ,ˆ
n
nFnF
n
nHnH
h CPCPE
where nFC
,̂ is the demand of the foreign brand ̂ that carries the lowest quality-adjusted price,
and nFP
,̂ its price. The foreign consumer demand function for any domestic advanced product in
equation (14) is obtained by solving an optimization problem analogous to the one above.

34
Pubblicato in proprio
Dipartimento di Economia Pubblica
Facoltà di Economia
Università degli Studi di Roma “La Sapienza”
Via del Castro Laurenziano 9 – 00161 Roma
ISSN 1974-2940

35
Working Paper del Dipartimento di Economia Pubblica
Università degli studi di Roma “La Sapienza”
Via del Castro Laurenziano 9 – 00161 Roma
COMITATO SCIENTIFICO
Eleonora Cavallaro
Giuseppe Croce
Debora Di Gioacchino
Maurizio Franzini
Luisa Giuriato
Domenico Mario Nuti
Antonio Pedone
Enrico Saltari
Annamaria Simonazzi
The Working Papers Series of the Department of Public Economics is an electronic publication intended to allow scholars to present findings of their research activity. Submitted papers contain original, unpublished work, and represent a contribution to economic literature, from any field in economics, in the theoretical, historical and empirical perspectives. Submitted papers are subjected to double blind peer review. The Working Papers Series is catalogued in the Research Papers in Economics (RePEc) Archives, and available under Creative Commons license 3.0, Attribution- Noncommercial-No derivative work. References to the Department's Working Papers must include: the author's name, the title of the working paper and the link to the working paper.
I Working Paper del Dipartimento di Economia Pubblica ottemperano agli obblighi previsti dall’art. 1 del D.L.:
31.8.45 n. 660 e dal Decreto del Presidente della Repubblica 3 maggio 2006 n.252, art.37.