worldwide lifecycle analysis of greenhouse gas … october 2015/session 4/speth... · worldwide...
TRANSCRIPT
Worldwide Lifecycle Analysis of Greenhouse Gas Emissions from Petroleum Fuels Raymond Speth, Pooya Azadi, Robert Malina CRC Workshop, Argonne National Laboratory October 28, 2015
Website: LAE.MIT.EDU
2
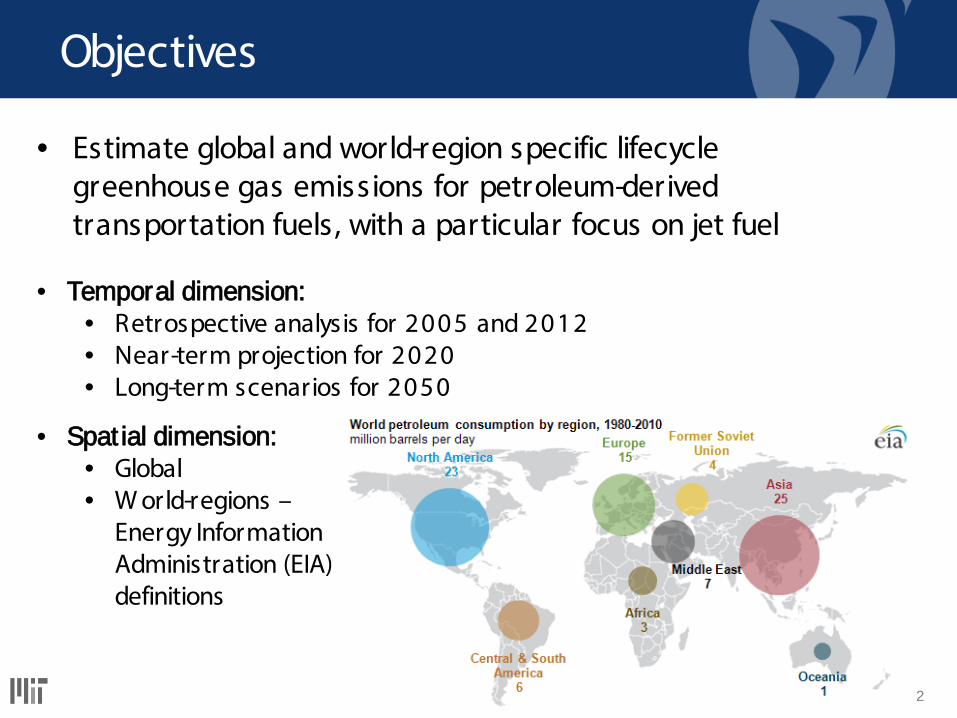
Objectives
• Estimate global and world-region specific lifecycle greenhouse gas emissions for petroleum-derived transportation fuels, with a particular focus on jet fuel
• Temporal dimension: • Retrospective analysis for 2005 and 2012 • Near-term projection for 2020 • Long-term scenarios for 2050
• Spat ial dimension: • Global • W orld-regions –
Energy Information Administration (EIA) definitions
3
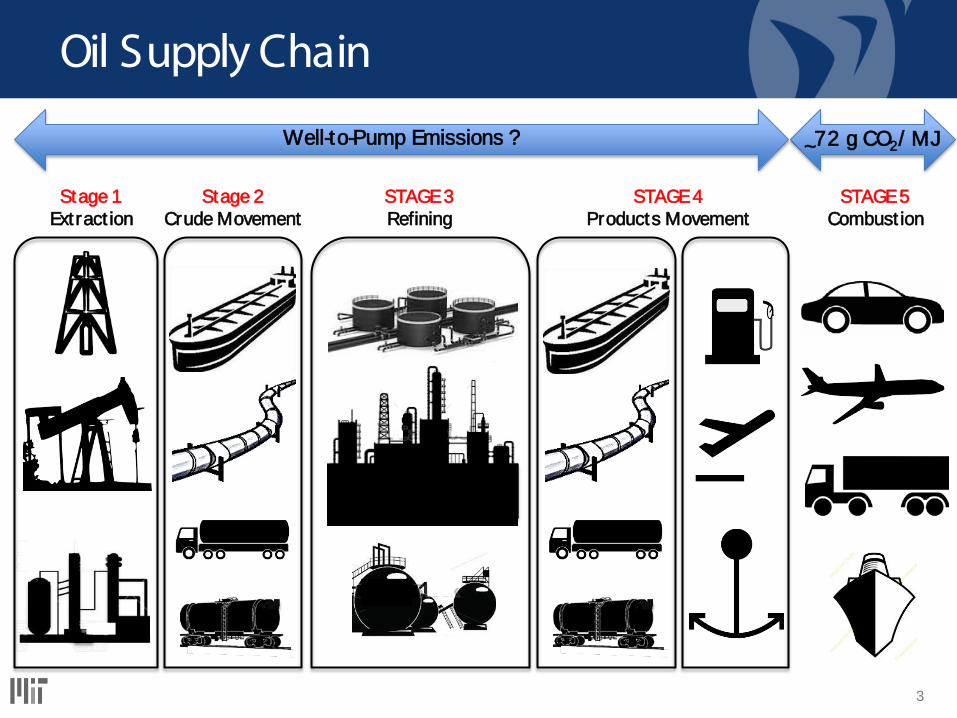
Oil Supply Chain
Stage 1 Extract ion
Stage 2 Crude Movement
STAGE 3 Refining
STAGE 4 Products Movement
STAGE 5 Combust ion
Well-to-Pump Emissions ?
~72 g CO2/ MJ

4
Challenges
• Large number of (small) emissions across a wide range of activities
• W ide range of technologies used for the same task • W ide geographical distribution:
• Crude is produced in 91 countries • Refined products are produced in 112 countries • Refined products are used in 218 countries/ territories
• Scarcity, sparsity, and aggregation of data: • W ell and reservoir characteristics • Crude grades produced/ consumed • Refinery intake streams and outputs • Variation in outputs of refinery units • Import/ export data of crude and refined products
5
Approach
• Data collection from many sources
• Estimation of missing data points based on regional or world averages when specific values are not available
• Categorization based on best practice
• Aggregation of data at country level
• Inferences based on material balances
• Uncertainty analysis

6
Emission Sources Included in LCA
Drilling Prime movers Hydraulic fracturing Mining Art ificial Lift Rod pumps Gas lift Surface Processing Heater/ treater Crude stabilizer W astewater treatment W ater re-injection Flaring, venting, fugitive Enhanced Oil Recovery CO2 flooding Steam injection Gas injection
1. Product ion
Transportat ion Mode Tankers Pipeline Rail Trucks Barge
2. Crude Movement
Transportat ion Mode Tankers Pipeline Rail Trucks Barge
4. Product Movement
Dist illat ion Atmospheric Vacuum Reforming Hydrotreat ing Catalyt ic Cracking FCC Hydrocracking Thermal Cracking Vis breaking Coking Alkylat ion Isomerizat ion Cogenerat ion
3. Refining
Additional factors: Land use change (vegetation & soil carbon), flaring & fugitive emissions, VOC emissions
FCC: Fluid Catalytic Cracking VOC: Volatile Organic Compounds

7
Data Inventory
Crude & NGL production, consumption, trade
Crude assays Type of oil fields
(conventional/ heavy/ tight/ oil sands), by field
Location of (major) oil fields,
Number of active rigs Number, average
depth of producing wells drilled
Gas-to-oil and water-to-oil ratios, by country
Gas flaring Enhanced oil recovery
practices
1. Product ion 2. Crude Movement
4. Product Movement 3. Refining
Crude pipelines length and diameter
Tanker fleet size and age distributions
Intra-country movements of crude by rail, truck, and barge
Refined products pipelines length and diameter
Tanker fleet size and age distributions
Intra-country movements of refined products by rail, truck, and barge
Refinery intake (crude, NGL, unfinished oils, oxygenates, additives)
Refinery unit capacities
Refined products slate, consumption, trade
Emission factors for electricity, hydrogen, heat, steam, natural gas, and other fuels
NGL: Natural Gas Liquids EOR: Enhanced Oil Recovery

8
Refinery Emissions: Methods
• Refinery by refinery process unit capacity data was collected and
compiled from various sources (Global Data, BP, Oil & Gas J ournal,
OPEC, etc.).
• Data includes 18 process types in 687 refineries, corresponding to
full coverage of the global refining capacity.
• The inputs to the model include: • Refinery by refinery unit capacities • Process unit heat, steam, electricity, and hydrogen consumption/ generation • Emission indices of utilities and hydrogen • Process unit output mix • Refinery utilization factors • Average refinery fuel use by each country • Crude grades refined in each country, based on production and import data • Country’s product slate
9
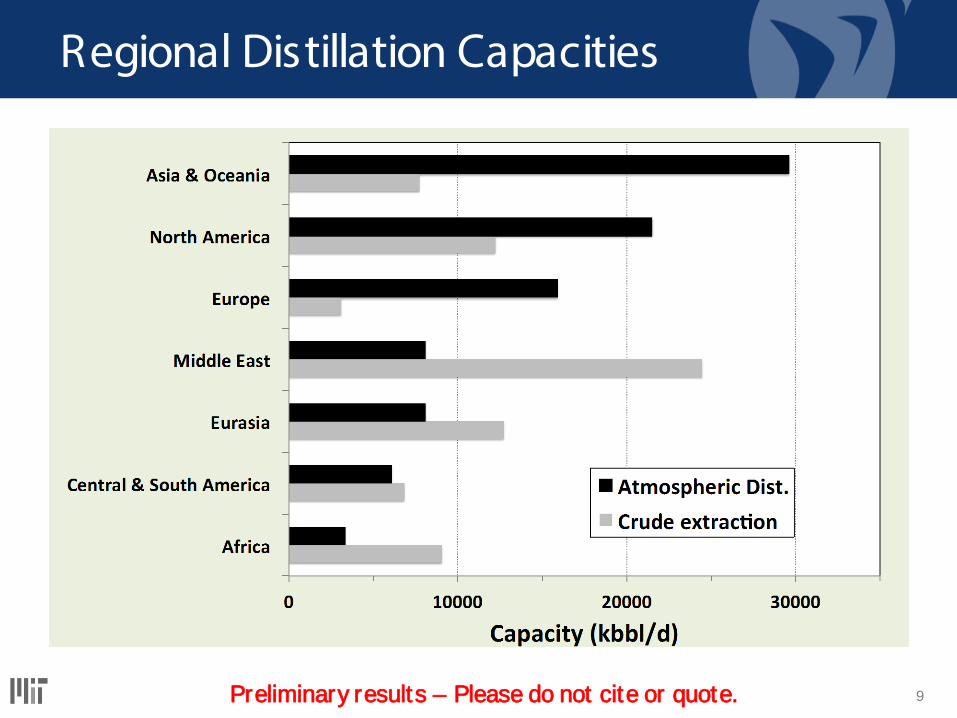
Regional Distillation Capacities
Preliminary results – Please do not cite or quote.

10
Regional Secondary Process Capacities
Preliminary results – Please do not cite or quote.
11
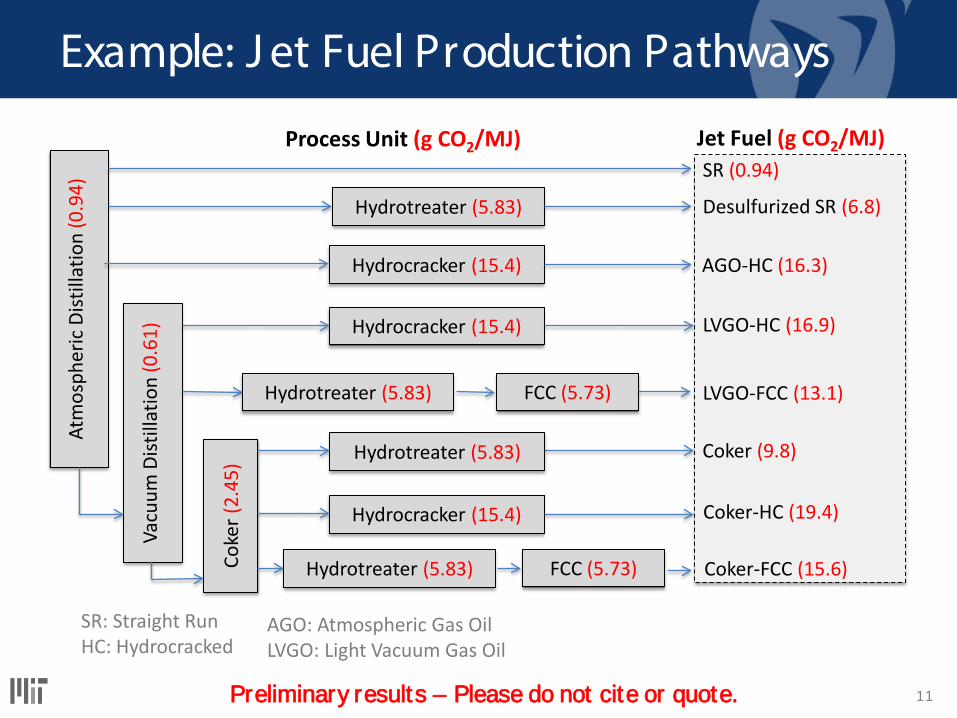
Example: J et Fuel Production Pathways At
mos
pher
ic D
istill
atio
n (0
.94)
SR (0.94)
Hydrotreater (5.83) Desulfurized SR (6.8)
Vacu
um D
istill
atio
n (0
.61)
Hydrocracker (15.4)
FCC (5.73)
LVGO-HC (16.9)
LVGO-FCC (13.1)
Coke
r (2.
45) Coker (9.8)
Hydrocracker (15.4) AGO-HC (16.3)
Coker-HC (19.4)
Coker-FCC (15.6)
Hydrotreater (5.83)
FCC (5.73) Hydrotreater (5.83)
Hydrocracker (15.4)
Hydrotreater (5.83)
Jet Fuel (g CO2/MJ) Process Unit (g CO2/MJ)
Preliminary results – Please do not cite or quote.
SR: Straight Run HC: Hydrocracked
AGO: Atmospheric Gas Oil LVGO: Light Vacuum Gas Oil
12
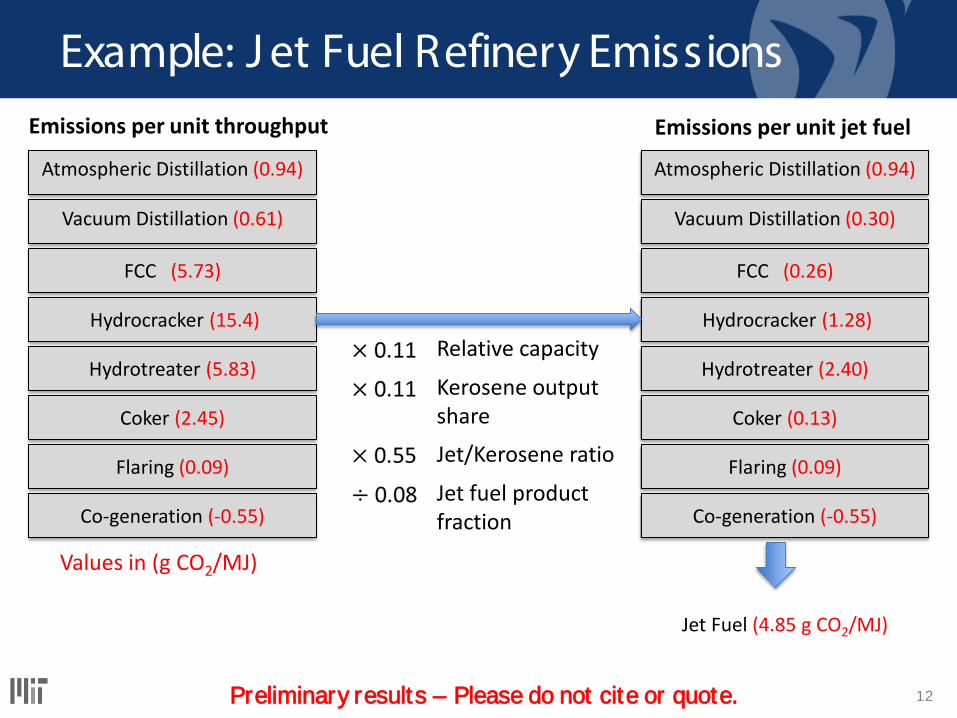
Example: J et Fuel Refinery Emissions
Jet Fuel (4.85 g CO2/MJ)
Values in (g CO2/MJ)
Hydrotreater (2.40)
FCC (0.26)
Atmospheric Distillation (0.94)
Vacuum Distillation (0.30)
Coker (0.13)
Co-generation (-0.55)
Flaring (0.09)
Hydrocracker (1.28)
Hydrotreater (5.83)
FCC (5.73)
Atmospheric Distillation (0.94)
Vacuum Distillation (0.61)
Coker (2.45)
Co-generation (-0.55)
Flaring (0.09)
Hydrocracker (15.4)
Emissions per unit throughput Emissions per unit jet fuel
Relative capacity
Kerosene output share
Jet/Kerosene ratio
Jet fuel product fraction
Preliminary results – Please do not cite or quote.

13
Straight-Run & Cracked MD
Component North America Europe World
(mmbbl/ d) SR Cracked SR Cracked SR Cracked
Middle distillates 5 .3 4 .2 4 .0 1 .7 23.0 12.0
- Kerosene (intermediate) 2 .4 0 .5 1 .8 0 .2 10.5 1 .5
- J et fuel (product) 1 .6 0 .8 5 .4
- Kerosene (product) 0 .0 0 .2 1 .5
Straight-run (SR) middle dist illate cuts: • Naphtha/ Kerosene swing • Kerosene • Kerosene/ Diesel swing • Diesel • Light VGO
Cracked middle dist illate from: • FCC • Hydrocracker • Coking • Visbreaker
Preliminary results – Please do not cite or quote.

14
Regional Material Balance
Region A
Region B
Region C
Crude product ion
Region A
Region B
Region C
Refineries Consumpt ion
Region A
Inte
r-re
gion
al
Intra-region
• Objective is to calculate the emission of petroleum fuels consumed at each
world region.
• Follow EIA’s definition of world regions, i.e. North America, Central and
South America, Europe, Eurasia, Africa, Middle East, Asia and Oceania.
15
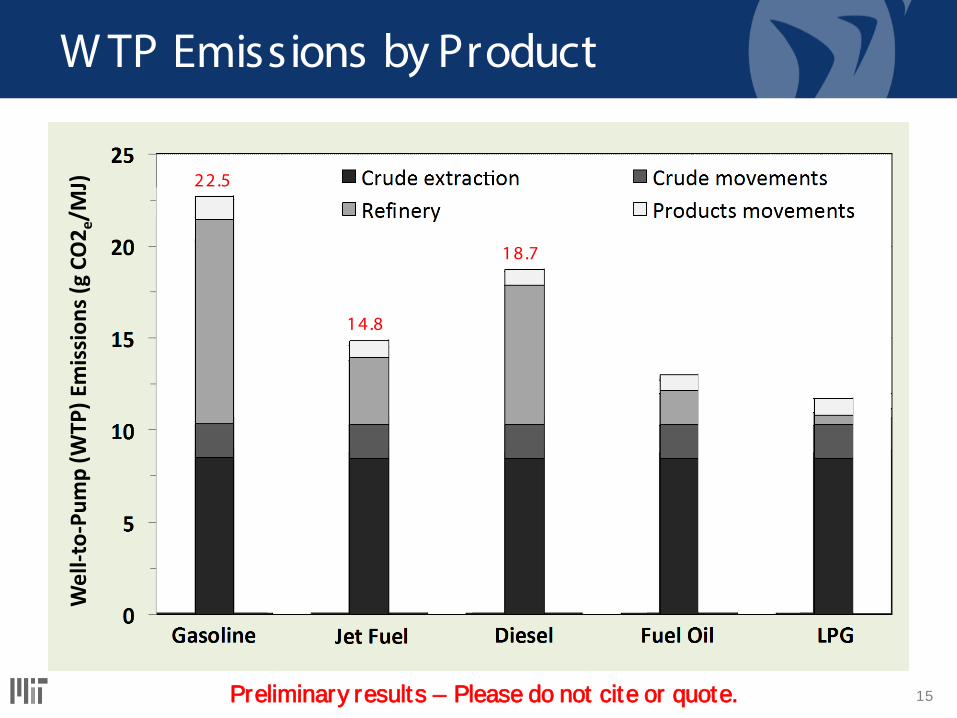
W TP Emissions by Product
Preliminary results – Please do not cite or quote.
18.7
14 .8
22 .5
Wel
l-to-
Pum
p (W
TP) E
mis
sion
s (g
CO2 e/
MJ)
16
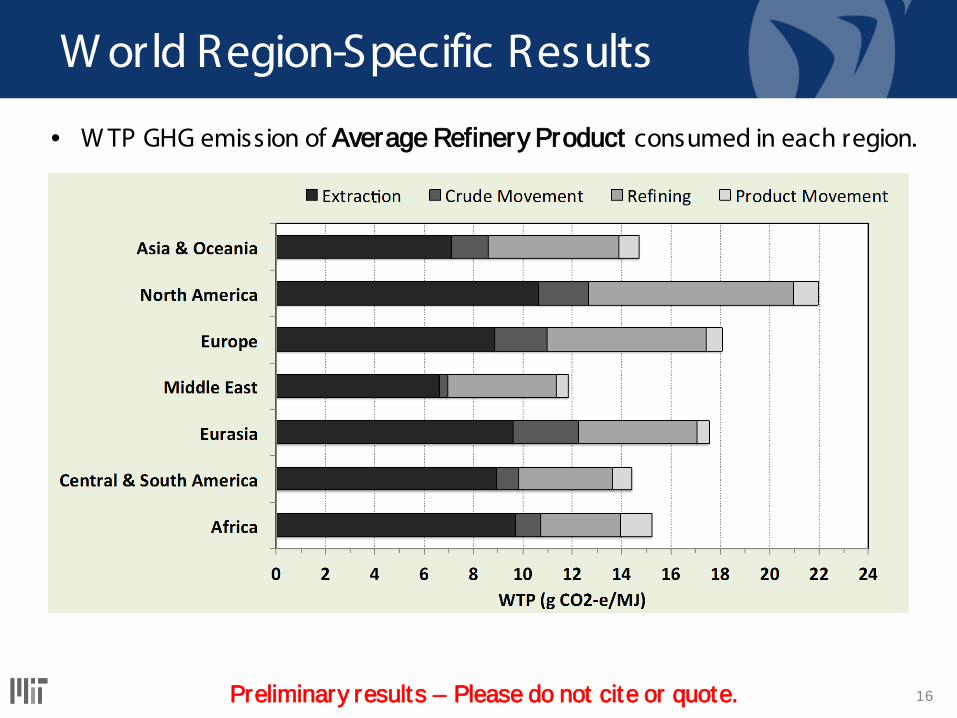
W orld Region-Specific Results
• W TP GHG emission of Average Refinery Product consumed in each region.
Preliminary results – Please do not cite or quote.
17
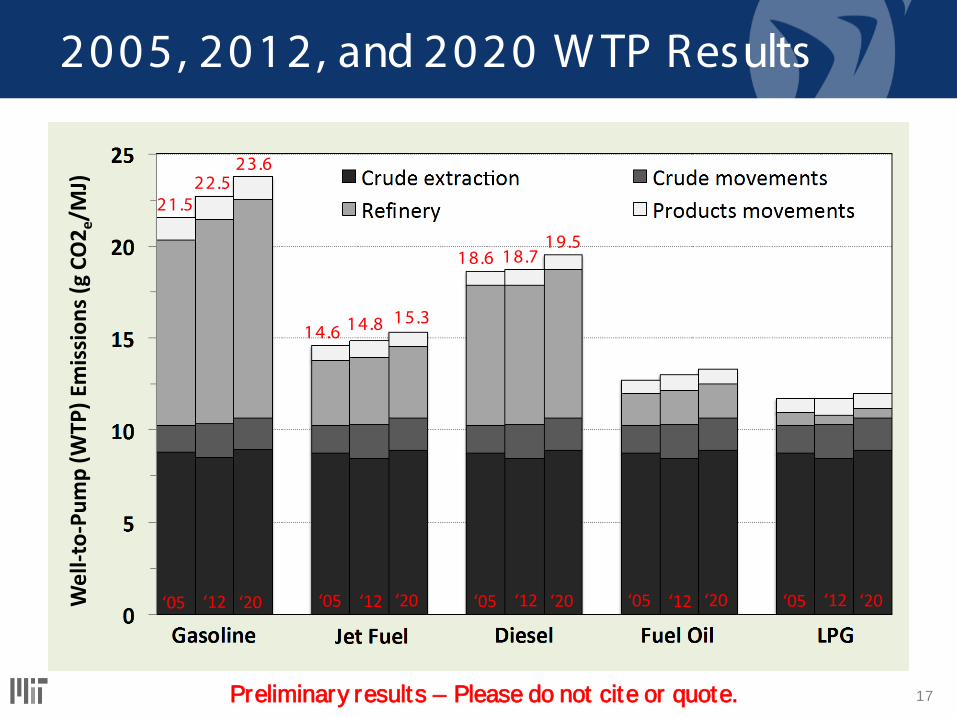
2005, 2012, and 2020 W TP Results
14.6 14 .8 15 .3
21 .5 22 .5
23 .6
18 .6 18 .7 19 .5
Preliminary results – Please do not cite or quote.
‘05 ‘12 ‘20 ‘05 ‘12 ‘20 ‘05 ‘12 ‘20 ‘05 ‘12 ‘20 ‘05 ‘12 ‘20 Wel
l-to-
Pum
p (W
TP) E
mis
sion
s (g
CO2 e/
MJ)

18
Sensitivity Analysis
Preliminary results – Please do not cite or quote.

19
Next Steps
• Product-specific uncertainty analysis
• Scenarios for global and word-region-specific emissions
in 2050
• Opportunities for reductions of GHG emissions from
petroleum-derived transportation fuels
20
Acknowledgments
• This work was sponsored by the FAA through the ASCENT Center of Excellence (Project 32)
• W ork presented may not represent the views of the FAA

21
Raymond Speth, Pooya Azadi, Robert Malina [email protected] W ebsite: LAE.MIT.EDU
Laboratory for Aviation and the Environment Massachusetts Institute of Technology
22
Glossary
• AGO: Atmospheric Gas Oil • EOR: Enhanced Oil Recovery • FCC: Fluid Catalytic Cracking • HC: Hydrocracker • LPG: Liquefied Petroleum Gas • LVGO: Light Vacuum Gas Oil • NGL: Natural Gas Liquids • OGJ : Oil & Gas J ournal • OPEC: Organization of Petroleum Exporting Countries • PTW : Pump to W heels/ W ake • SR: Straight Run • VGO: Vacuum Gas Oil • W TP: W ell to Pump • W TW : W ell to W heels/ W ake
23
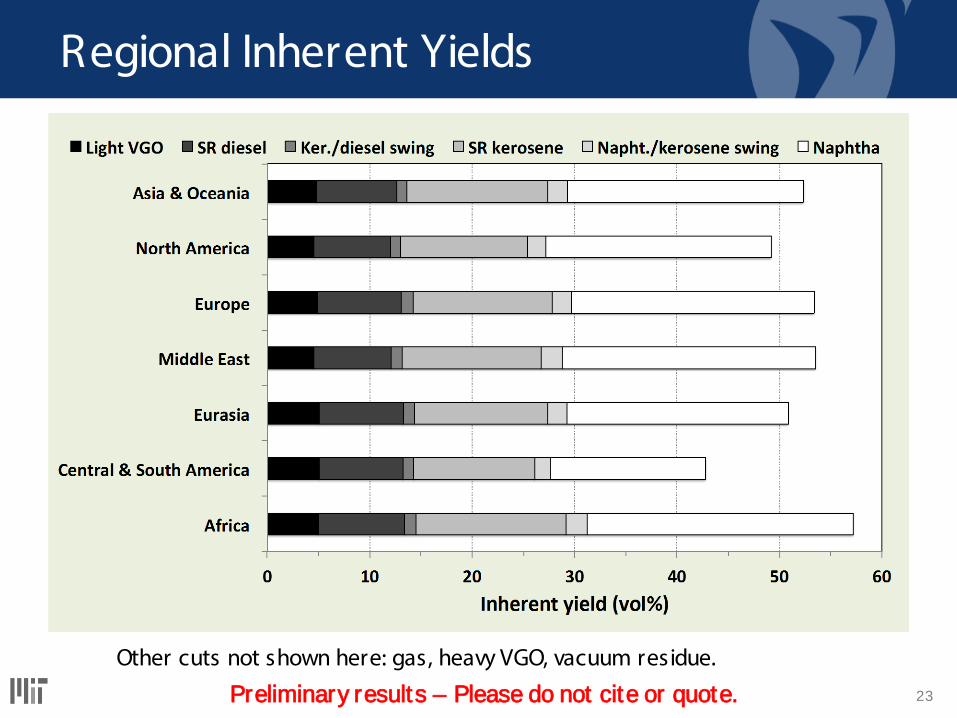
Regional Inherent Yields
Other cuts not shown here: gas, heavy VGO, vacuum residue.
Preliminary results – Please do not cite or quote.

24
Refinery Emission: Methods
• Ut ility consumpt ion and emission factors
Product-specific refinery emission
Process unit emission
• Refinery unit capacity
Process unit emission per bbl throughput
• Process unit GHG allocat ion factors Product-specific process unit
emission
• Adding up emissions from all refinery units
• Adding up emissions from all refineries in each country
Product-specific country emission
• Country’s refined product slate Product-specific country emission
per MJ

25
2005
Preliminary results – Please do not cite or quote.

26
2012
Preliminary results – Please do not cite or quote.

27
2020
Preliminary results – Please do not cite or quote.
28
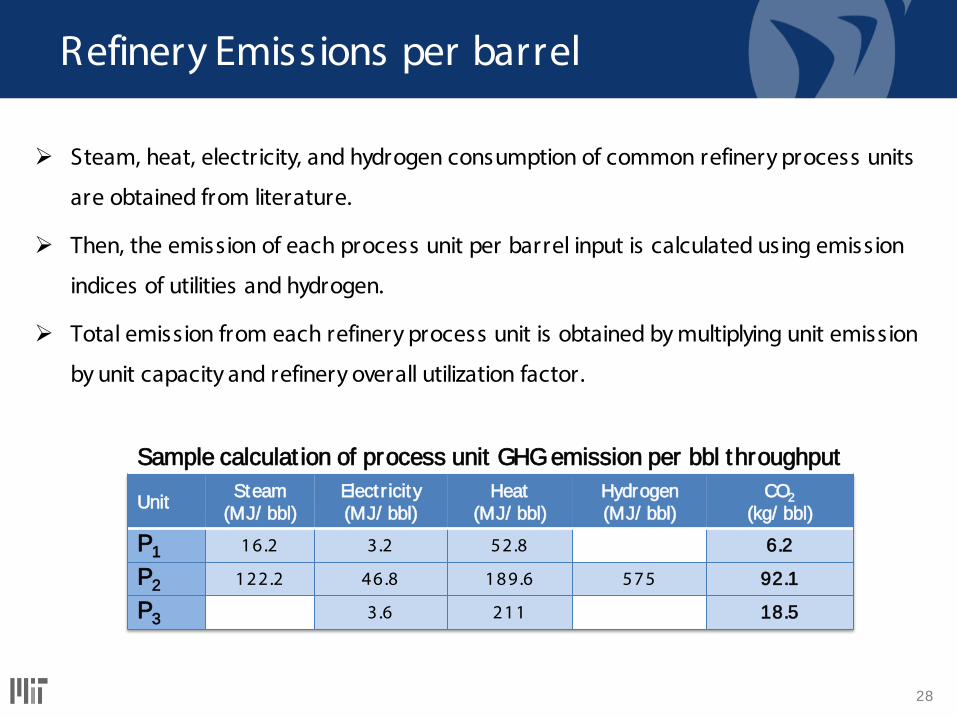
Refinery Emissions per barrel
Unit Steam (MJ/ bbl)
Elect ricity (MJ/ bbl)
Heat (MJ/ bbl)
Hydrogen (MJ/ bbl)
CO2
(kg/ bbl)
P1 16.2 3 .2 52 .8 6.2
P2 122.2 46 .8 189.6 575 92.1
P3 3.6 211 18.5
Sample calculat ion of process unit GHG emission per bbl throughput
Steam, heat, electricity, and hydrogen consumption of common refinery process units
are obtained from literature.
Then, the emission of each process unit per barrel input is calculated using emission
indices of utilities and hydrogen.
Total emission from each refinery process unit is obtained by multiplying unit emission
by unit capacity and refinery overall utilization factor.

29
Refinery Emission Allocation Factors
Unit Gasoline Jet fuel Diesel Fuel oil LPG Others
a1 Relative to final product slate
a2 10% 5% 45% 10% 30%
a3 100%
Sample GHG allocat ion factors based on unit output mix
Emissions / credits at process unit level are allocated to different products based on
the ultimate use of the output mix from that unit.
The basis for the GHG allocation can be energy content, volume, mass, or economic
value of the products.
Inherent yields from crude assays are used to estimate straight-run yields and make
adjustment for the final product slate.
30
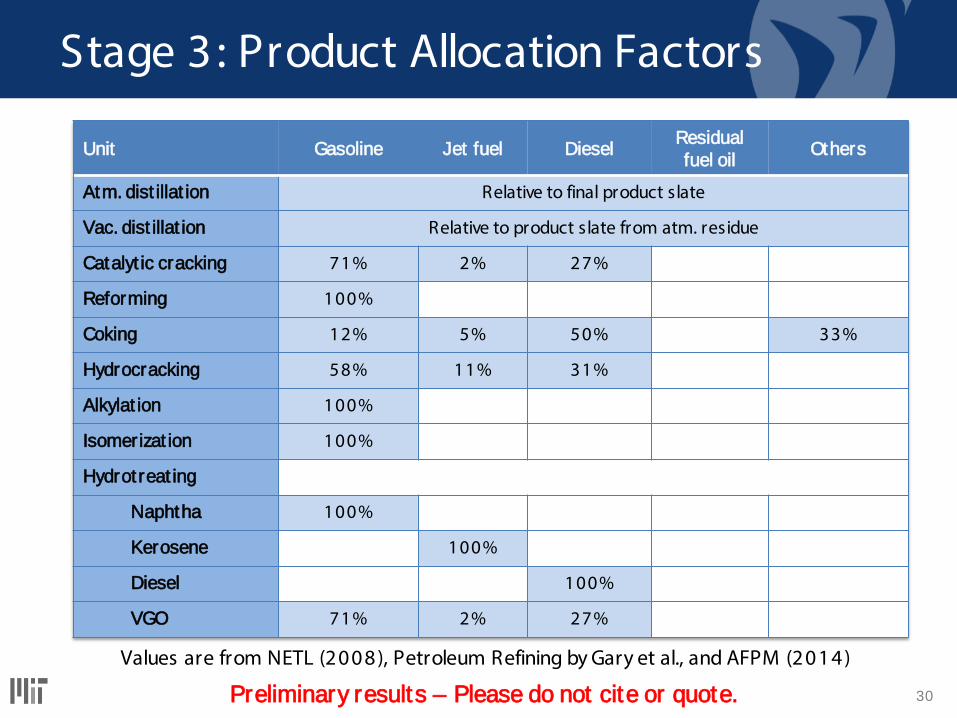
Stage 3 : Product Allocation Factors
Unit Gasoline Jet fuel Diesel Residual fuel oil Others
Atm. dist illat ion Relative to final product slate
Vac. dist illat ion Relative to product slate from atm. residue
Catalyt ic cracking 71% 2% 27%
Reforming 100%
Coking 12% 5% 50% 33%
Hydrocracking 58% 11% 31%
Alkylat ion 100%
Isomerizat ion 100%
Hydrotreat ing
Naphtha 100%
Kerosene 100%
Diesel 100%
VGO 71% 2% 27%
Values are from NETL (2008), Petroleum Refining by Gary et al., and AFPM (2014)
Preliminary results – Please do not cite or quote.

31
Commercial Crudes Production volume and properties of commercial crudes produced by each country are needed
to calculate the properties of crude produced (and consumed) within each region.
Current database include production volume, density (API) , and sulfur content of 187 commercial crudes, covering ~90% of global production.

32
Inherent Yields of Commercial Crudes
cont.
cont.
Crude assays were obtained from Aspen PIMS library.
Country-specific yields Region-specific yields weighted average
weighted average

33
Comparison with NETL
Preliminary results – Please do not cite or quote.