wsu ppt building district data capacity
DESCRIPTION
TRANSCRIPT
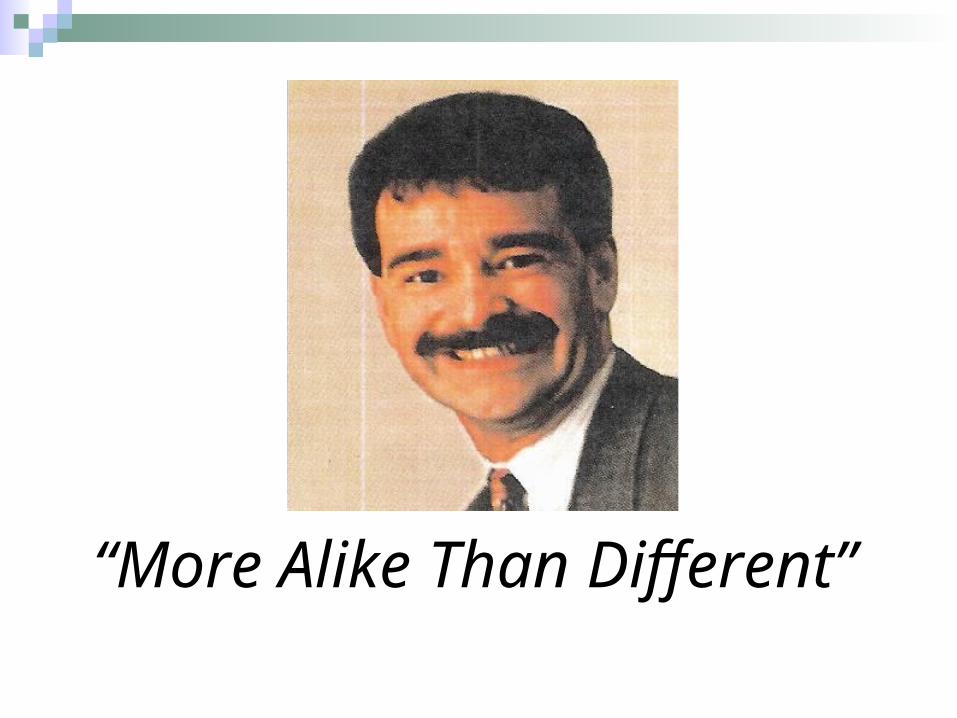
“More Alike Than Different”
Lee Bussard
1. Who are you?
2. Where are you going?
3. What do you have to declare?
Things to think about . . . What do you believe to be true in
education, but cannot prove? What would have to happen for you to
have your best year ever? What is the WOW factor in your
classroom? School? District? This I believe. . . What do you
believe?
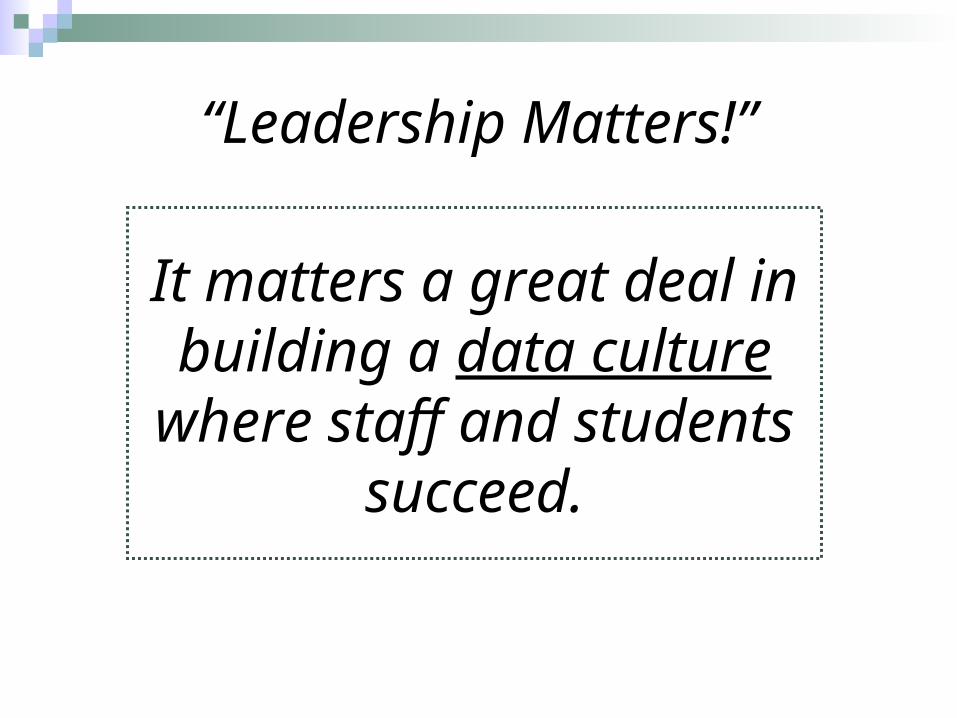
“Leadership Matters!”
It matters a great deal in building a data culture
where staff and students succeed.
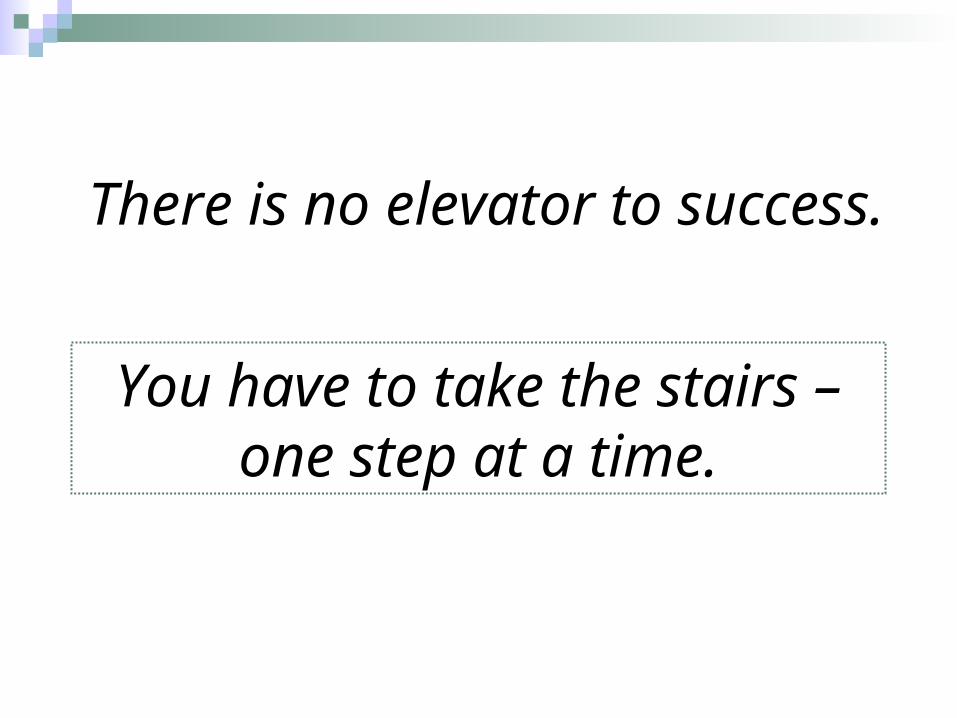
There is no elevator to success.
You have to take the stairs – one step at a time.
Components of a Well-Crafted
District-wide System of Support
Education Alliance at Brown University “Leadership Capacities for a Changing Environment” (2005)
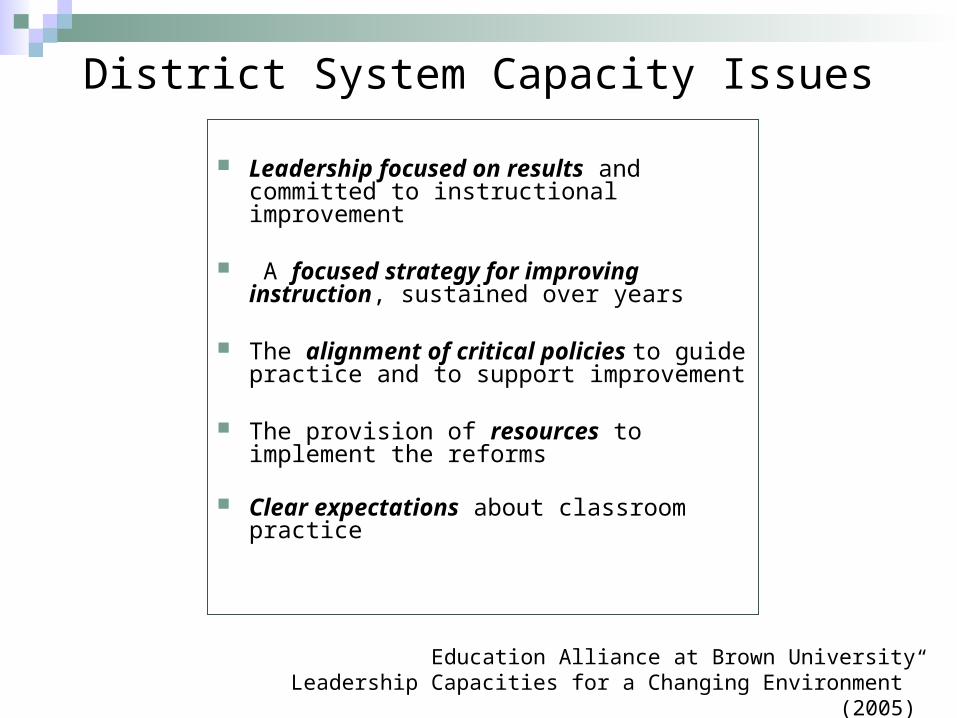
District System Capacity Issues
Leadership focused on results and committed to instructional improvement
A focused strategy for improving instruction, sustained over years
The alignment of critical policies to guide practice and to support improvement
The provision of resources to implement the reforms
Clear expectations about classroom practice
Education Alliance at Brown UniversityLeadership Capacities for a Changing Environment” (2005)
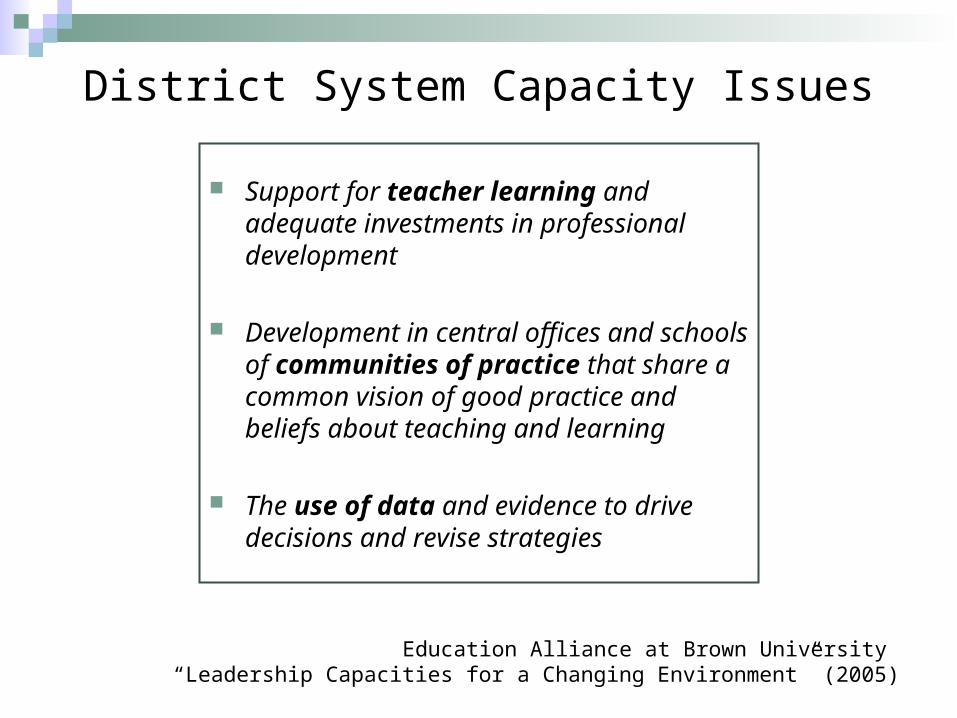
District System Capacity Issues
Support for teacher learning and adequate investments in professional development
Development in central offices and schools of communities of practice that share a common vision of good practice and beliefs about teaching and learning
The use of data and evidence to drive decisions and revise strategies
Education Alliance at Brown University “Leadership Capacities for a Changing Environment” (2005)
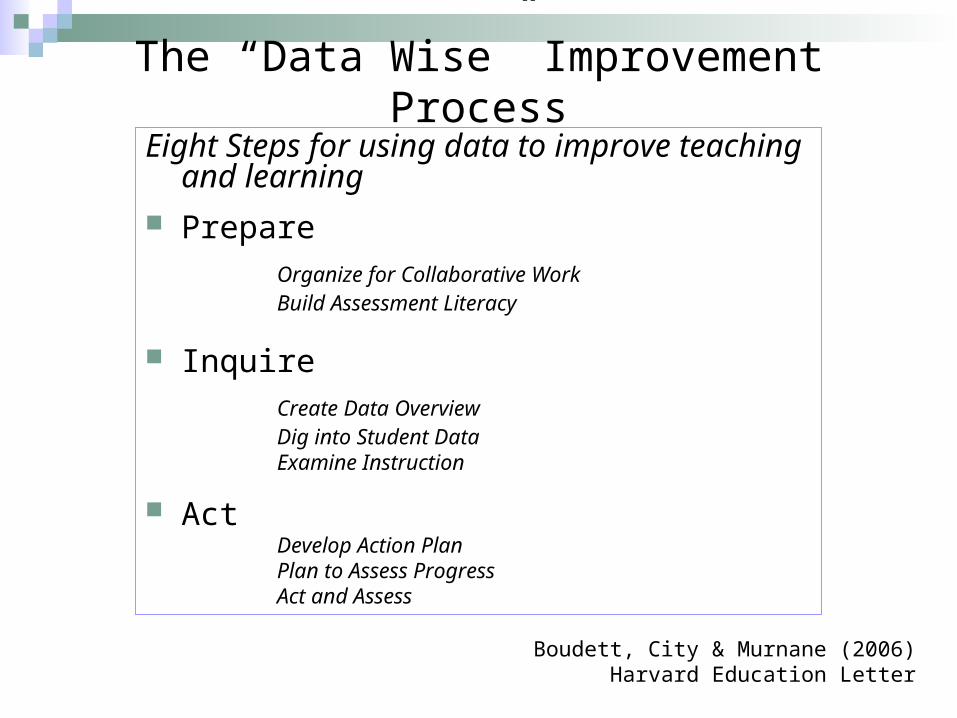
The “Data Wise” Improvement Process
Eight Steps for using data to improve teaching and learning
PrepareOrganize for Collaborative WorkBuild Assessment Literacy
InquireCreate Data OverviewDig into Student DataExamine Instruction
ActDevelop Action PlanPlan to Assess ProgressAct and Assess
Boudett, City & Murnane (2006)Harvard Education Letter
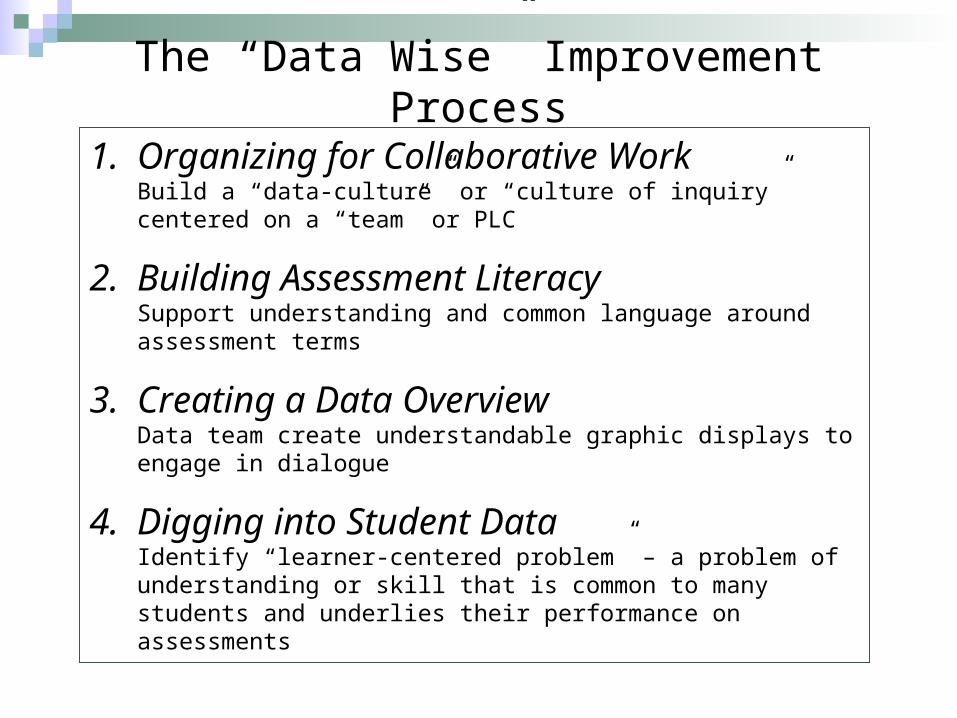
The “Data Wise” Improvement Process
1. Organizing for Collaborative WorkBuild a “data-culture” or “culture of inquiry” centered on a “team” or PLC
2. Building Assessment LiteracySupport understanding and common language around assessment terms
3. Creating a Data Overview Data team create understandable graphic displays to engage in
dialogue
4. Digging into Student DataIdentify “learner-centered problem” – a problem of understanding or skill that is common to many students and underlies their performance on assessments
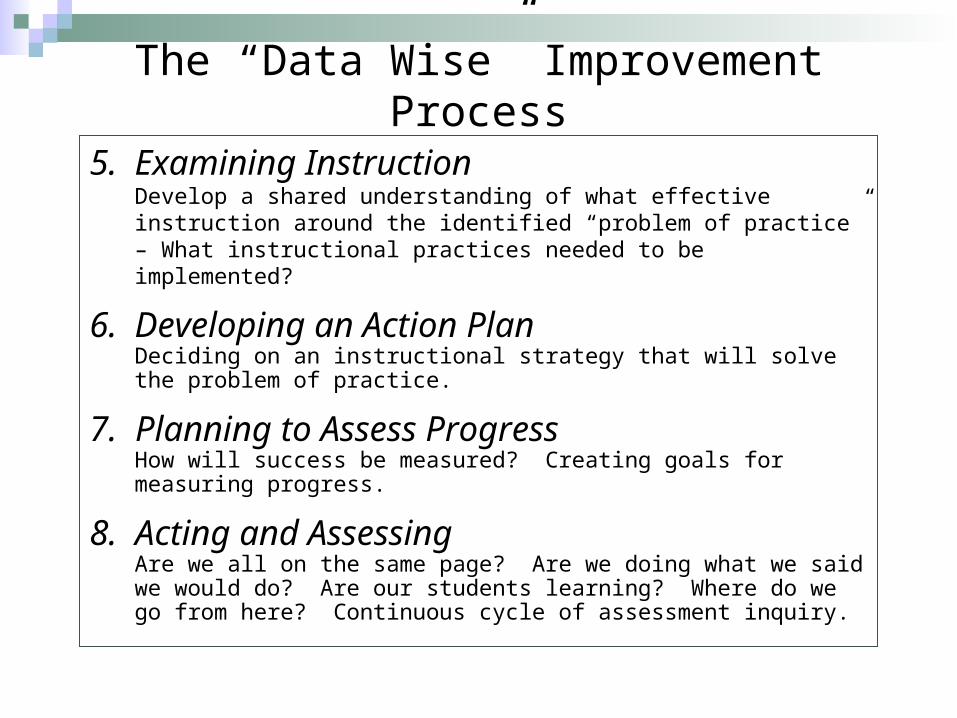
The “Data Wise” Improvement Process
5. Examining InstructionDevelop a shared understanding of what effective instruction around the identified “problem of practice” – What instructional practices needed to be implemented?
6. Developing an Action PlanDeciding on an instructional strategy that will solve the problem of practice.
7. Planning to Assess ProgressHow will success be measured? Creating goals for measuring progress.
8. Acting and AssessingAre we all on the same page? Are we doing what we said we would do? Are our students learning? Where do we go from here? Continuous cycle of assessment inquiry.
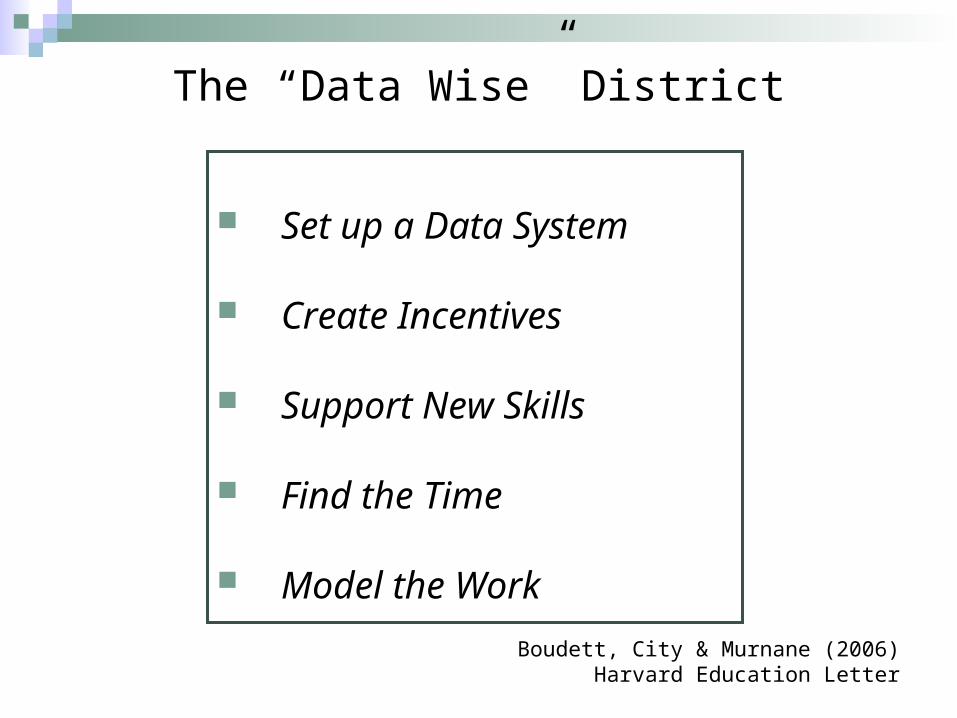
The “Data Wise” District
Set up a Data System
Create Incentives
Support New Skills
Find the Time
Model the Work
Boudett, City & Murnane (2006)Harvard Education Letter

All birds have wings – the difference is some fly, while others walk.
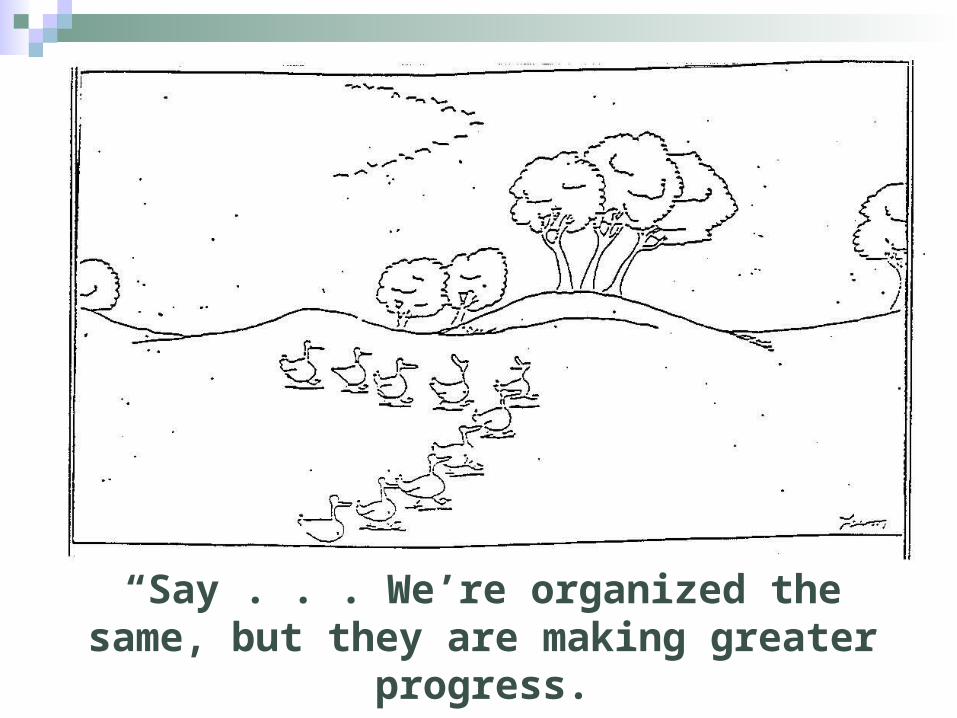
“Say . . . We’re organized the same, but they are making greater progress.
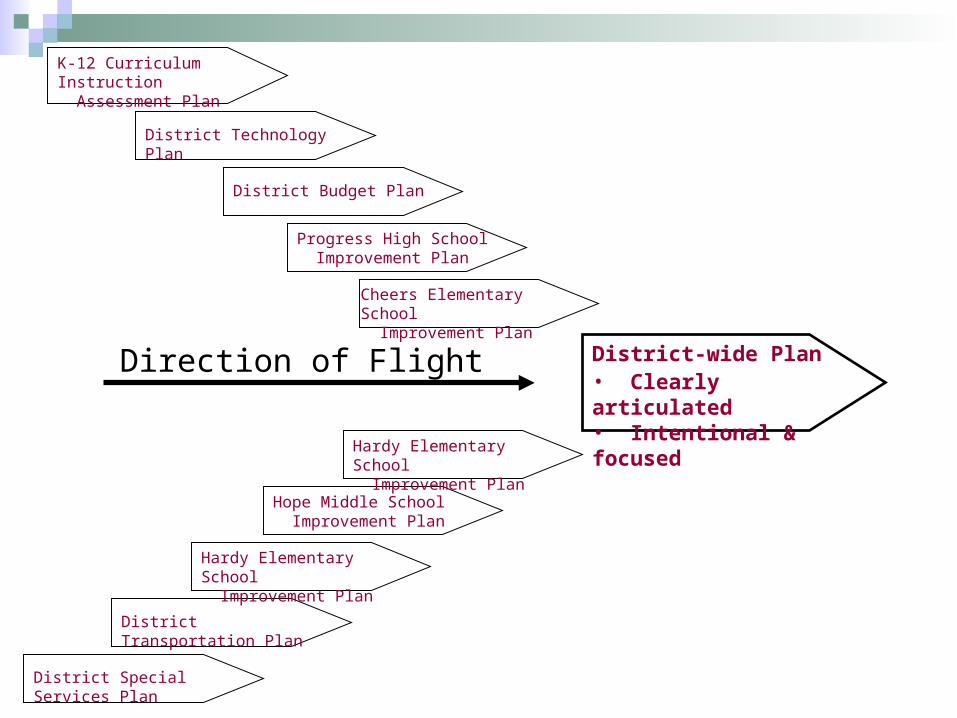
K-12 Curriculum Instruction Assessment Plan
Direction of Flight District-wide Plan• Clearly articulated• Intentional & focused
District Technology Plan
District Budget Plan
Progress High School Improvement Plan
Cheers Elementary School Improvement Plan
Hope Middle School Improvement Plan
Hardy Elementary School Improvement Plan
Hardy Elementary School Improvement Plan
District Transportation Plan
District Special Services Plan
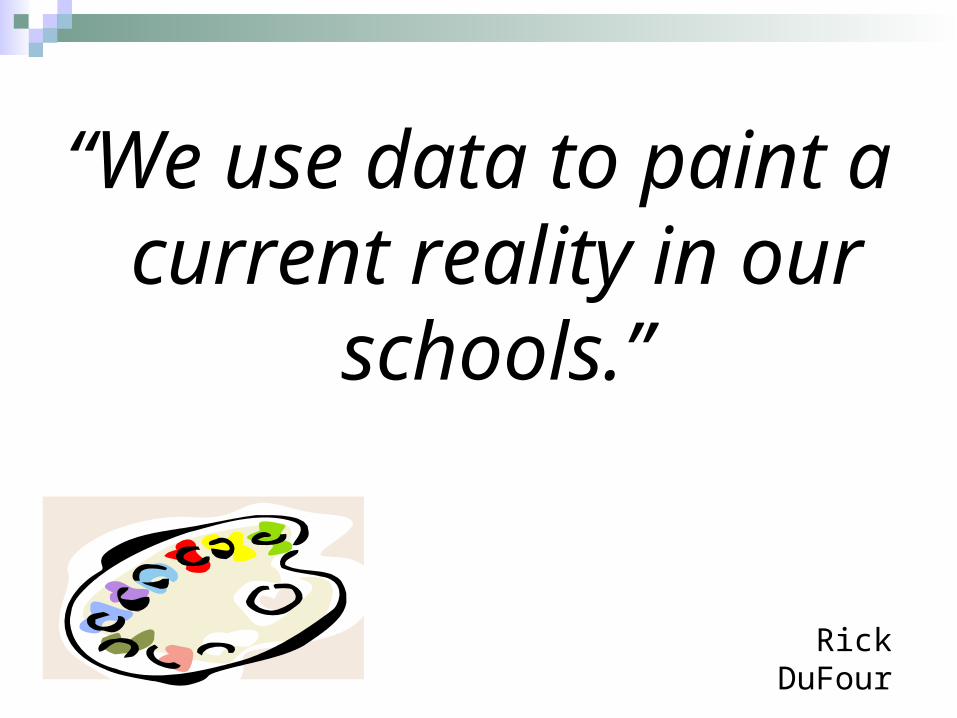
“We use data to paint a current reality in our
schools.”
Rick DuFour
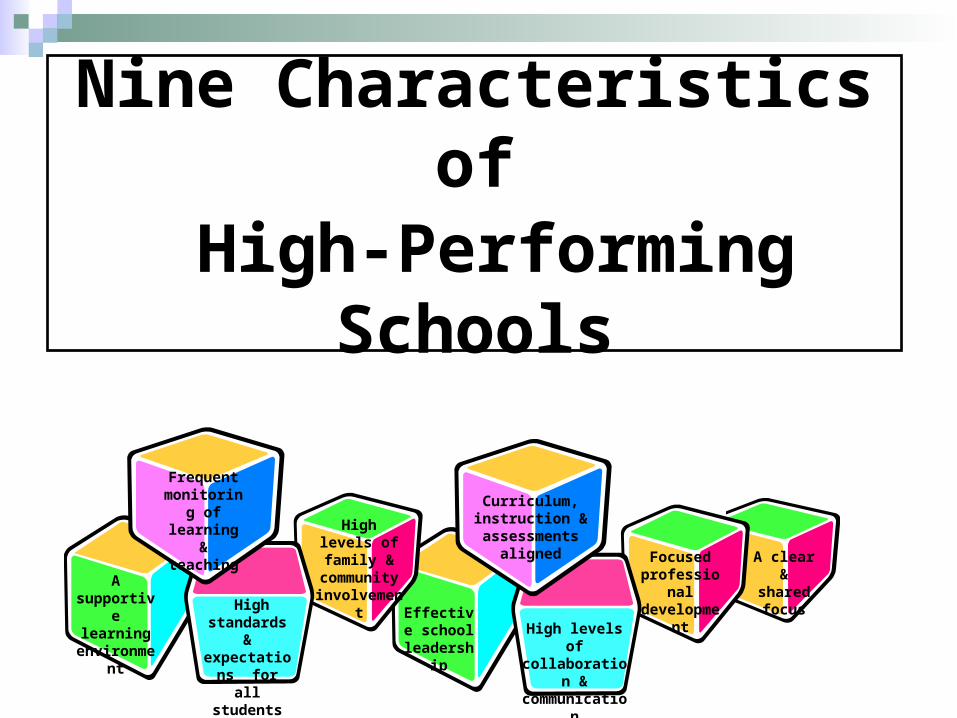
Nine Characteristics of High-Performing Schools
Frequent monitoring
of learning & teaching
High standards & expectations
for all students
High levels of family &
community involvementA supportive
learning environment
High levels of collaboration & communication
A clear & shared focus
Curriculum, instruction & assessments
aligned Focused professional development
Effective school
leadership
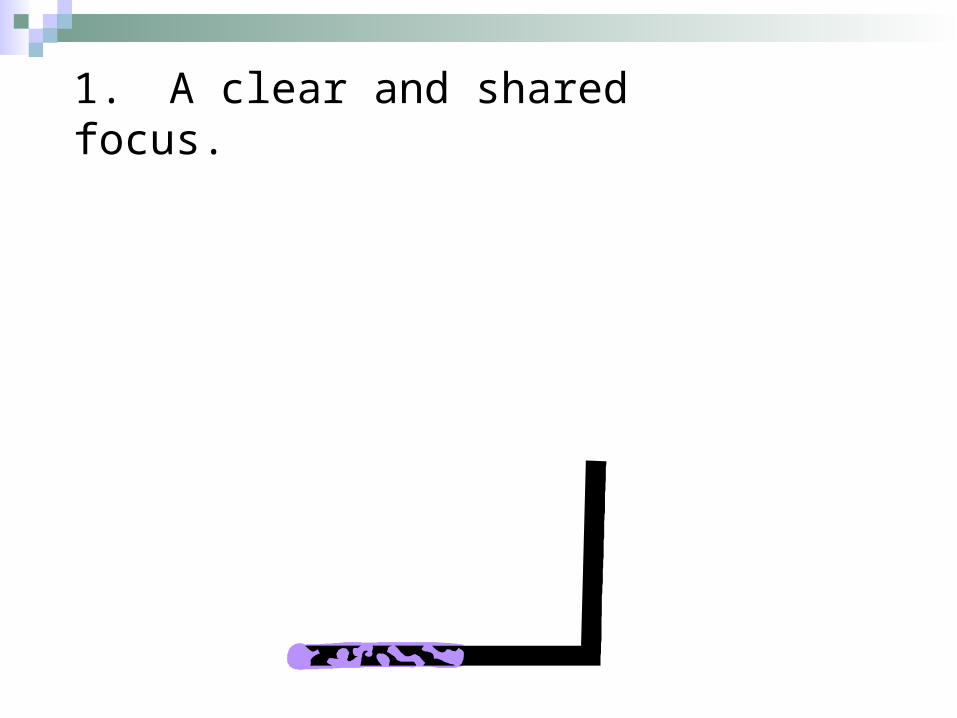
1. A clear and shared focus.
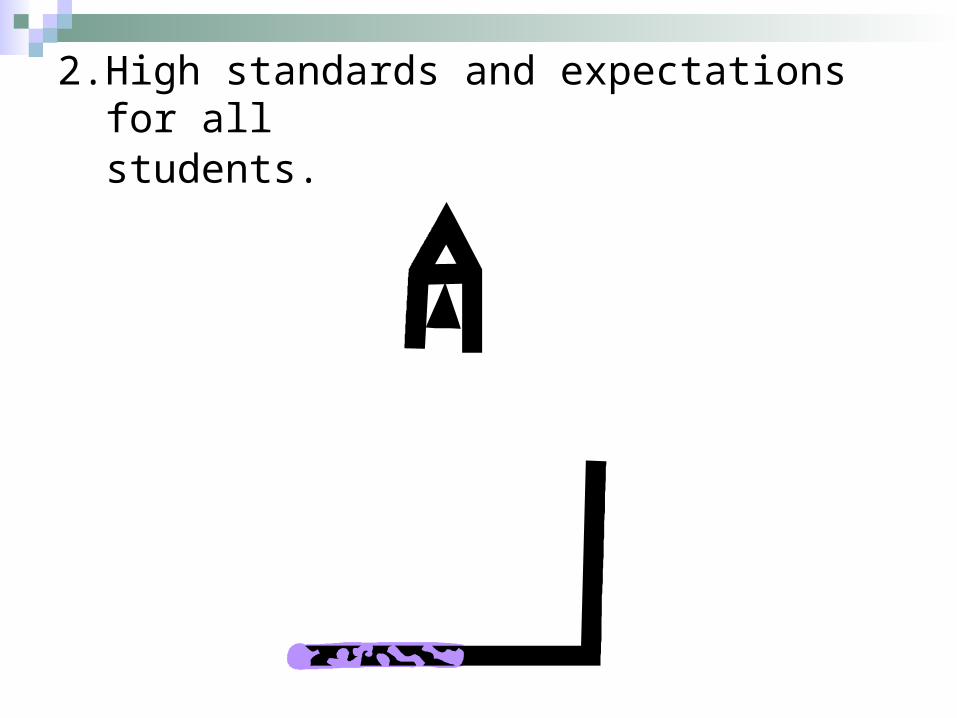
2. High standards and expectations for all students.
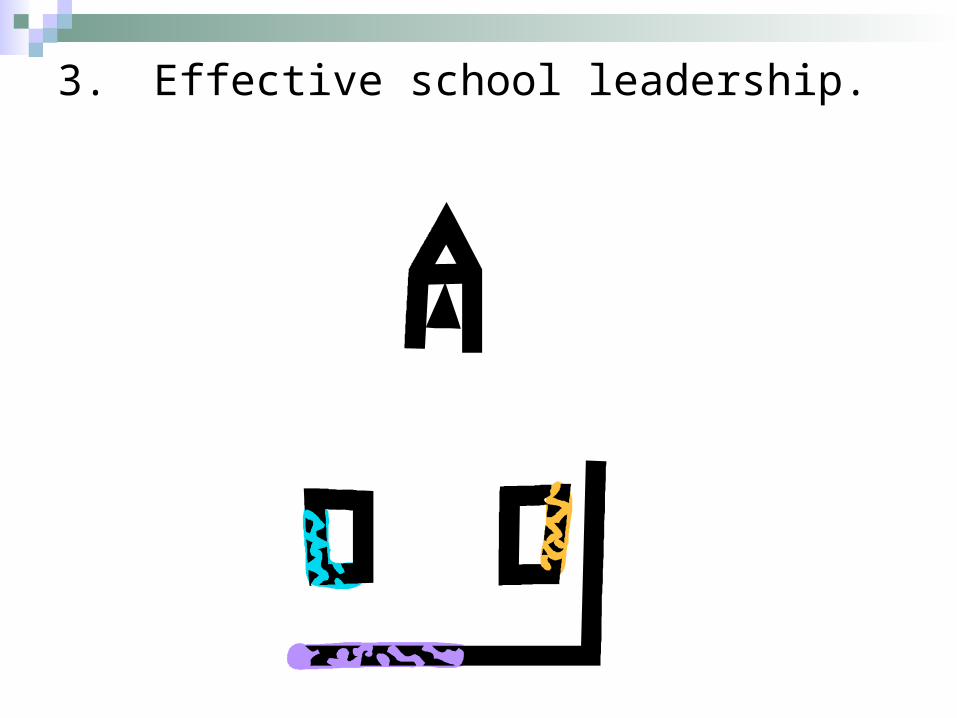
3. Effective school leadership.
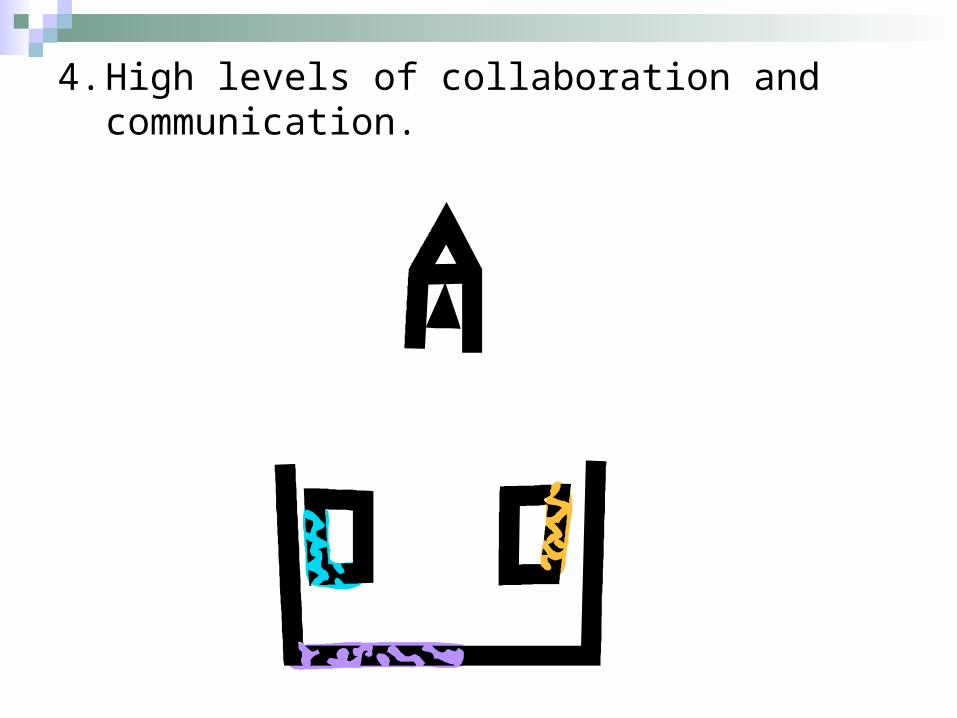
4. High levels of collaboration and communication.
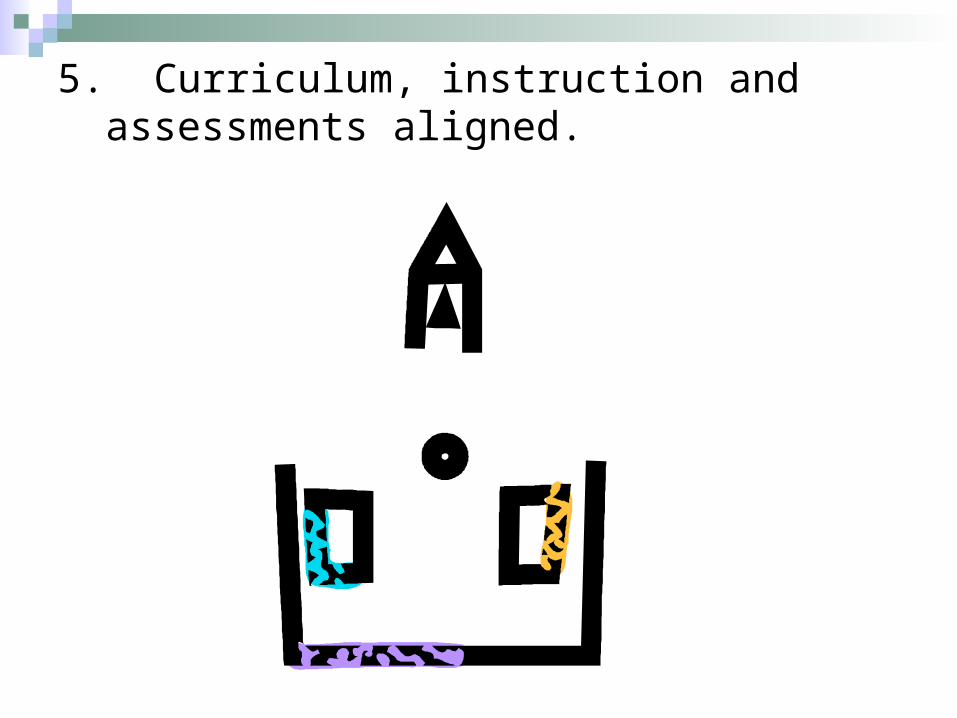
5. Curriculum, instruction and assessments aligned.
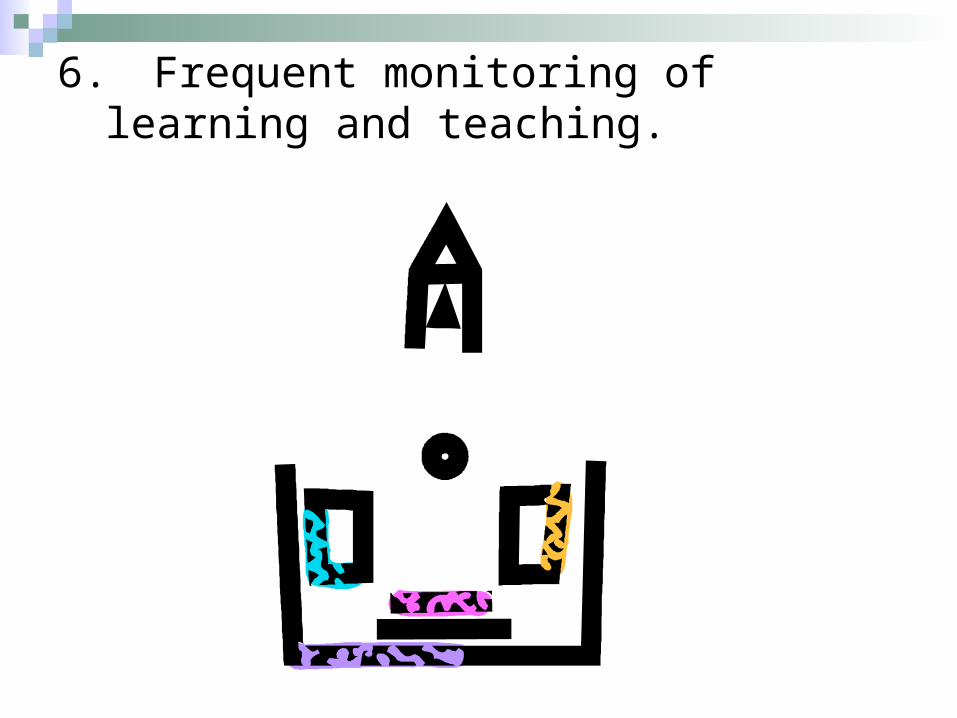
6. Frequent monitoring of learning and teaching.
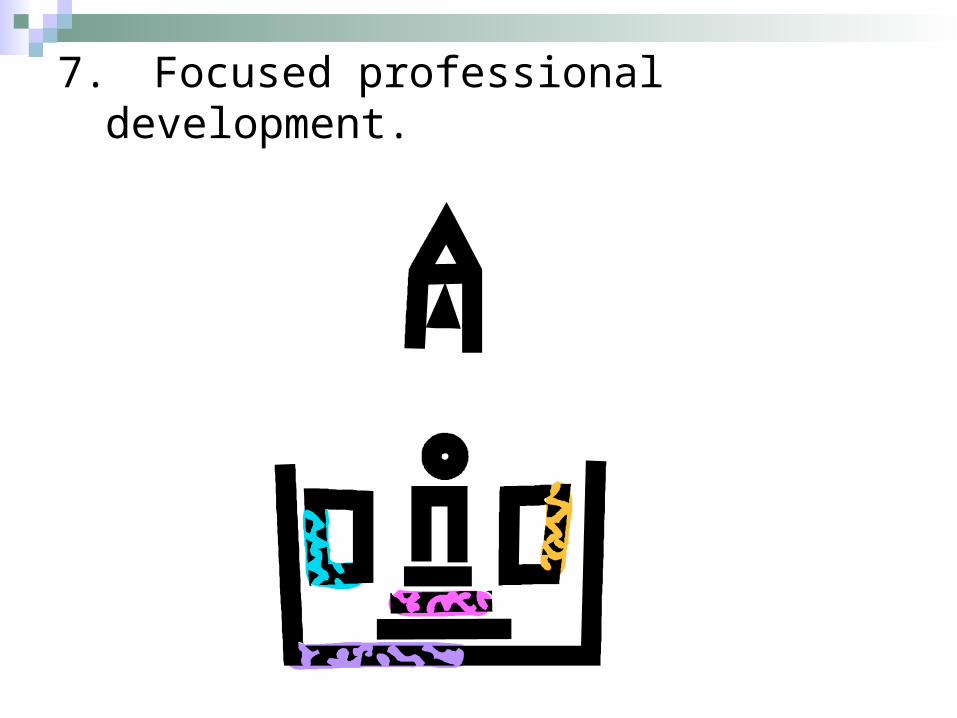
7. Focused professional development.
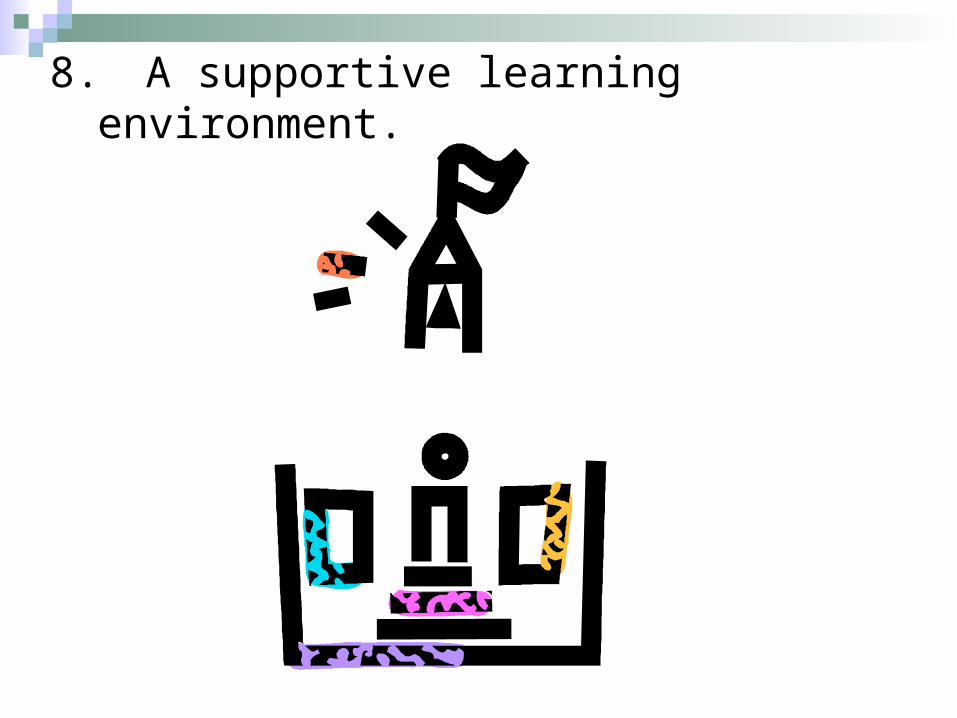
8. A supportive learning environment.
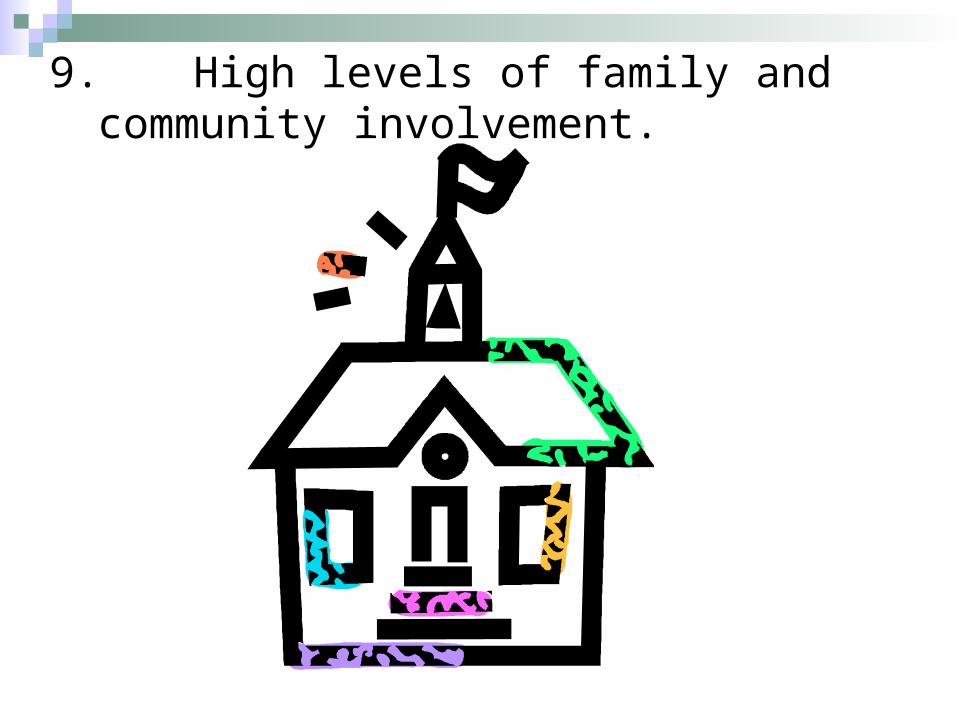
9. High levels of family and community involvement.
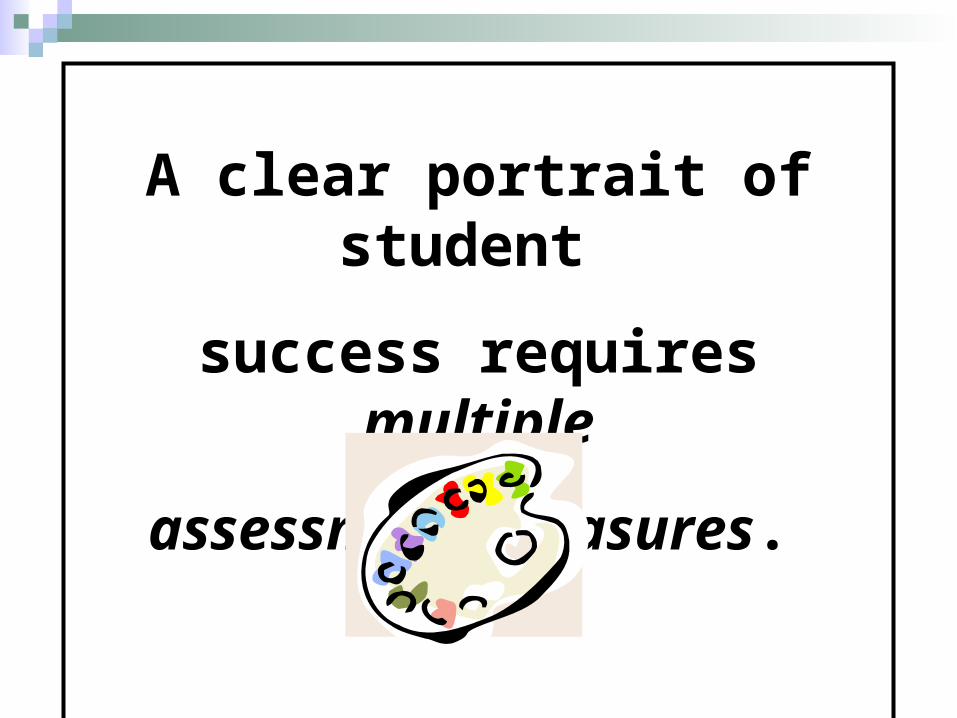
A clear portrait of student
success requires multiple
assessment measures.
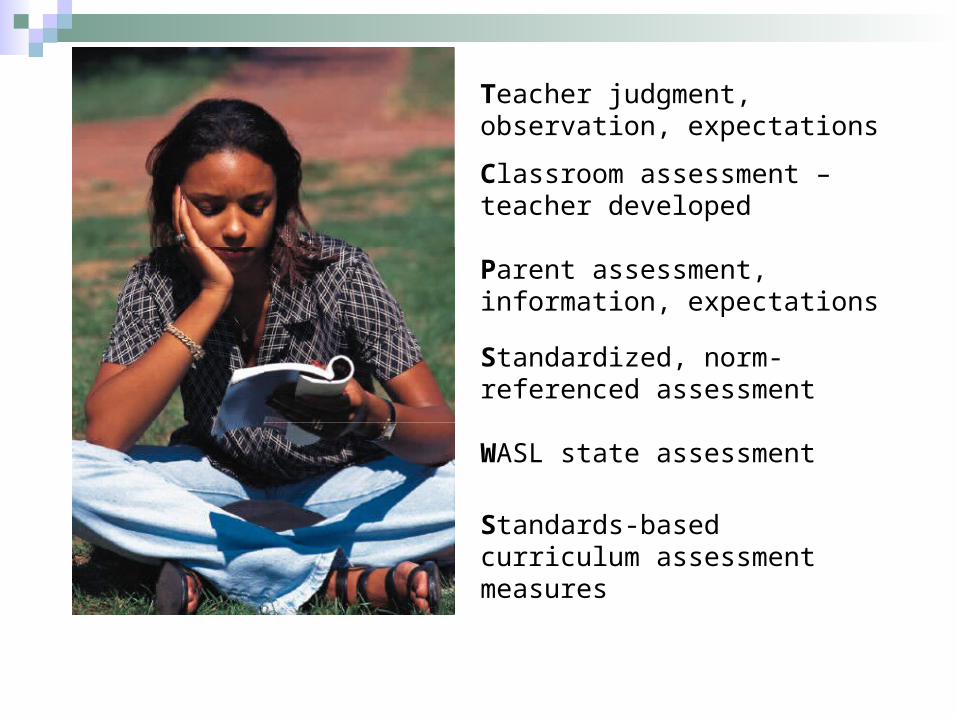
Teacher judgment, observation, expectations
Parent assessment, information, expectations
Classroom assessment – teacher developed
Standardized, norm-referenced assessment
WASL state assessment
Standards-based curriculum assessment measures
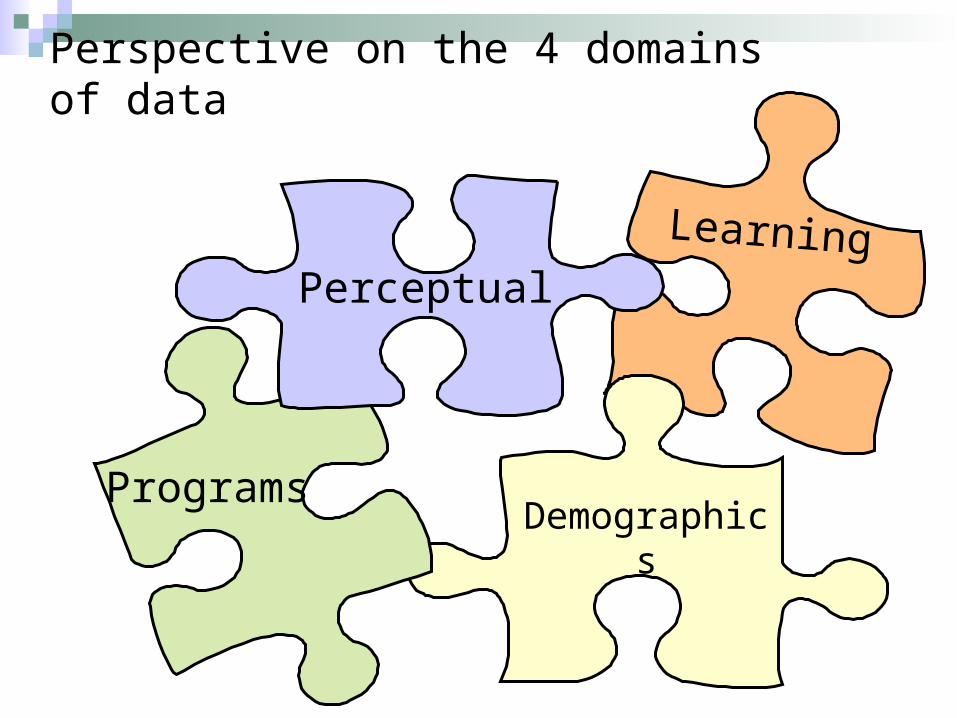
Programs
Perceptual
Learning
Demographics
Perspective on the 4 domains of data
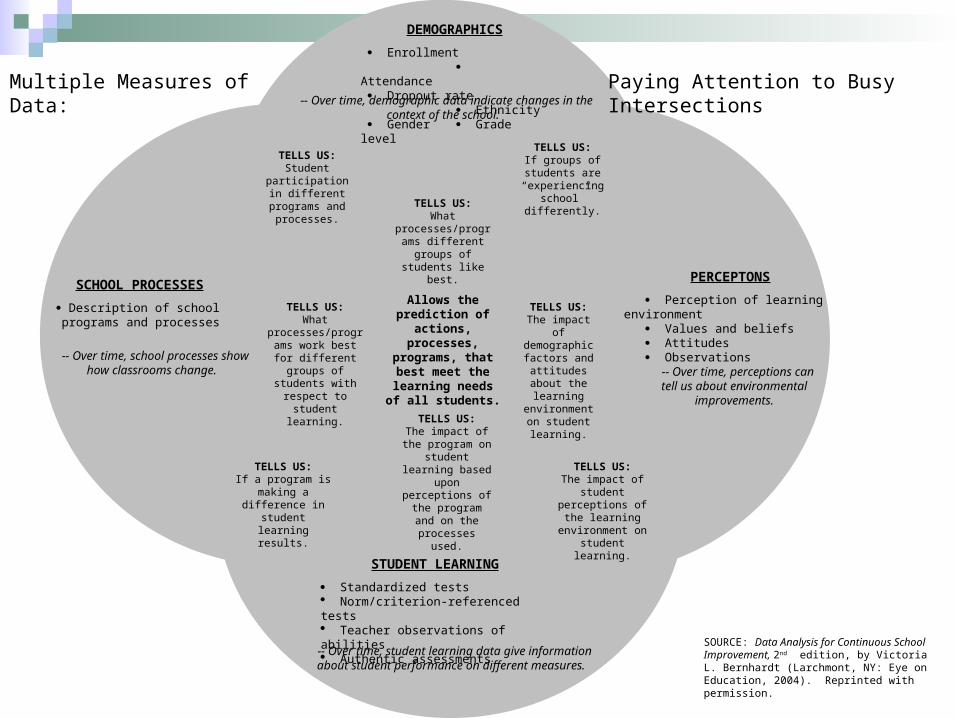
Enrollment Attendance Dropout rate Ethnicity Gender Grade level
-- Over time, demographic data indicate changes in the context of the school.
Description of school programs and processes
Perception of learning environment Values and beliefs Attitudes Observations
Standardized tests Norm/criterion-referenced tests Teacher observations of abilities Authentic assessments
-- Over time, school processes show how classrooms change. -- Over time, perceptions can
tell us about environmental improvements.
-- Over time, student learning data give information about student performance on different measures.
TELLS US:Student participation in different programs
and processes.
TELLS US:What
processes/programs work best for
different groups of students with respect to student learning.
TELLS US:The impact of demographic factors and
attitudes about the learning
environment on student learning.
TELLS US:If groups of students
are “experiencing school” differently.
TELLS US:What
processes/programs different groups of students like best.
TELLS US:If a program is
making a difference in student learning
results.
TELLS US:The impact of
student perceptions of the learning environment on student learning.
TELLS US:The impact of the
program on student learning based
upon perceptions of the program and on the processes
used.
Allows the prediction of
actions, processes, programs, that best meet the learning
needs of all students.
Multiple Measures of Data: Paying Attention to Busy Intersections
SOURCE: Data Analysis for Continuous School Improvement, 2nd edition, by Victoria L. Bernhardt (Larchmont, NY: Eye on Education, 2004). Reprinted with permission.
DEMOGRAPHICS
PERCEPTONS
STUDENT LEARNING
SCHOOL PROCESSES
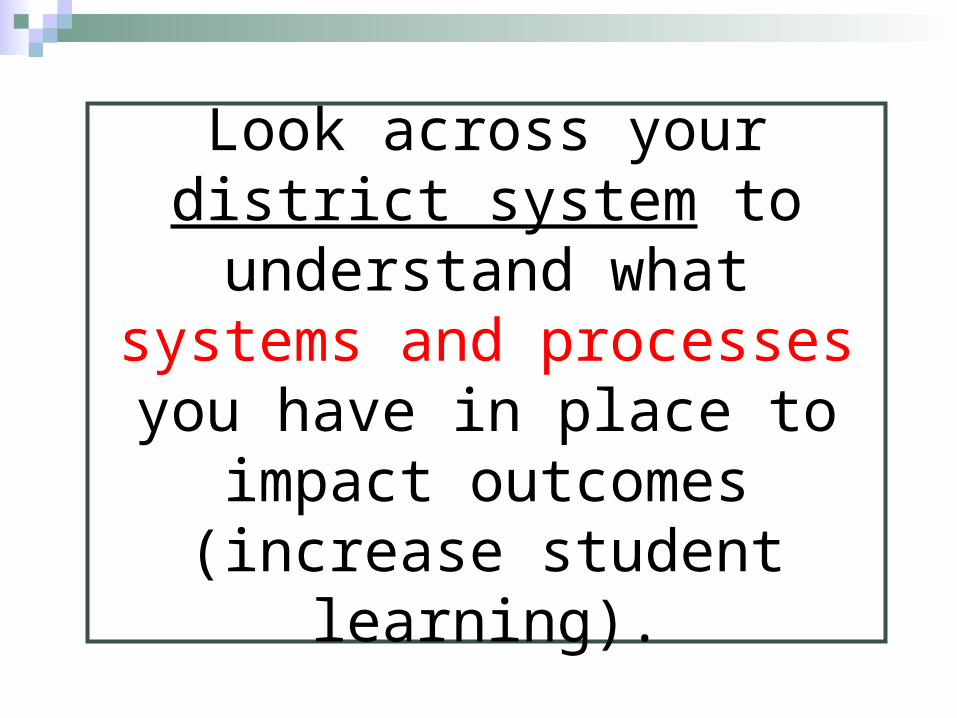
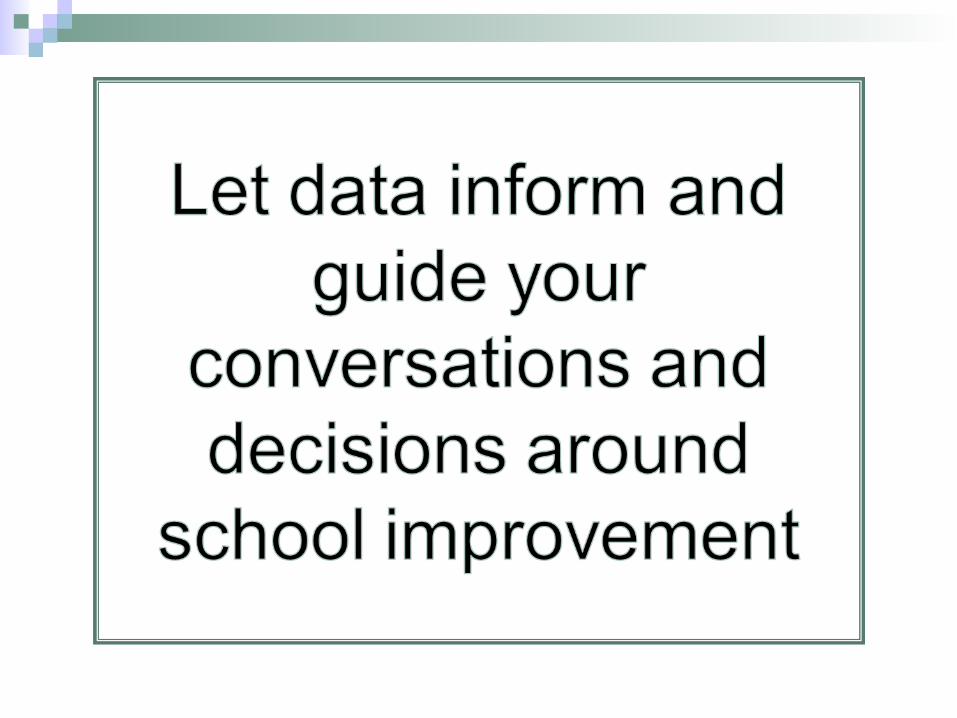
Look across your district system to understand what systems and processes you
have in place to impact outcomes (increase student
learning).
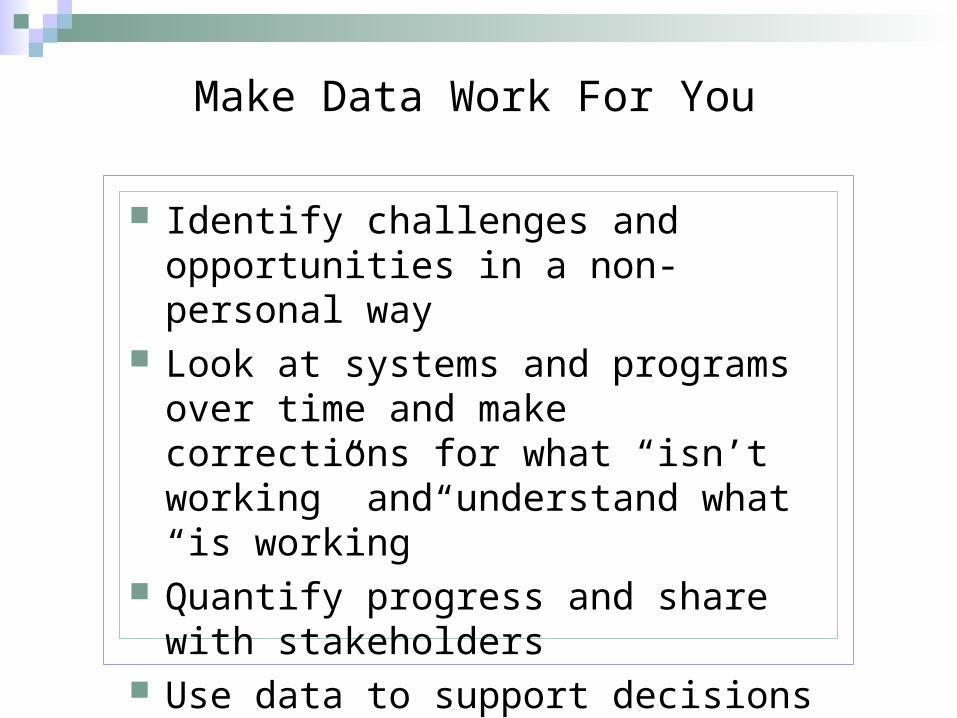
Make Data Work For You
Identify challenges and opportunities in a non-personal way
Look at systems and programs over time and make corrections for what “isn’t working” and understand what “is working”
Quantify progress and share with stakeholders
Use data to support decisions
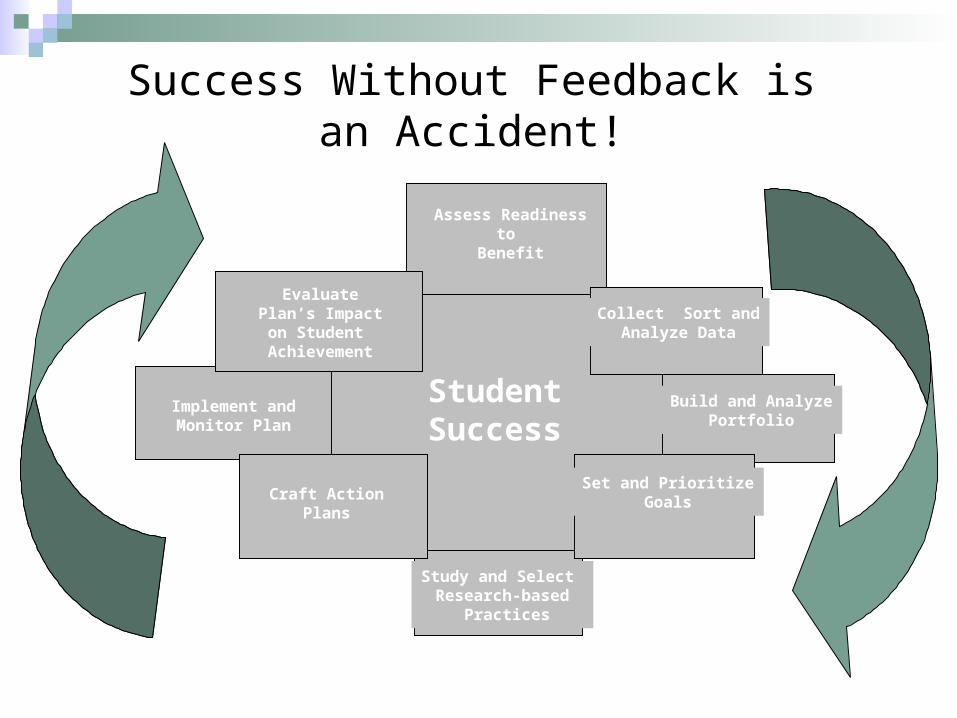
Study and Select Research-based
Practices
Student Success
Assess Readiness to
Benefit
Collect Sort andAnalyze Data
Build and AnalyzePortfolio
Set and PrioritizeGoals
Success Without Feedback is an Accident!
Implement andMonitor Plan
EvaluatePlan’s Impacton Student
Achievement
Craft ActionPlans

Go
Cougs!
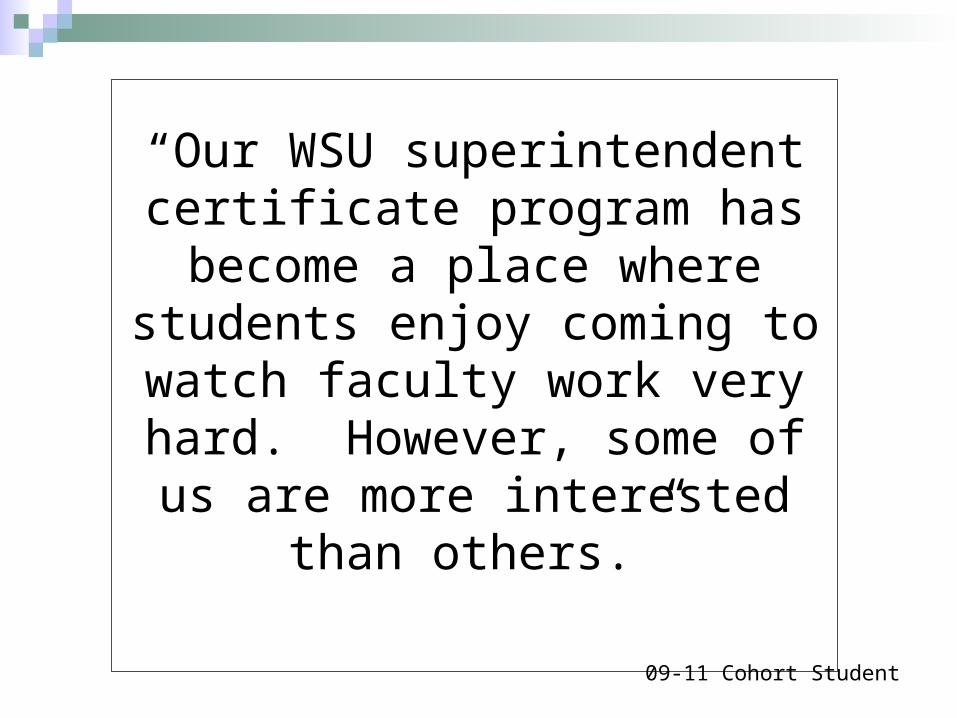
“Our WSU superintendent certificate program has become a place where students enjoy coming to watch faculty work
very hard. However, some of us are more interested than others.”
09-11 Cohort Student
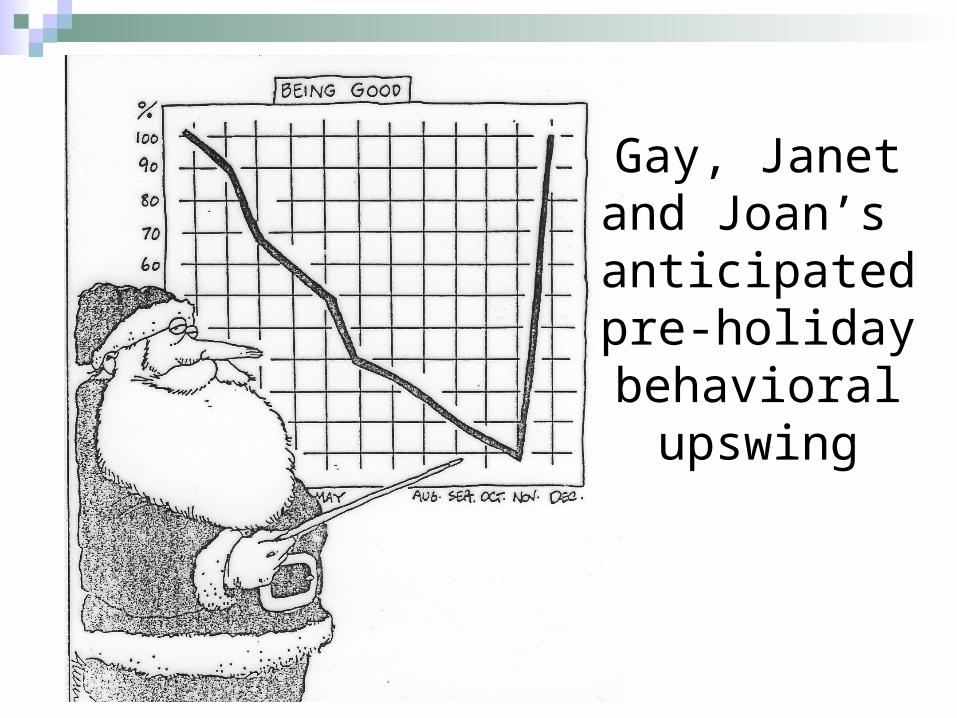
Gay, Janet and Joan’s anticipated pre-holiday behavioral upswing