www.mercer.ca investment performance report at march 31, 2009 saint mary’s university pension plan...
TRANSCRIPT
www.mercer.ca
Investment Performance Reportat March 31, 2009Saint Mary’s University Pension Plan
June 2009
Yvan Breton, Montreal

2Mercer (Canada) Limited
Agenda
Market review – what happened in 2008
Performance review of SMU funds
Active manager issues
Managing risk

www.mercer.ca
Market ReviewWhat happened in 2008
4Mercer (Canada) Limited
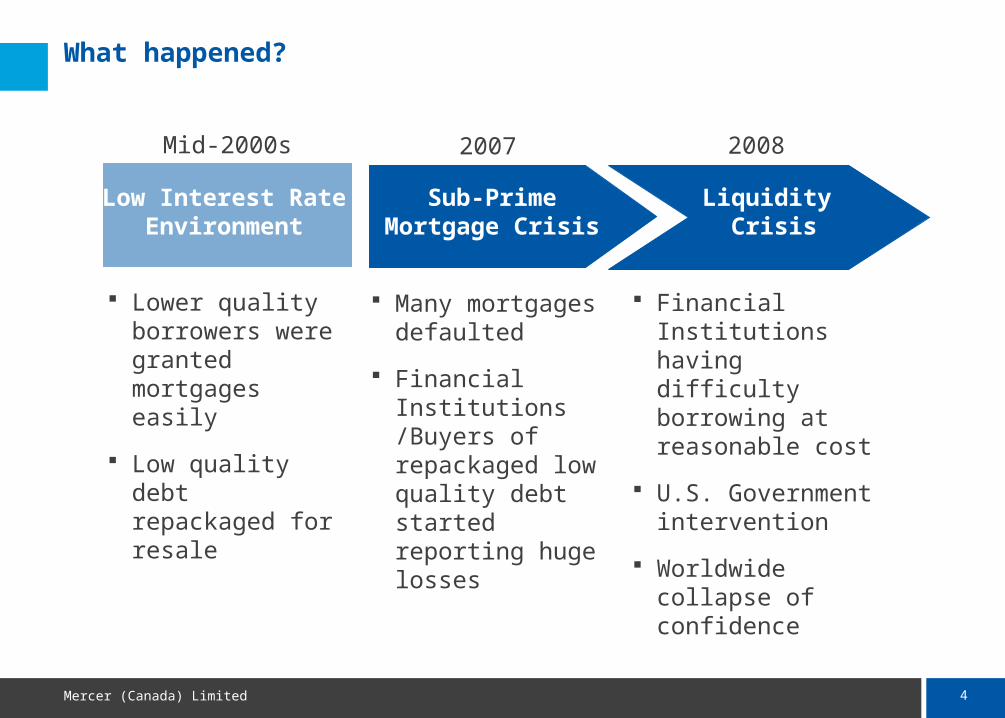
What happened?
Lower quality borrowers were granted mortgages easily
Low quality debt repackaged for resale
Mid-2000s
Many mortgages defaulted
Financial Institutions /Buyers of repackaged low quality debt started reporting huge losses
2007
Financial Institutions having difficulty borrowing at reasonable cost
U.S. Government intervention
Worldwide collapse of confidence
2008
Low Interest RateEnvironment
Sub-PrimeMortgage Crisis
Liquidity Crisis
5Mercer (Canada) Limited
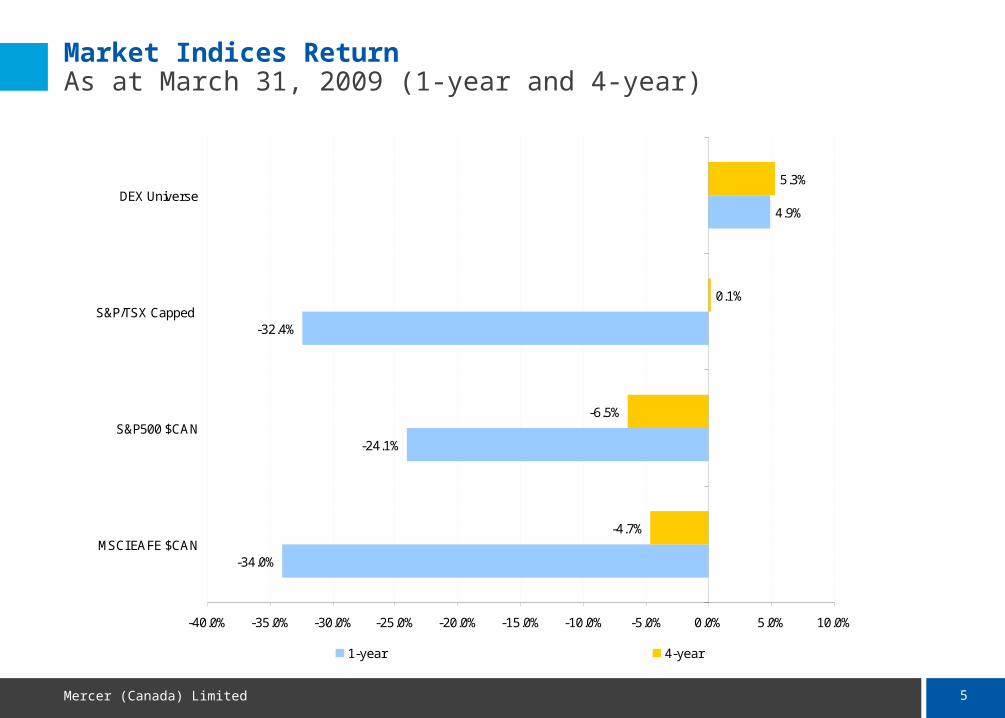
Market Indices Return As at March 31, 2009 (1-year and 4-year)
-34.0%
-24.1%
-32.4%
4.9%
-4.7%
-6.5%
0.1%
5.3%
-40.0% -35.0% -30.0% -25.0% -20.0% -15.0% -10.0% -5.0% 0.0% 5.0% 10.0%
MSCI EAFE $CAN
S&P500 $CAN
S&P/TSX Capped
DEX Universe
1-year 4-year

6Mercer (Canada) Limited
Market Indices Return As at May 29, 2009 (YTD)
UPDA
TED
-3.2%
-8.6%
17.2%
1.4%
-15.0% -10.0% -5.0% 0.0% 5.0% 10.0% 15.0% 20.0%
MSCI EAFE $CAN
S&P500 $CAN
S&P/TSX Capped
DEX Universe

7Mercer (Canada) Limited
Distribution of Market ReturnsHistorical Look at Annual Stock Market Returns

www.mercer.ca
Fund Performance Review

9Mercer (Canada) Limited
Gross Performance to March 31, 2009Money Market ( Sun Life Financial ) (3.6% of funds)
Period Fund Return Value Added Quartile Ranking
1 year 2.7% +0.3% Q3
2 years 3.7% +0.2% Q2
3 years 3.9% +0.2% Q2
4 years 3.6% +0.1% Q3
5 years 3.3% +0.1% Q4

10Mercer (Canada) Limited
Gross Performance to March 31, 2009Canadian Equity (Barclays Global Investors) (22.9% of funds)
Period Fund Return¹ Value Added Quartile Ranking
1 year -28.5% +3.9% Q1
2 years -13.7% +2.8% Q1
3 years -5.8% +1.5% Q1
4 years 2.5% +1.9% Q1
5 years 5.1% +2.0% Q1
¹ Benchmark for the Fund is S&P/TSX Equity Index
11Mercer (Canada) Limited
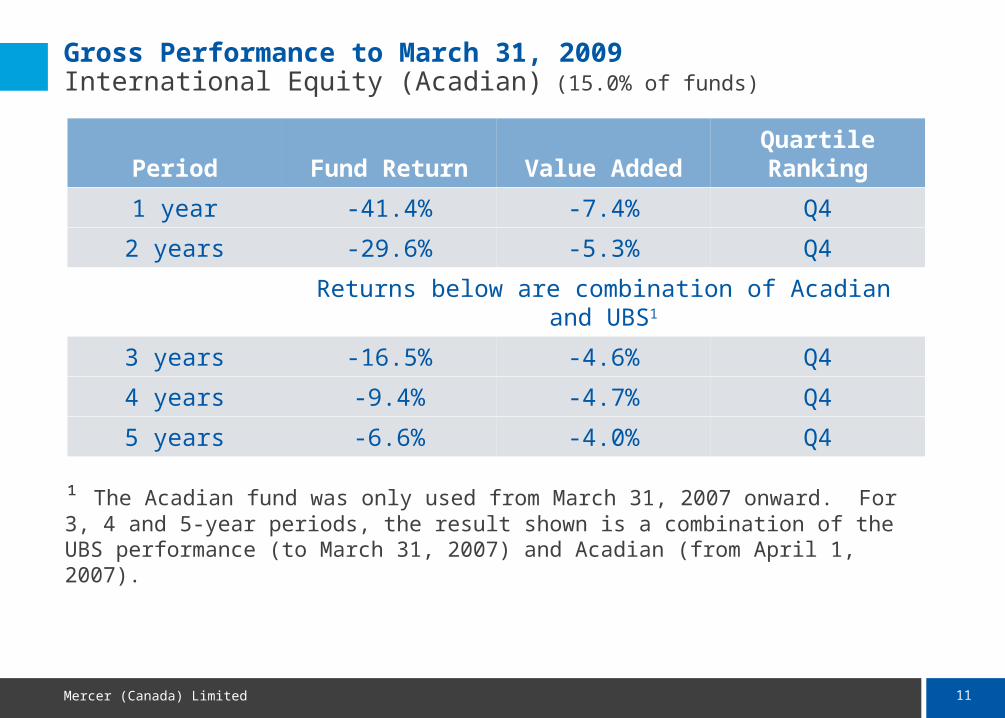
Gross Performance to March 31, 2009International Equity (Acadian) (15.0% of funds)
Period Fund Return Value Added Quartile Ranking
1 year -41.4% -7.4% Q4
2 years -29.6% -5.3% Q4
Returns below are combination of Acadian and UBS1
3 years -16.5% -4.6% Q4
4 years -9.4% -4.7% Q4
5 years -6.6% -4.0% Q4
¹ The Acadian fund was only used from March 31, 2007 onward. For 3, 4 and 5-year periods, the result shown is a combination of the UBS performance (to March 31, 2007) and Acadian (from April 1, 2007).

12Mercer (Canada) Limited
Gross Performance to March 31, 2009Index (passive) Funds (bonds: 32.8%; US Equity: 15.9% of funds)
Period Fixed Income US Equity
1 year 4.5% -24.0%
2 years 5.1% -19.9%
3 years 5.2% -10.8%
4 years 5.1% -6.5%
5 years 5.1% -5.6%
www.mercer.ca
Active Managers Issues
14Mercer (Canada) Limited
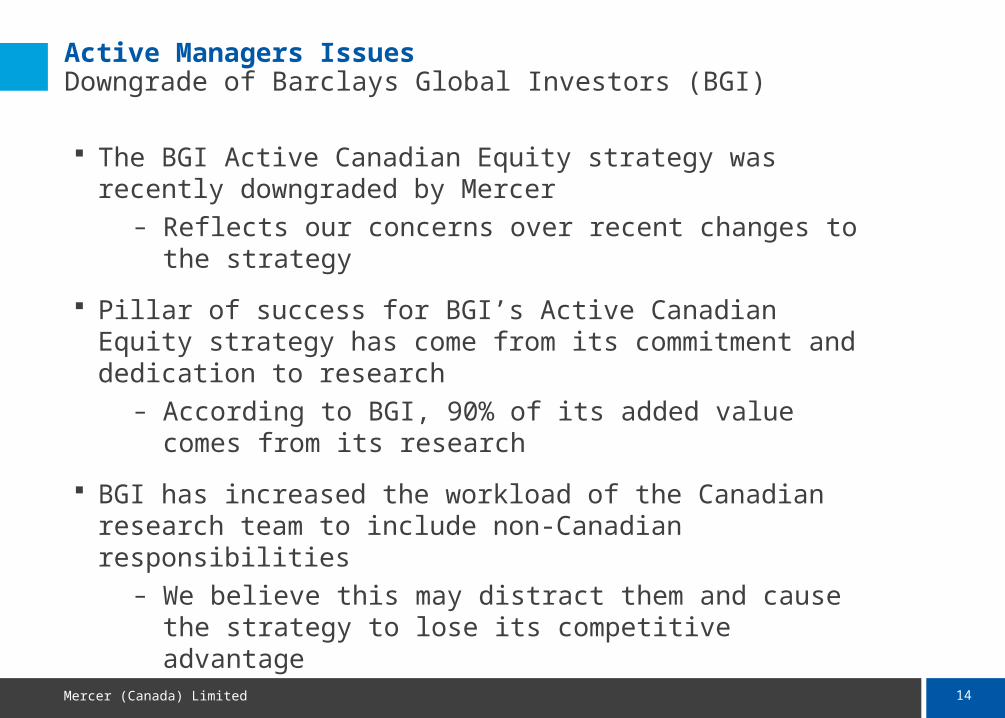
Active Managers Issues Downgrade of Barclays Global Investors (BGI)
The BGI Active Canadian Equity strategy was recently downgraded by Mercer
– Reflects our concerns over recent changes to the strategy
Pillar of success for BGI’s Active Canadian Equity strategy has come from its commitment and dedication to research
– According to BGI, 90% of its added value comes from its research
BGI has increased the workload of the Canadian research team to include non-Canadian responsibilities
– We believe this may distract them and cause the strategy to lose its competitive advantage

15Mercer (Canada) Limited
Active Managers Issues Underperformance at Acadian
Acadian’s international equity strategy has underperformed recently
Acadian uses a quantitative model to rank stocks into quintiles– Historically, the model has been effective and highly ranked stocks
have outperformed lowly ranked stocks
Acadian attributes their recent underperformance to a market dislocation during which stocks of lesser quality (i.e., high debt, poor earnings, high P/E multiples) have been outperforming
When markets become “normal” again, Acadian expects performance to improve
Mercer continues to rate this strategy highly and believe it has above-average prospects for outperformance

www.mercer.ca
Managing Risk
17Mercer (Canada) Limited
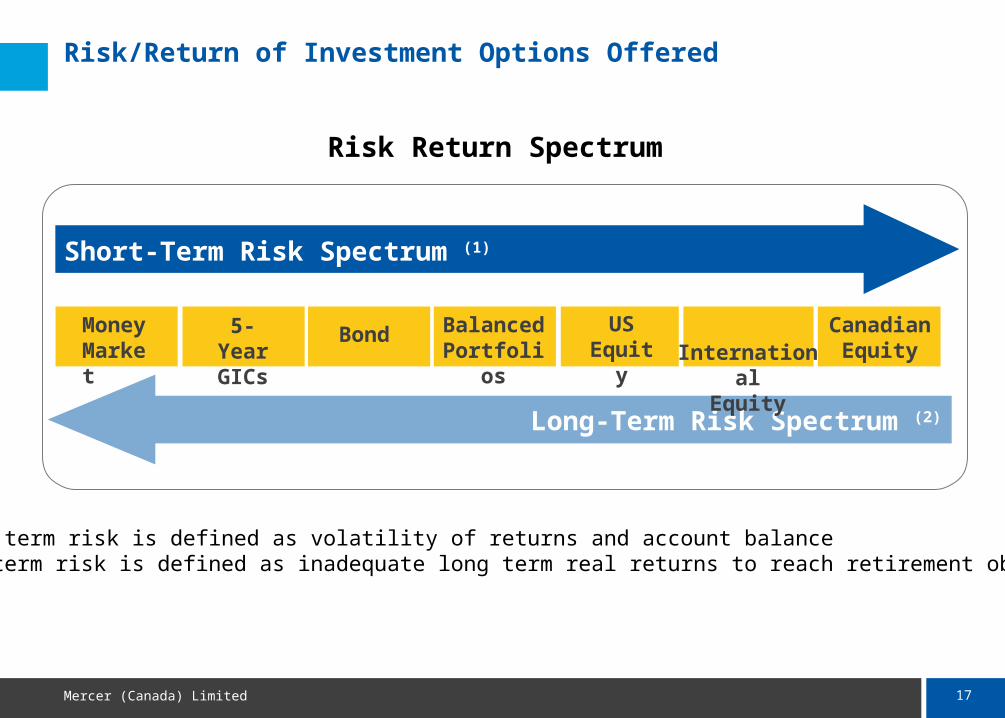
Risk/Return of Investment Options Offered
Risk Return Spectrum
(1) Short term risk is defined as volatility of returns and account balance(2) Long term risk is defined as inadequate long term real returns to reach retirement objectives
Long-Term Risk Spectrum (2)
Short-Term Risk Spectrum (1)
MoneyMarket
5-YearGICs
Bond Balanced Portfolios
USEquity
InternationalEquity
Canadian Equity
18Mercer (Canada) Limited
Basic Concepts of Sound Investments Asset Diversification
Diversification by:– Type of investments (stocks, bonds, short-term
investments, etc...)– Geography
Risk reduction without necessarily impeding expected return
Also need to counter the long term effect of inflation

19Mercer (Canada) Limited
Tools Offered under the SMU Plan
Five target risk asset allocation portfolios
Sun Life Tools– Risk assessment questionnaire– Retirement planning tools– www.sunlife.ca/member
Risk tolerance will likely change over your career– Check your risk tolerance periodically and make changes as you
deem appropriate– If not using a target risk portfolio, periodically check to see whether
you need to re-balance your allocation back to your target

20Mercer (Canada) Limited
Notices and risk warnings
© 2009 Mercer LLC. All rights reserved. This document may contain confidential and proprietary information of Mercer and is intended for your sole use. The document, and any opinions on or ratings of investment products it may contain, may not be modified, sold, or otherwise provided, in whole or in part, to any other person or entity without Mercer's written permission. This document may contain information on investment management firms that has been obtained from those investment management firms and other sources. Mercer research documents and opinions on investment products (including product ratings) are based on information that has been obtained from the investment management firms and other sources. Mercer gives no representations or warranties as to the accuracy of such information, and accepts no responsibility or liability (including for indirect, consequential or incidental damages) for any error, omission or inaccuracy in such information other than in relation to information which Mercer would be expected to have verified based on generally accepted industry practices. Any opinions on or ratings of investment products contained in this document are not intended to convey any guarantees as to the future investment performance of these products. In addition: Past performance cannot be relied upon as a guide to future performance. The value of stocks and shares, including unit trusts, can go down as well as up and you may not get back the
amount you have invested. The value of bonds, and other fixed income investments including unit trusts can go down as well as up and you
may not get back the amount you have invested. Investments denominated in a foreign currency will fluctuate with the value of the currency. For the information of the readers of this document, and to meet our own stringent conflict of interest guidelines, we advise that Mercer provides consulting services to many companies in the financial services industry and we may have provided services to the companies discussed in this document (or a parent or related company). Mercer's Manager Performance Analytics software is also available to companies for a fee and the companies discussed in this document (or a parent or related company) may be subscribers to this product. Our comments in this document are based upon our internal research relating to the companies and factual information obtained through our discussions with the companies. The comments are intended to present objective guidance based upon those facts.

www.mercer.ca