x - core.ac.uk · integrating water resources management -analysis of the st. thomas, u.s. virgin...
TRANSCRIPT

Integrating Water Resources Management - Analysis of the St.U.S. Virgin Islands, Water Market
by
Pablo E. Buscemi
Thomas,
Ing. CivilUniversidad Cat6lica Argentina, Argentina, 1988
SUBMITTED TO THE DEPARTMENT OF CIVIL AND ENVIRONMENTALENGINEERING IN PARTIAL FULFILLMENT OF THE REQUIREMENTS FOR THE
DEGREE OF
MASTER OF ENGINEERING IN CIVIL AND ENVIRONMENTAL ENGINEERINGAT THE
MASSACHUSETTS INSTITUTE OF TECHNOLOGY
June 2003
@2003 Pablo E. Buscemi. All rights reserved.
MASSACHUSETTS INSTITUTEOF TECHNOLOGY
JUN 0 2 2003
LIBRARIES
The author hereby grants to MIT permission to reproduce and distribute publicly paperand electronic copies of this thesis document in whole and in part.
Signature of Author........................... .....Depaiment of Crvil
Certified by...............................................
Professor, Department of Civil
Accepted by...................../X
nvi nmental EngineeringMay 9, 2003
Dennis McLaughlinand Environmental Engineering
Thesis Supervisor
Oral BuyukozturkChairman, Departmental Committee on Graduate Studies
BARKER

-A
Integrating Water Resources Management - Analysis of the St. Thomas, U.S. VirginIslands, Water Market
by
Pablo E. Buscemi
Submitted to the Department of Civil and Environmental Engineering on May 9, 2003 inpartial fulfillment of the Requirements for the Degree of Master of Engineering in Civil
and Environmental Engineering
Abstract
The purpose of this thesis is to contribute to the understanding of the water resourcesmanagement of the St. Thomas water market. By applying the framework for IntegratedWater Resources Management, the actual water resources situation in the island wasanalyzed. This framework requires meeting three criteria: economic efficiency in wateruse, environmental and ecological sustainability, and equity in the access to water for allthe population.The study includes the assessment of available water supply and water demand by use,and the evaluation of alternative and feasible supply options to augment freshwaterresources. Three potential main supply strategies for freshwater supply were identifiedand compared based on: 1) economic efficiency in water use, 2) environmental andecological sustainability, and 3) equity in the access to water for all people.Four integrated strategies for future development and management of water resources inthe island were recommended: 1) Gradually phasing out desalination based on distillationas the main strategy of water supply. This supply can be replaced with distributed reverseosmosis desalination and by importing water by submarine pipeline from Puerto Rico.2) Gradually expanding the distribution system to the entire population, applying thefunds saved by shifting to more cost-effective and sustainable freshwater supplyalternatives. 3) Developing water trading policies within the island as well as withneighboring islands. 4) Improving accountability for available water supplies, which is abasic need for water managers and planners informed decision making.
Thesis Supervisor: Dennis McLaughlinTitle: Professor of Civil and Environmental Engineering


Acknowledgements
To my wife and my son for their support: Judy and Martin.
To my advisors for their insight: Prof. Dennis McLaughlin, Prof Peter Rogers, Dr. Pete
Shanahan, Daniele Lantagne and Prof. Eric Adams.
To the people of the US Virgin Islands.
5

6

Table of Contents
Table of Contents ............................................................................................................................ 7List of Figures ............................................................................................................................... 10Abbreviations used throughout the thesis ..................................................................................... 111. Introduction................................................................................................................... 131.1. W hy Integrating W ater Resources M anagem ent?........................... . . . . . . . . . . . . . . . . . . . . . . . . . . 151.1.1. The actors of water resources m anagem ent............................................................... 162. Historical and economical background focused on the water situation .................... 183. W ater Related Infrastructure..................................................................................... 213.1.1. W ater System ................................................................................................................ 213.1.2. W astewater System ................................................................................................... 234. Key issues for Integrating W ater Resources M anagem ent........................................ 264.1. Environmental consequences of separate operation of water supply and
w astewater .................................................................................................................... 264.2. Reliability of public water system based in desalination. Frequency of extreme
events. ........................................................................................................................... 264.3. W ater costs and prices in this m arket ....................................................................... 274.4. Health consequences derived of the system of rainfall water catchments.........275. W ater Supply on St. Thom as ..................................................................................... 295.1. Conjunctive use of harvested rainwater and desalinated water ................................. 295.2. A vailable water supply .............................................................................................. 355.2.1. D efinition of household types................................................................................... 355.2.2. Catchm ents of rainwater with cistern storage (RW C)............................................... 355.2.3. Saltw ater conversion (desalination).......................................................................... 395.2.3.1. D istillation of sea water supply (SW S) .................................................................... 395.2.3.2. Reverse osm osis supply (SW RO) ............................................................................ 415.2.4. Groundwater supplies ................................................................................................ 425.2.5. H auled water.................................................................................................................435.2.6. Total available water supply ..................................................................................... 435.3. Analysis of the three different types of household in relation to water supply ........ 455.3.1. Type A (HA) .................................................................................................... ..455.3.2. Type B (HB): ...................................................................................................... 465.3.3. Type C (HC : ...................................................................................................... 476. W ater D em and .............................................................................................................. 486.1. Household Dem and .................................................................................................. 486.2. Tourism Peak Dem and ................................................................................................. 496.3. School D em ands ....................................................................................................... 506.4. W orkforce D em and .................................................................................................. 506.5. H ospitals Dem ands .................................................................................................. 516.6. Irrigation, miscellaneous and other needs (bars, car-wash, Laundromats, etc.).....516.7. Declared public system unaccounted for water (UAFW leakage and illegal
connections)..................................................................................................................516.8. Total non-tourist related dem and.............................................................................. 526.9. Total Peak dem and including tourism dem and ............................................................ 527. Supply and Dem and................................................................................................... 55
7
7.1. Estimated Available Supply vs. Peak Demand......................................................... 557.2. Estimated Available Supply vs. Local Demand ........................................................ 55
8. Evaluation of alternative and feasible supply options that can augment the
actual water resources............................................................................................... 56
8.1. Specific Freshwater Augmentation Technologies ................................................... 58
8.1.1. Rainwater Harvesting (RW C)....................................................................................588.1.2. Groundwater extraction (wells).................................................................................598.1.3. Importation using sea transport commonly referred as "Barging"........................... 60
8.1.4. Submarine Pipelines ................................................................................................. 628.1.5. W ater Quality improvement technologies ................................................................. 73
8 .1.5 .1. D esalin atio n .................................................................................................................. 7 3
8.1.5.1.1. Desalination by distillation ........................................................................................ 73
8.1.5.2. Desalination by reverse osmosis...............................................................................779. Comparison of the three potential main supply strategies for freshwater supply
and augmentation..................................................................................................... 80
9.1. Economic analysis of the main supply alternatives................................................. 80
9.1.1. Submarine piping benefit/cost analysis ................................................................... 80
9.1.2. Desalination by distillation benefit/cost analysis ..................................................... 83
9.1.3. Desalination by reverse osmosis benefit/cost analysis ............................................ 85
9.1.4. Projects comparison...................................................................................................889.2. Environmental impact comparison:.......................................................................... 91
9.2.1. Energy intensity of the process................................................................................. 92
9.3. Equity in the access to water for all people ............................................................... 94
10. Answers towards Integrating W ater Resources M anagement .................................. 95
10.1. Environmental consequences of separate operation of water supply andw astew ater .....................................................................................................--...---....... 9 5
10.2. Reliability of public water system based in desalination. Frequency of extreme
e v en ts. ........................................................................................................................... 9 6
10.3. W ater costs and prices in this market ........................................................................ 97
10.4. Health consequences, water quality. Rainfall harvesting as main source of
water supply................................................................................................----........... 97
11. Conclusions: The future.............................................................................................9911.1. Final recommendations............................................................................................... 101
R eferen ces ........................................................................................................... ... ---............. 10 3
APPENDIX A: Benefit-cost analysis detailed calculations........................................................ 107
8
List of Tables
Table 3.1 Population, source of water, sewage disposal and percentage ofw ater purchased from vendor............................................................ 23
Table 4.1 A vailable public supply.................................................................... 28Table 5.1 Population Source of water sewage disposal and percentage of
water purchased from vendor by subdistricts' for St. Thomas........ 31Table 5.2 RWC (rainwater catchments in household) ..................................... 36Table 5.3 Annual WAPA Water Sales for St. Thomas in ML.......................... 40Table 5.4 Annual WAPA Water Sales for US Virgin Islands in MGal............ 40Table 5.5 Summary of water estimated supply for St Thomas......................... 44Table 6.1 Summary of water estimated demand for St Thomas. ..................... 54Table 8.1 Technologies for freshwater augmentation St. Thomas summary.... 57Table 8.2 Approximate distance of underwater pipelines connecting the
islan d s......................................................................... 6 5Table 8.3 Summary of layout of underwater pipelines and pump stations
connecting the islands...................................................................... 69Table 8.4 Sum m ary of costs 2x10" pipe........................................................... 71Table 8.5 Sum m ary of costs 2x8" pipe............................................................. 72Table 9.1 Summary of costs and sales, submarine pipe alternative.............. 82Table 9.2 Summary of costs and sales WAPA 1999. Distillation.................... 84Table 9.3 Summary of costs and sales. Reverse osmosis................................. 87Table 9.4 Summary of cost-benefit analysis results...................................... 88Table 9.5 Ranking by benefit-cost ratio, all projects. ................................... 89Table 9.6 Ranking by internal rate of return, all projects............................... 90Table 9.7 Scoring of energy efficiency of selected processes.......................... 93
9

List of Figures
Figure 2.1 Total Permanent Population USVI................... 19
Figure 2.2 Total Permanent Population St Thomas.................................... 20
Figure 5.1 Key M ap for subdistricts........................................................... 30
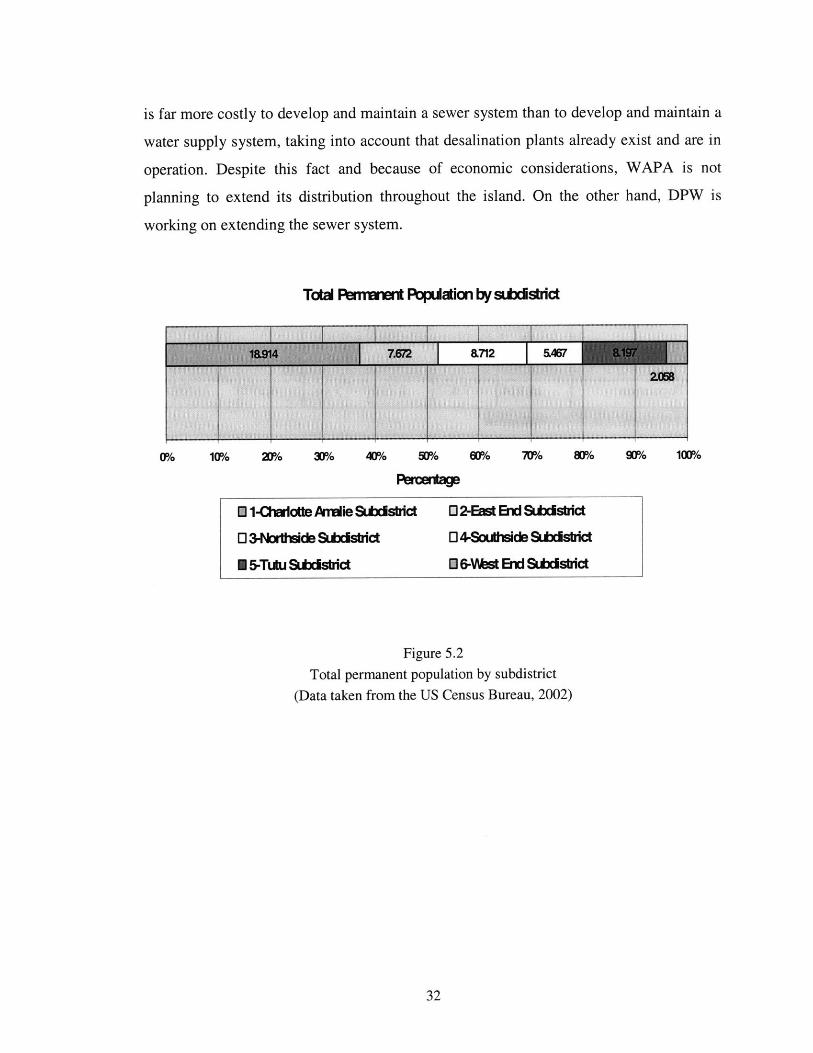
Figure 5.2 Total permanent population by subdistrict................................ 32
Figure 5.3 St Thomas - Source of water by subdistrict............................... 33
Figure 5.4 St. Thomas - Sewage disposal by subdistrict............................. 34
Figure 5.5 St. Thomas - Water purchased from vendor by subdistrict....... 34
Figure 5.6 Summary of estimated water supply for St Thomas.................. 44
Figure 5.7 Supply curve for Household Type A......................................... 45
Figure 5.8 Supply curve for Household Type B......................................... 46
Figure 5.9 Supply curve for Household Type C......................................... 47
Figure 6.1 Water use from all sources of supply, total peak demandincluding tourism dem and ........................................................ 54
Figure 8.1 Continuous flexible pipeline...................................................... 64Figure 8.2 Section STT2 schem e................................................................ 65Figure 8.3 Pipeline from Puerto Rico layout.............................................. 70Figure 8.4 Multi Stage Flash (Distillation MSF Process) .......................... 74
Figure 8.5 Desalination plant, Krum Bay, St. Thomas............................... 75Figure 8.6 Elements of the reverse osmosis desalination process.............. 77
10
Abbreviations used throughout the thesis
RWC Rainwater Catchments
R/O Reverse Osmosis Systems
WAPA Water and Power Authority
DPW Department of Public Works
DPNR Department of Planning and Natural Resources
IWRM Integrated water resources management
USVI United States Virgin Islands
11

12

1. Introduction
Dealing with water scarcity has been the historical rule in the US Virgin Islands (USVI).
The combination of extreme events (hurricanes and floods) and the lack of holistic
planning in infrastructure have conditioned the US Virgin Islands population to a state of
constant drought.
Because of annual rainfall-102 centimeters (40 inches) concentrated during the hurricane
season between July and November (Donahue and Johnston, 1998)-and due to low
capture and storage in the small basins and limited aquifers, water conservation is of
critical concern for the population and requires constant attention by the water resources
managers and planners.
Available water supply comes from three systems:
" Catchments of rainwater with cistern storage.
* Saltwater conversion (desalination).
* Groundwater wells (mainly in St. Croix, because of contamination and different
type of geology in the St. Thomas main aquifers).
Due to the high cost of water from desalination, the daily average per capita water
consumption is substantially less than the US average, totalizing 190 Ijday per capita
(OIA, 1999).
It is difficult to analyze the islands as a whole, because each island is substantially
different. St. Thomas is the center of tourism and commerce associated with it, St. Croix
is the industrial center, and St. John is mainly a natural reserve with low population. The
scope of this study will be focused on the island of St. Thomas. In this island, it must be
added to the local water demand, the pressure on this resource from tourism demand. The
peak population of this island in high tourism season is estimated by some authors to be
around 130,000 persons, a figure that almost triples the permanent population (Donahue
and Johnston, 1998).
13
Focusing on St. Thomas island research has been done on:
m Available water supply.
m Water demand by water use.
m Evaluation of alternative and feasible supply options that can augment
water resources.
m Identification of the existing and alternative supplies, with the potential to
provide the water quantity and quality required for St. Thomas.
m Comparison of the main potential supply strategies for St. Thomas, taking
in consideration economic, environmental and equity criteria.
" Finally, paths for future development and management of water resources
in the island are discussed.
In order to conduct this research information from the different stakeholders in water
resource planning was considered. The actual stakeholders in the water market are
WAPA (Water and Power Authority, responsible for generating and supplying electricity
and desalinated water), DPW (Department of Public Works, responsible for, among other
public works, wastewater collection, treatment and disposal), and DPNR (Department of
Planning and Natural Resources, responsible for controlling and enforcing potable water
and wastewater permits, codes and regulations, through DEP Division of Environmental
Protection). Understanding the position and interrelation between the major stakeholders
regarding water resources is crucial for evaluating the particular dynamics of the water
market.
Representatives of all these major stakeholders have been interviewed in order to
establish a datum during the month of January of 2003. Care has been taken to maintain
quantities accurate and in the proper order of magnitude for comparisons and
recommendations included in this work. The estimates of water supply and demand on
which this study is based can be improved with surveys and with a greater geographical
breakdown of the available information. It is to be noted that because of the multiple
sources and the need for estimation in some sensitive parameters, some amounts can be
debatable.
14
1.1.Why Integrating Water Resources Management?
"Integrated Water Resources Management-IWRM-is a process which promotes the
co-ordinated development and management of water, land and related resources, in
order to maximize the resultant economic and social welfare in an equitable manner
without compromising the sustainability of vital ecosystems" (Global Water
Partnership, 2000).
IWRM is a powerful tool to face the challenges presented by the USVI water
resources sector development. It provides a framework to the process of managing
and developing water resources, land uses and other related resources. IWRM gives a
holistic approach to the rules and constraints that should apply to all participating
sectors in the water related issues, in order to achieve economic and social welfare,
without affecting ecosystem sustainability. A rational balance between the use of the
water resource, and the protection and conservation of the resource should be
achieved.
To take into account social, natural and economic conditions three criteria should be
addressed: economic efficiency in water use, environmental and ecological
sustainability, and equity in the access to water for the population.
Three fundamental complementary elements should be encouraged and developed as
part of effective water resources management:
" The enabling environment, as a framework.
- The institutional roles at each level and representing every stakeholder.
- The management and development instruments, as a useful "tool-box" for
implementing IWRM.
15

1.1.1. The actors of water resources management
a) Government, as enablers, setting the framework for private action. It is
important that government can retreat from its old role of providing services,
and can assume successfully the role of regulating the services that can be
operated by private companies, users associations and other non-governmental
organizations (NGO's). Another crucial task should be to adopt the full-cost
pricing of water use and related services, and to implement policies of
subsidies to individuals. Government must also support and regulate the water
market, and must provide or ensure the necessary funding for crucial water
resource development that cannot be assured by the private sector.
b) Institutions of users, industry, and all other non-governmental organizations.
These institutions should be integrated in a fashion that will give all the
"stakeholders" representation and relative weight by means of participatory
institutional mechanisms. Communities and NGO's should play a
fundamental role in watershed action programs, groundwater aquifer
management organizations, local-level action for natural disasters, monitoring
quality of water, pest control, drought relief, and conservation.
c) Private sector, as provider of water services for people, drinking water and
wastewater treatment. The other crucial role of the private sector is as
provider of capital, in the form of investment or financing water related
infrastructure works. It is of an extreme importance that the government could
adequately regulate the "rules of the game" so that the private sector can be
developed in a timely and efficient manner. These rules can be implemented
by adopting water full-cost pricing as a key incentive.
16

d) Institutions for monitoring, and following up on the development of action
plans, bringing technical assistance where needed. Another role of these
agencies should be to leverage financial assistance for projects that exceed
local capital markets possibilities (either private or public) (Global Water
Partnership, 2000).
Water is a resource that has no frontiers, and many neighbor islands can play an
important role in water augmentation.
One of the contributions that IWRM can give is to help in the definition of a
practical set of water management techniques that can be a useful guideline for
the St. Thomas case analysis:
" Water resource assessments: availability and demand.
- Communication and information systems.
" Water allocation and conflict resolution.
" Regulatory instruments comprising direct controls, economic instruments
(fees, prices, charges, etc.) and encouraged self-regulation. Regulatory
instruments should be inspired on three basic principles:
o User pays.
o Polluter pays.
o Subsidize the good, tax the bad.
" Technology
o Technological advance towards sustainability.
o Research and development in technology.
o Guidelines for technology assessment.
o Choosing the optimal technology for a given particular context.
17

2. Historical and economical background focused on the water situation
For a better understanding of the actual water situation in this U.S. territory a chronology
of relevant key events is presented. The water situation is embedded in the greater social,
economical and political picture of the islands. Moreover, it is not possible to analyze the
water market without taking into account all this information. It is important to note that
institutionally the islands are a young autonomous territory. Only since 1970, the locals
have elected their own governor. As with every other institution in the islands, the ones
of the water sector are young and striving to find their maturity.
In the past fifty years, the history of water resources development in the islands can be
summarized as follows. Until 1960, hillside rainfall catchments and dug wells composed
the major sources of water supply. Rainwater harvesting was the source of water for most
rural and urban domestic supplies. As a proof of the importance of this practice, in 1964,
the Legislature of the US Virgin Islands passed a law that required as mandatory for all
new residential, commercial or industrial buildings to have a minimum cistern storage
related to the surface of the roof. In 1955 as population started to grow, water began to be
barged from Puerto Rico as a supplement to the water resources available. In the 1960's
and early 1970's population grew rapidly (see figs 2.1 and 2.2) because of the shift in the
economic activity of the island. In this period the economy that has been traditionally
based in agricultural production, shifted dramatically. The new economy was based in
tourism and industry. This continuous growth in population (see fig 2.1) provoked an
unprecedented stress on the available water resources. In 1960 the population was 32,100
and it rose in 1975 to 85,800 (USGS, 1987).
To mitigate water scarcity in 1964 the first desalination plant began production. Its
operation was under the charge of the Virgin Islands Water and Power Authority
(VIWAPA). The initial production doubled the capacity of the existing supply system
based in rainwater catchments and groundwater extraction (USGS, 1987).
18

In the 1970's water production by seawater conversion continued to be expanded.
However, at the end of that decade, due to aging equipment and lack of maintenance, a
water crisis appeared again in the island horizon. These problems added to periods of
drought, over-pumping of wells, failures in the distribution systems, and a lack of
adequate storage capacity determined that rationing of water had to be applied in order to
mitigate its frequent shortages. In 1979, barging from Puerto Rico was started again
(USGS, 1987).
In 1981-82, the VIWAPA expanded its desalination capacity by 2.5 MGD on St. Thomas
and by 1.25 MGD on St. Croix, ending the need for rationing. But, although supplies
have been improved, water demands were not fully satisfied (USGS, 1987). In the last
two decades and as it can be seen in the population trends, population growth has
decreased (fig 2.1), and in the last decade negative growth has been registered. Not much
has been invested in the expansion of the water system. The efforts made were
concentrated towards more efficient operation of the existing system. If the population
trends forecasted in the 1980's (156,000 inhabitants by the year 2000) would have been
materialized, a water crisis will be at its climax today in the islands. The fact that the
actual population is only of 108,000 (US Bureau of the Census, 2000) has mitigated the
lack of meeting the planned goals in the water resources sector.
Population USVI
120000
100000
0 80000
600000.
0. 40000
20000
01940 1950 1960 1970 1980 1990 2000 2010
YEAR
Figure 2.1(Data taken from the US Census Bureau, 2002 and OIA, 1999)
Total Permanent Population
19

Population St Thomas
60000-
50000
e 40000
* 0000
10000
01940 1950 1960 1970 1980 1990 2000 2010
YEAR
Figure 2.2
(Data taken from the US Census Bureau, 2002 and OIA, 1999)
Total Permanent Population St. Thomas
20

3. Water Related Infrastructure
3.1.1. Water System
The WAPA (Water and Power Authority) manages the desalinization plants and
the distribution system, which covers the more populated subdistricts of St.
Thomas. Given that the costs of saltwater conversion are significant, the system
integrity and the efficiency of metering operations are of crucial importance (OIA,
1999).
Currently, water distribution rehabilitation and replacement projects are in
progress as part of a territory-wide water program on St. Thomas and St. Croix.
Almost every big resort as well as main industries has their own private seawater
conversion units, mainly using reverse osmosis (R/O) technology to convert
seawater to drinking water.
St. Thomas
More than 50% of the population relies solely on roof catchments and water
cisterns for potable water (Table 3.1). When rainfall is scarce or cistern capacity
is small, there are companies that deliver water by truck from the desalination
facilities or from private wells.
The remaining population relies on desalination or a combination of desalinated
water and water catchments. The demand on the WAPA distribution system
ranged between 11.20 and 13.24 MLD (2.96 and 3.50 MGD) and supplies the
town of Charlotte Amalie and the east end of the island (OIA, 1999).
Desalination facilities can produce 16.85 MLD (4.45 MGD) using seawater and
waste heat from the electric power plant for the conversion of water (OIA, 1999).
The distribution system consists of 3,400 metered connections on 80 km (50
miles) of water mains. The system has seven boosters pump stations and an
approximate storage capacity of 50 ML (13.21 MGal). Funding has been provided
for plant expansion through the issuance of water bonds.
21

In addition, a saltwater flushing system used to serve the Fire Main Water supply
in Charlotte Amalie. This was a great advance in water conservation policies.
Mainly because of lack of maintenance, this system has seriously deteriorated.
This has resulted in electrolysis along the potable water lines, causing
disintegration of the pipes. Today it is no longer in use.
One of the main problems that still face the water distribution system is of losses
mainly due to system leakage (OIA, 1999). In 1998, those losses were reduced to
45 percent from the 65 percent that was registered in 1988. Ninety percent of
total system loss is accounted for these system leaks. All piping is being replaced
with PVC, because of the corrosive nature of the soils.
St. John
In 1990 a desalination plant of 587,000 LPD (155,000 GPD) capacity began
operation, eliminating the barging from St. Thomas of 50 percent of St. John's
water supply needs (OIA, 1999). This facility is complemented with an elevated
storage reservoir with an attendant pump station. Water service has been provided
to the residents of Coral Bay. Storage capacity has been doubled in 1995 from
2.27 to 4.54 million liters (0.60 to 1.20 million gallons).
St. Croix
Groundwater is added in this island as part of the pubic supply. The daily water
demand is approximately 12.11 MLD (OIA, 1999). The desalinated water
production is of 14.00 MLD (3.70 MGD), and a maximum of 1.89 MLD (0.50
MGD) extracted from all active wells. The distribution system has 224 km (140
miles) of mains, 6 primary booster pump stations, and 87 ML (23 MG) of storage
capacity. It is crucial to control water losses and leaks due to the high cost of
water production.
22

Table 3.1
Population source of water, sewage disposal and
percentage of water purchased from vendor
(Datum taken from the US Census Bureau-2002)
Total Population 4,197 1 53,234 1 108,612
Source of Water (% of housing units)
Public System 24.40 3 25 24
Public System and Cistern 19.00 14 26 22
Cistern, tanks, drums only 55.40 81 45 52
Public standpipe 1 2 4 2
Other source
Sewage disposal (% of housing units)
Public Sewer 57 16 49 52
Septic tank or cesspool 40 78 47 45
Other means 3 7 4 3
Purchased 34 50 32 34
Not purchased 66 50 68 66
3.1.2. Wastewater System
Wastewater treatment plants and sewage collection systems are installed in the three
islands. Private residences use individual septic systems, and some hotels use small
private treatment plants, that in both cases are not connected to the public systems.
The discharge of effluent is made to either an inland stream or the ocean. The towns
of Charlotte Amalie on St. Thomas and Christiansted on St. Croix use saltwater
sewage flushing systems as a potable water conservation measure. The Department of
Public Works (DPW) manages and operates the public sewer systems on all three
islands.
On January 19, 1996, the Government of the USVI signed an Amendment Consent
Decree with EPA. This resulted in the scheduling of improvements to existing
23

wastewater treatment facilities, as well as schedules for new ones to be constructed
with strict penalties for failure to meet the deadlines and interim quantity and quality
of effluent proposed.
St. Thomas
Individual septic tanks are the common wastewater disposal system for private
residences (OIA, 1999). In addition, there are eight sewage treatment facilities, seven
secondary plants, and an anaerobic pond located at the airport. The plants do not
always attain secondary treatment discharge requirements.
Infrastructure deficiencies has been reported as follows "With regard to wastewater
treatment on St. Thomas inadequate facilities, particularly on the East end and the
Cyril E. King Airport, have been discharging poorly or untreated effluent into coastal
water areas, causing damage to the marine ecosystem, lowering water quality levels,
and endangering public health" (DPNR, 1991).
EPA approved a grant for the construction of a regional wastewater treatment plant at
the solid waste landfill site located on the eastern end of the island (OIA, 1999).
When finished, it will initially eliminate five existing plants, and later, a sixth.
Sewer line replacement for the island of St. Thomas is estimated at $20 million,
including preparatory cleaning and inspection (OIA, 1999). The sewage lift stations
are being provided with emergency generators.
St. John
The only area that is served by a secondary waste treatment plant is Cruz Bay (0IA,
1999). This facility is overloaded, does not meet interim effluent limits, and
discharges into a nearby salt pond. There is project for a new secondary treatment
plant that will replace this facility and discharge effluent through an ocean outfall,
already finished in 1995. Sewer lines have been extended in 1995. Sewage lift
stations are being provided with emergency generators.
24

St. Croix
The island relies on one primary wastewater treatment facility for servicing
Christiansted and Fredericksted (OIA, 1999). The treatment plant discharges to the
ocean. The sewage collection system consists of 140 km of gravity (mainly concrete
pipes) and force mains with three major sewage lift stations and twelve feeder pump
stations. These concrete pipes are suffering deterioration from hydrogen sulfide gas,
which produces sulfuric acid. Due to deterioration of sewage pipes provoked by the
combination of extended time of detention and the presence of sulfuric acid,
occasional raw sewage bypasses had to be made to mitigate health hazards and
environmental damage. The need of sewer line rehabilitation and replacement will
demand an effort estimated in $30 million.
25
4. Key issues for Integrating Water Resources Management
Several water resources management issues are crucial for facing the challenges of the
constrained St. Thomas water market. The following identifies issues as background to
formulate a strategy.
4.1. Environmental consequences of separate operation of water supply andwastewater
Is it desirable to have two different entities operating water supply and water
disposal?
In the case of the Virgin Islands, the fact that during the last decade's water supply
was designed as dependant primarily on desalinated water affected the culture and the
response to proper conservation of the environment (Donahue and Johnston, 1998).
This, combined with a water supplier (WAPA) independent from the wastewater
supplier (DPW), affects and conditions the final overall quality of water.
4.2. Reliability of public water system based in desalination. Frequency of extremeevents.
Is it possible to operate a reliable water system based only in one supply strategy
(desalination) in a place where the occurrence of extreme events is of high frequency?
In 1995, Hurricane Marilyn put the WAPA desalting facilities in St. Thomas out of
operation for six weeks (Donahue and Johnston, 1998). This meant no water AND no
power to operate cistern pumps at households for six weeks. This type of extreme
event is of high frequency in this zone. The total public reserves of water for these
periods of water scarcity, as shown in Table 4.1, span from 6 to 11 days of supply.
Moreover, if we consider the declared leaks of the system (water not accounted for
ascended in 1998 to 45 percent due to losses in the distribution system) this time will
be cut at half in an emergency.
26

4.3. Water costs and prices in this market
How can proper prices on water be managed in a market with these characteristics?
Water demand exceeds the possible supplies (Donahue and Johnston, 1998). Ranging
from the small cost of catchments of rainfall (with the dangerous water quality issues
inherent to such a system) to desalination water costs there are some alternatives that
must be analyzed, mainly to assure a basic and equitable water supply.
4.4. Health consequences derived of the system of rainfall water catchments
How can overall water quality be assured when catchments of rainfall is the main
water supply for more than 70% of the population? As it is reflected in the datum of
the last census, not much has changed in the distribution system of desalinated water.
Although all of the taxpayers have been involved in one way or the other in the
monies that are owed to the federal government, in part for desalination plant
acquisitions. Nevertheless, the benefit of desalinated water only reaches a fraction of
the population, as can be seen in Table 4.2.
27

Table 4.1
Available public supply.
(Partial datum taken from OIA, 1999).
Note: Daily per capita available public supply for St. Croix and St. John where taken over
permanent population datum, and still are low figures compared to US standards
Desalination Plants Production (WAPA) 16.84 0.57 14.00 31.42
Groundwater 0.50 0.50
Storage Capacity (in ML) 189.25 4.54 87.06 280.85
Storage Capacity in days of non-plant operation 11.24 8.00 6.22
Resident Population 51,181 4,197 53,234
Adding Tourist Population to Residents 130,000.00 no datum no datum
Daily available Supply (L/cap/day) 129.56 135.28 263.07
28

5. Water Supply on St. Thomas
5.1. Conjunctive use of harvested rainwater and desalinated water
General information has been given in the introduction on the water resources of the three
main islands that compose the US Virgin Islands. Now a more thorough description of
the water use and perspectives for water supply for the particular case of St. Thomas will
be analyzed.
Many of the practices described pertaining to water use is common to the three islands as
well as some of their neighboring Caribbean islands. "In most of the smaller islands of
the Caribbean, there is no single natural source of water that may be used to satisfy the
ever rising demand for consumption and sanitary purposes brought on mainly by
increasing standards of living and visitors arrival. Mountainous terrain makes buildable
land dear, and along with high evaporation rates make larger surface water
impoundments impractical. Groundwater supplies are limited due to high runoff rates and
little opportunity for recharge" (Smith, 1987).
In St. Thomas the only reliable and available water supply for all the population of the
island, still in 2003, is rainfall water catchments (referred as RWC from now on).
Although desalination is present in the island since 1962, it is not distributed throughout
the island. Desalinated seawater is only allocated in urban areas and in places where
population is denser in the island. Groundwater is used throughout the island but is only
privately operated. Today and because of groundwater contamination it is not considered
more than a last option complementary water resource. In the other hand almost all of the
resorts in the island are basing their water supply in privately owned reverse osmosis
systems (R/O from now on). The actual water use situation depends on the location of the
tourist resorts that conditions the possibility of having or not public supply, ranges from
total reliance on R/O system for all uses, to partial use of privately desalinated water for
irrigation. Three resorts are using R/O systems with an input of brackish ground water,
29

and the rest of them (around twenty-seven) use sea water as input (David Simons
interview, DPNR officer, 2003).
t A
Sast Enda S f '6721"
Water sland a
161
St. Thomas51,181
Figure 5.1
Key Map for subdistricts
(Source: US Census Bureau, 2002)
30
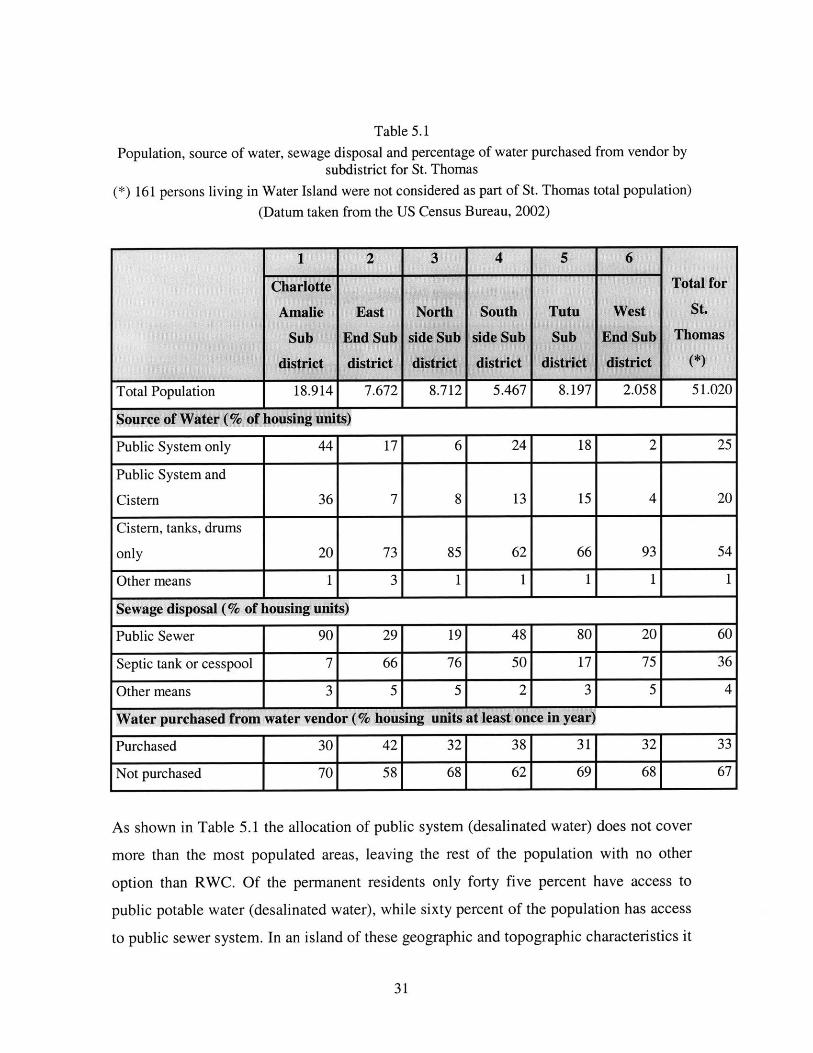
Table 5.1Population, source of water, sewage disposal and percentage of water purchased from vendor by
subdistrict for St. Thomas
(*) 161 persons living in Water Island were not considered as part of St. Thomas total population)
(Datum taken from the US Census Bureau, 2002)
Total Population 1 18 .9 141 7.6721 8.712 5.467 8.197 2.058 51.020
Source of Water (% of housing units)
Public System only 44 17 6 24 18 2 25
Public System and
Cistern 36 7 8 13 15 4 20
Cistern, tanks, drums
only 20 73 85 62 66 93 54
Other means 1 3 1 1 1 1 1
Sewage disposal (% of housing units)
Public Sewer 90 29 19 48 80 20 60
Septic tank or cesspool 7 66 76 50 17 75 36
Other means 3 5 5 21 3 5 4
Water purchased from water vendor (% housing units at least once in year)
Purchased [ 301 421 321 381 311 321 33
Not purchased 701 581 681 62] 691 681 67
As shown in Table 5.1 the allocation of public system (desalinated water) does not cover
more than the most populated areas, leaving the rest of the population with no other
option than RWC. Of the permanent residents only forty five percent have access to
public potable water (desalinated water), while sixty percent of the population has access
to public sewer system. In an island of these geographic and topographic characteristics it
31
is far more costly to develop and maintain a sewer system than to develop and maintain a
water supply system, taking into account that desalination plants already exist and are in
operation. Despite this fact and because of economic considerations, WAPA is not
planning to extend its distribution throughout the island. On the other hand, DPW is
working on extending the sewer system.
Totad Pier ane PbpLieion by stbxistict
WO 1/o 20% 30% 40% W/o /0 7/o 80% 90/ 10 /
Nier en ag
O 1-Chaotte Amndie SbcIstrict 0 2-East End S9i strict
0 3-Northside SixIstrict 0 4-Soitdlside S&xlsbict
0 5-TLitu Sixstrict 0 6-Vest End S&ixIstrict
Figure 5.2Total permanent population by subdistrict
(Data taken from the US Census Bureau, 2002)
32

St Thomas - Source of Water by Subdistrict
00
0,00 10,00 20,00 30,00 40,00 50,00 60,00 70,00 80,00 90,00 100,00
0 Public System only U Public System and Cistern 0 Cistern, tanks, drums only
Figure 5.3St. Thomas - Source of water by subdistrict
(Data taken from the US Census Bureau, 2002)
Note : subdistrict key is in Figure 4.1
33
6
5
4
3
2
0
In
.0
C,)
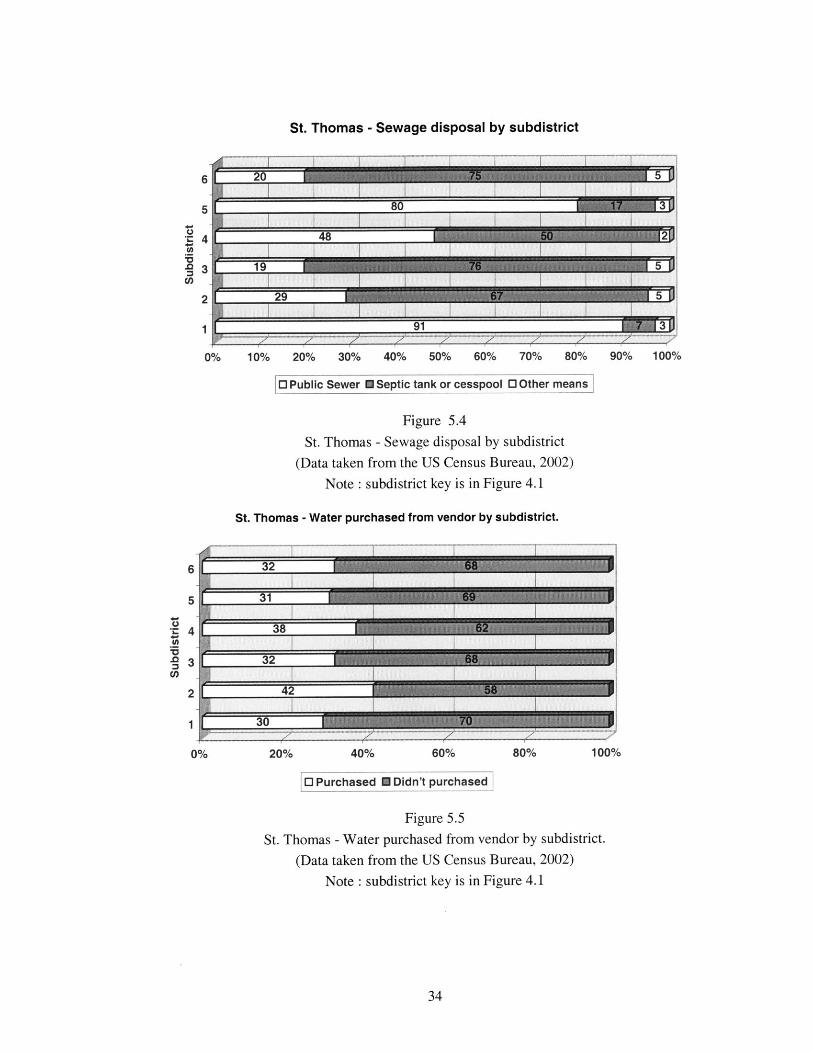
St. Thomas - Sewage disposal by subdistrict
<n
1
0% 10% 20% 30% 40% 50% 60% 70% 80% 90% 100%
0 Public Sewer U Septic tank or cesspool 0 Other means
Figure 5.4
St. Thomas - Sewage disposal by subdistrict
(Data taken from the US Census Bureau, 2002)
Note : subdistrict key is in Figure 4.1
St. Thomas - Water purchased from vendor by subdistrict.
20% 40% 60% 80%
0 Purchased M Didn't purchased
Figure 5.5St. Thomas - Water purchased from vendor by subdistrict.
(Data taken from the US Census Bureau, 2002)
Note : subdistrict key is in Figure 4.1
34
U
C,,
6
5
4
3
2
1
0% 100%

5.2. Available water supply
5.2.1. Definition of household types
Given the relative importance of residential use in the water resources management in
the island, a classification of households is proposed for this analysis. The different
types are defined according to the household available water supply as has been
discussed in the previous subsections.
o Household Type A: Household that is supplied only from the WAPA public
main
o Household Type B: Household that is supplied by a combination of public
system and RWC.
o Household Type C: Household that is only self-supplied by means of RWC.
5.2.2. Catchments of rainwater with cistern storage (RWC)
Determining a proper and representative estimate of the total available water supply is
not an easy task, mainly because of lack of datum.
GIS or aerial/satellite photograph analysis can give us an exact estimate of rainwater
rooftop surface available area for catchments. By measuring the total available roof
area of the different buildings that by US Virgin Islands law are required to have
rooftop catchments with cistern storage (according to table 5.2), we can come to a
good estimate of RWC. The difficult part of the calculations would be to incorporate
in the RWC available supply rainfall patterns. Such calculations should be made
using stochastic analysis.
35

Table 5.2 contains the standard of the USVI building code that sets the requirements
for the mandated cistern size of a household. Actually, the application of this code
grants exemptions to households that are supplied from WAPA's public system.
Table 5.2RWC (rainwater catchments in household)
required by the USVI building code for household types B and C
Single story dwelling 10.00 g/ft2 ( 407.85 1/m 2)
Multistory dwelling 15.00 g/ft2 ( 611.77 1/m 2)
Churches and warehouses 4.5 g/ft2 (122.00 /m 2)
Other buildings Exempted
For the purpose of this thesis, the RWC supply has been estimated according to the
housing units surveyed by the US Bureau of the Census (2002). This estimate will
leave out commercial and other sites that are not included in household type of
construction.
Total occupied housing units 19,458.
Median rooms= 3.9 r
Estimated surface per room = 12 m2
Annual rainfall average for St. Thomas = 102 cm
Total area of potential catchments:
ARwC= 19 ,4 5 8 x 3.9 r x 12 m2= 910,634 m 2
36

Assuming that all the houses are single unit dwellings, a potential rough total
available cistern capacity for households can be calculated as:
SRWC = 910,634 m2 x 0.407 m31m 2 = 371,402 m3 = 371.4 ML
This number should be the ideal total capacity if all household units comply with
local regulations. An average daily available supply can be calculated from this
capacity.
The method chosen involves calculating the yearly capacity according to the average
monthly rainfall for St. Thomas. According to Ruskin (1996), the following formula
can be applied to the Virgin Islands in order to determine the size of the cistern.
Using this formula, we can have another rough number of the storage capacity
potential of the RWC for households
Cw =0.01 x RA x CA x RE
Cw = water harvested in m3
RA = rainfall input in cm
CA = catchments area in m2
RE = runoff efficiency depending on the roof averaged at 0.85
Cw = 0.01 x 102 cm x 910,634 m2 x 0.85 = 785,519 m3 = 0.786 ML
This calculation yields a figure that is 113 percent of the government mandatory
requirements for cistern capacity.
For a simple household unit of 78 m 2, the total cistern needed will be
Cw = 0.01 x 102 cm x 78 m 2 x 0.85 = 67.62 m3 = 67,626 L
37

But according to the building code the total required cistern for this household will be
(using table 5.2):
Cw = 407.85 Im2 x 78m =31,812.3 L = 31.8 m3
Due to the high contribution of the cistern to the overall cost of a house, in places that
are served by the public system, like Charlotte Amalie, the 1995 building code
admitted a reduction on the cistern capacity. Besides that, enforcement of the building
code has not very strict during the past decade.
Ideally, this figure will be the total volume of water that households will have yearly.
Because of the uneven rainfall distribution pattern through the year as well as
between years this particular figure is subject to uncertainty and it can be predicted
stochastically and calculated on a monthly basis.
According to the data available, and having the number of inhabitants that lack public
water supply system, we can calculate the available supply for Household Type C.
Also the assumption that Household Type B will be using RWC for satisfying 70% of
its needs is made. One last assumption to be made is that the actual household
distribution corresponds to the population distribution.
Calculating the supply needed for Household Type C (54% of the population
according to table 5.1) and the partial supply for Household Type B (20% of the
population according to table 5.1), the total combined supply needed for these types
of households, considering a demand of 190 lpcd will be of:
SRwc = 51,181 c x (0.54+0.20 x 0.7) x 190 lpcd = 6,612,585 lpd = 6.61 MLD
This quantity can be met in regular years. For regular years, it is meant years in which
no prolonged droughts occur.
38

5.2.3. Saltwater conversion (desalination)
5.2.3.1.Distillation of sea water supply (SWS)
According to the OIA (1999)
Ssws = 13,240,000 lpd (3,498,018 gpd).
This value represents the theoretical limit of supply from WAPA under maximum
capacity.
Household Type A includes also a low-income population that lives in
government housing. According to data of the Virgin Islands Housing Authority
(VIHA-a government owned company), in 1979 18% of the population lived in
"projects" or community houses that where projected, constructed, financed and
rented to low-income population by the government. Regarding water supply,
these types of complexes are supplied from one metered connection to the public
main. Then, internally the distribution is made into each unit. The particularity is
that these types of users are "free-riders" of the public water system because
WAPA sells water to the government and the government in turn does not meter
internal consumption in each unit. In fact VIHA absorbs (subsidizes) the
difference between the real water used and the proportion of the flat rent that the
tenant is paying that pays the water bill. Today we can estimate that almost 9,000
people live in this type of housing units in St. Thomas. The public sector is by far
the largest property owner in the island as well as the largest client for WAPA,
although it is not the best client. Another consideration for water operation is that
government in the past years and due to its high fiscal debt with the federal
government (one billion dollars as of 1999) has not been honoring its debts with
suppliers (like WAPA) on a regular basis.
39

A review of WAPA's Balance Sheets, from the unaudited five-year summary of
operations (June 30, 1995 to June 30, 1999) under the concept of water sales is
included as Tables 5.3 and 5.4.
Table 5.3
Annual WAPA Water Sales for St. Thomas in ML
Note: Information totals the three islands water supply.
Around 50 % corresponds to St. Thomas.
Residential 995,686 987,635 1,069,751 1,000,251 996,110
Commercial 1,612,607 1,713,326 1,860,301 1,327,324 1,442,093
Government 2,801,699 2,789,571 2,711,188 2,707,195 2,750,912
Other government 21,892 17,805 21,961 26,033 6,154
Standpipe 260,571 254,905 214,958 264,746 390,673
Total 5,692,455 5,763,242 5,878,158 5,325,548 5,585,941
Table 5.49-
Annual WAPA Water Sales for US Virgin Islands in MGal
Note: Information totals the three islands water supply.
Around 50 % corresponds to St. Thomas.
Water sales (MG) 1999 1998 1997 1996 1995
Residential 263,061 260,934 282,629 264,267 263,173
Commercial 426,052 452,662 491,493 350,680 381,002
Government 740,211 737,007 716,298 715,243 726,793
Other government 5,784 4,704 5,802 6,878 1,626
Standpipe 68,843 67,346 56,792 69,946 103,216
Total 1,503,951 1,522,653 1,553,014 1,407,014 1,475,810
40

It is to be noticed that in a water-constrained environment, 18% of the population
that lives in public housing are not paying for the water they consume. This
considerable fraction of the population is not developing a habit of water
conservation practices. This behavior is subsidized by the government and has a
clear irrationality from the point of view of water conservation principles.
Another crucial issue in understanding the water distribution pattern in the islands
is the remarkable economic cross-subsidies that are embedded in the system.
From tables 5.3 and 5.4 it can be appreciated as it was mentioned that government
is the main client for WAPA.
Regarding water distribution for the island of St Thomas, it is not in WAPA's
plans to expand the system to the areas with no service. WAPA's efforts are
limited to maintaining and operating the existing system. The reason WAPA will
not be expanding the distribution is because it is not a cost-effective supply (based
on information collected through interviews with WAPA personnel).
5.2.3.2.Reverse osmosis supply (SWRO)
We must consider the installed capacity of SWRO in the resorts that are scattered
throughout the coastal areas of the island, some of them having at least low
season surplus of water, as they have generally designed their plants as either
main or complementary to their peak occupation demand. The approximate
number of resorts that are currently operating R/O plants is 30 for St. Thomas
Island. The estimate for this water supply has been taken from the discharge
permits of the resorts (DPNR, 2003).
The estimate will be of 150 lpcd (40 gpcd) by each bed available. It is also
assumed that these resorts operate 2200 beds (more than half of the available
tourist beds that are of approximately 3800).
41

SRO' = 2200 c x 151 lpcd = 332,200 lpd (87,768 gpd)
The actual production ranges of these R/O plants go from 5000 gpd to the
maximum permitted by DPNR (as of brackish water intake) of 20,000 gpd.
Therefore, another way to calculate this figure will be:
SRO = 30 c x 47,312 lpd = 1,419,375 lpd (375,000 gpd).
This supply is private and is intended for internal use of the plant owner. In a
scenario of water market practices, it is possible for some of these operators to be
enticed by the possibility of allocating their surplus production at a convenient
price to other users.
5.2.4. Groundwater supplies
The use of groundwater in St. Thomas is limited due to actual contamination as well
as because of the aquifers' special geologic characteristics. Although fresh water
wells are rarely used in St. Thomas today, they are an excellent source of brackish
water with less salinity than sea water, requiring a less costly desalinization process
than sea water. It can also replace actual non-drinking water uses that are being met
with potable water that could be allocated into a more productive or crucial use.
DPNR is limiting the total water to be extracted from a well to 20,000 gpd. Assuming
that the quantity of active wells in St. Thomas can be estimated as around 20 wells,
groundwater could supply:
SGW = 20 w x 75,700 lpwd = 1,514,000 lpd (400,000 gpd).
42

Groundwater in the island cannot be considered a safe source of freshwater for
direct human consumption, unless water quality control is monitored and assured,
although some of the water vendors extract and purify this water.
5.2.5. Hauled water
Whenever Households Type C, resorts and stores run out of cistern water, the last
resource for their water need is trucked water. Today around twenty different
private water suppliers and water haulers operate in St. Thomas. They truck water
from the WAPA standpipe at the plant at Krum Bay to the cistern that needs to be
filled. This supply does not generate water, it is only an expensive allocation
mechanism for what WAPA and rainwater cannot cover. Some of these water
haulers also operate their service based in selling water extracted from wells.
These particular suppliers also need to treat the groundwater extracted in their
own facilities (usually R/O).
5.2.6. Total available water supply
Just for comparing the figures calculated for demand and the available supply, it
is useful to analyze a rough supply number. As RWC available supply is a
difficult number to grasp, interpolation should be made for this supply as a low
figure from the actual demand that is being satisfied without buying "external"
water in each household.
S = SRWC + SSWS + SRO + SGW
S = 6,589,733 lpd + 13,240,000 lpd + 1,419,375 lpd + 1,514,000 lpd
S = 22,763,108 lpd (6,014,031 gpd)
43

Table 5.5
Summary of water estimated supply for St. Thomas.
Rainwater 6,589,733 1,741,013
Desalinated 13,240,000 3,498,018
Estimated R/O 1,419,375 375,000
Groundwater 1,514,000 400,000
Total 22,763,108 601,4031
Ground water7%
Estimated R/O6% / Rainwater
29%
Desalinated58%
Figure 5.6
Summary of estimated water supply for St Thomas.
Percentage by source.
44

5.3. Analysis of the three different types of household in relation to water supply
5.3.1. Type A (HA):
A Type A Household is one that is supplied only from a public main (desalinated
water from WAPA). WAPA charges a lower price for the first 3.785 m3 consumed
each month, and from then bills a surcharge of twelve percent as a penalty for
excessive consumption. (See Section 6.2.)
The supply curve for this type will be as follows:
Household Type A- Supply
6,00-
5,00 -
4,00Price 3,00
U$2,00 -
1,00 -
0,00 - -
0 2.000 4.000
Quantity(L)
6.000 8.000
Figure 5.7Supply curve for Household Type A
(Data from interviews with stakeholders and cited bibliography)
45

5.3.2. Type B (HB):
The Type B Household is one that is supplied by a combination of public system and
RWC. First RWC is consumed and then water from the public main is used. In
addition, a combined use can be presented depending on the strategy of each
household.
Household Type B- Supply
6,00-
5,00
4,00 1Price 3,00 -
U$2,00-
1,00-
0,000 5.000 10.000 15.000 20.000
Quantity(thousand liters)
Figure 5.8Supply curve for Household Type B
(Data from interviews with stakeholders and cited bibliography)
46

5.3.3. Type C (HC):
The Type C Household is one that is only self-supplied by means of RWC. After
RWC water is finished, water should be hauled to fill the cistern (water
hauled/trucking).
Household Type C-Supply
18,00-16,00-14,00-12,00-10,00-8,00 -6,00-4,00 V2,00-0,00
0 2.000 4.000 6.000 8.000 10.000 12.000
Quantity (L)
Figure 5.9Supply curve for Household Type C
(Data from interviews with stakeholders and cited bibliography)
47
PriceU$
i M

6. Water Demand
Water is allocated only for residential household and community uses (schools, hospitals,
government), resorts and commercial demand. Water demands for irrigated agriculture
and for industry are negligible in the island. Water demand can be classified and
calculated as follows:
6.1. Household Demand
Not every household has the same access and possibilities of being supplied with the type
of water they could demand. The difficulty to estimate a demand curve for a supplier lies
in the rooted tradition of RWC in every household. Demand will be analyzed
incorporating the demand of the population served by rainwater. The most important
aspect of rainwater demand lies in that it is the means of supply for 74% of the
population. We have three different types of households from the point of supply, and the
available supply conditions the demand of each one.
o Type A (HA): Household that is supplied only from a public main (desalinated
water from WAPA)
o Type B (HB): Household that is supplied by a combination of public system and
RWC.
o Type C (HC): Household that is only self-supplied by means of RWC.
Local estimates of the average water demand on the island range from 110 to 230 lpcd
(30 to 60 gpcd) (Peebles, 1979). Actual demand calculations based on the last census
held in 2000 will take into account 190 lpcd (50 gpcd).
DR =190 lpcd x 51,181 c = 9,724,390 lpd (2,569,122 gpd)
48

6.2. Tourism Peak Demand
Regarding the composition of the visitors' inflow, it must be noted that for St. Thomas
approximately two thirds of them came by sea cruise and the rest by air. Sea cruise
tourists have the particularity of having shorter stays and living mainly in their cruise ship
environment. It is difficult to assign a number on their impact over water supply and
wastewater generation. However, it can be assumed that the length of their stay is of one
day and it can be assigned a consumption of 57 lpcd (15 gpcd) (Peebles, 1979).
The rest of the island visitors come by air and they account for the majority of tourism
revenues. According to the latest available figures for tourism for the year 1997, the total
visitors to the three islands were 2,100,000, and accounted for more than 60% of the US
Virgin Islands gross domestic product. Breaking up this number, 24% of the tourists
(505,880) had night stayovers and the remaining 76% (1,619,000) had one-day visits
from cruises and yachts (mainly harbored in Charlotte Amalie, St. Thomas).
As was mentioned in Chapter 4, the peak population of this is estimated by some authors
to be around 130,000 persons (Donahue and Johnston, 1998). According to this figure,
and subtracting the actual total population, it can be considered at a peak day the presence
of around 80,000 tourists in the islands, assuming that a portion of them will be staying
overnight in the island and the rest will be just for the day, as it has been discussed in the
introduction:
DT = 80,000 c x (0.24 x 400 lpcd + 0.76 x 55 lpcd) = 11,024,000 lpd (2,912,549 gpd)
It is better to estimate peak demand on total visitors present in the island because by
considering only hotel rooms declared will keep out of demand calculations visitors that
will stay in unoccupied households and other means not accounted for in hotel room
counts, which will yield a significantly lower demand.
49
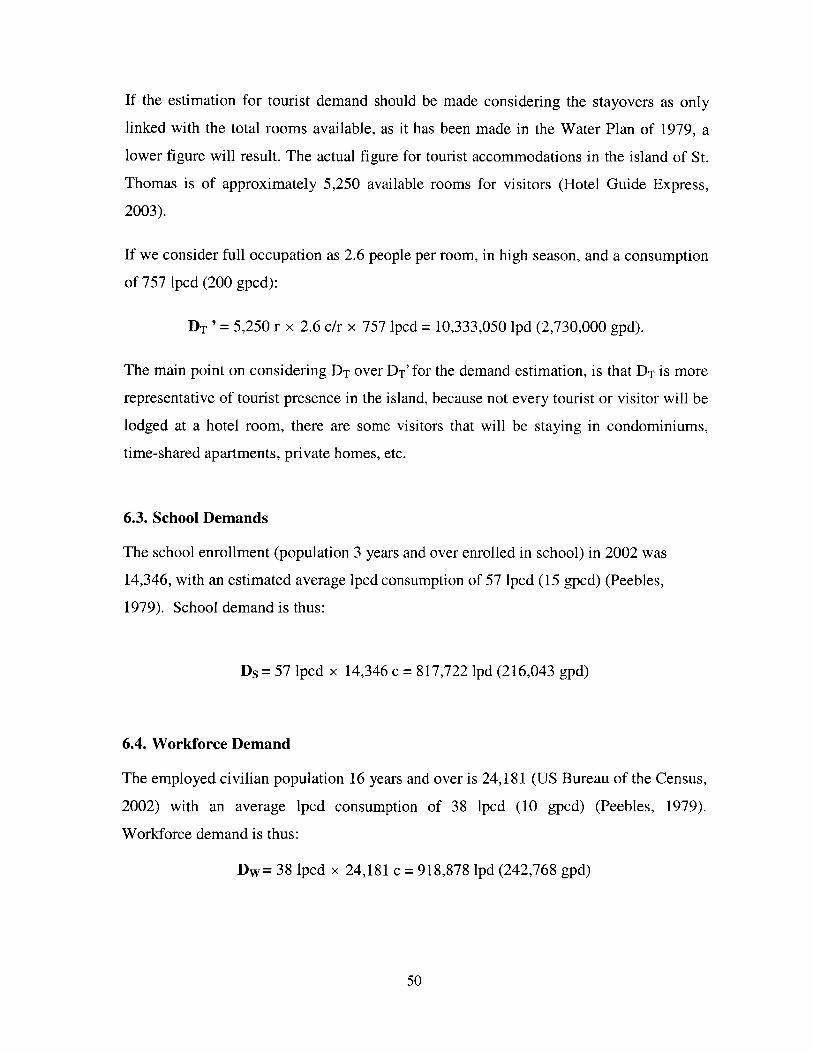
If the estimation for tourist demand should be made considering the stayovers as only
linked with the total rooms available, as it has been made in the Water Plan of 1979, a
lower figure will result. The actual figure for tourist accommodations in the island of St.
Thomas is of approximately 5,250 available rooms for visitors (Hotel Guide Express,
2003).
If we consider full occupation as 2.6 people per room, in high season, and a consumption
of 757 lpcd (200 gpcd):
DT '= 5,250 r x 2.6 dr x 757 lpcd = 10,333,050 lpd (2,730,000 gpd).
The main point on considering DT over DT' for the demand estimation, is that DT is more
representative of tourist presence in the island, because not every tourist or visitor will be
lodged at a hotel room, there are some visitors that will be staying in condominiums,
time-shared apartments, private homes, etc.
6.3. School Demands
The school enrollment (population 3 years and over enrolled in school) in 2002 was
14,346, with an estimated average lpcd consumption of 57 lpcd (15 gpcd) (Peebles,
1979). School demand is thus:
Ds= 57 lpcd x 14,346 c = 817,722 lpd (216,043 gpd)
6.4. Workforce Demand
The employed civilian population 16 years and over is 24,181 (US Bureau of the Census,
2002) with an average lpcd consumption of 38 lpcd (10 gpcd) (Peebles, 1979).
Workforce demand is thus:
Dw= 38 lpcd x 24,181 c = 918,878 lpd (242,768 gpd)
50

6.5. Hospitals Demands
The count of hospital beds on St. Thomas is 240 with an estimated average lpcd
consumption of 757 lpcd (200 gpd) (Peebles, 1979). Hospital demand is thus:
DH = 757 lpcd x 240 c = 181,680 lpd (48,000 gpd)
6.6. Irrigation, miscellaneous and other needs (bars, car-wash, Laundromats, etc.)
These demands were included by Peebles in his water plan for the US Virgin Islands
(Peebles, 1979) but are impacted by the same proportion as the population growth
coefficient (from 44,000 to 51,181, which yields a coefficient of 1.163). The water plan
figure was 749,430 lpd (198,000 gpd) (Peebles, 1979). Current estimated demand is thus:
Dm=749,430 lpd x 1, 163 = 871,578 lpd (230,274 gpd)
6.7. Declared public system unaccounted for water (UAFW leakage and illegalconnections)
From an interview with Mr. Glenn Rothgeb, Assistant Director of WAPA, 15% of their
water was cited as the actual figure for the UAFW. Taking into consideration the actual
production of WAPA as 13,240,000 lpd (3,498,018 gpd)
Du '= 13, 240,000 lpd x 0.15 = 1,986,000 lpd (524,703 gpd).
This value of Du seems to be optimistic. More pessimistic figures produced by the OIA
for 1998 rose to 45% of UAFW in the public system. It is also obvious the efforts that
WAPA made in the past few years for diminishing the UAFW. But it is possible that the
actual figure will be higher than 15%. For calculation purposes, 25% of UAFW will be
considered. On the visit and tour of the St. Thomas public water system, guided by Mr.
Rodriguez Jiminian, I could check that the system is gradually being upgraded and a
program of controls on 64 points of quality and pressure will in the near future get the
51
values of UAFW. The standard for UAFW in this type of operation is usually 5% to
10%.
Du = 13, 240,000 lpd x 0.25 = 3,310,000 lpd (874,505 gpd).
6.8. Total non-tourist related demand
This demand is considered more stable throughout the year, having smaller ranges of
dispersion, but it must be considered that its peak will also be coincident with the tourism
water demand peak.
DNT DR+Ds+Dw+DH+DM+Du '= 9,724,390 + 817,722 + 918,878 + 181,680 +
871,587 + 1,986,000 = 14,500,257 lpd (3,830,979 gpd)
Or
DNr= DR+DS+Dw+DH+DM+DU = 9,724,390 + 817,722 + 918,878 + 181,680 + 871,587
+ 3,310,000 = 15,824,257 lpd (4,180,781 gpd)
6.9. Total Peak demand including tourism demand
Tourism demand is highly seasonal and to calculate its demand, it must be taken into
account statistical tourism data. Unfortunately the available data are not updated or are
not geographically broken by island. To make a proper model of water demand it should
be studied on a monthly basis or at least quarterly. One important issue to take into
consideration is that the period of peak demand occurs in the dry season period.
Therefore, it is of great importance the strategy of water reservoir that can be applied to
the system year round. Reservoir in this particular case should be understood to be
referring only to cisterns, either public, or private. No major reservoir or impoundment is
meant (with the sole exception of salt ponds that can be last resource reservoir of saline
or brackish water).
52
D'= D '+ DT =
D' =14,500,257 lpd + 12,128,000 lpd = 27,137,647 lpd (7,169,788 gpd)
Or
D=DNT + DT =
D =15,824,257 lpd + 12,128,000 lpd = 27,952,257 lpd (7,385,008 gpd)
To check this estimation its value should be compared to the peak available WAPA
demand of 13.24 MLD (4.498 MGD, which will cover for 47.4% of D), a figure that is
consistent with the available census datum.
53

Table 6.1
Summary of water estimated demand for St. Thomas.
Units in liters
Residential 190 51.181 9.724.390
School 57 14.346 817.722
Workforce 38 24.181 918.878
Hospitals 757 240 181.680
Miscellaneous (irrigation, other intensive) 871.587
UAFW 3.310.000
TOTAL LOCAL DEMAND 15.824.257
Tourism Peak stayovers 400 19.200 7.680.000
Tourism Peak for the day 55 60.800 3.344.000
TOTAL TOURISM RELATED DEMAND At peak 11.024.000
TOTAL DEMAND 26.848.257
UAFW12%
Other3%
Hospitals1%
Workforce3%
School3%
Tourism Peak stayovers32%
Tourism Peak for theday11%
Residential35%
Figure 6.1
Water use from all sources of supply,
Total peak demand including tourism demand
54

7. Supply and Demand
7.1. Estimated Available Supply vs. Peak Demand
According to the calculations that have been made in the last two chapters, it is to be
noticed that supply (S) and demand (D) are related as follows:
S = 22,763,108 lpd (6,014,031 gpd)
D = 27,952,257 lpd (7,385,008 gpd)
D-S = 5,189,149 lpd (1,370,977 gpd)
This value, D-S, represents the theoretical deficit in available supply during peak
demand.
7.2. Estimated Available Supply vs. Local Demand
This can be representative of the low season in the island:
S = 22,763,108 lpd (6,014,031 gpd)
DNT = 15,824,257 lpd (4,180,781 gpd)
S -Dr = 6,938,851 lpd (1,833,250 gpd)
This value represents the theoretical available base local supply surplus in tourism low
season.
It is clear from this summary that in order to provide for the local water demand and
continue successful operations of the fundamental tourism industry at the same time,
freshwater augmentation is a major concern.
55

8. Evaluation of alternative and feasible supply options that can augment the actual
water resources
Based on the classification identified in the "Source Book of Alternative Technologies
for Freshwater Augmentation" (UNEP, 1998), an analysis of chosen applicable
technologies for St. Thomas will be enumerated. The main objective of this section is to
discuss the alternative available technologies taking as a base the experience of typical
high volcanic islands with similar characteristics as St. Thomas. The purpose of this
evaluation is to provide an inventory that can be taken into account by the different actors
to make informed choices in maximizing the resources of the island.
In this classification there are a subset of four groups of technologies that can be applied:
" Freshwater augmentation
o RWC (rain water catchments)
o Wells
o Water importation
o Submarine piping
" Water quality improvement
o Desalination
" Desalination by distillation
" Desalination by reverse osmosis
" Wastewater treatment technologies and reuse
o Wastewater reuse
o Alternative dry sanitation
" Water conservation
o Water resources planning and management in an integrated way.
o Water conservation and protection measures
56

Table 8.1
Technologies for freshwater augmentation
St. Thomas summary
Specificfreshwateraugmentation
RWC Yes Yes
Wells Yes Yes
Importation Yes Yes
Submarine piping Yes
Water quality Desalination by Yes Yesimprovement distillationtechnologies Desalination by reverse Yes Yes
osmosis
Wastewater Wastewater reuse Yes
treatment Alternative drytechnologies and sanitation Yesreuse
Water Water conservation and Yes Yesconservation protection measures
Some of the technologies enumerated in table 8.1 have been applied in the past in the
USVI, the rest of them should be considered as part of an evaluation of the overall water
resources strategies to be discussed between the actors of this particular market.
57

A more extensive coverage will be given to freshwater augmentation technologies and
water quality improvement technologies in the rest of the section. Water reuse and
conservation should be analyzed in a broader specific analysis that exceeds the extension
of this thesis effort. Nonetheless wastewater reuse and conservation are complementary
measures that should be carefully considered by water planners in the St. Thomas market.
8.1. Specific Freshwater Augmentation Technologies
8.1.1. Rainwater Harvesting (RWC)
Extent of Use RWC is currently extensively applied in the island.
Operation and Maintenance Due to the simplicity of this technology, operation is
not a concern. If the materials and the installation of these systems are carefully
selected, and regular maintenance is practiced, this system can be of great use. The
main concern is water quality.
Level of Involvement It is important to notice that the USVI experience in the matter
is one of the most successful in the area. The main cause of the success of this system
lies in the government regulatory participation since rainwater harvesting has been
regulated in design for households. This successful policy should be sustained and
enforced. RWC should still be enforced by law for all households.
Costs and prices The appropriate way of calculating the cost of RWC has been
discussed in several local researches. Ruskin (1996) estimates that the cost of the
RWC system consisting of the roof, the gutters, the rainwater pipes and the cistern
costs from 25.5 to 39% of the cost of a house. The estimated cost by considering the
monthly mortgage payment for an average house in St. Thomas gives the result
according to the cited author of $5.28/month/1000 L ($20/month/1000 gal) also an
estimation on its further maintenance is mentioned. Another publication (UNEP,
1997) gives a cost of $2-5/month/1000 L ($7.57-18.95/month/1000 gal) of water for
58

RWC. The real value will depend on different characteristics of each house. As the
materials used for the different components, water consumed that will repay the
construction investment before or after a certain period, water use habits and rainfall
patterns.
Suitability This option is most suitable for islands where precipitation presents an
even distribution year round, which as seen in previous sections is not the St. Thomas
case.
Advantages This option represents a readily available source of water at the point of
use. As it depends on household operation, this option does not involve public
operation and management. It is an acceptable supplemental source.
Disadvantages This technology is climate dependant.. There is a high risk of
contamination of water, mainly in the catchments area. Drought management in the
case of St. Thomas is usually required in a household basis.
Further development of the technology Improvement of this well established
technology at the household level should be routinely targeted by continuous
education at the public level. This would be a joint task for the DPNR and the
Department of Public Health (SIWIN, 1996).
8.1.2. Groundwater extraction (wells)
Extent of Use This option is extensively applied in the island but in decrease due to
water quality considerations.
Effectiveness of the technology It must be noted that the USGS has made a
groundwater assessment in the island on 1962 (USGS, 1962). As a result of that study
a total amount of 396,300 lpd (1,500,000 gpd) was determined as available if the
groundwater extraction can be maximized. This can be achieved after solving the
serious contamination of the ground that is registered today in the island. A good
example of this fact is the contamination in the most productive aquifer in the island,
59

the Tutu wellfield. Reports produced by the DPNR from 1987 to 1990, indicated the
presence of VOC's in the groundwater. Twenty two commercial, residential and
public wells were contaminated with compounds such as tetrachloroethylene,
benzene, 1,2-dichloroethylene, and trichloroethylene, supposedly since 1983. As a
consequence of this several wells were shut and remediation had to be enforced
(Donahue and Johnston, 1998).
Suitability In the case of St. Thomas, this source is limited as a reliable supply by
both quantity and quality.
Advantages Although the discussed problems of contamination should be addressed
and solved, groundwater can still present a significant source of supplemental water
resources.
Disadvantages Groundwater utilization requires skilled and site experienced
personnel, mainly because of the volcanic nature of the soil.
Further development of the technology Not much can be added to this well
established technology. What should be taken into account in the St. Thomas case is
the need for maintaining in the long term the actual policy of control of extraction and
well head protection. More control over small wells (less than 1893 lpd or 500 gpm)
should be implemented. This will make possible at least return to the levels of
reliability of part of the baseline available supply for safe groundwater (SIWIN,
1996).
8.1.3. Importation using sea transport commonly referred as "Barging"
Technical Description Water conveyance is seen today as a last resource freshwater
augmentation. The vessels or barges should be sized in order to have a capacity that
will make transportation cost-efficient.
Extent of Use This alternative was extensively applied in the island in the past. The
source from which water was conveyed was mainly Puerto Rico. As a paradox, today
WAPA is targeting to increase its sales to the passenger cruises that dock in Charlotte
60

Amalie. Desalinated water is being exported rather than imported. This does not
imply that water is not scarce in the territory, but rather that if WAPA plays by the
market rules, as a revenue generating company, it should naturally target such clients
whose characteristics are regularity in purchase and timely payment.
Operation and Maintenance Due to its cost, the efficiency in the operation of the
barges is crucial. The more important fraction of this cost includes the infrastructures
in port of destiny and port of delivery as well as the suitable size of the barge. Usual
maintenance includes regular inspection and cleaning of tanks to keep water
uncontaminated.
Level of Involvement Because of costs and volumes it is usually a resort of the
government to decide on importing water in a particular case.
Costs and prices The cost varies from island to island, in the particular St. Thomas
case, the last reported cost for barging water from Puerto Rico was reported as $4.65
per m' in 1985 (UNEP, 1998).
Suitability The only limitation is the need of proper infrastructure associated to the
water handling during loading and unloading. Sources with adequate water resources
at an economically feasible distance should be chosen. In the particular St. Thomas'
case the source of conveyed water, in the past was Puerto Rico.
Advantages After hurricanes or severe droughts, it has the ability to provide
emergency supplemental water supply.
Disadvantages Weather can have a negative impact on transportation efficiency. In
addition, investment in an adequate distribution infrastructure is needed.
Cultural acceptability The wrong but rooted association of water with territorial
sovereignty is the principal block for reliance from out of USVI importation (UNEP,
1998).
61

8.1.4. Submarine Pipelines
Technical Description Pipes are installed underwater to convey water to small and
water-scarce islands, mainly from nearby continents or larger islands. It may be done
by gravity flow or by pumping, depending on the extension and the layout
characteristics.
Extent of Use It is not used today in the island. In the near future a pipe will connect
St. Thomas and St. John in the Red Hook zone in the east end of the island. The
principal limitation of the system has to do with the costs of engineering and
maintenance. The best examples of this technology are in the oil offshore extraction
industry. An example of a continuous pipe of 7.4 kilometers and at a depth of 850 m
was installed in Ceiba oil field development (Everest Field, Gulf of Niger). The
Island of Vieques is supplied with water from Puerto Rico with a submarine pipe
built in 1979 (Peebles, 1979). Other cases of islands to which water pipes have been
installed is Vetmanna Island in Iceland (14 Km in length, 1968), Seychelles 5 km
(was damaged in a storm), Fiji, Hong Kong Island, Shangai, Lantau Island in Hawaii,
Penang in Malasya (3.5 km), and Xiamen Island in China (2.3 Km).
Operation and Maintenance Operationally there is not much difference from a
regular terrestrial pipeline. The only special requirement is the inspection of the
pipeline in particular after storms. The elements that require special design are the
anchors blocks that have to be carefully designed to avoid damage by tidal flows and
storms.
Level of Involvement Because of the highly specialized engineering requirements
for the use of this technology, the stage of feasibility studies should be carefully
considered. The most important factors to consider in the design of the system are:
the pipeline route, bathymetry (water depth), sea floor conditions and oceanic
currents.
Effectiveness of the technology This technology is usually regarded as costly, and
only suitable for short distances. Technology for this type of installation has been
greatly improved by offshore oil extraction, and can be implemented today with more
62

competitive costs. Continuous flexible pipelines are commercially available in a
variety of length. The main experience for this technology should be taken from
offshore oil platform installation. It is usual to deal with depths of up to 850 m, and
pipes are produced between 2 inches to 16 inches of internal diameter. The
operating pressures of these pipes exceed that needed for this water service (around
5000 psi). Being that the oil refining industry is one of the main activities in St.
Croix, technology and expertise for this type of technology would not be an
impediment.
Suitability This technology is suitable when the distances between the island and the
source of surplus water resources is such that it is economically feasible. In the case
of St. Thomas in order to analyze the suitability of this technique, which is often
regarded as possible for distances that do not exceed 2 to 5 km, an analysis will be
made.
Advantages Once installed, the operational costs are minimal if operated by gravity-
fed supply. The possibility of interconnectivity reduces dependence on desalination,
and minimizes the environmental impact of the actual desalination production. This
alternative can provide St. Thomas with a reliable and abundant alternative source.
The costs that should be incurred by St. Thomas could be shared with Isla de
Culebras and Isla de Vieques. In addition, Puerto Rico or investors from Puerto Rico,
in its possible interest for selling water on a regular basis, can finance part of this
project.
Disadvantages Initially the installation costs are high. This type of infrastructure is
subject to damages during storms and tidal flows. Marine environmental impact
should be carefully considered and evaluated..
Cultural acceptability As has happened with barging in the past, the fact of relying
on off-island water source can stir some animosity. However, the fact that all of the
vegetables fruits are barged from Puerto Rico is also another way of importing water
from that place, and relying on the quality of their irrigation water supply.
63

Further development of the technology As pipe materials and installation
techniques improve, mainly driven by the oil industry, this technology will become
more cost effective and reliable.
As an example of the commercially available materials that can be adopted for this
type of supply see fig 8.1.
Figure 8.1Continuous flexible pipeline
Source: NKT Flexibles
This particular pipe is an unbounded composite structure flexible pipe. The different
layers are composed of:
1. Carcass: An interlocking structure manufactured from a metallic strip. The
carcass prevents collapse of the inner liner and provides mechanical
protection
2. Inner liner: An extruded polymer layer providing internal fluid integrity.
3. Pressure armor: A number of structural layers consisting of helically wound
C-shaped metallic wires and/or metallic strips that provide resistance to
radial loads.
4. Tensile armor: A number of structural layers consisting of helically wound
flat metallic wires. The layers are counter wound in pairs. The tensile armor
layers provide resistance to axial tension loads.
64
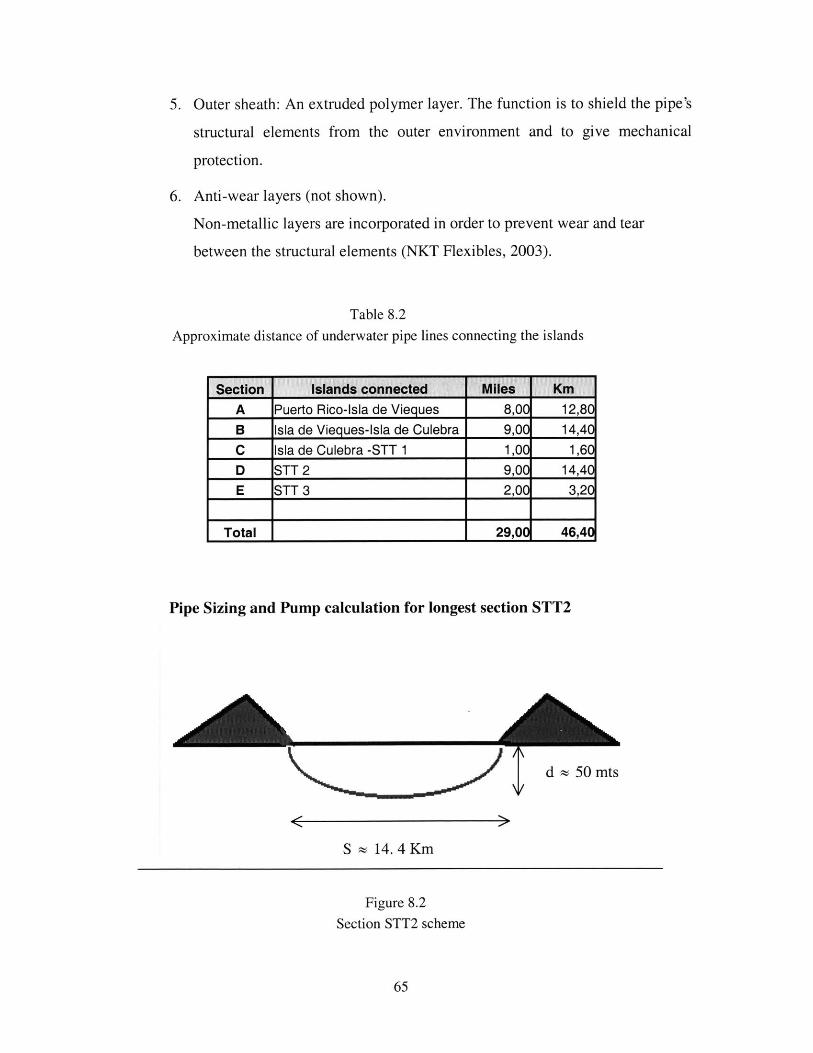
5. Outer sheath: An extruded polymer layer. The function is to shield the pipe's
structural elements from the outer environment and to give mechanical
protection.
6. Anti-wear layers (not shown).
Non-metallic layers are incorporated in order to prevent wear and tear
between the structural elements (NKT Flexibles, 2003).
Table 8.2Approximate distance of underwater pipe lines connecting the islands
A Puerto Rico-Isla de Vieques 8,0 12,8CB Isla de Vieques-Isla de Culebra 9,0 14,4
C Isla de Culebra -STT 1 1,0 1,6D STT 2 9,0 14,4
E STT 3 2,0 3,2C
Total 1 29,0 46,4C
Pipe Sizing and Pump calculation for longest section STT2
Td 50 mts
S ~ 14.4 Km
Figure 8.2
Section STT2 scheme
65

Idealizing the pipe as a catenary its total length can be calculated asL=d 2 (50m) 2
L= + + 14400 m = 14400,003m54 S 54 x 14,400 m
As the d term is negligible the calculations will be made with the values from
table 8.1
1)Using the Bernoulli Theorem
105 Pi Vi 10 p2 V 2
pjg 2g, p2gn 2g,
2)As pi = p2 and Vi= V2 and zi= Z2
105(P(pi,
pign
p2)=hL
3) hL = 22.96KQ2
dvRe = -p
p
21.22Qv =
d 2
Power needed (Kw) = QHp6116x10 3 xep
Where
p relative pressure
v average fluid velocity
p = fluid (water) density
g gravity acceleration
hL = head loss due to fluid flow
K = resistance coefficient
Q = flow
d = interior diameter of the pipe
Re = Reynolds number
p = fluid (water) absolute or dynamic viscosity
H = Total head
66

4) 450 Elbows (assumed 2 un/l00mts) to simulate sea bed irregularities
K =16x ft x 280 = 4480x ft
900 Elbows (assumed 1 un/1000mts) to simulate sea bed irregularities
K = 30 x ft x 15 = 450 x ft
Check Valves 2
K =100 x ft x 2 = 200x ft
Gate Valves 3
K =8 x ft x 280 = 24 x ft
Choosing a 14" (333.3 mm internal diameter) ft = 0.013
Where ft = friction factor in the zone of total turbulence
KeLKpipe =L xD
14,400ft = 333.3
5) d = 333.3
p = 9 9 8 .2
p = 0.98
ft = 0.013
21.22 x 4006) v 1.91
333.32
Re = 333.3 x 1.91x 998.2 = 6.48 x 10'.98
f = 0.0145
7) K = 14400 x 0.0 145 x 1000 - 609333.3
Ktot =609 + (4480 + 450 + 200 + 24) x 0.013 = 676
8) hL = 22.96 x 696 x 10,0002 - 130m333.34
9)H = 130mts
Power needed =10000 x 130 x 998.2
=304 Kw 395 HP6116 x 103 xO0.7
67

(Crane, 1992)
Where f represents the friction factor
Pipe and pump first option:
# = 14"=355.6mm
Pump
H =150 m =15 bar
Power = 400 HP
Second Choice: Another choice of pipes that will be recommendable is to have two or
more pipes for increased reliability.
# = 2x10"=2x273mm
This will result in a difference in pressure drop in the section of
bar(0.084 -0.081) x 14, 400m =0.05 Bar (negligible difference)
Pump
H =150 m=15 bar
Power=2x153Kw~ 2x205HP=410 HP
(Crane, 1992)
Third option: The third alternative proposed has to do with reducing costs of
installation.
68
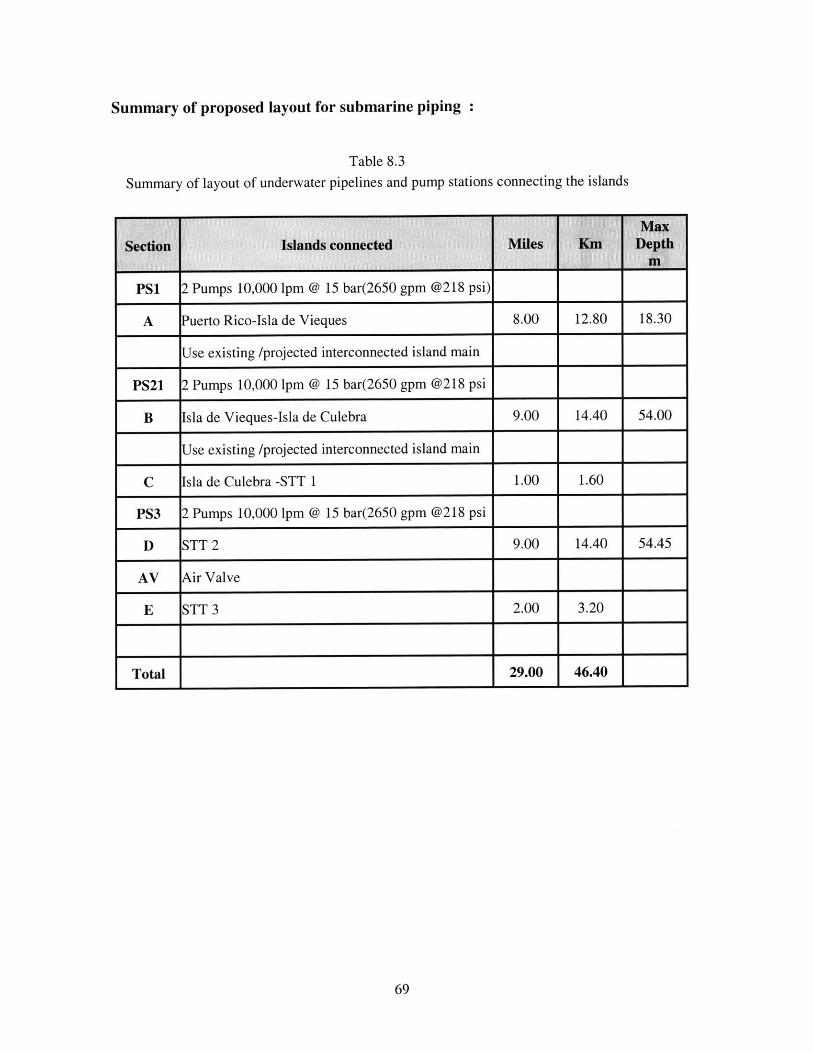
Summary of proposed layout for submarine piping :
Table 8.3
Summary of layout of underwater pipelines and pump stations connecting the islands
Psi 2 Pumps 10,000 pm @ 15 bar(2650 gpm @218 psi)
A Puerto Rico-Isla de Vieques 8.00 12.80 18.30
Use existing /projected interconnected island main
PS21 2 Pumps 10,000 pm @ 15 bar(2650 gpm @218 psi
B Isla de Vieques-Isla de Culebra 9.00 14.40 54.00
Use existing /projected interconnected island main
C Isla de Culebra -STT 1 1.00 1.60
PS3 2 Pumps 10,000 1pm @ 15 bar(2650 gpm @218 psi
D STT 2 9.00 14.40 54.45
AV Air Valve
E STT 3 2.00 3.20
Total 29.00 46.40
69
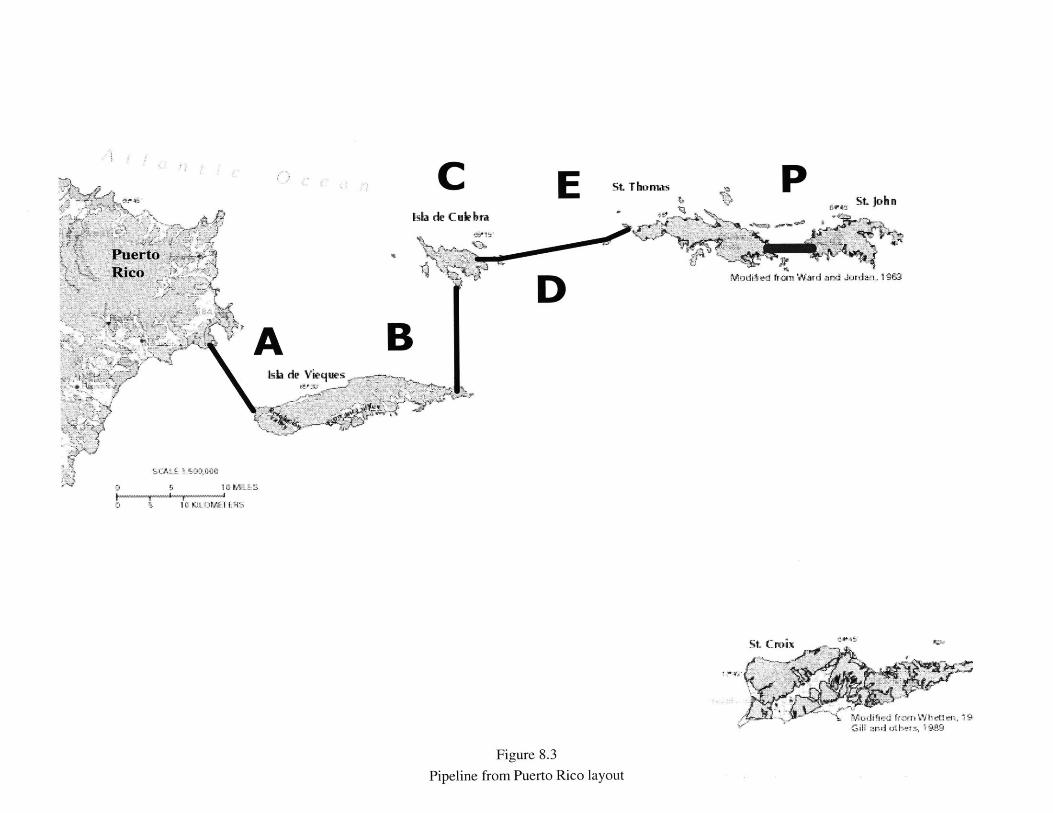
- Isla de Cale
PuertoRico
-~A-
I G
F St Tk1 On-k Pra J-
4i1D d rr~i1 er
t f
Gi .d Iir c
Figure 8.3
Pipeline from Puerto Rico layout
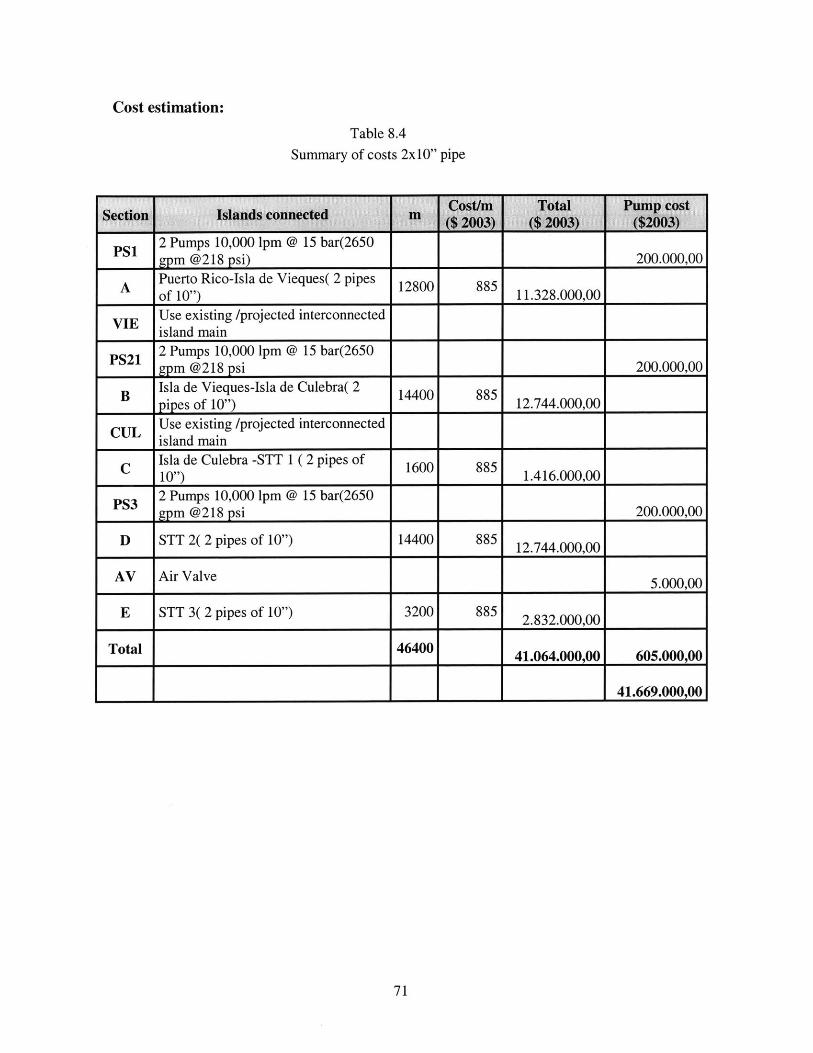
Cost estimation:
Table 8.4
Summary of costs 2x10" pipe
Psi2 Pumps 10,000 lpm @ 15 bar(2650gm @218 psi) 200.000,00
A Puerto Rico-Isla de Vieques( 2 pipes 12800 885of 10") 11.328.000,00
VIE Use existing /projected interconnectedisland main
PS21 2 Pumps 10,000 1pm @ 15 bar(2650gpm @218 psi 200.000,00
B Isla de Vieques-Isla de Culebra( 2 14400 885B pipes of 10") 12.744.000,00
CUL Use existing /projected interconnectedisland main
C Isla de Culebra -STT 1 (2 pipes of 1600 88510") 1.416.000,00
PS3 2 Pumps 10,000 1pm @ 15 bar(2650gpm @218 psi 200.000,00
D STT 2( 2 pipes of 10") 14400 885 12.744.000,00
AV Air Valve 5.000,00
E STT 3( 2 pipes of 10") 3200 885 2.832.000,00
Total 46400 41.064.000,00 605.000,00
1 1_ 1 41.669.000,00
71

Table 8.5
Summary of costs 2x8" pipe
PSI2 Pumps 10,000 1pm (Y) 40.) bar(26O.0gpm @589 psi)
200.000,00
A Puerto Rico-Isla de Vieques( 2 pipes 12800 630 8.064.000,00of 8")
INL 1 Use existing /projected interconnectedisland main
PS21 2 Pumps 10,000 1pm @ 40.5 bar(2650 200.000,00gpm @589 psi)
B Isla de Vieques-Isla de Culebra( 2 14400 630 9.072.000,00pipes of 8")
INL 2 Use existing /projected interconnectedisland main
C Isla de Culebra -STT 1 ( 2 pipes of 8") 1600 630 1.008.000,00
PS3 2 Pumps 10,000 1pm @ 40.5 bar(2650 200.000,00gpm @589 psi)
D STT 2( 2 pipes of 8") 14400 630 9.072.000,00
AV Air Valve 5.000,00
E STT 3 entering West side ( 2 pipes of 3200 630 2.016.000,008")
Total 46400 29.232.000,00 605.000,00
29.837.000,00
The inland pipe on Isla de Vieques and Isla de Culebras has not been considered as part
of the cost of this installation. It is the understanding of the author that the new or resized
pipe needed to connect the two submarine pipes in each island can be considered and
built as part of the main distribution system of these two islands, and for their own
usufruct. The first objection that can be made to this point of view has to do with water
quality, and risk of contamination. It is also obvious that constant monitoring in the
entrances to each of the submarine pipes to each of the islands should be designed, for
water quality and salinity.
72

No system is perfect, there are trade-offs to be analyzed in each of the presented options.
The decision does not lie only in the economic issues of the proposed alternative
supplies. Cultural, social and regional issues should be taken into account. One favorable
point is that the pipelines are connecting two islands that belong to the same country.
The other obvious and easiest pipeline connection between islands is linking by
submarine pipe the USVI and The British Virgin Islands (St. John -Tortola). What can
flow between these two islands is desalinated water (Reverse Osmosis). The prices that
are paid in Tortola are not as different as the prices paid in St. John. The legal aspects
will be different in this case, as the water is flowing through a national boundary.
The other aspect to mention is that by the location of St Croix and also due to the depths
of the sea bed involved, it is out of reach for these type of technologies.
8.1.5. Water Quality improvement technologies
8.1.5.1.Desalination
Technical Description Desalination is a process for separating the salt
contained in saline water, with the objective of producing water that has low
content of total dissolved solids (TDS). Under desalination, several different
processes are included:
8.1.5.1.1. Desalination by distillation
Technical Description Desalination is based in reproducing the
hydrological natural cycle of sea water. Through the vaporization of sea
water (by a combined process of heat and pressure differential), this vapor
is then condensed to form fresh water. Three types of thermal units have
been developed in the market: MSF (Multi Stage Flash), MED (Multiple
effect distillation), and Vapor Compression. The units in St. Thomas are a
modernized version of the MED type of plants, the HTME (Horizontal
type multiple effect).
73

HEATINGSECTION
Steam fromboiler
IBRINE
HEATER
Condensatereturnedto boiler
FLASH AND HEAT CheminalRECOVERY SECTION feed
B- Seawater fed
rne EJECTOR .Cooling water-~discharge
I ', . i EJECTOR ContaminatedCONDENSER condensate-. Freshwater to waste
J 'v s product
'1B Brinedischarge
Fig 8.4
Multi Stage Flash (Distillation MSF Process)
Source: (SIWIN, 1996)
Extent of Use Desalination is currently extensively applied in the island
as the main public strategy of water supply.
Operation and Maintenance Of the possible types of desalination
technologies the actual process applied in St. Thomas is the one that
requires larger and complex units. It also makes sense only in the case
they are operated in conjunction with electrical generating plants.
Level of Involvement The use of this type of units requires a considerable
application of funds for its purchase and its operation and maintenance.
Costs and prices Capital costs of this type of units ranges from $1000 to
$2000 per m3/d (UNEP, 1998). Costs reported by WAPA vary within each
island; for St. Thomas WAPA cost for production and distribution ranges
from $1.85-2.11/1000 L ($7-8/1000 gal).
WAPA sells water to consumers at the following rates:
- Residential users:
For the first 1000 gal per month: $16.58/1000 gal
74

After the first 1000 gal per month: $18.58/1000 gal
- For commercial users:
$16.58/1000 gal.
Effectiveness of the technology The measure of the efficiency of this
type of technologies is given by the amount of water produced per unit of
steam delivered to the plant.
Fig 8.5Desalination Plant, Krum Bay, St. Thomas
Suitability It has the advantage of being suitable to every climate.
Advantages In the St. Thomas case, distillation is already a well
developed and proven technology. Of all the desalting processes it is the
one that can operate better with poor quality of feedwater.
Disadvantages It is the most capital intensive of the desalination options.
It has high infrastructure, operation and maintenance costs. It is totally
dependant on steam generated by an electric plant. The reliance on fossil
fuels for its operation, will probably condition the introduction of sources
of renewable energies in the St. Thomas energy market.
75
Environmental impact From the aquatic point of view, discharge of brine
is one of local effects. For our analysis we will consider the energy
consumption per volume of water as an air pollution indicator.
Further development of the technology Although technological
improvement is possible, this technology is mature, and no further
advances in the distillation processes are expected in the near future.
76

8.1.5.2. Desalination by reverse osmosis
Technical Description This system comprises four different processes:
o Pre-treatment of the incoming seawater or brackish water.
o Pressurization of the saline water against the membrane.
o Membrane separation in which dissolved salts are retained and water
flows through the membrane.
o Post treatment stabilization
Seawater or brackish water
Pre-treatm ent
Post-treatment
Membranc mnodules
pH adjustment
Brine disposal
High prossurc pump
Figure 8.6Elements of the reverse osmosis desalination process
Source: UNEP, 1997
Extent of Use R/O is currently extensively applied in the island by resorts.
Operation and Maintenance Operation of the units is easier than in
distillation. Although the personnel in charge have to be trained in a wide
range of preventive maintenance, like instrument calibration, pump
adjustment, chemical feed inspection and adjustment.
77

The most important maintenance routine is to keep the membrane free of salts
or suspended materials that can clog it. Membranes should be changed every
three to five years, and they represent about one third of the cost of the plant.
Level of Involvement The level of involvement depends on the scale of the
plant. As facilities become larger, producing water for a whole community
will require community acceptance and financing.
Costs The capital costs for treating brackish water range from $250 to $750
per m3/d, and for seawater it ranges from $800 to $1250 m3/d (UNEP, 1998).
Water costs for desalination were referred by Seven Seas Company (provider
of this equipment for resorts and also for WAPA) between $1.05 to $2.44 per
m3 ($4-9.25/1000 gal).
Effectiveness of the technology This type of technology has been in constant
improvement in the last decade. It has been proven a very effective technology
for Caribbean seawater.
Suitability The suitability of this technology depends on the characteristics of
the incoming brackish/seawater. If the intake is carefully chosen and
maintained free of pollution the process will be effective.
Advantages The wide ranges of sizes and modularity of R/O plants allows for
a flexible and scalar system. The design is simple, and because of this
simplicity, they are ideal for use as emergency alternative supplies. As there
are many options in the market, the replacement components for operation are
readily available and prices are balanced.
Disadvantages Membranes have to be carefully maintained in order to avoid
suspended solids to clog them. It requires constant attention by skilled
personnel.
78

Environmental impact From the aquatic point of view, discharge of brine is
one of local effects. For our analysis we will consider the energy consumption
per volume of water as an air pollution indicator.
Further development of the technology This technology for the range of
supply necessities that St. Thomas has is developing at a fast pace.
Improvement in pretreatment and intake filtration, as well as new membranes
design that can work at lower pressures will increase the efficiency and cost-
effectiveness of this particular technology.
79

9. Comparison of the three potential main supply strategies for freshwater supply and
augmentation
As it has been discussed in previous sections, of all the sources of augmentation, only
distillation (the actual strategy), reverse osmosis desalination and submarine piping can
provide on continuous basis water in the quantity and quality needed. As we have seen in
the introduction, the analysis in an IWRM framework of these options should be made
taking into account three different elements: 1) economic efficiency in water use, 2)
environmental and ecological sustainability, and 3) equity in the access to water for all
people. An evaluation of these three principles follows.
9.1. Economic analysis of the main supply alternatives
This analysis will be done for the purpose of fair comparison, with the operation data
of WAPA for the year 1995. The alternatives of R/O and submarine piping will be
calculated for supplying the peak supply of distillation water that WAPA's plant in
Krum Bay, St. Thomas can supply at peak operation.
9.1.1. Submarine piping benefit/cost analysis
Assumptions
Value of commercial KWh 1 KWh=0. 14 (WAPA 2003)
Personnel average wage $22,222/yr (Male full-time median income 1999 US
Bureau of the Census totaled $29,309).
Capital costs For a 14,000 m3/d supply and according to the range quoted in
Section 8.1.4, the costs for the two chosen alternatives have been considered. The
detailed capital costs are expressed in tables Table 8.4 and 8.5.
Production costs The production cost of ground-water in Puerto Rico was
considered at 0.5 $/m 3. Considering an annual import of 2.900,000 m3 per year
(roughly the 1995 WAPA production for the year 1995 in St. Thomas), the total
production amount to be paid for water provision in Puerto Rico has been
calculated to be of $1,450,000.
80
Operation and maintenance Electric Energy represents the primary operating
cost. For the 10-inch diameter installation, the pumps will need 930 KWe for
continuous operation (8,146,800 KWh annually). For the 8-inch diameter
installation, the pumps will need 2838 KWe for continuous operation (24,860,880
KWh annually). To this electricity cost, 1/50 of the capital cost was added as
maintenance of the pipe and pumps. The last item added to this O&M cost was
the wages of the staff needed for pump operations.
Staffing level For each of the pump stations two persons as staff is needed. We
will take for our calculations 6 persons for a 14,000 m3/d demand, operating the
three pump stations..
Administration Costs are the same as the data from WAPA (1999). All of the
operating expenses, production cost of water distributed, operations and
maintenance, customer service, administrative and general expenses, depreciation
and amortization, interest expenses, interest income and allowance funds, have
been taken from the unedited balance sheets of WAPA from 30 Jun 1995 to 30
Jun 1999.
Depreciation of equipment Based on a lifespan of the pipe and pump stations of
50 years, 1/50 of its value per year has been considered as the depreciation
amount.
Sales To keep the consistency of the analysis the sales revenues are considered to
be the same as the WAPA FY99 for St. Thomas throughout the years 1 to 50.
Inflation and interest over capital They have not been considered in the
calculations for simplicity.
Four different alternatives have been run.
First Alternative: WAPA operates the pipe and fully finances the construction of
dual parallel flexible pipe of 10-inch diameter (2x10").
Second Alternative: WAPA operates the pipe and fully finances the construction
of a dual parallel flexible pipe of 8-inch diameter (2x8").
81
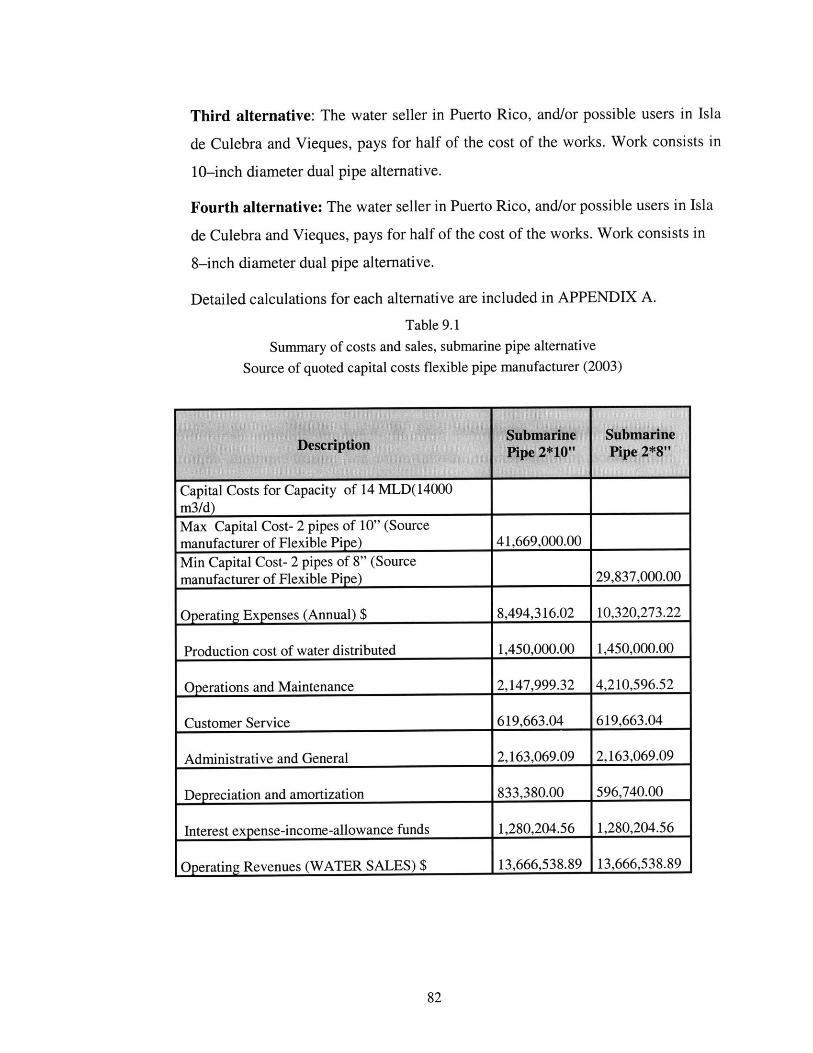
Third alternative: The water seller in Puerto Rico, and/or possible users in Isla
de Culebra and Vieques, pays for half of the cost of the works. Work consists in
10-inch diameter dual pipe alternative.
Fourth alternative: The water seller in Puerto Rico, and/or possible users in Isla
de Culebra and Vieques, pays for half of the cost of the works. Work consists in
8-inch diameter dual pipe alternative.
Detailed calculations for each alternative are included in APPENDIX A.
Table 9.1Summary of costs and sales, submarine pipe alternative
Source of quoted capital costs flexible pipe manufacturer (2003)
Capital Costs for Capacity of 14 MILD(14000m3/d)
Max Capital Cost- 2 pipes of 10" (Source
manufacturer of Flexible Pipe) 41,669,000.00
Min Capital Cost- 2 pipes of 8" (Source
manufacturer of Flexible Pipe) 29,837,000.00
Operating Expenses (Annual) $ 8,494,316.02 10,320,273.22
Production cost of water distributed 1,450,000.00 1,450,000.00
Operations and Maintenance 2,147,999.32 4,210,596.52
Customer Service 619,663.04 619,663.04
Administrative and General 2,163,069.09 2,163,069.09
Depreciation and amortization 833,380.00 596,740.00
Interest expense-income-allowance funds 1,280,204.56 1,280,204.56
Operating Revenues (WATER SALES) $ 13,666,538.89 13,666,538.89
82

9.1.2. Desalination by distillation benefit/cost analysis
Assumptions
In this particular case, the values will be the actual balance values of WAPA
water production for the year 1994. As this data is not presented separate for each
of the main islands, an estimation based in the total installed capacity is made.
From table 3.2 the proportion of the total desalinated water production that
corresponds to each island is 45.4% St Croix, and 54.6% to St. Thomas. Of the
total operation costs and sales revenues presented, 54.6% account for St. Thomas,
which is a fair estimate that can account for the provision to both islands. The
source is the unaudited balance sheets of WAPA from 30 Jun 1995 to 30 Jun
1999.
Capital costs For a 14,000 m3/d plant and according to the range quoted in
Section 8.1.5.1.1 the range of costs for a plant will be between $28,000,000 and
$14,000,000.
All of the operating expenses, production cost of water distributed, operations and
maintenance, customer service, administrative and general expenses, depreciation
and amortization, interest expenses, interest income and allowance funds, have
been taken from the unedited balance sheets of WAPA from 30 Jun 1995 to 30
Jun 1999.
Depreciation of equipment Based on a lifespan of the plant of 25 years, 1/25 of
its value per year has been considered as the depreciation amount. Considering
technological change, it is assumed that the replacement plant after year 25 is
bought at half the price as the unit in year 1.
Sales To keep the consistency of the analysis the sales revenues are considered to
be the constant for St. Thomas throughout the years 1 to 50.
83

Inflation and interests over capital They have not been considered in the
calculations for simplicity.
Detailed calculations are included in APPENDIX A.
Table 9.2
Summary of Costs and Sales WAPA 1999. Distillation.
Maximum capacity per unit worldwide m3/d 36000
Average production per unit on St. Thomas m3/d 5000
Max Capital Cost- U$/installed m3 2.000,00
Min Capital Cost-U$/installed m3 1.000,00
Capital Costs for Capacity of 14 MLD(14000m3/d)
Max Capital Cost- U$/installed m3(UNEP max
value) 28.000.000,00
Min Capital Cost-U$/installed m 3(UNEP mn
value) 14.000.000,00
Operating Expenses(Annual)Jun 30 98-Jun 30 99-$ 23.812.519,00 13.001.635,37
Production cost of water distributed 9.550.647,00 5.214.653,26
Operations and Maintenance 4.409.058,00 2.407.345,67
Customer Service 1.134.914,00 619.663,04
Administrative and General 3.961.665,00 2.163.069,09
Depreciation and amortization 2.411.538,00 1.316.699,75
Interest expense-income-allowance funds 2.344.697,00 1.280.204,56
Operating Revenues (WATER SALES) $ 25.030.291,00 13.666.538,89
84
9.1.3. Desalination by reverse osmosis benefit/cost analysis
Assumptions
Value of commercial KWh: 1 KWh=O. 14 (WAPA 2003)
Personnel average wage $22,222/yr (Male full-time median income 1999 US
bureau of the Census totaled $29,309)
Capital costs For a 14,000 m3/d plant and according to the range quoted in
Section 8.1.5.1
Production costs Electric energy represents the primary operating cost, and it
ranges from 3 to 6 Kwh/m 3 of potable water produced (UNEP, 1998). For the
calculations the worst-case scenario will be assumed in all the cases for fairness of
comparison, i.e., 6 Kwh/m 3
Operation and Maintenance To keep the consistency of the analysis the
operation and maintenance costs are considered to be constant for St. Thomas
throughout the years 1 to 50.
Staffing Level For a 4000 m3/d plant, 3 persons are required staff (UNEP, 1998).
We will take for our calculations 9 persons for a 14,000 m3/d. Therefore, in the
case of distributed RO plants as proposed, the cost analysis will not be different in
personnel wages. The only change in this distributed system will be the savings in
distribution.
Maintenance Mainly change of membranes (that represent around 1/3 of the
value of the equipment) every 3 to 5 years. We take as maintenance full cost
change of the membrane every 3 years.
Administration The same as the data from WAPA (1995) = $1,000,000
85

Depreciation of equipment Based on a lifespan of the plant of 25 years, 1/25 of
its value per year. Considering technological change, it is assumed that the
replacement plant after year 25 is bought at half the price as the unit in year one.
Sales To keep the consistency of the analysis the sales revenues are considered to
be the same as the WAPA FY99 for St. Thomas throughout the years 1 to 50.
Inflation and interests over capital They have not been considered in the
calculations for simplicity.
Two different alternatives have been run.
First Alternative: WAPA operates the RO plants.
Second Alternative: A private operator is contracted by WAPA and sells water
produced at a fixed value of $3/m 3 .
Detailed calculations are included in APPENDIX A.
86
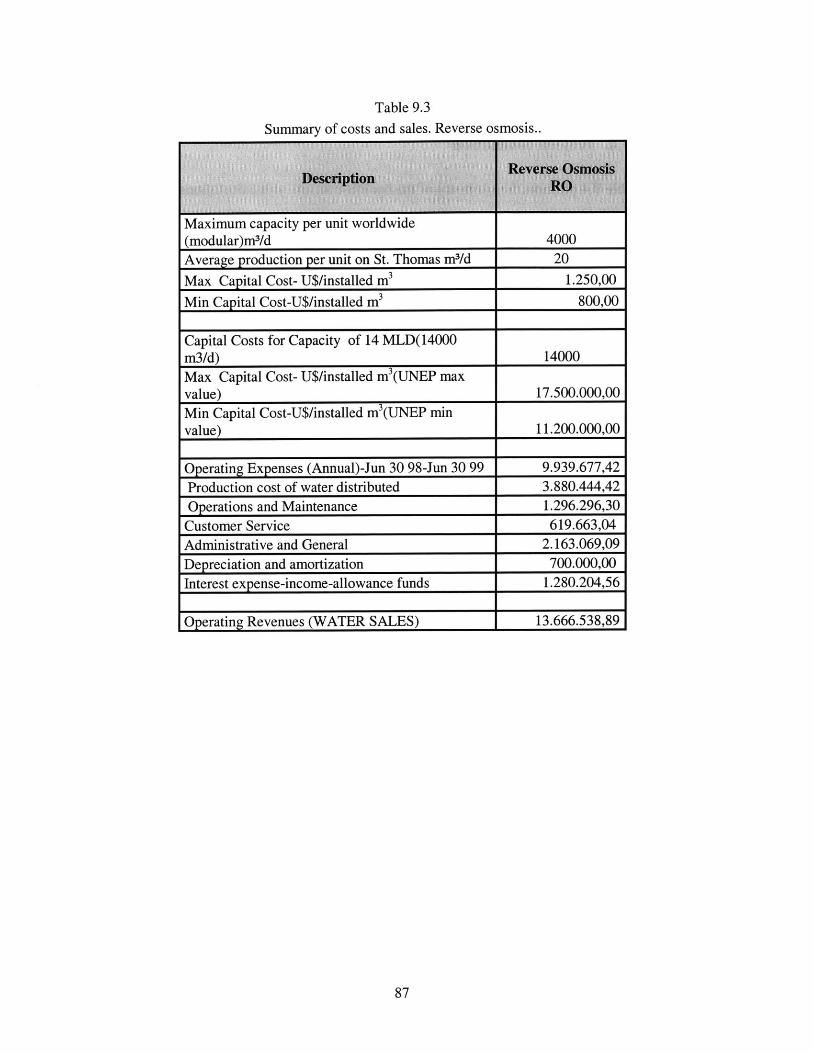
Table 9.3
Summary of costs and sales. Reverse osmosis..
Maximum capacity per unit worldwide(modular)m3/d 4000Average production per unit on St. Thomas m3/d 20
Max Capital Cost- U$/installed m 3 1.250,00
Min Capital Cost-U$/installed m3 800,00
Capital Costs for Capacity of 14 MLD(14000m3/d) 14000Max Capital Cost- U$/installed m 3(UNEP maxvalue) 17.500.000,00Min Capital Cost-U$/installed m 3(UNEP mn
value) 11.200.000,00
Operating Expenses (Annual)-Jun 30 98-Jun 30 99 9.939.677,42Production cost of water distributed 3.880.444,42
Operations and Maintenance 1.296.296,30
Customer Service 619.663,04
Administrative and General 2.163.069,09
Depreciation and amortization 700.000,00
Interest expense-income-allowance funds 1.280.204,56
Operating Revenues (WATER SALES) 13.666.538,89
87

9.1.4. Projects comparison
Table 9.4 presents the summary of the benefit-cost analysis calculations results
Table 9.5Summary of results of benefit-cost analysis.
For complete calculations see APPENDIX A
Submarine Piping 2 x1n"
0.07 0.142 32,437,545 188,608,436 (156,170,891) 1.208
Submarine Piping 2 x 0.07 0.126 18,295,917 188,608,436 (170,312,519) 1.1078"
Submarine Piping 2 x 0.07 0.330 51,909,040 188,608,436 (136,699,396) 1.38010" Shared
Submarine Piping 2 x 0.07 0.289 32,238,440 188,608,436 (156,369,996) 1.2068" Shared
Desalination by 0.07 #NUM! (19,571,548) 188,608,436 (208,179,984) 0.906distillation
0.07 0.270 33,014,739 188,608,436 (155,593,697) 1.212Reverse Osmosis_____________
Private Reverse 0.07 #DIV/0! 12,248,307 188,608,436 (176,360,129) 1.069Osmosis
The alternatives that have been developed are ranked according to the
PVBREV/PVCOS ratio, or benefit-cost ratio.
88

Table 9.5
Ranking by benefit-cost ratio, all projects.
Submarine Piping 2 x10" Shared
0,07 0,330 51.909.040 188.608.436 (136.699.396)
Reverse Osmosis 0,07 0,270 33.014.739 188.608.436 (155.593.697) 1,212
Submarine Piping 2 x 0,07 0,142 32.437.545 188.608.436 (156.170.891) 1,208
Submarine Piping 2 x 0,07 0,289 32.238.440 188.608.436 (156.369.996) 1,2068" Shared
SubmarinePiping2x 0,07 0,126 18.295.917 188.608.436 (170.312.519) 1,107
Private Reverse 0,07 #DIV/0! 12.248.307 188.608.436 (176.360.129) 1,069Osmosis
Desalination by 0,07 #NUM! (19.571.548) 188.608.436 (208.179.984) 0,906distillation I
89
1,380
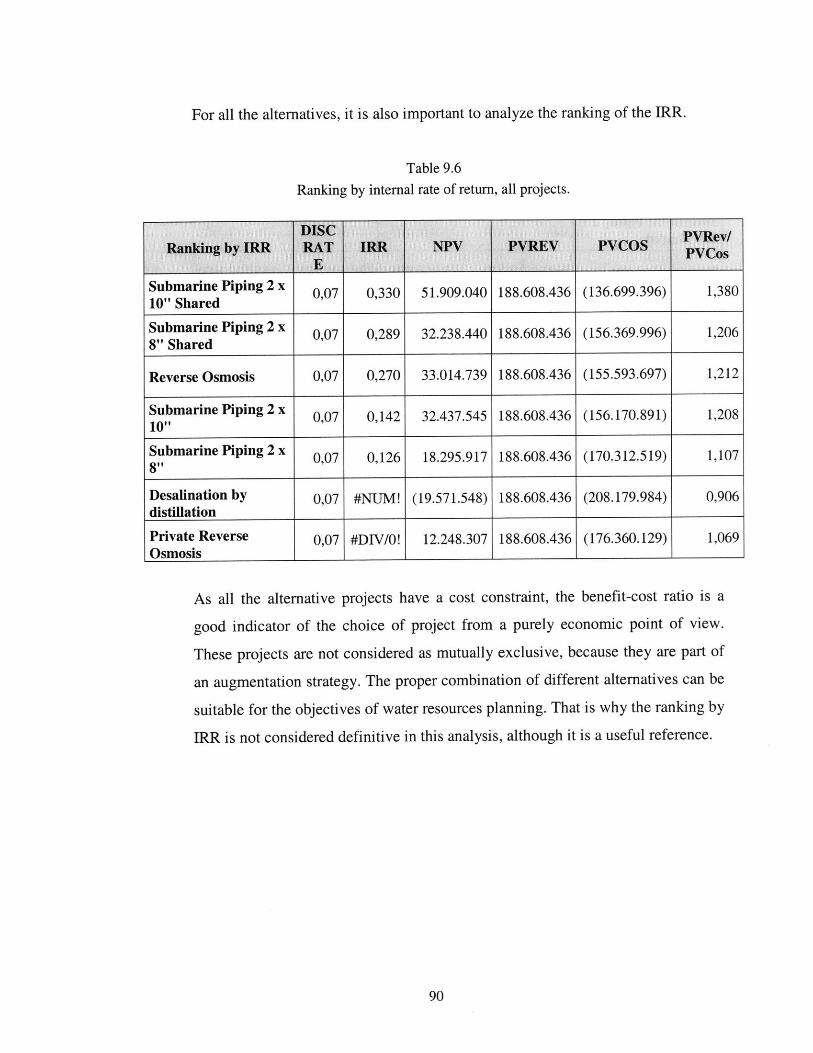
For all the alternatives, it is also important to analyze the ranking of the IRR.
Table 9.6
Ranking by internal rate of return, all projects.
Submarine Piping 2 x10" Shared
0,07 0,330 51.909.0401 188.608.436 (136.699.396) 1,380
Submarine Piping 2 x 0,07 0,289 32.238.440 188.608.436 (156.369.996) 1,2068" Shared
Reverse Osmosis 0,07 0,270 33.014.739 188.608.436 (155.593.697) 1,212
Submarine Piping2x 0,07 0,142 32.437.545 188.608.436 (156.170.891) 1,20810" ___ ____ ____ _
Submarine Piping2x 0,07 0,126 18.295.917 188.608.436 (170.312.519) 1,1078" ____
Desalination by 0,07 #NUM! (19.571.548) 188.608.436 (208.179.984) 0,906distillation
Private Reverse 0,07 #DIV/O! 12.248.307 188.608.436 (176.360.129) 1,069Osmosis
As all the alternative
good indicator of the
These projects are not
projects have a cost constraint, the
choice of project from a purely ec
considered as mutually exclusive, b
benefit-cost ratio is a
onomic point of view.
ecause they are part of
an augmentation strategy. The proper combination of different alternatives can be
suitable for the objectives of water resources planning. That is why the ranking by
IRR is not considered definitive in this analysis, although it is a useful reference.
90
MIR M
9.2. Environmental impact comparison
The criteria for the environmental impact comparison should be assessed by:
Energy intensity of the process Comparison on energy needed to produce or provide
(in the case of the submarine piping) 1000 L of water. It will be expressed in Kwh/m 3.
If the source of electricity or steam used in all the processes involved is based on
fossil fuels, this comparison will yield an indicator of emission of pollutants to the air.
Water quality Of the processes of desalination, water quality is usually more reliable
in the case of distillation, mainly because of the high temperatures of the process that
eliminates almost all bacterial activity in water. Reverse osmosis requires more
control and monitoring in the resulting water quality.
In the case of submarine piping, the main concern is focused in the possibility of
water to act as a vector of epidemics between relatively closed island environments.
Marine eco-system impact Of each of the options, the desalination options will
present the pollution due to the discharge of the waste brine that results as effluent of
the process of desalination. The waste brine assessment in the case of desalination
should be focused on three main parameters to compare:
o Flow rates of the discharge
o Water temperature of the discharge
o Maximum and minimum pH of the effluent.
In the case of the submarine piping, the impact will be assessed by the impact per se
of the construction and lay out of the pipe, and then by the impact on the marine
environment of further operation of the facilities.
Land use This will depend not only on the size of the required facility, but also on
the relative ability of each process to generate toxic wastes. Toxic wastes in turn will
pollute the environment. Pollution by toxic wastes will affect the marine environment
and groundwater.
91

All these indicators are of great relative importance, we will determine for the
purpose of this work the energy intensity indicator for the three options. Nonetheless,
it is required for proper evaluation of each of these alternatives to fulfill the rest of the
environmental impacts assessment as well as some others that could be left out of the
present shortlist.
9.2.1. Energy intensity of the process
Submarine Piping
In order to pump 14,000 m3/d of water from Puerto Rico to St. Thomas:
o With the dual parallel flexible pipe of 10" system, a total amount of 22,320
KWh is needed.
* 22,320 KwhlIdEnergy intensity= =1.59Kwhr / 3
14,000 M3 / d
o With the dual parallel flexible pipe of 8" system, a total amount of 68,112
KWh is needed.
*68,ll2 Kwh/ dEnergy intensity= = 4.87 Kwh / m3
14,000 M3 / d
Desalination by distillation
According to WAPA the cost to produce 1000 gallons of water is calculated to be
in the order of $5.50 /1000 gal, or $1.45/ M3.
And the associated cost of electricity was of $0.061/Kwh (WAPA, 1994)
This implies that: Energy intensity=23.82Kwh /M 3
An important comment to be made on this particular calculation is the fact that the
energy intensity calculated, responds to considering the total electricity involved
92

in the process of desalination. This value includes the electricity equivalent
needed for the cogeneration plant recovered heat energy.
Desalination by reverse osmosis
Energy efficiency for this process ranges from 3 to 6 Kwh/m 3 of potable water
produced (UNEP, 1998). An average is taken.
Energy intensity=4.5Kwh / m3
Table 9.7Scoring of energy efficiency of selected processes.
Submarine Piping 2 x 8" 1.59
93
Desalination by reverse osmosis 4.50
Submarine Piping 2 x 8" 4.87
Desalination by distillation 23.82

9.3. Equity in the access to water for all people
Regarding the distribution of the public water system, it has been noted that the main
problem lies in the centralized distribution of water. The system expansion has not
been accomplished as planned in the last two decades. It is a fact that 55% of the
permanent population does not have access to the public distribution system. This
presents still in 2003, a pending assignment for the water managers and planners. It is
also to be highlighted that, lack of access to the public system, does not depend as in
many other cases, on the income composition of the population. In other words most
of the out of radius zones are inhabited by the fraction of the population with larger
income. This adds to the challenge of extending the distribution in a hilly terrain of
volcanic soils, the opportunity of the willingness and ability to pay of the potential
new customers.
94

10. Answers towards Integrating Water Resources Management
Returning to the main questions about the key issues on water resources management
enunciated in Chapter 4, and after carefully analysis of the actual situation it is possible to
discuss the answers to them.
10.1. Environmental consequences of separate operation of water supply
and wastewater
Is it desirable to have two different entities operating water supply and water
disposal?
By understanding that water is a renewable and reusable resource, a recommended
practice is to integrate the management and operation of these two services in order to
achieve that wastewater flows can be an effective addition to resource flows of water
supply.
During a meeting at DPNR on St. Thomas, the question of why different companies
or departments were operating potable water and wastewater was asked. The answer
received in the interview was quite representative of the issue. It was "You won't go
to a WWTP, then wash your hands and give a glass of that water to your kid." This is
a basic answer, but it reflects some culturally accepted feeling about separating
freshwater from wastewater.
Although in the case of a watertight economy as the one under consideration, it does
not seem rational to operate with different companies water supply and sewage
collection. Given the extreme necessity on considering ways of reusing water, it will
be highly recommendable to operate and design water supply and wastewater
collection and reuse conjunctively. Today two different agencies with no points in
common are operating separately these two services, and until now, the government
has implemented no significant water reuse policies. Some resorts have been applying
the principle of water reuse in the island by recycling treated water for irrigation uses.
95
This is a direction on which to point in the near future. The California experience in
treated wastewater injection as a mean of avoiding saline intrusion and recharging the
aquifer should be seriously studied for the island.
10.2. Reliability of public water system based in desalination. Frequency ofextreme events.
Is it possible to operate a reliable water system based only in one supply strategy
(desalination by distillation) in a place where the occurrence of extreme events is of
high frequency?
After the analysis of the water sector situation in the island it is clear that
desalination, although having played an important role in the island development in
the decade of the sixties and seventies could never give a full response to water needs
of the island. At present although a valuable and secure supply for freshwater, and
after beginning to charge full price from the water they are selling, WAPA still faces
operational problems, and has to think in future alternative technologies that can be
more suitable to the St. Thomas needs. Careful consideration should be given to the
alternatives that have been developed in this work.
It is possible to apply more cost-effective alternatives as the main supply strategy to
the island. It has been proven in this work that importing water from Puerto Rico
through submarine pipelines is a feasible alternative. Moreover, in the long term it
will allow WAPA to focus in the extension of the system.
On the other hand, private resorts have been successful in incorporating R/O plants
with up to day technologies. In addition, they are reporting huge savings over water
bought from WAPA.
Two years ago an attempt to privatize part of WAPA as a concession failed. The
legislature of the Virgin Islands did not approve the arrangement between WAPA and
Southern Waters. Still today all the major services are in government hands and
although improvements have been made in the water sector, privatization can be a
possibility that ought to be analyzed in the near future. All the facilities operated by
96

resorts and other private owners report better yields than the government owned
WAPA.
It is also important to note that the actual institutions have been going through great
changes in the last three decades. In 1971 the first elected governor assumed office in
the islands, before that the U.S. federal government designed the governor.
Institutions are not yet mature, although they have many of the requirements that the
continental states have, but lack the proper solid institutional background needed for
the task. That is why enforcement of EPA regulations, for instance, is slow and has
fewer results than the expected.
10.3. Water costs and prices in this market
How can proper prices on water be managed in a market with these characteristics?
The idea of equitable prices has been undergoing drastic changes in the last decade.
Full pricing of water has become a necessity because of the large debt that the
government has contracted with the Federal government. Nevertheless, there are
some gray areas that need to be defined and clarified. For instance the housing
projects managed by VIHA (Virgin Island Housing Authority) as well as other
territorial government agencies are still the main clients of WAPA and rarely pay
their bills. This sort of cross-subsidies should be corrected, but it seems to be a long
road yet to be taken.
10.4. Health consequences, water quality. Rainfall harvesting as mainsource of water supply.
How can overall water quality be assured when catchments of rainfall is the main
water supply for more than 70% of the population?
Water quality for human consumption is still an issue to be solved in the islands.
Because 70% of the population relies on water catchments for their daily water
97

consumption, a strict control of water quality should be implemented in households.
This task can be done by DPNR and the Department of Public Health. Public
campaigns for instructing the population on a regular basis are sporadic and only
applied when a breakthrough of waterborne disease appear in the horizon. No up to
date studies have been found on statistical datum for waterborne diseases linked with
the exposure of the majority of the population to water related health risks.
98
11. Conclusions: The future
The future of water resources in the Virgin Islands lies in the interconnection for
allocating water and the creation of a less distorted and subsidized water market.
The inventory of the available water resources mentioned throughout this work added to
an adequate conjunctive use strategy, and a planned augmentation of sources will make
water scarcity past history.
Piping and adequate maintenance of the existing infrastructure will result in reducing
unaccounted for water, increasing the possibility of managing allocation of the different
sources of desalinated water (Water and Power Authority, self-sufficient resorts and
industries, and water catchments with strict quality controls).
Projects for piping the whole extension of St. Thomas and St. John, and leave private or
third parties deal with in island distribution should be encouraged. Distribution should be
given to cooperatives or companies interested in developing and operating the
distribution net in that particular sub district or area. Taking into account the actual price
of a water residential connection that reaches $1,500 (almost 300% of the average
international cost for a developed country), it should be an easy task for a cooperative to
extend and operate from the main pipe the distribution.
Piping to the west towards Isla de Culebra (or Vieques), and Puerto Rico, has already
been considered, but it had never been put into action because of water rights conflicts
and considerations. The only need will be a strong decision on the right way to head. This
will make possible the creation of a sustainable regional water market (that will exceed
the US Virgin Islands). Undersea piping to the British Virgin Islands and heading east to
other islands is also a future possibility of market expansion. A pipe that can connect St.
Thomas' north side to Tortola can be installed at not more than 30 m (98 ft) of depth
Almost twenty years ago a project to lay a submarine pipe from Puerto Rico to St.
Thomas was proposed, but has never been materialized. Desalination was confirmed as
99
an option in that same period. After twenty years and due to technology change
desalination is not the right option as the main supply strategy.
Expansion of the distribution of WAPA's public water; independently of the source of
water supply to be chosen is necessary. It should be done for the purpose of equitability.
This does not mean to expand the actual central based distribution, but the choice should
be made on the base of careful feasibility analysis of all the possibilities, by all the actors.
Voluntary water transfers are a good response from the government's legal action, as a
complementary mechanism of water augmentation and demand-management policies. If
properly implemented from both the operative and water use regulations it can bring
greater economic efficiency in the market. In the last decades and due to the combination
of increasing water demands, environmental concerns and exhaustion of the most
economic water sources, water transfers represent an efficient economic alternative
(Mays, 2002). In an island environment with no irrigation water use the sectors that
should be enabled to this type of trade are the local groups of water users, and the water
users or operators in neighboring islands (either national or transnational). The
experience with water trading has been possible for instance in California because of the
high grade of connectivity that the water distribution system has achieved in that state.
Another strong reason for interconnection of available regional resources has to do with
the pattern of occurrence of extreme events like hurricanes. The different paths that the
eye of the hurricane takes year after year characterize this pattern. It does not always hit
twice in the same island. In the event of a given hurricane that fully makes land in any of
the interconnected islands, the rest of them that have not suffered the hurricane's full
rigor will be readily able to supply water until remediation of damages can be done.
In addition, the interconnection between islands has the advantage of expanding the
economy of scales of a reduced island market, which will generate the beneficial
economic effect that expansion of a market has (at least until certain point).
The other main problem that should be continuously attended to is the necessity of
constant monitoring of water quality standards mainly for rainwater catchments (RWC).
100

RWC is a fundamental source of water in the islands and should be treated as other water
supplies, investing in new technologies for proper conservation of the resource as well as
its augmentation.
The rough numbers of total demand and total available supply are useful as a reminder of
the limited and insufficient supplies of water, as well as a challenge for innovative water
planning and management. A water market, with high grade of distortion created by the
government has been set in the islands. Integrating water resources management and
planning, that will imply innovating the water market will be the only way of
augmentation of water supplies.
The useful life of the desalination trains is past due to its theoretical end of life (assuming
a lifespan of 25 years from its installation in 1985). It the right time for all the
stakeholders in the USVI water resources sector to analyze its own alternatives. That is
the challenge. Trading off environmental impacts and at the same time assuring the water
resource quantity and quality at equitable prices for generations to come is achievable.
11.1. Final recommendations
1) Desalination plants by distillation should be gradually phased out as the only
source of public water. The options that should be analyzed have been discussed
in this thesis. Technologies as submarine piping and Reverse Osmosis
desalination in conjunction should be considered as the future options. These
alternatives are preferred both from cost analysis and sustainability
considerations. Submarine piping from Puerto Rico can be combined with smaller
RO plants strategically distributed, to achieve what has been postponed for many
years in the islands, an equitable distribution of the available water resources.
2) Funds will be saved from more cost effective alternatives. In turn, these funds
should be applied to expand the public system. This can result in a positive cyclic
pattern. Incorporating 54% of the population to the system will increase in time
101

the revenues generated by the water sector. This should make more funds
available for the next phase of improvements.
3) A legal set of reforms that will enable water trading should be put into place.
These policies combined with a higher level of interconnectivity will enable the
gradual development of a regional water market.
4) There is a need of better accounting practices for assessing actual demands and
available supplies in order to accomplish informed decision-making. Water
scarcity is not only the result of climatic and geographical conditions, but it also
depends on adequate management and planning of the present and future
resources. A need for more refined analysis or breakdown in information is
recommended for water resources managers and planners in the US Virgin
Islands.
102

References
Cox, John and Embree, C. (Sid), Sustainable development in the Caribbean: a report om
the public policy implications of sustainable development in the Caribbean region
conference. South Halifax NS: The Institute for Research on Public Policy, 1990.
Crane, Flujo de Fluidos en Vilvulas Accesorios y caferias Mexico DF:McGraw-Hill,
1992.
Donahue, John M. and Johnston, Barbara Rose, eds. Water Culture and Power-Local
Struggles in a Global Context. Washington DC : Island Press, 1998.
Global Water Partnership, Integrated Water Resources Management, Technical Advisory
Comitee (TAC), 1996.
Gore, H Akia., Water conservation practices in the U.S. Virgin Islands by users of
cistern, public distribution and commercial systems Water Resources Research Center,
University of the Virgin Islands, 1989.
Jordan, D.G. and Cosner, 0. J., A Survey of the Water Resources of St Thomas, Virgin
Islands, U.S. Geological Survey open file report, 1973.
Mays, Larry W., Urban Water Supply Handbook .New York, NY: McGraw Hill, 2002
Montanari, F.W, Thompson, Terrence P., Curran, Terence P., and Saukin, Walter, eds.
Resource mobilization for drinking water and Sanitation in developing nations
Proceedings of the International Conference sponsored by the Water Resources Planning
and Management Division and the Environmental Engineering Division of the American
society of Civil Engineers New York, NY: American Society of Civil Engineers, 1987.
Peebles, Roger W. Water plan-A comprehensive water management framework for the
U.S. Virgin Islands. Virgin Island Water Research Center, Caribbean Research Institute,
College of the Virgin Islands, 1979.
103

Proceedings of the Virgin Islands Water Resources Conference, Water Resources
Research Center and Cooperative Extension Service, University of the Virgin Islands,
1989.
Rinehart, F., Peebles, R., Hoffman, P., Canoy, M., and Knudsen, A. Water Quality of
Cistern Water in St. Thomas, U.S. Virgin Islands Water Resources Research Center,
University of the Virgin Islands, 1985.
Ruskin, R.H. and Callender, P.S. Maintenance of cistern water quality and quantity in the
Virgin Islands Water Resources Research Center, University of the Virgin Islands,1989.
Ruskin, Robert H., Jr. Bacterial indicator Organisms in Various classes of cisterns in the
U.S. Virgin Islands .1996.
Ruskin, R.H. Water quality of Public Housing projects in the U.S. Virgin Islands Water
Resources Research Center, University of the Virgin Islands, 1989.
Torres Sierra, H. and Rodriguez, Alonso, T., National Water Summary 1987-U.S. Virgin
Islands Water Supply and Use. US Geological survey, water supply paper 2350, 1987.
U.S. Department of the Interior, Office of Insular Affairs (OIA). Report on the State of
the Islands, 1997.
U.S. Department of the Interior, Office of Insular Affairs (OIA). Report on the State of
the Islands, 1999.
UN Economic Commission for Latin America and the Caribbean. The Water resources of
Latin America and the Caribbean-Planning Hazards and Pollution Santiago, Chile: United
Nations, Economic Commission for Latin America and the Caribbean, 1990.
UNEP International Environmental Technology Center United Nations Environment
Programme. Source Book of Alternative Technologies for Freshwater Augmentation in
Latin America and the Caribbean. Washington DC: Unit of Sustainable Development and
Environment General Secretariat, Organization of American States-1997.
104

UNEP International Environmental Technology Center, United Nations Environment
Programme, South Pacific Applied Geoscience Commission. Source Book of Alternative
Technologies for Freshwater augmentation in small islands developing states, 1998.
US Department of Commerce, U.S. Census Bureau. Population and Housing Profile-2000
Census of Population and Housing-U.S. Virgin Islands, 2002.
WAPA. Water System of the Virgin Islands Water and Power Authority-Balance Sheets
-June 30 1998 and 1999, 1999.
105

106

APPENDIX A: Benefit-cost analysis detailed calculations.
107
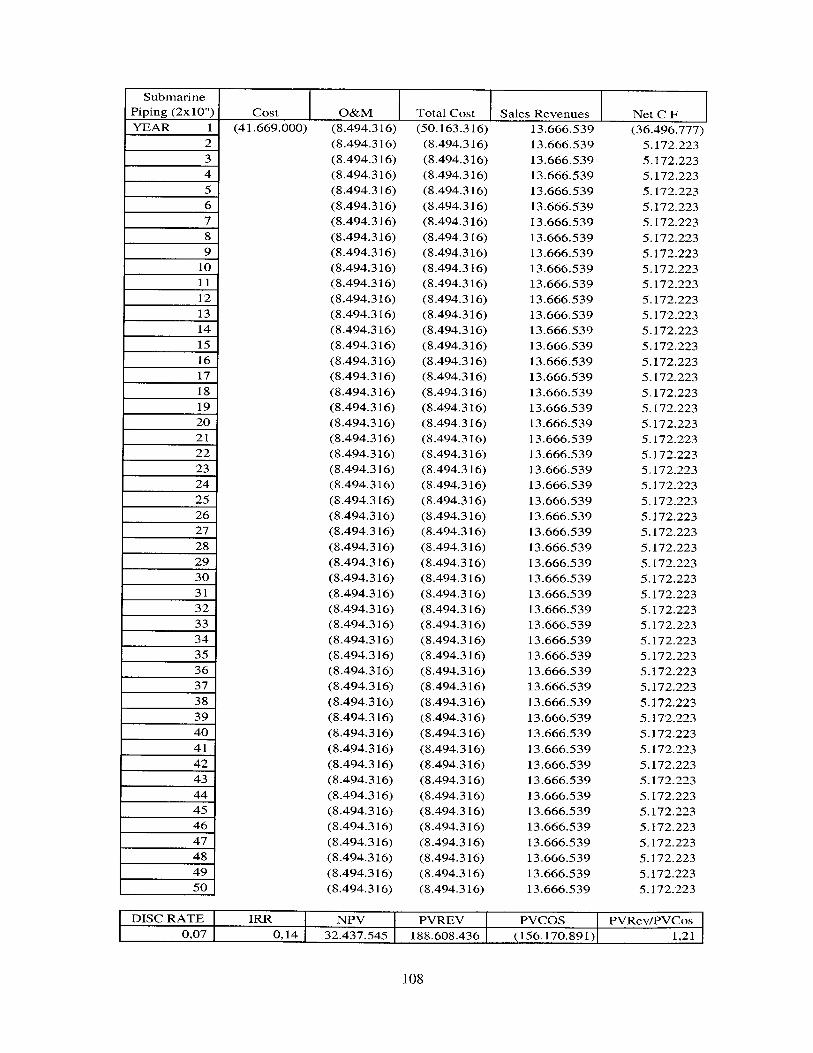
801
sd^ (168OL9S) 91V809-881 AV9LH£7d V7 I VI L0' I SODA4/Ag'dAd SODAd AagIAd AdN N81 9iIVdI DSIU
!CZZLI"9
£:ZZ*ZLI £
£ZZLV9
£EZZL1 £
£:ZZ*ZLI *£
£:ZZ*ZLI £
£:ZZ*ZLI ££ZZJZL1
CZZ"ZLI"9i:ZZL1 £
£:ZZ'ZLI £
CZZ*ZLI"9
£:ZZ*ZLI £
i:ZZLI £
£EZZL1 £
i:ZZ*ZL1 ££:ZZ7ZL1 ££ZZ'ZLI*S£
£:ZZ'ZLI £i:ZZ'ZL1 £i:ZZL1 £;£ZZ*ZLI £i:ZZ*LT"9
£:ZZLV£g
£:ZZ7ZLI £E:ZZL1 £
£EZZL1 £
(LLL*96t179£
61:S;'999'i1
6£:9'999"i161:9999£i:61:9999"i161:9999£i161:,C999*i:61:9999*E161:9999*i:
6££9999£1~6££C999£1T6££*999£1T61:9999£i161:9999£i161:9999*E1
6££"999£1:61:9999* il61:9999*CT
6££'999*C161:9999£i16££'999£1:
6E9*999£1~6££'999£1~61:9999*E161:9999* il6E:9999£1~61:9999* il61:9999'El61:9999£El
6££9999£ Il6££;999£ il61:9999* il
6C9*999£1:6££'999£1~6££"999£1T6££*999*i:61:9999'i1
6££'999£1:61:9999£i:61:9999"i1
6££S;999£1~61:9999'ET
6££9999£1l6E9£999£1~6££;999£1l61:9999* il61:S;999£ET61:9999£ i
(91 £17l6178)(91 £4t6t178)(91E£1618)(91T £176178)(91 £17l6t18)(91 £17W78(91 V6178)(91T £4t6t178)(91 £17618)(91 £1617)(91i:£176t18)(91 £17617*8)(91 £176178)(91 V6t178)(91 £4t6178S)(91 £46178)(91T £17t6178)(91i£176V"8)(91E:'176178)(91 £1617)(91 V1617*8)(91 i:17617*8)(91 V16178(91 i:1t617*8)(91T E:176t78)(91 £1617)(91 V17617*8)(91 £76178)(91 i:"V6t18)(91 T17618)(91T £17t6178)(91 V17617*8)(91 V176t18)
(91i £4617'8)(91i £176178)(91ET17W 8)(91 V17,6178)(91 £176178)(91 ET66W8)(91T E17617'8)(91 £176178)(91E£1618)(91C £46178)(91 £17178(91i:*1761"8)(91 £617*8)(91 £176178)
(91 V617*8)(91T EV£9 T0£)
(91 £176178)(91i:*176178)(91t £176178)(91 £1617'8)(91 E:17t6178)(91 £17178(91 V17,6178)(91 E17178(91 £17617)(91ETW617)(91i£176tV8)(91 i:17617 8)(91 E:*t6t178)(91 V617*8)(91 £176178)
(91C£1768)(91 £17618)(91 V176178)(91 C£176t178)(91i:£Vt17)(91E:*t76178)(91 £176178)(91 £176178)(91E£16178)(91 V176t18)(91 £176178)(91 £176178)(91E£1618)(91 E:1t617*8)(91 V176tW8)(91 £16tV8)(91 V17,6t18)(91i:V617*8)(91 V17617'8)(91 V176178)(91 £17,6178)(91 V 16t 8)(91 T1761TWO(91T C176178)(91 V 108(91 V176178)
-4 ~~~ ~ 9 D1618 IO(QIQQdSJS SDJoL w oIooo69, I xZ)ivaAdIIII I ouuLuqnS
0!96t78t,
Lt,9v7917
£17,
61£81:
9£:
17£
6Z
LZ
9z
I91611
£1
1
9T
1E£ZT
(000'699"1 V)

601
soid/^ I6TAdOLT) 9t809881 L16Adc6ZI8 iVO LO'OSODAcl/A3>Adl SODAcI Aa-dAd IAdN -d-1IgV'8 DSIGt
99Z*9Vi:*99Z*9VVE:99Z,9Vvlz99Z*9VE99Z,9VVl:i99Z*9vi:E99Z*9vi:*99Z*9VzVE99Z*9vCL99Z*9vi:*99Z*9vcE99Z*9vi:*99Z*9VVE"99Z*9vE99Z"9vi:E99Z*9v:E:99Z*9vi:L99Z*9vi:*99Z*9vE:*99V9vE99Z,9VVlE:99Z,9vE: £99Z"9vi:*99Z*9VCVE99Z*9v:E:99Z*9vE99Z"9vi:"997J9vi:E:99Z*9Vc~i99Z,9VVCE99Z*9vi:*99Z,9vc*99Z,9VEi99Z,9vEE~99Z*9vE99Z,9VVE~99Z*9vcE99Z*9VVlc99Z*9VVLE99Z,9vi:*99Z*9vc*E99Z"9VV:E:99Z,9vi:L99Z,9vi:*99Z*9v:E:99Z*9Vt99Z*9tV:C99Z,9VVl*99Z*9vi:*
(tVUL06tV9Z)
61:9999*il61:9999*il61:9999*ET61:9999*iT61:S;999il16ES;999il161:9999'i:6ES;999*i:6C9*999L1:6E9'999*C161:9999*iT61:9999*l161:9999'i:61:9999*l1
61:9999'i:6ES;999'l
6E9*999L1T
6E9'999*iT61:9999i161:9999*i:6E9999L1:61:9999'i:61:S;999'CT61:9999'ET61:9999'iT61:9999"Z161:S;999'iT61:9999'iT61:9999'i:61:9999*i:61:9999*iT61:9999*iT61:9999'iT&Eg"999ElT61:9999'iT6ES*999'l61:S;999'i:6E9*999!l161:9'999*il61:9999*ET61:9999*il61:9999*il61:9999il161:9999'iT
(cLz*ozioT)(CLz*ozi:oT(£LZWE-o1)(£LZ*OZvoT)(£LZ'OZ'oT)(cUzozvoI)(£LZ*Ozi:OT)(£woz*oU*)(ELzOzvoT)(£Lz'ozi:OT)(ELzoVOTE0)(£LZozO~i:O)(£LZozOI)O(£LZ*ozi:oT)(ELVOZEOT)(£Lz'ozOT)(ELZ*ozC*T)(UL'ozi:OT)(ELZ*OZE:OT)(ELz'ozi:oI)(£LZ'ozC'o)(£LZ*ozi:OT)(£LZozOT)O(£LZ*OZE*O)(cLZ*OZCOT)(ELZozOIO)(£LZ*OZCvO)(E:Lz*ozi:T)(E£VOU*0T)
(£ZLZ'OzVOT)(£LZ*oZi:OT)(ELzozO*)(£LZ'oZ*OT)(cUzoUvoT)(EL~oVO*T)(:Lz'ozi:oI)(EL~oVOT)(£LVoUvoT)(ELzVOI0)(CLoVOU*i)(ELVZEv01)(CLz'OZC0T)(ELVOU*0T)(£LZOZC*01)(cwozvOi*)(£LZOZE7O)(£LZ*oZi:OT)(£LZ-Oz*01)(£LZ*ozi:OT)(£LZ'L~lI V)
(ELVOUV0T)(ELVozEvoT)(£LZ-o~i:o1)(ZLZ'ozi:OT)(ELzozvoT)(cLz*ozi:oI)(ELzoz£0T)(£LzoU'o1)(£LZ'OZi:oT)(ULVO*0)(ELVozvOT)(£LZozvoIl)(£ELv*OZCOI)(£LZ*ozi:OT)(£LzozvoT)(£zozE"oI)(LZ'ozvOT)(£Lzoz'oT)(ELzozvoI)
(ELVOU"01)(£woVOJ)(LLZOT*O)(£LZ'OU*OT)
(ELVOz£01)(tIZZOZE:oi)(£LVOzvoT)(ELVozvo1)(ELVoU£0T)(£LzozvoI)(Lz'ozi:OT)(£LZ'ozvOI)(£LZ"ozvoT)(£wozO~i:)(£Loz*oU*T)(ELzOz"o1)(£Loz*oT*O)(ELzozvoI)(:LZ*OZEoT)(ELVOZEvoD(£wZozZ*o1)(£wLZo~il)(£LzozvoT)(£wLZow:ol)(£Lz'ozC*o)(U£"ozi:oT)(ELVozE7oT)(£L*i:*ol)(£LZ*ozvoT)(£ZLZozvoT)(ELVoU"OT)(ooo'L:8'6Z)
J4 D IN sonUgAO- L'>J I OJ I'IOL ww I SOD (,,8xZ) 2uid'd
III I I I ouuL~uqnS
6t,
Lt,9t,
9t,
z
ot,61:
Li:91:
VTEE
I016Z
9z
Vz£l

01i
sT od/ (96"669"91:1) 9V809881 0N6061 C£O LO'OSODA4/AON1Ad I SODAd AEPIAd IAdN HU1I HaivNiD
£:ZZ*ZLI £
£:ZZ"ZL1*9
£:ZZ'ZLI £
£ZZ*ZLI'9
£:ZZ'ZLI £
£:ZZ"ZL1*9
£:ZZ'ZL1*9
£:ZZ'ZLI £
£:ZZ'ZL1 £
£:ZZL1 £
i:ZZ*L1*9
£:ZZ'ZL1 £
£ZZ'ZL1 &
£:ZZL1 £
£ZZ'ZL1 £
£:ZZ"ZLI*9
£:ZZZLI*,£
£:ZZZL I "S
£:ZZ'ZLI*9
£:ZZ*ZL1 £
i:ZZ*L1*9
£:ZZ'ZL1 £
£:ZZ'ZLI"9
£ZZ'ZL1 £C
£:ZZZL1*9
i:ZZVL1*9
(LLZ*z99-91)
61:S;999*i161:,C999£ i61:9999'1
6££C999£1l6££'999£1I61:9999*161:9999"ET61:9999*E161:9999*E161:9999*i:61:9999*EI61:9999*1
6££999£1l61:9999"EI
6££9999£1:6££9999£ I61:9999£16££999£1l61:9999*E16££999£1T61:9999£16££9999£ i:61:S;999*i:
6££*999£1:6££9999£1E61:9999£11
6££"999£1:61:9999*16££;999£1l6££9999£ :I6££;999£ :I61:9999£ U6££*999£ I61:9999*1:I
6££'999£1l61:9999£1:I
6££9999£1:61:9999£1:I61:9999*EI61:9999£!EI6££9999£E I6££999£1l
6££9999£1I61:9999"E1
61:9999"E161:9999£E I61:9999*1
(91i:176t8)(91C176t18)(91 £:-18)(91 E'M6V8)(91 £1*8)(91 £76t'8)(91 £176178(91 £176178)(91 £1*8)(91 £1*8)(91£i"8)(91 £16V 8)(91E£16V8(91£17V8)(91E£16iW8(91 £176VO8(9 1 £176V(91 £16V18)(91 £16V8)(911*t61*8)(91 £18)(91 £761"8)(91 £t8)(911 v)(91 £:V~1*8)(91 £176VS)(91£ iV1*8)(91 £176V8)(91 £176V18)(91 £176tV8)(9~11*8)(91 £ *17618)(91 E1t6tr*8)(91E£16V8(91 £176V8)(91 £76tV8)(91 £76178)(91 £ 761" 8)(91ETWO"8(91E£161W8(91 £17W"8(9 1 £1761'8)(91 £1761'8)(91 £17618)(91£1761*8)(91 £176tV8)(91 £176178)(91 1618)(91 £1"8)(918*M76Z)
(91 £17617 8)(91 i:1-6tv8)(91 £16V 8)(91 £17618)(91 £*1618)(91 £17l6tV8)(91 i:*t6tV8)(91 £17t6 V8)(91 £176tV8)(91 £17W78(91 £1768)(91 Ct76tV8)(91 £176V8S)(91 £16V*8)(91 £7l6f "8)(9 1 £1t61" 8)(91 £176t 8)(91 £:t1*8)(91 £176V 8)(91 £176tV8)(91E£16V18)(91 £17,6V8)(91 £176V8)(911*t6V"8)(91 £176tV8)(91 £176V8)(91 £176tV8)(91 £176V8)(91 £1768)(91 £171"8)(91 £17l6tV8)(91 £17l61' 8)(91 £17l6tV8)(911*t6t'*8)(91 £17l6tV8)(91 £ 1761' 8)(91 £161"8)(9 1 £17,6t18)(91 £1761"8)(911*t61"8)(91 £161'8)(91 £171618)(91 £ 161"8)(91 £16V8)(91£176178)(91 £1717W8(91 £161'8)(91 £17t6VP*8)(91E£1618)(91 £161"8)(00s£17£8"oz)
09
6t78t7
Lt"
9t79t"1v1
zt7
it,0176£E8£:LE
9£:
17£
EE
1£
0£6Z
8z
9Z
1Z
1z
6 181L I
91!9111£1z1II1I0168L
9
odid -qnS
J N safUOA- SOL' ISOD Imlol ww2
~o ISOD

I T
Iz~ 1(966'69E'991) I 9L8O9'88 0",8i:Z'Z 6Z-0 L00OSODA41/AZ>Ad I SODAd A2MAd AdN -d8I aIIVN DSLG
99Z'9tV'99Z'9V'99Z'9tV'99Z'9V'99V,9V~L'99Z'9VL'L99V,9tV'99z'9vL'L99Z'917L'L99zvVEL'99Z'917L'L99V,9VL'99t,9VE'L99Z'917L'L99Z'917L'L99Z'917L'L99Z'917l'L99zVL'99Z'9vL'L99Z'9VlE'L99V,9tVE'99Z'9vVL'99Z'9VL'L99V,917L'L99Z'9VL'L99Z'9tV'L99Z'97L'Lz99Z'917L'L99Z'9VL'L99Z'917l'L99V,9VL'L99Z'917l'L99V,9VL'L99Zi917l'L99Z'917L'L99V,9tV'99V,9t7L'L99V,9tV'99t917L'L99Z'9tV'99V,917l'L99V,97Lc'E99V,9tVc'99Zi917L'L99V,9vEL'L99z'917L'L99t,9VL'L99t,9VE'L99Zi9Vz'L
(VLZZL9'1 TI)
6LL'999'il161:9'999'Li61:9'999'l61:9'999'Li
6LL'999'CLI6LL'999'ELI
61:9'999'CT61:9'999'iLI
6C9'999'LIT6LL9'999'iLI6ESL'999'LIT61:9'999'ilI
6LL'999'iLI6LL'999'Li:
61:S'999'ilI6E9'999'LIT
61:9'999'Li6LLS'999'L I
61:9'999'CT6L&9'999'i:I6LL;'999'iLI
61:9'999'l6L'999'L:I
6LL'999'iLI6LL'999'EL6E9'999'Cl
6LL;'999'iLI6LL9'999'iLI6LL'999'LI
61:9'999'lI61:9'999'CTI6E:9'999'LI61:9'999'ilI
6C9'999'ZL6L&;'999'iLI
61:9'999'CT6LL'999'LI
61:9'999'ilI6L&9'999'LI
61:9'999'U6L'999'LI
61:9'999'ET6Z9'999'CL
6LL;'999'Li:61:9'999'U
6E9'999'LI61:9'999'lI
6E9'999'LI6LL'999'LI
61:9'999'ZTI
(ELtOZL'OI)(ELtOZL'oI)(ELVO'o0o)(ELVtOz'oI)(ELVOL'OI)(ELVO'o')(LLVOZL'OT)(ELVOL'o1)(ELVOZZ'oI)(LLVOZL'OI)(ELVOZVoLI)(ELVOZ'0I)(ELVOZL'0I)(L£VOz'0I)(ELVtOZ'0I)
(:LL'VO)(ELVzOZL'o1)(ELOZ'o'O)(ELVOz'oZo)(ELVO'o0'o)(ELVOZ'oI)(ELVOZ'0I)(ELVO'o0o)(ELVOZ'0I)(ELVOZ'OI)(LLV0OL'0I)(ELVtOz'oI)(ELZ'OZ'OI)(ELVOzL'O)(ELVOz'oz')(ELLZ'Lo
(ELVzOZLOI)(ELVOzL'0I)
(ELVOZ'0I)(ELVOZL'I)(ELVzOZL'0I)(ELVzOZL'O)(ELVzOzL'O)(ELVOZL'O)(ELVOZ'0I)(LLVozL'0I)(ELVO'oO)(L:L'OIC)(ELWOZV0I)(ELVzOZ'0I)(EL£VOZL'0)(LVOZ'oI(ELVOZ'0I)(ELVOZ'0I)(:LuLi8CZ'9)
(LU'ZL'OI)O
(ELVozLOI)
(ZL~z'OZL:'OI)
(LW'OZL'0I(ELV~OZLO)
(L~z'OZL'0)(:LLVOZL'oI
(ELVOZ'0'0I)(:LZL'OI)(ELVOZE'0I)
(L~Z'OZL'OT)
(ELVOZL'0I)
:L~Z'OZL'0
:L£Z'OZL'0(L~Z'OZL'OI)(:LZ'0I)
(:LtZ'OIO)(ELVOZL'OI)(:L~Z''OIO)(ELVOZL'0)(:LZ'0)(:LZoOL'oI)
(:LZOZL'0I)(ELVzOZL'O)(ELVOZ'o'0I)(ooLC'SI'Vr)
9
Lt,97t,
0t,
61:
LE91:
OE6Z
LTJ9z
olz6181TZ91
LI
z ITI0168L9
zI dvaAk
-4 D ION sanUOAQ- I' S I S D is joj , 1oI S ISOD ("XZ Pzv

Zi I
16'0 I(186'6L1'SoZ) I 9£1'809'881 I(8VS'I££'61) ]Fi fIN# IL00O-SODAclAz'dAd I SODAd A9PIAd ,I AdIN I -d 9LV-I DSIU
t706't7991706'1799t706't7991706'1799t706't799t706't7991706'1799t706't799t706't7991706't799t706't799t706'1799t706'17991706'17991706't7991706't7991706'17991706't7991706'17991706't7991706'1799t706'1799t706't,99t706't799t706't799
(960'9 E£CE 1)1706'1799t706'1799t706'1799t706't7991706'17991706'17991706'1799t,06't7991706'17991706'1799t706'17991706'17991706'17991706'17991706'1799t706't799t706't7991706'17991706'17991706'17991706'17991706'1799t706'1799
(960'9i££'LZ)
6££'999'£161:9'999'£il61:,'999'E 16£1:£'999'E I
6££'999'£16££'999'£il61:,'999'E: I6£1:£'999'E I
6££'999'£il6££'999'£ I61:9'999'ET61:9'999'£il6££9'999'£ I
6££'999'£ I6£1:£'999'1: I6££9'999'£16££S'999'£il61Z '999'1: 16££C'999'£: I6££'999'£il
6££'999'£ I61Z '999'1: 16££C'999'£ I6££'999'£ I6££'999'£ I
6££9'999'£ I6£E£'999'1: 1
6££'999'£il61:9'999'C I6££9'999'£ I6££C'999'£: I61:9'999'£il61:9'999'E I6££9'999'£ I6££9'999'£il
6££'999'£ I6££9'999'£ I6££9'999'£ I6££C'999'£: I6££9'999'£ I6E:9'999'£il6££9'999'£161:9'999'E I6££9'999'£il6££9'999'£ I6££9'999'£ I6E:9'999'£il6££'999'£ I
6££,C999'£ I6££9'999'£ I
IoN sonugA;)-d SOIL's ISOD WuoI Nw'O ISOD uo0w11lsic
(gi£9' 00'£:1)
(££9',I oo'£i)(gi£9' I0'£i1)
(s£9iqloo'£I)(££9'iq,00'£i)
(££9iqloo'£i)0(££9iqloo'£i)
(s£9iqloo'£I)(gi£9' 00'£:1)(££9'Iloo'EI)(££9'Ioo'£i:)(££9'loo'£i:)
(g£9' I00'£il)(gi£9'100'£:1)(££9iqloo'£i)0
(gi£9'Ioo'£i)
(g£9 i~g00'£1I)(go,' I OO'£I)
(,££9' 100' L2)
(g£9'Ioo'£i)(££9'Ioo'£i:)(s£9iqloo'£i)
(gi£9'100'£:1)(S£i9'IOO'£I)
(s£9iqloo'£i)
(gi£9' 00'£I)
(££9iqloo'£I)
(9'i900'£1)
(££9'Ioo'£i:)(££9iqloo'£il)
(s£9iqloo'£i)
(go,' 100' 117)
(££9iqloo'£il)
(gc9'Ioo'£il)(gi£9' 00'£I)(££9' I00'£il)
(g£9'Ioo'£il)(gi£9' 00'£I)(££9'Ioo'cI)
(g£9'Ioo'EI)
(gc9'Ioo'£:I)
(sc£9' 100'£I)(g£9'Ioo'£I)
(g££9'Ioo'£i)
(gc9'Ioo'£I)(S£c9'Ioo'£I)
(sco'Ioo'cI)(££'Ioo'cI)
(gc9'Ioo'£I)
(s£9'Ioo'cl)(S§E9'Ioo'£il)
(sco'Ioo'cI)
(gc9'Ioo'£:I)(s£'Ioo'EI)
(g£9' IOO'£1)
(S£c9'Ioo'£I)(S£E9'Ioo'£I)(gol'oo'£il)(££9'Ioo'£I):(££9'Ioo'£I)(S£9' I0'£ I)
(0000'roo101
(000,000,8z)
096t7
9t7
£17,Et,117017
6E8E
9£
6Z
IzE
6181LI9191
zz111016181L91
1
zII IIk

I iti I(L69£i69*SS1) 9EV809-881 6£41££LO LO'OSODA&IAO)dAa SODAd AaIAd AcIN I1I LLVN DSIQ
198*9ZLC£198*9ZV£198*9ZLV£198*9ZLV£
19S89ZL£i198*9ZV£i198*9Z&£E198*9ZCT98'9ZC£i198*9ZV£i
I 989ZV£E198*9ZL198'9ZV£i198*9ZV£198*9ZV£i198'9ZV£E198*9ZLV£198*9ZC£i
I 989ZL*£T98*9ZL*E1989ZV£I9W9ZV£
T1989ZC£ZI98*9WE198*9ZLV£
(6£:! iLtl*L)198'9ZV£i198*9ZLV£I98W9ZV£i198 9ZV£iI98*9ZL'i198*9ZV£E198'9ZLV£T98'9ZL*198 9ZL*E198 9ZLV£198*9ZV£i198'9ZL*E198'9ZV£E198*9ZL*198*9ZLC£198'9ZLV£198*9ZLE:198*9ZL'i198*9ZL'i198*9ZL'i198W£i198*9ZL£i198*9ZL
(6£! £L£)
61:9'999*i:6ES;999£1T61:9999*E:61:9999'El
6Eg&999"EI61:9999'CT
6££*999£1T6£&'999£1T6£&*999£1:
6££9999£1T6££'999£1T6£&9999£ I61:9999£ET61:9999*ET61:9999£ET
6££9999£1T6ES'999£1T
6££"999£1l
61:9999*i:
6£&9999£1:
6C9£999*i:
6£&999£1T61:9999*i:6££;999£1T61:9999£i1
6££'999£1:61:9999"E1
6££9999£1:61:9999*i:
(LL96:6'6)(LL96C66)(LL96:6'6)(LL96:6*6)(LL96:6-6)(LL96E66)(LL96£66)(LL96:6'6)(LL96£66)(LL96:6*6)(LL96E66)(LL96:6*6)(LL96C66)(LL96:6'6)(LL96:6'6)(LL96E6*6)(LL96E6"6)(LL96E66)(LL96£66)(LL96Z66)(LL96i66)(LL96E66)(LL96£6'6)(LL96E6'6)(LL96C66)(LL96E£lZ)(LL96:6*6)(LL96C66)(LL96E66)(LL96:6*6)(LL96:6*6)(LL96:6*6)(LL96:6'6)(LL96i6'6)(LL96:6'6)(LL96C66)(LL96:6'6)(LL96Z66)(LL96:6'6)(LL96C66)(LL96:6*6)(LL96i6*6)(LL96:6*6)(LL96:6*6)(LL96£6'6)(LL96C66)(LL96£6'6)(LL96E66)(LL96:6'6)(LL9'6EV*LZ)
(LL96:6"6)(LL96E66)(LL96E66)(LL96:6*6)(LL96:6"6)(LL96:6'6)(LL96:6*6)(LL96E66)(LL96:6'6)(LL96E66)(LL96£66)(LL96£6'6)(LL96:6'6)(LL96:6*6)(LL96:6*6)(LL96:6*6)(LL96E6'6)(LL96£6*6)(LL96:6'6)(LL96:6*6)(LL96£6'6)(LL96:6*6)(LL96Z6*6)(LL96i6*6)(LL96:6'6)(LL96:6*6)(LL96:6"6)(LL96C66)(L9'6£6'6)(LL96i6'6)(LL96E6*6)(LL96:6*6)(LL96:6*6)(L9'6£6'6)(LL96E66)(LL96:6'6)(LL96i6*6)(LL96:6*6)(LL96£6*6)(LL96:6"6)(LL96:6*6)(LL96C66)(LL96E66)(LL96:6*6)(L9*6E6"6)(L9*6:6'6)(LL96:6*6)(LL96:6'6)(LL96:6'6)(L9*6:6*6)
(ooo'oozT T)
(ooo009"LT)
096V78t,Lt,94v
9t,417£47zt7
61:81:
9£:
Z
67Z
8z
9z
91
zi
6T8TLT9T
97V£Ez
A D ION soflUOAO-d SOIL'S ISOD Pu1Ol IAwSO IWOD sisouISo
II I- II I jSO O-

LO'd j(6Zd/9^9Ld) 9Et8O9881 LO?8VtZI d !O/AII V SLO'OSODA&IAON~Ad I SODAd A3g1Ad AdN I al JN DSIUI
01 £L88019"L88019*L88019*L8801*L8
019'L88019*L88019"L88019'L88019'L88019'L88019*L88019*L88019"L88019"L88019*L88019*L88019'L88019'L88019*L88019*L88
0I9"L88019"L88019'L88019"L88019*L88019'L88019"L88019'L88019*L88019*L88019*L88019'L88019"L88019"L88019*L8801£;L88019"L88019'L88
01£'L8801£*L88019'L88019"L88
6E9"999£ Il6!E9999*i16!E9999£1:6ES£999*i 161:S;999*i:
6E9*999£ :I61:9999* i61:9999*161Y999'!E
6!E9999£ i:6££9999'EI6E9£999£ il61:9999*1:I61:9999* iT619999*E1
61:9999*161:S;999"i1
6EY999"i I61:9999£ i61:9999*EI61Y999'!C61:9999*CI61:9999*161:9*999£ il6ES£999£ :I61:S;999'EI
6!E9999*EI61:;999*i161:9999£ il
6!E9999*i16£g999'E161:9999'1:I6!E9999*i:I61:9999*E161:9999"EI
6E9*999"!16!E9999"i1
6 9999 '£16!C9999*C161:9999£ i61:9999*161:9'999£1 I6 1:9999 '!E61:9'999*EI6££999"EI6!C9999*i:I6££"999£ :I6££9999£ I
(8Z0o6LLVZ )(8ZO'6L*Z 1)(8zo'6LLZ 1)(8Zo*6LLZ1)(8ZO*6LL'Z1)(8zo*6LLVT)(8Zo*6LL*Z1)(SZO'6LLvZ1)(8ZO*6LvZ~T)(8ZO*6LL*Z1)(8ZO"6LLvz )(8Zo*6LL* 1)(8Z0*6LLvZI)(8zo*6LL'Z1)(8ZO'6Lv'Z )(8Zo*6LLvZ )(8ZO'6LLcZT)(8zo*6LL'Z1)(8Zo"6LvZ 1)(8Zo'6LLZ01(Zo'6LLz 1)(8zo*6LLvZ 1)(8zo*6LLvz )(8ZO*6LL* 1)(8ZO'6Lv*Z 1)(8ZO'6Lv*Z1)(8Zo*6Lv*Z )(8zo'6LLvu)(8Zo'6LL* 1)
(8ZO'6LL*Z )(8Zo'6LvZ I)(8ZO*6LLvZ )(8Zo*6Lv*Z )(8ZO'6LLvZ )(8ZO'6Lv'ZJ)(8Z0*6LL' I)(8z*6Lc*Z1)(8ZO'6LLvZT)(8ZO*6Lv*ZT)(8ZO*6LLcZT)(8ZO*6LL* 1)(8Zo*6LL*Z1)(8ZO"6Lv*ZJ)(8zo*6L'z 1)(8ZO*6LvZ1)(8ZO'6LvZ1)(8zo*6Lv'zI)(8zo*6L'Z 1)(8zo'6Lv'z )(8ZO'6Lv' 1)
(8Zo6LoV)(8Z0*6L0't7)8ZO'6LoT)
(8O06L0]7)
(8ZO*6LO~7)sZO*6LoT~)8ZO*6LoT)
(8Z06LO~t7)(Zo6Loi')sZO6LoT~)sZO*6LoT)
(ZO'6Lot)sZO6LoT~)
(8Z0*6L017)(Zo*6Loi')
(8Z06L017)(8Z06L017)
(8ZO'6Lovt)
8ZO*6Loi')(8Z0*6LO~tl)(8Z06L017)(ZO'6LOi')(8Z0'6L017)
NZO'6LOi7)
(8Z0'6L017l)(SZO'6Loi'l)(ZO*6Loi')sZO*6LoT)
(Zo*6LoT)(szo6LoT)(80'6L017)(8zo6LoT)(s0o6LoiT)
(8Z0*6L0i7)(so'6Lot)(8Zo'6Lovt)(8Zo'6Loi')
(8Zo'6LoiT)
(Zo'6Lot')
(8ZO06Lo')sZO6Loi')
AD IN sonuDAO)J SOIL'S IWOD Itu1oI IAPSO @: I IOWuds
(00ooooov)(00ooooov)(00oooooc)(ooooovs')(00oooooS)(00ooooor)(00ooooov)(00oooooS)(00ooooov)(00ooooov)(00ooooov)(00ooooov)(00ooooov)(00ooooov)(00ooooV)(00ooooov)(00ooooov)(00ooooor)(ooooovs")(ooooovs*)(00oooooS)(0OOoov)(00ooooov)(00ooooov)(00ooooov)(00ooooo8)(00oooooc)(ooooovs")(ooooovs*)(00oooooS)(0OOoov)(00ooooov)(00ooooov)(00ooooov)(00ooooov)(00ooooov)(00ooooov)(00ooooov)(0OOoov)(00ooooov)(0OOoo8)(00ooooov)(00ooooor)(00ooooov)(0OOoov)(00ooooov)(00ooooov)(00ooooov)(00ooooov)(ooooovs*)
6t,8t,Lt,9v7
9t,
OEt
8z
I ,
oz,6E81ELE:91:
gi:
£1
z:
6Z8zLZ9z
zIz