(?xrd\) : applications - x-ray diffraction texas a & m university
TRANSCRIPT

Micro Sample X-ray Diffraction (µXRD) : Applications to Pharmaceutical Sciences
NATURA IN MINIMIS MAXIMA
(Nature is greatest in the smallest things)
Joseph H. Reibenspies* & Nattamai BhuvaneshTexas A & M University
XDL
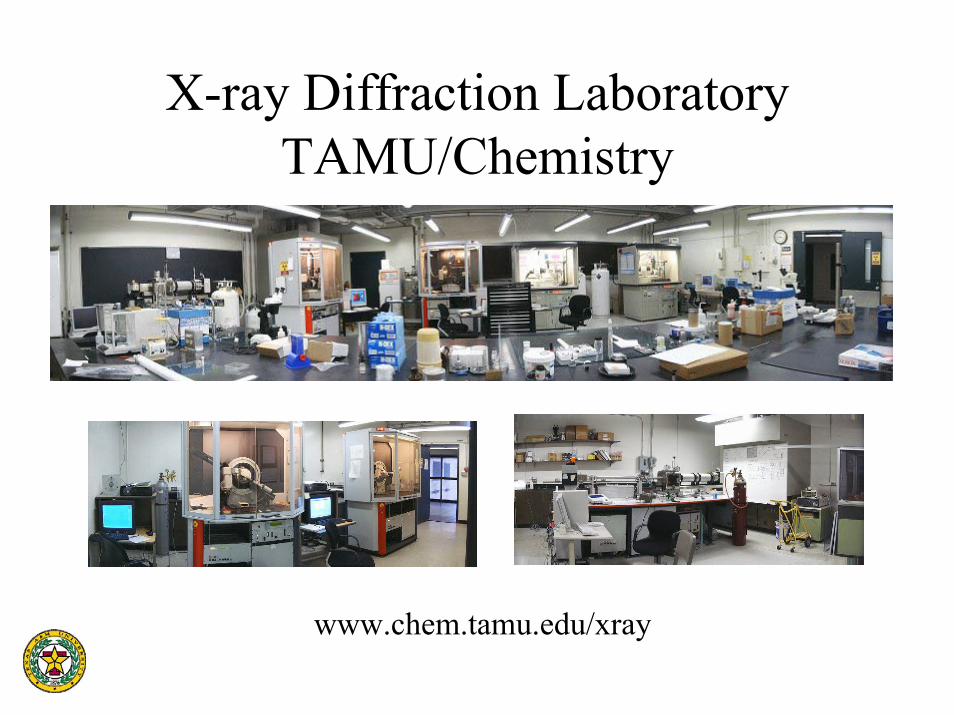
X-ray Diffraction LaboratoryTAMU/Chemistry
www.chem.tamu.edu/xray

Micro-sample X-ray Powder Diffraction• Why we use micro-samples at TAMU
– Economy of resources – Simple/robust mounting technique– Minimize preferred orientation, transparency/sample
displacement– Green Chemistry
• When– SDPD investigations– Initial stages of Discovery – Identification of by-products– In situ experiments– RMA (routine materials analysis)

Micro-sample Diffraction
Parameters to Optimize Micro-sample Diffraction experiment
• Maximize Intensity• Decrease the Background• Achieve acceptable particle statistics
– Grinding– Mechanical Tumbling
Debye, P. & Scherrer, P. Phys Z. (1916) 17, 277-283.Hull, A. W. Phys. Rev. (1917) 10, 661-696.

Micro-sample Diffractometer
• Instrumentationa
– Bruker D8 GADDS diffractometer with fixed χ stage.• Copper radiation (40kv/40ma) with graphite
monochromator and 17cm pinhole collimator.• Transmission mode (capillary, loop, foil)b
• Multi-wire (HI-STAR) detector.– Single – crystal : 5cm sample to detector distance.– Powder : 12 or 25cm sample to detector distance.
• Oxford 600 Cryostream LN2 cold stream (110K).• “Short” beam stop.
aDepero et.al. J. Appl. Cryst. (2001). 34, 663-665

Sample Mounts : Loops/Foilsa,b,c
Mylar FoilKAPTON
aTeng, (1990) J.Appl.Cryst. 23, 387b Thorne et.al. (2005) J. Appl. Cryst. 38, 333.c Thorne et.al. (2003) J.Appl.Cryst. 36, 1455.www.hampton.com www.mitegen.com www.moleculardimensions.com
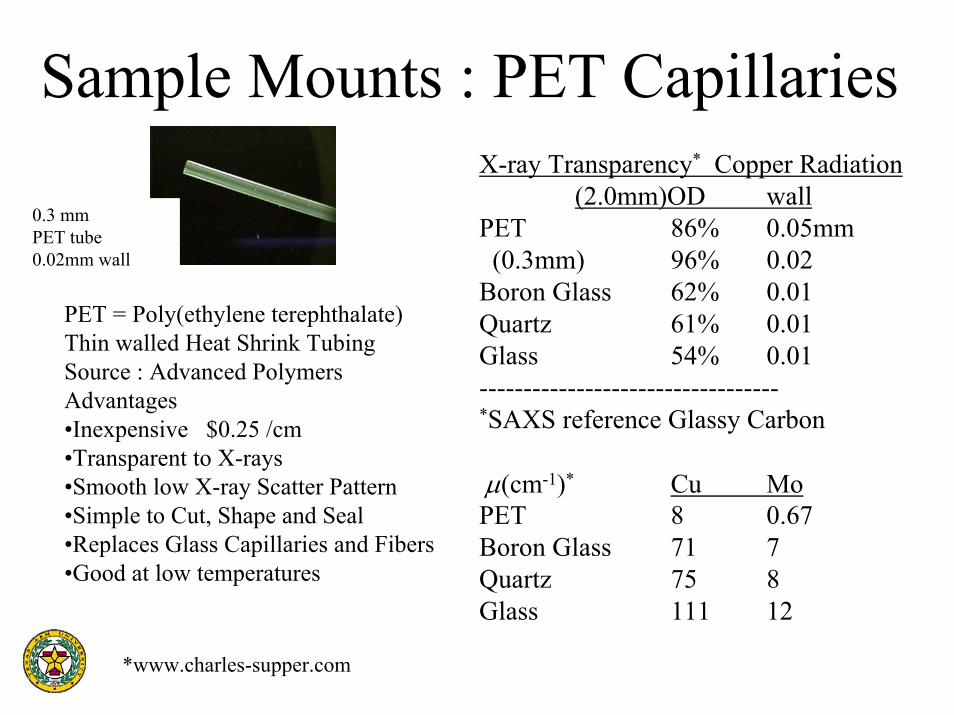
Sample Mounts : PET CapillariesX-ray Transparency* Copper Radiation
(2.0mm)OD wallPET 86% 0.05mm(0.3mm) 96% 0.02
Boron Glass 62% 0.01Quartz 61% 0.01Glass 54% 0.01----------------------------------*SAXS reference Glassy Carbon
µ(cm-1)* Cu MoPET 8 0.67Boron Glass 71 7Quartz 75 8Glass 111 12
0.3 mmPET tube0.02mm wall
PET = Poly(ethylene terephthalate)Thin walled Heat Shrink TubingSource : Advanced PolymersAdvantages •Inexpensive $0.25 /cm•Transparent to X-rays•Smooth low X-ray Scatter Pattern•Simple to Cut, Shape and Seal•Replaces Glass Capillaries and Fibers•Good at low temperatures
*www.charles-supper.com
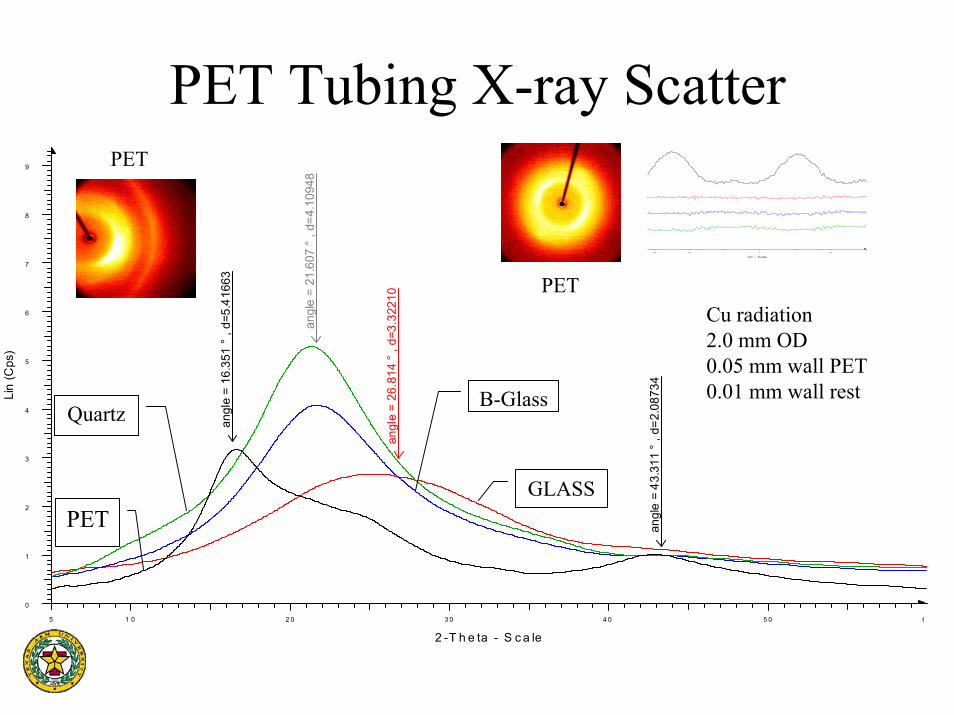
PET Tubing X-ray ScatterLi
n (C
ps)
0
1
2
3
4
5
6
7
8
9
2 -T h e ta - S c a le5 1 0 2 0 3 0 4 0 5 0 6
angl
e =
16.3
51 °
, d=
5.41
663
angl
e =
43.3
11 °
, d=
2.08
734
angl
e =
26.8
14 °
, d=
3.32
210
angl
e =
21.6
07 °
, d=
4.10
948
PETGLASS
QuartzB-Glass
C h i - S c a le-1 5 0 -1 0 0 0 1 0 0
PET
PETCu radiation2.0 mm OD0.05 mm wall PET0.01 mm wall rest

Loading Sample*
5 ng sample on a 0.1mm loop1. The sample is adhered to the loop by gently dragging the loop over the sample surface.
2. The sample is “shaped” into a sphere and attached to the loop with mineral oil.
60 µg in a 0.7mm loop
1. A 1mm PET tube is attached to a small brass pin.
2. The open end of the tube is “inserted” in the powder and quickly removed
200 µg on a Kapton loop
1 mg in a PET tube
Bhuvanesh & Reibenspies (2003) J. Appl. Cryst. 36, 1480-1481Bhuvanesh & Reibenspies (2006) J. Appl. Cryst. (in prep)

Data Collection on the GADDS
Raw Data Frame
Operations: X Offset -0.067 | Displacement 0.062 | Y Scale Add -60 | Y Scale Add 54 | Y Scale Add 20 | Smooth 0.092 | Import? Frame: f:\loop_test\aa_mesh_Frame: f:\loop_test\aa_mesh_18001.001 - File: aa_mesh_18001.raw - Type: 2Th alone - Start: 2.965 ° - End: 39.467 ° - Step: 0.020 ° - Step time: Operations: Smooth 0.141 | Y Scale Add 5 | Background 1.000,0.000 | X Offset -0.082 | X Offset -0.164 | Range Op. Merge | Import? Frame: f:\loop_test\aa_mesh_Frame: f:\loop_test\aa_mesh_18002.001 - File: aa_mesh_18002.raw - Type: 2Th alone - Start: 3.000 ° - End: 74.300 ° - Step: 0.020 ° - Step time:
Lin
(Cou
nts)
510
20
30
40
50
60
70
80
90
100
110
120
130
140
150
160
170
180
2-Theta - Scale8 10 20 30 40
• The detector distance (12cm or 25cm) and beam center are calibrated. (Corundum).
• The sample is centered.• Thee frames (at three different
2θ angles) are collected.• The frames are un-warped and
an area integration routine (cake integration) is employed to reduce the data.
CorundumStandard in loop

Powder Pattern Collection
1. No movement – Still2. ϕ scan only - Spin
Debye-Scherrer 3. ω scan + ϕ scan – Tumble
Gandolfi
ω scan
Gandolfi2θ ω ϕ χ scan width time-30 -30 0 54.7 ω -179 600
use ϕ spin option
ϕ scan
Gandolfi G. Miner. Petrogra. Acta (1967). 67-74.
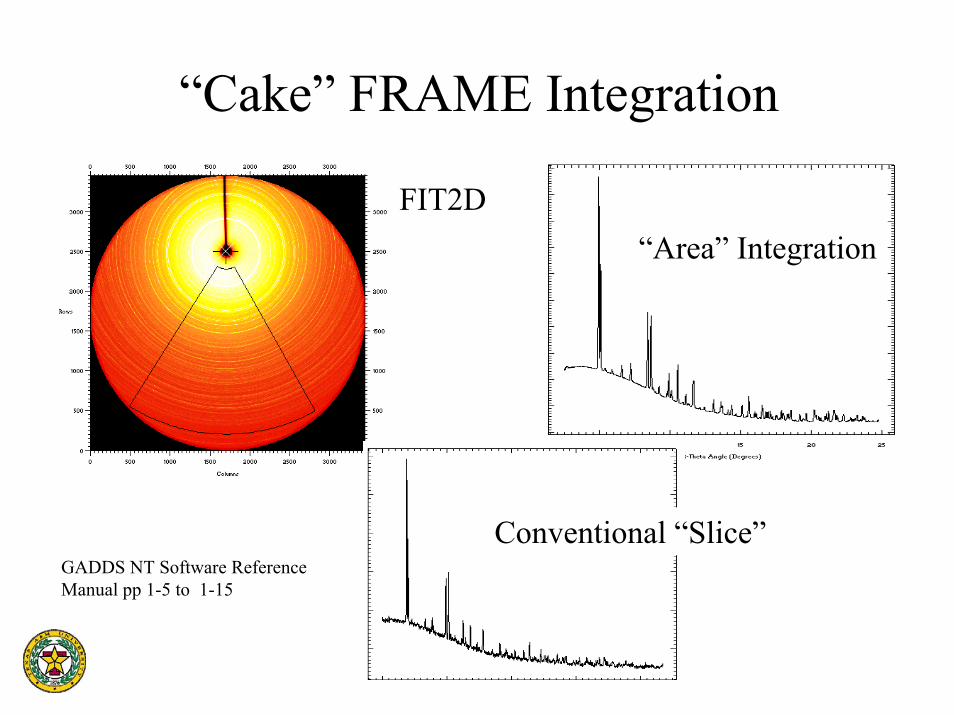
“Cake” FRAME Integration
Conventional “Slice”
“Area” IntegrationFIT2D
GADDS NT Software Reference Manual pp 1-5 to 1-15
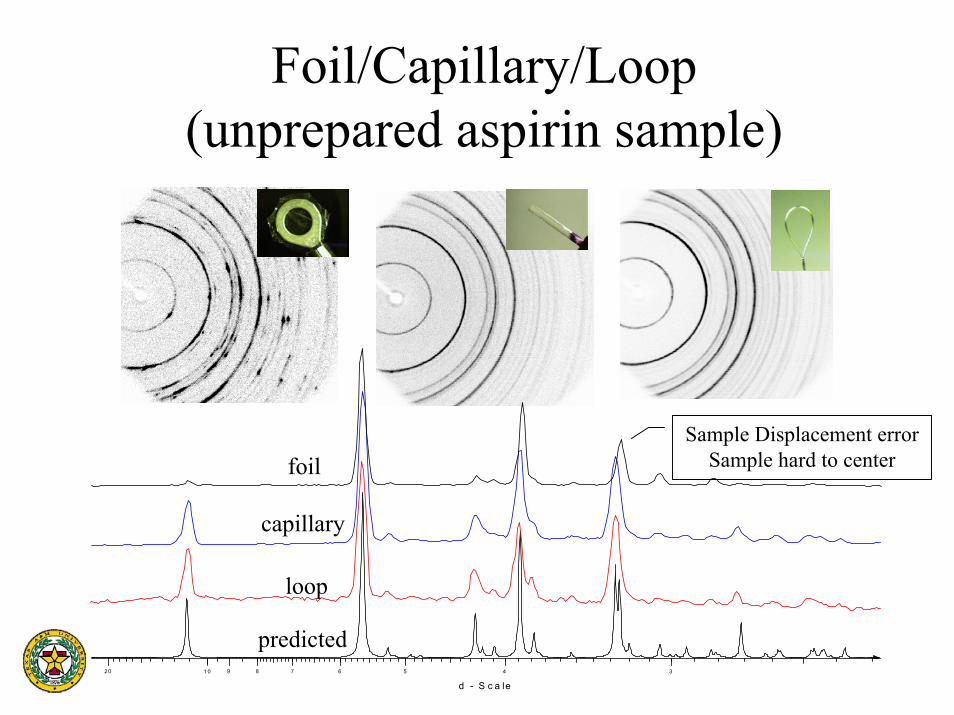
Foil/Capillary/Loop(unprepared aspirin sample)
d - S c a le31 0 4567892 0
predicted
loop
capillary
foilSample Displacement error
Sample hard to center

Sample Preparation and Scan Types
Still/foil Still/Foil Gandolfi/Loopno sample preparation sample prepared no sample preparation

2-Theta - Scale20 21 22 23 24
D8 Vario FWHM
GADDS 0.334o
Vario 0.087o
(Ultra)Micro-samples on the Bruker Vario Powder Diffractometer
18 mm beam width0.5mm slit I/Io ~ 0.03 D8
GADDS

Argonne: Advanced Photon Source*
MARS image plateCollimatorBeam stop
Line : 1-BM-C (XOR line)20.016 KeV λ = 0.61938ÅMARS 345 IP
*Lee, P et.al. (1999) Rev. Sci. Inst. 70, 4457-4462
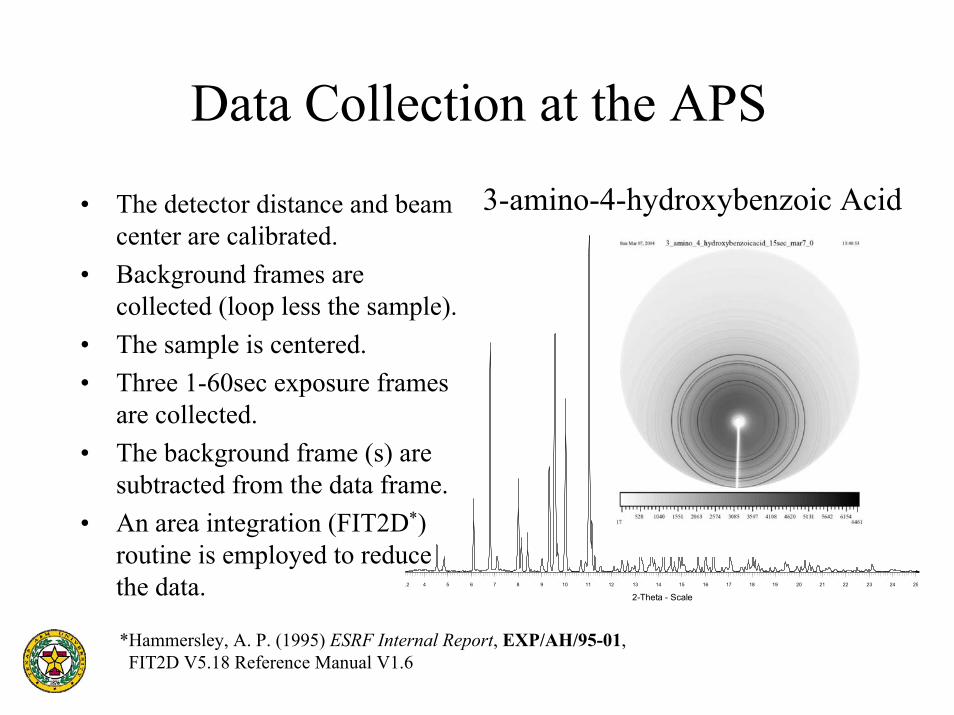
Data Collection at the APS
• The detector distance and beam center are calibrated.
• Background frames are collected (loop less the sample).
• The sample is centered.• Three 1-60sec exposure frames
are collected.• The background frame (s) are
subtracted from the data frame.• An area integration (FIT2D*)
routine is employed to reduce the data. 2-Theta - Scale
.2 4 5 6 7 8 9 10 11 12 13 14 15 16 17 18 19 20 21 22 23 24 25
3-amino-4-hydroxybenzoic Acid
*Hammersley, A. P. (1995) ESRF Internal Report, EXP/AH/95-01, FIT2D V5.18 Reference Manual V1.6

Applications
Pharmaceutical Sciences
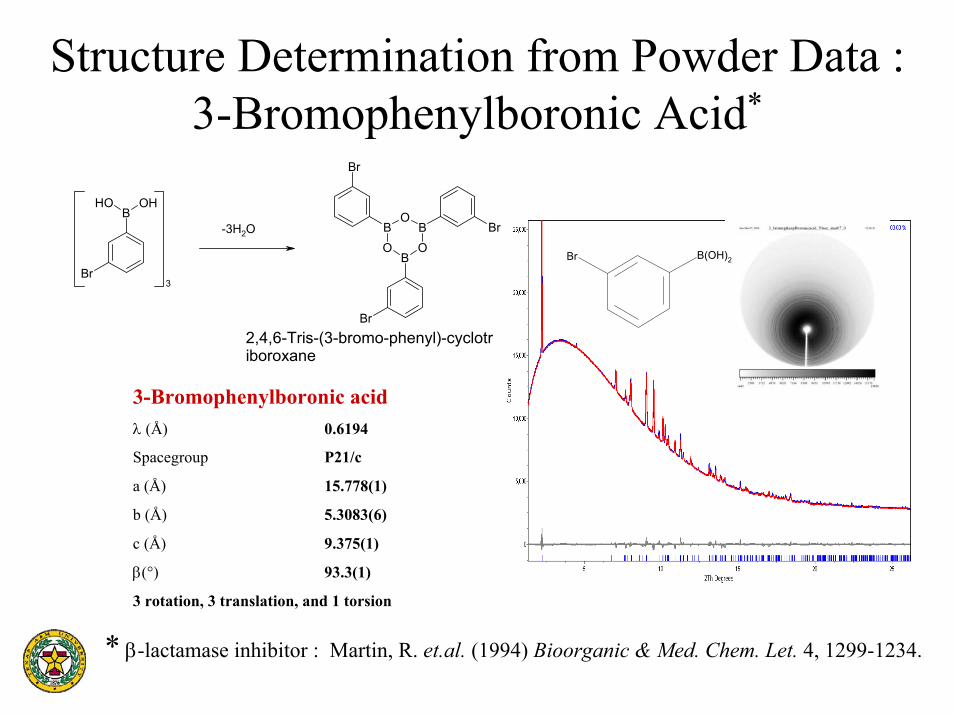
Structure Determination from Powder Data : 3-Bromophenylboronic Acid*
Br B(OH)2
BOHOH
Br3
Br
BrBO
BOO
B
Br
-3H2O
2,4,6-Tris-(3-bromo-phenyl)-cyclotriboroxane
3-Bromophenylboronic acidλ (Å) 0.6194
Spacegroup P21/c
a (Å) 15.778(1)
b (Å) 5.3083(6)
c (Å) 9.375(1)
β(°) 93.3(1)
3 rotation, 3 translation, and 1 torsion
* β-lactamase inhibitor : Martin, R. et.al. (1994) Bioorganic & Med. Chem. Let. 4, 1299-1234.
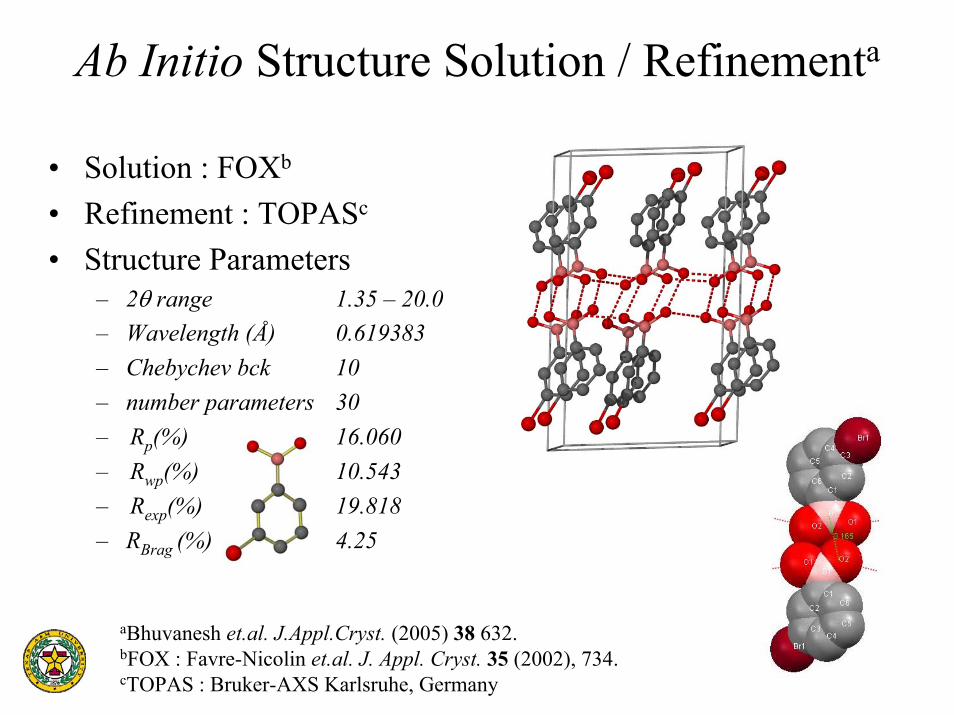
• Solution : FOXb
• Refinement : TOPASc
• Structure Parameters– 2θ range 1.35 – 20.0– Wavelength (Å) 0.619383– Chebychev bck 10– number parameters 30– Rp(%) 16.060 – Rwp(%) 10.543– Rexp(%) 19.818– RBrag (%) 4.25
Ab Initio Structure Solution / Refinementa
aBhuvanesh et.al. J.Appl.Cryst. (2005) 38 632.bFOX : Favre-Nicolin et.al. J. Appl. Cryst. 35 (2002), 734.cTOPAS : Bruker-AXS Karlsruhe, Germany
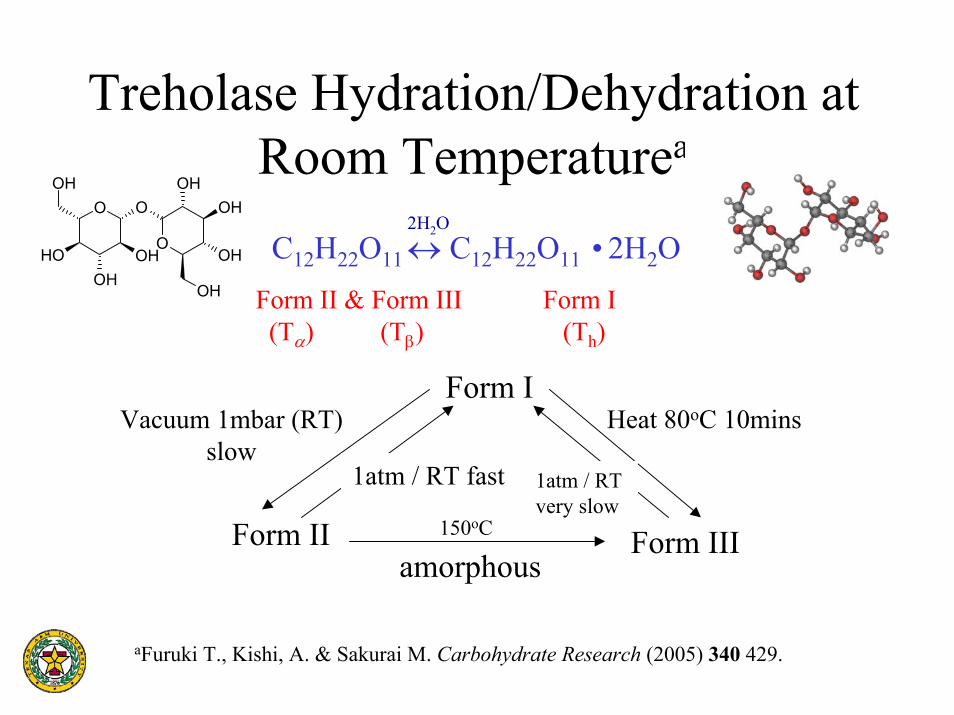
Treholase Hydration/Dehydration at Room Temperaturea
O
OOH
OHOHOH
OOH
OH
OH
OH
C12H22O11 ↔ C12H22O11 • 2H2O2H2O
Form I(Th)
Form II & Form III(Tα) (Tβ)
Form I
Form II
Vacuum 1mbar (RT)slow
Heat 80oC 10mins
amorphous150oC
1atm / RT fast 1atm / RT very slow
Form III
aFuruki T., Kishi, A. & Sakurai M. Carbohydrate Research (2005) 340 429.

2-Theta - Scale7.6 8 9 10 11 12 13 14 15 16 17 18 19 20 21 22 23 24
C12H22O11 ↔ C12H22O11 • 2H2O2H2O
Trehalose Hydration
Vacuum Chamber1. 1mbar Vacuum for 24 hr2. Sample moved to cold stream3. Cold stream stopped4. Data collected
Cold Stream
Dynamic
120sec/pattern53% R.H.~ 10 µg
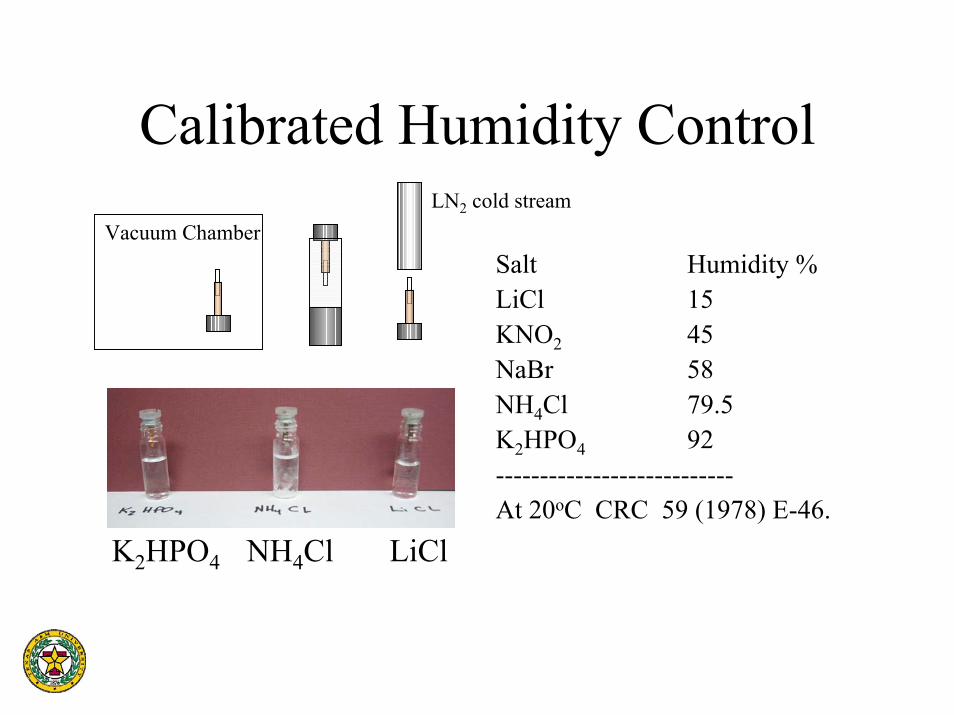
Calibrated Humidity ControlLN2 cold stream
Vacuum ChamberSalt Humidity %LiCl 15KNO2 45NaBr 58NH4Cl 79.5K2HPO4 92---------------------------At 20oC CRC 59 (1978) E-46.
K2HPO4 NH4Cl LiCl

2-Theta - Scale5 6 7 8 9 10 11 12 13 14 15 16 17 18 19 20 21 22 23 24 25
LN2 cold stream 110KVacuum Chamber
79.5%R.H
6min
3min
9min
0min
Flash Frozen
Static
20min/scanT = 110KOXFORD LT

High Throughput Screening
7 10 20 30 40
Polymorph II
Mannitol
2-Theta - Scale7 10 20 30 40
Polymorph IIIPolymorph I2-Theta - Scale
6 10 20 30 40
Fronczek, F. et. al. Acta Cryst. (2003) C59 o567-o570.Bruget, J-O., et.al. Pharm. Sci. (2000) 89 457-468.Roberts, S. et.al J. Pharm. Sci (2002) 28 1149-1159.
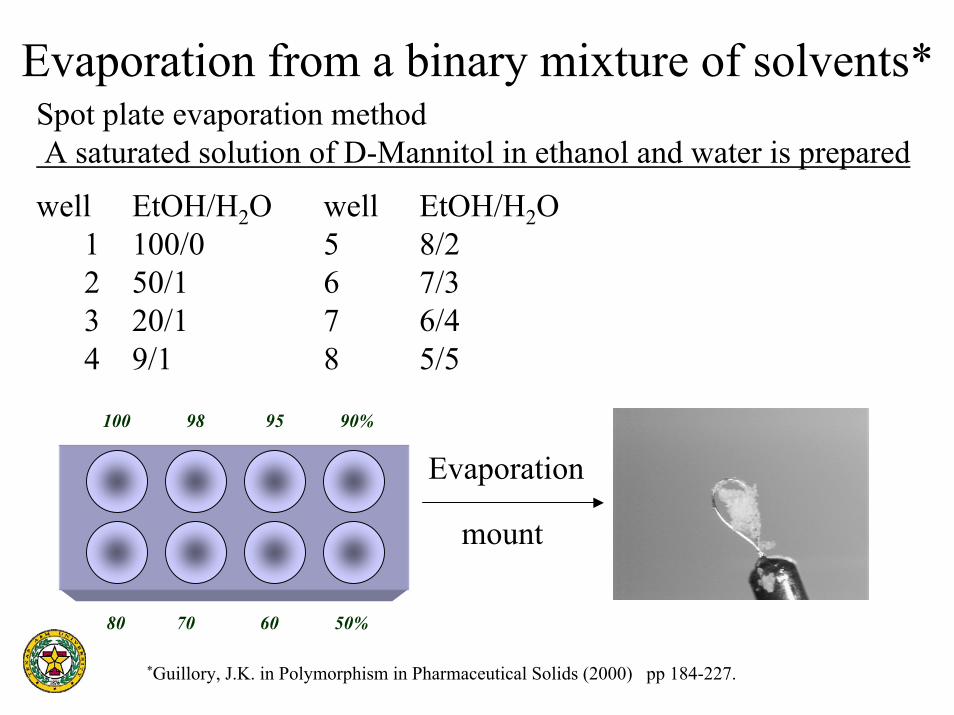
Evaporation from a binary mixture of solvents*Spot plate evaporation methodA saturated solution of D-Mannitol in ethanol and water is prepared
well EtOH/H2O well EtOH/H2O1 100/0 5 8/22 50/1 6 7/33 20/1 7 6/44 9/1 8 5/5
100 98 95 90%
Evaporation
mount
80 70 60 50%
*Guillory, J.K. in Polymorphism in Pharmaceutical Solids (2000) pp 184-227.

50%
60
70
80
90
95
98
100Polymorph III
Polymorph II
Polymorph I
%Ethanol
Mannitol : Results*
*Reibenspies & Bhuvanesh J. Pharm. Biomed. Analysis 37 (2005) 611-614
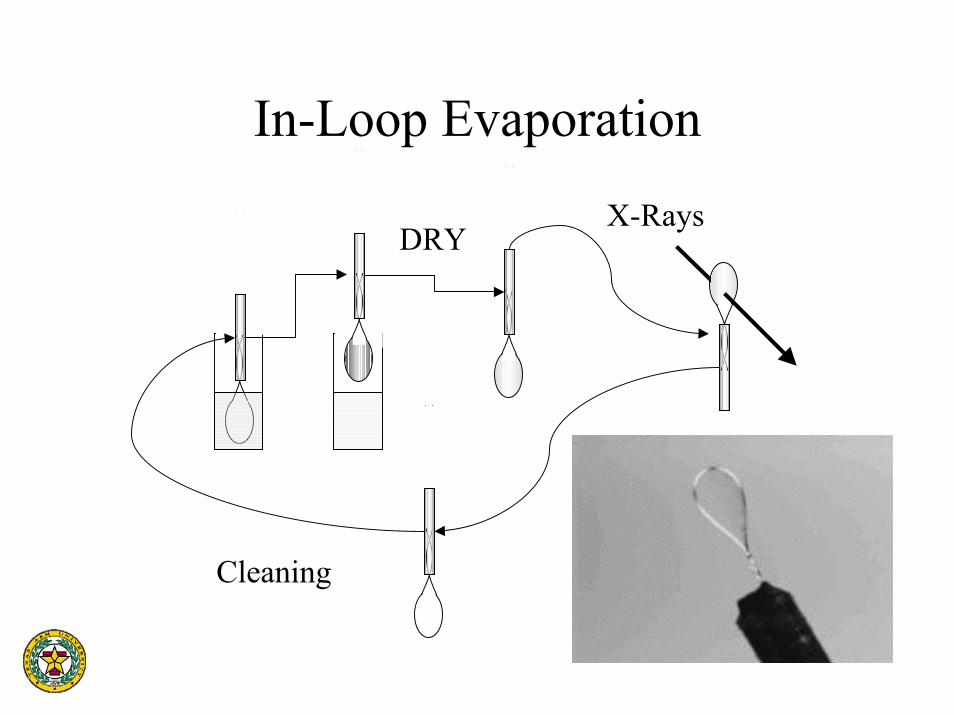
X-Rays
In-Loop Evaporation
DRY
Cleaning
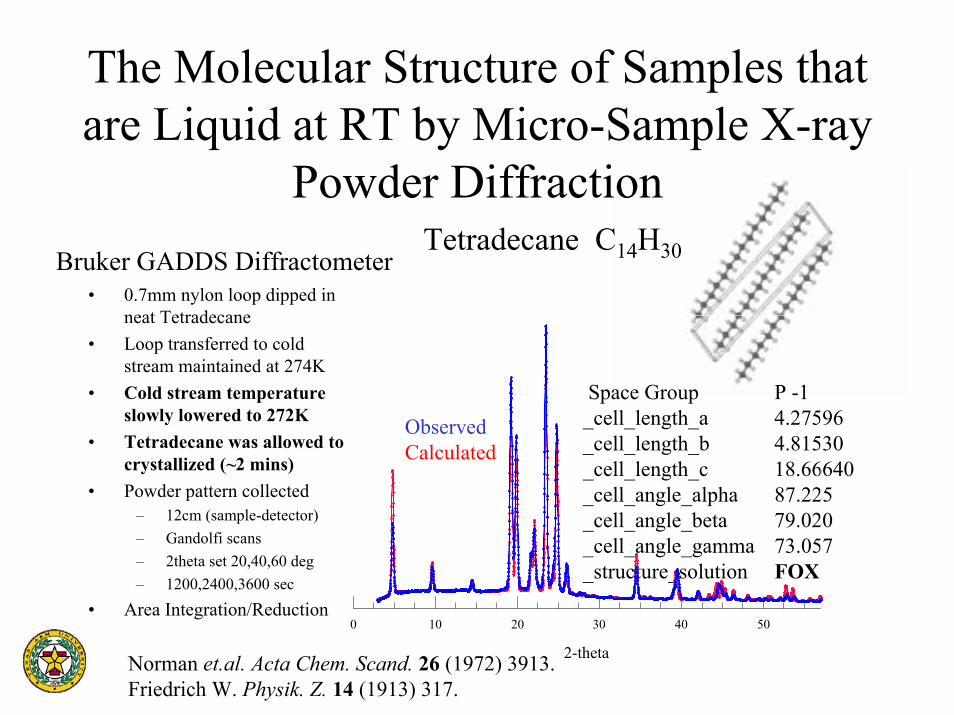
The Molecular Structure of Samples that are Liquid at RT by Micro-Sample X-ray
Powder Diffraction
• 0.7mm nylon loop dipped in neat Tetradecane
• Loop transferred to cold stream maintained at 274K
• Cold stream temperature slowly lowered to 272K
• Tetradecane was allowed to crystallized (~2 mins)
• Powder pattern collected– 12cm (sample-detector)– Gandolfi scans– 2theta set 20,40,60 deg– 1200,2400,3600 sec
• Area Integration/Reduction
Tetradecane C14H30
Space Group P -1_cell_length_a 4.27596 _cell_length_b 4.81530 _cell_length_c 18.66640 _cell_angle_alpha 87.225 _cell_angle_beta 79.020 _cell_angle_gamma 73.057 _structure_solution FOX
Norman et.al. Acta Chem. Scand. 26 (1972) 3913.Friedrich W. Physik. Z. 14 (1913) 317.
0 10 20 30 40 50
2-theta
ObservedCalculated
Bruker GADDS Diffractometer

The Future?

Source Detect. Optic. FWHM--------------------------------------Tube MWPC graph. 0.36o
RAG IP osmic 0.35o
Tube MWPC CCGmir. 0.14o
Sync. IP good 0.04o
3-bromophenyboronic acid
Area Detector/ Source/ Optics Resolution
SAXS
Long collimator
Focus at crystal
17 cm collimator

2-Theta - Scale24 30 40 50 60 70 80 90 100
Single Crystal/Powder Diffractometer
D8 Discover with GADDS*
TXS source with Cu anode operated at 45kV / 100mA
Cross-coupled Goebel Mirror
0.5mm pinhole collimator
VÅNTEC-2000 detector
36cm sample to detector distance
0.3mm glass capillary
600 sec scan
*Kurt Erlacher, BRUKER-AXS

The Future Micro-Sample Diffractometer
• Parallel optics – mirrors double/single bounce– Pin-hole collimation / Helium sealed/vacuum
• Full positioning goniometer – Kappa or three-circle
• High Resolution Low Background Detector– Long Exposures
• Movable Detector Base – Close for small molecule single-crystal– Distance for powders
• Low Temperature

Acknowledgement
• Texas A & M University• Welch• NSF/MRI
Chemistry
Funding