yellowstone river cumulative effects...
TRANSCRIPT
Yellowstone River Cumulative Effects Assessment December 2015
23 Executive Summary
EXECUTIVE SUMMARY
This report presents the results of the Cumulative Effects Analysis (CEA) conducted for the Yellowstone
River Corridor Study. The corridor study was led jointly by the Yellowstone River Conservation District
Council and the U.S. Army Corps of Engineers, with participation from multiple federal, state and local
agencies as well as several non-profit organizations and private businesses. It has been undertaken as a
result of public attention and concerns about the combined effects of damaging flood events (1996 and
1997) and increased development pressures along the Yellowstone River Corridor. The study focuses on
the 12 counties along the mainstem river corridor from Yellowstone National Park to the confluence with
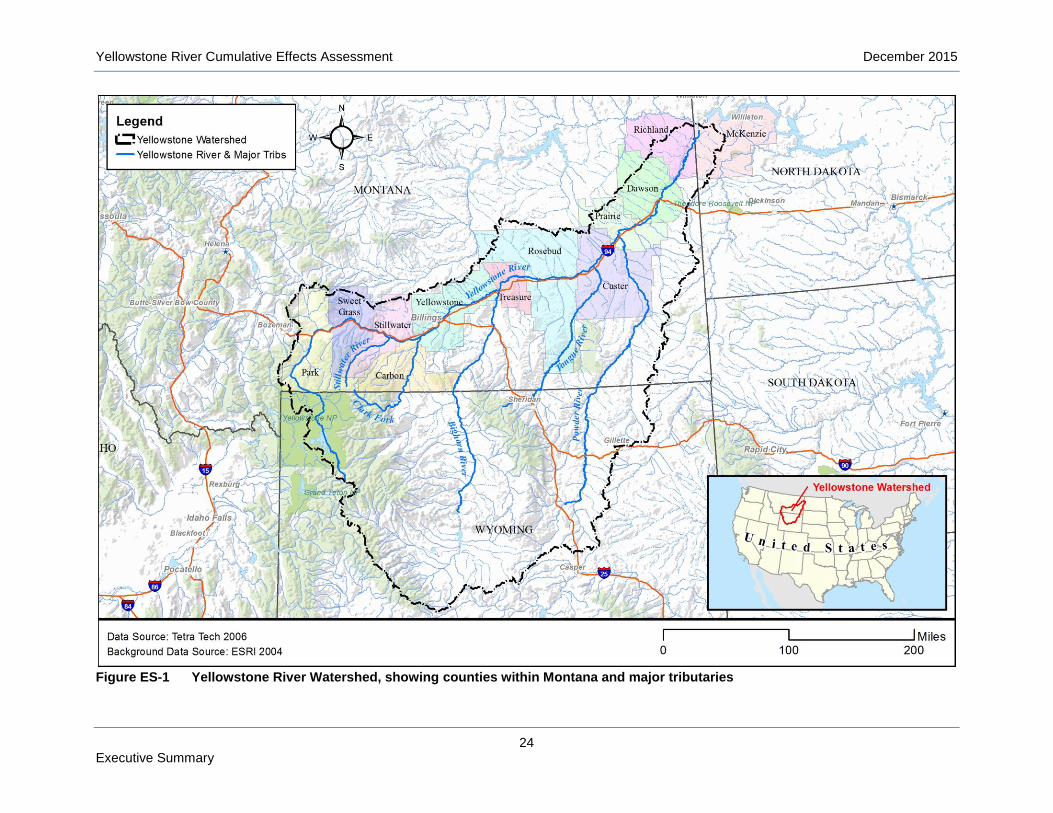
the Missouri River in North Dakota (see Figure ES-1).
“Cumulative effects” refers to the sum of incremental effects from a variety of human activities that
collectively alter an ecosystem. While the effects from a single activity may be small, a combination of
similar activities and their associated effects can significantly degrade natural resources, particularly over
a period of time. On the Yellowstone River, the cumulative result of 150 years of settlement and economic
expansion has changed many aspects of the river and its floodplain.
The cumulative hydraulic, biological, and socioeconomic impacts of human activity on the Yellowstone
River have been evaluated using data collected during the course of this study as well as from other
sources. The analysis includes an interdisciplinary scientific characterization of relationships between
human activities and the resulting river system response. This cause and effect analysis has been
completed for a series of individual river elements and is based on current knowledge regarding human
influences and river response trends. The analysis provides a basis for recommended management
practices that are intended to reverse or slow further degradation of the river’s ecosystem while
supporting traditional land uses and economic livelihoods. The set of Yellowstone River Recommended
Practices (YRRPs) have been developed to help residents along the river corridor maintain both the
economy of the region and the long-term biological and physical integrity of the Yellowstone River.
Citations and academic references are provided within the CEA chapters.
Background
The Yellowstone River watershed consists of about 71,000 square miles of land in Wyoming, Montana,
and North Dakota (Figure ES-1). The watershed is strikingly asymmetric, with the vast majority of the
watershed area on the south side of the Yellowstone River. Its main tributaries, all of which enter the river
from the south, include the Boulder, Stillwater, Clarks Fork Yellowstone, Bighorn, Powder, and Tongue
Rivers. The subwatersheds of the Yellowstone basin range from the volcanic plateau of Yellowstone
National Park to the granitic Wind River Range of west-central Wyoming and badlands areas of eastern
Montana and Wyoming. The watershed fully encompasses several major mountain ranges such as the
Absaroka Range, Beartooth Mountains, Bighorn Mountains, and Pryor Mountains.
As a national resource, the Yellowstone River itself is without parallel. The river originates in the nation’s
first national park, and it is commonly referred to as the longest free-flowing river in the lower 48 United
States, as there are no major dams or reservoirs on the mainstem. It is nestled within the largest relatively
intact temperate zone ecosystem on the planet, the Greater Yellowstone.
Yellowstone River Cumulative Effects Assessment December 2015
24 Executive Summary
Figure ES-1 Yellowstone River Watershed, showing counties within Montana and major tributaries

Yellowstone River Cumulative Effects Assessment December 2015
25 Executive Summary
Between Gardiner, Montana and the Yellowstone River/Missouri River confluence in North Dakota, the
physiography of the Yellowstone River and its tributaries transitions from steep, confined mountainous
areas to plains conditions. This physiographic transition correlates to a shift in the natural hydrology of the
system as it changes from a predominantly snowmelt-driven hydrology in the upper reaches to a
combined mountain snowmelt/prairie runoff hydrology further downstream. The river also transitions from
a coldwater salmonid-dominated fishery in the upper reaches to a warmwater fishery in the lower
reaches. The watershed supports over 200 plant and animal species of conservation concern.
The Yellowstone River Corridor is culturally and historically significant, having a long history of Native
American occupation followed by distinct periods of fur trapping, steamboat navigation, railroad
development, and agricultural expansion. The Crow tribe originally called the river Ikchiilkaashaashe, or
“Elk River”. Later, French fur trappers named the river La Roche Jaune, or “Yellow Rock”. The name
“Yellowstone River” stems from the Minnataree Indians (a branch of the Siouan Hidatsas), who called the
river Mi tse a-da-zi, or Yellow Rock River. In 1805, when the Lewis and Clark expedition came into
contact with the Minnataree, they adopted the name Yellowstone River. Historians differ on the
geographic source of the term “yellow stone”, but based on the range of the Minnataree, it is generally
accepted that the name stems from the sandstone cliffs that closely follow much of the lower river rather
than the yellow thermally-altered rock formations in what is now Yellowstone National Park.
While the Yellowstone River remains geomorphically and biologically diverse, cumulative human
influences over the past 150 years have resulted in a less dynamic and less complex river relative to
historic conditions. The nature and magnitude of the river’s responses to human influences vary
substantially by location. In the upper river, bank armoring is a prominent driver of change, whereas the
lower river is most significantly impacted by shifts in flow patterns primarily caused by tributary reservoirs.
Physical constraints imposed by levees, dikes, roads, and railroads extend throughout the system. The
influences of urban/exurban development are localized within the few major communities along the river.
Other impacts such as climatic trends may also be altering the entirety of the river system, although these
impacts and responses are difficult to assess.
Study Area
The primary study area extends along the mainstem of the Yellowstone River from Gardiner, Montana, at
the northern boundary of Yellowstone National Park, to its confluence with the Missouri River in McKenzie
County, North Dakota, a distance of 565 river miles (as measured in 2001). The analysis focuses on the
river and its approximately 200,000 acre floodplain. The study area is almost entirely within the state of
Montana, with the lowermost 15 miles in western North Dakota. Although the study focuses on the river
and its floodplain, several of the analyses such as hydrology and water quality extend across the entire
watershed due to their collective influence on the mainstem.
Although the primary Yellowstone River study area extends from Gardiner, Montana to the mouth, there
are several data gaps in Park County. Cumulative effects in Park County, which is located in the
upstream-most portion of the river corridor, were addressed in previous work by the Governor’s Task
Force between 1997 and 2003 in response to flood events in 1996 and 1997. As a result, data collected
for this CEA were not necessarily collected for that area. Some datasets that were available from the
Governor’s Task Force effort were used in this analysis, including physical features mapping and digitized
banklines. Other Park County datasets collected as part of this effort include hydrologic analyses, land
use mapping, channel migration rate measurements, and Channel Migration Zone mapping. The datasets
that are most notably missing are hydraulic analyses of floodplain connectivity, floodplain turnover rate
measurements and riparian mapping.
Yellowstone River Cumulative Effects Assessment December 2015
26 Executive Summary
The general starting point for the Cumulative Effects Analysis is 1950. Most of the analysis of change
through time begins at that point, which marks the earliest comprehensive set of aerial imagery for the
river corridor. Where possible, changes that occurred in the river system prior to 1950 are discussed and
quantified.
Primary Yellowstone River System Human Influenced Changes
The following section summarizes the primary human influences and changes that have been evaluated
and integrated to assess cumulative effects. These include hydrologic changes, geomorphic changes,
shifts in riparian conditions, and additional human influences on water quality, wildlife habitat (avian),
invasive species, and fisheries.
Altered Hydrology
The alteration of the natural hydrology of the Yellowstone River system has had a large effect on the
Yellowstone River and its floodplain. Most notably, reservoirs in the Bighorn River watershed, a major
tributary watershed to the Yellowstone River, have exerted a major influence on the hydrology of the
lower Yellowstone. Additionally, irrigation-related water use on the Yellowstone River mainstem and other
tributaries (primarily the Clarks Fork) has also contributed to changes in flows on the river. The primary
findings from the analysis of Yellowstone River hydrology indicates the following:
Gardiner to the mouth of the Clarks Fork River: Primary hydrologic changes are related to irrigation,
which shows an increasing influence of irrigation withdrawals in the downstream direction. At Gardiner,
very little influence is observed, although some research indicates that climatic shifts have resulted in a
25 percent reduction in mean August flows since 1950, and that this reduction is demonstrably linked to
climatic variables. At Livingston, the effects of irrigation on the overall flow regime are imperceptible, but
by the mouth of the Clarks Fork, the results indicate an approximate 23 percent reduction in the summer
low flows (the 7Q10, which is the lowest 7-day flow expected to occur every 10 years during summer
months). This may in part relate to the climatic shifts described above. The 2-year flood, which has a
strong influence on channel development, has dropped by 1,600 cfs or 5 percent with human
development by the Clarks Fork. Larger floods are minimally affected.
Mouth of Clarks Fork River (Laurel) to the mouth of the Bighorn River (Bighorn): From the Clarks
Fork to the Bighorn River confluence (Laurel to Bighorn), the influences of irrigation on Yellowstone River
hydrology become more pronounced, indicating a measureable effect from irrigation in the Clarks Fork
basin. Just below the mouth of the Clarks Fork River, the changes in flow statistics due to human
influences include a 3,900 cfs or 7 percent drop in the 5-year flood flow, and a 4,200 cfs or 10 percent
drop in the 2-year flood flow. At the Billings gage, summer baseflows are estimated to have dropped by
1,620 cfs or about 40 percent.
Mouth of Bighorn River to Missouri River confluence: The most pronounced hydrologic changes on
the Yellowstone River have occurred below the mouth of the Bighorn River. The Bighorn Basin has seen
major changes in water delivery to the Yellowstone River due primarily to the impacts of multiple
reservoirs. The largest, most-downstream impact on the Bighorn River is Yellowtail Dam and Bighorn
Reservoir, located about 96 valley miles upstream of the Yellowstone River confluence at Bighorn.
Immediately below the mouth of the Bighorn River, the 100-year flood magnitude on the Yellowstone
River has dropped by 19,100 cfs or 16 percent. The 10-year flood has been reduced by 16,200 cfs or 19
percent, and the 2-year flood has dropped by 13,700 cfs or 23 percent. Downstream, these major
reductions in flood magnitudes have reduced the lateral extent of flooding, frequency and duration of side
channel inundation, and overall channel size.

Yellowstone River Cumulative Effects Assessment December 2015
27 Executive Summary
Water management in the Bighorn River Basin has also contributed to the reduction in summer flows on
the Yellowstone. At the Forsyth gage, for example, about half of the reduction in mean August flows can
be attributed to Bighorn River flow alterations; the rest is attributable largely to irrigation.
Flow alterations on the Bighorn River have also affected fall and winter flows on the Yellowstone. Fall and
winter low flows have increased by about 60 percent mainly due to flow release patterns at Yellowtail
Dam.
Bank Armoring
Bank armoring is a common practice on the Yellowstone River because bank erosion rates locally exceed
tens of feet per year, threatening valuable lands and infrastructure. As bank armoring has a cumulative
impact on river process, it is a major component of the cumulative effects analysis. As of 2011, there were
approximately 136 miles of bank armor on the Yellowstone River below Gardiner, including rock riprap,
flow deflectors, concrete riprap, car bodies, and minor extents of other techniques such as gabions and
steel retaining walls. Rock riprap constitutes about 75 percent of the total armor.
When summarized by county, mapped physical features data indicate that Yellowstone and Park
Counties host the greatest extent of bank armor on the Yellowstone River; collectively these two counties
contain almost one half of all of the mapped bank protection. When normalized to channel length,
however, the density of armor in these two counties is only moderately higher than other counties in the
upper river. The most intensive bank armoring is over the 320 river miles between the Paradise Valley
(upstream of Livingston) and Miles City. Over this river length, there are about 120 miles of armored bank,
which amounts to 18 percent of the river bank being armored. Below Miles City, about 4 percent of the
total bankline is armored.
The main land uses that are protected by bank armor are agriculture and the active rail line, which
collectively account for 73 percent of the total armor. The third most common use of bank armor is in
urban/exurban areas. In river reaches that include Livingston, Columbus, and Billings, for example, about
30 percent of the total river bankline is armored, and locally, armoring density can be much higher.
Between 2001 and 2011, about 13 miles of armor were constructed on the river, reflecting a 10 percent
expansion of total armor length during that decade. The most rapid rate of armor expansion occurred
between the Paradise Valley and Billings. In contrast to new armor being constructed during that time,
existing bank armor failed in numerous places. At least four miles of bank protection failed during that
decade, and much of that failure reportedly occurred during the 2011 flood. Failure typically consisted of
armor flanking and accelerated erosion behind the flanked armor, such that the armor remnants are often
left sitting out in the river. Almost all of the failed armor were flow deflectors and concrete rubble around
Billings and downstream from Forsyth.
Floodplain Isolation
Floodplains are those areas adjacent to rivers that are prone to periodic flooding. Floodplains can be
considered in terms of their typical expected probability and magnitude of flooding in any given year. For
example, the 100-year floodplain, which has a 1% chance of being flooded in any given year, has a much
higher flow and the associated floodplain is much larger than a 5-year floodplain, which has a 20%
chance of being inundated in any given year. One aspect of the CEA is the evaluation of the loss of
connectivity between the Yellowstone River and its historic floodplain. The 100-year floodplain, although
rarely flooded, provides important functions with regard to flood storage and soils development, and the
5-year floodplain, reflects near channel areas that support more typical riparian habitats such as
cottonwood forest. The isolation of each of these respective floodplain areas has been quantified for the
CEA. Floodplain isolation was determined via modeling of undeveloped flow conditions on an

Yellowstone River Cumulative Effects Assessment December 2015
28 Executive Summary
undeveloped floodplain, and comparing those results to the modern, developed flow condition and
developed floodplain.
Results of the CEA indicate that between the Park/Sweet Grass County line (Springdale) and the mouth
of the Yellowstone River, over 21,000 acres of the historic 100-year floodplain has become isolated due
to physical encroachments, land grading, and hydrologic alterations. The primary cause of floodplain
isolation is the reduction in peak flows described above. Reductions in the 100-year flood magnitude
below the mouth of the Bighorn River have resulted in the isolation of over 8,000 acres of the 100-year
floodplain. The other primary causes are agricultural infrastructure and the active railroad line, which have
isolated 3,720 and 3,526 acres, respectively.
The individual causes of floodplain isolation are generally concentrated in certain portions of the river
corridor. For example, transportation-related isolation is almost entirely occurring in the vicinity of Billings.
Agricultural-related isolation is most common near Hysham and upstream of Miles City. Loss of floodplain
due to the reduction in high flows is most pronounced where the river floodplain is especially broad,
including the Mission and Hammond Valleys between Hysham and Forsyth and from Sidney to the
Missouri River confluence. Urban levees contribute to minor additional isolation of the floodplain, primarily
at Forsyth, Miles City, and Glendive.
The changes in flow conditions and construction of floodplain features have also resulted in the isolation
of more frequently inundated, geomorphically important floodplain areas. In total, almost 30,000 acres or
23 percent of the historic 5-year floodplain area has become isolated on the Yellowstone River below
Springdale. The majority of floodplain isolation is due to flow alterations on the Bighorn River. Whereas
about 9 percent of the 5-year floodplain upstream of the Bighorn River confluence is isolated, almost 30
percent is isolated below the confluence. Mapped inundation for the 2-year floodplain shows similar
results, and the consequences include both less floodplain coverage and reduced flows in side channels.
Although modeling results were not available for Park County, long extents of floodplain dikes and levees
indicate that floodplain isolation has been extensive in that area as well, which includes the Paradise
Valley and the city of Livingston.
Side Channel Isolation
Side channels on the Yellowstone are fairly ubiquitous, forming long channels around forested islands
that can be several miles long. These channels flow year-round, and are very diverse in terms of their
size, length, and proximity to the main river channel. Side channels on the Yellowstone River have been
recognized as important fish habitat throughout the river system, such that the intentional diking and
isolation of these channels may have a significant impact on river ecology.
Results of the CEA indicate that in 1950, there were 508 miles of active side channels on the Yellowstone
River. By 2001, that length had been reduced to about 463 miles, reflecting a net loss of approximately 45
miles during those 51 years. Although side channel lengths naturally fluctuate with time, physical features
mapping indicates that from 1950 to 2001, about 47 miles of side channels were blocked by constructed
dikes. Further analysis showed that prior to 1950, another 42 miles had already been blocked. This
indicates a total loss of about 89 miles of side channels due to intentional blockages, most of which are
very small features built to improve access to agricultural ground.
Development in the Channel Migration Zone
The Channel Migration Zone (CMZ) is the river corridor footprint that, based on historic rates of channel
movement, would accommodate 100-years of natural channel migration. Development within the CMZ is
therefore a likely driver of channel and floodplain manipulation. The entire CMZ footprint on the
Yellowstone River Cumulative Effects Assessment December 2015
29 Executive Summary
Yellowstone River is about 64,000 acres. About 24,000 acres or 38 percent of that area has been
developed for either urban/exurban, transportation or irrigated agricultural land uses. The majority of the
development within the CMZ has been to support irrigation, with approximately 20,400 acres or 32
percent of the CMZ in an irrigated land use category.
Riparian Conversions
Cottonwood forests are a dominant characteristic of the Yellowstone River corridor. Riparian
environments along the river include these forests as well as riparian shrubs and non-woody riparian
environments such as grassy meadows. These areas are a key component of all terrestrial habitat in the
river environment, and the alteration of these habitats is a fundamental component of the CEA.
The extent, successional stage, and locations of riparian vegetation in the Yellowstone River corridor
have changed from 1950 to 2011. It is important to note that the 1950 baseline does not represent
pristine conditions. Historic accounts indicate that much of the extensive cottonwood forest reported by
early day explorers along the Yellowstone River no longer exists, having been harvested or cleared and
converted to other land uses prior to 1950.
Although the total corridor-wide extent of riparian vegetation has remained relatively consistent since
1950, there have been substantial local shifts in the patterns and extents of that vegetation. Over 6,800
acres of woody riparian vegetation that was present in the 1050s was converted to another land use by
2001. Most of this conversion was to irrigated agriculture. Riparian clearing in cities and towns accounts
for over 1,100 acres of riparian conversion, and the Billings area accounts for 54 percent of that total
change.
Below the mouth of the Bighorn River, the loss in riparian cover between 1950 and 2011 (6,858 acres)
was offset by the encroachment of riparian vegetation into abandoned or blocked side channels.
Floodplain isolation has resulted in the separation of about 20,000 acres of riparian vegetation from active
flooding during a 100-year event, and about 20 percent of that acreage is cottonwood forest. Most
floodplain isolation is related to agricultural land uses (56 percent of total) or to railroad embankments (33
percent of total).
Wetlands
Riverine wetlands are those wetland areas directly associated with a river channel (in the river
environment and flooded permanently to semi-permanently), whereas palustrine wetlands include both
natural and created marshes, swamps, ponds, and bogs. There is no comprehensive historic wetland
mapping for the corridor, so quantifying amounts of wetland area change for the study is not possible.
However, wetlands have been mapped under the National Wetland Inventory (NWI) program, and their
results have been summarized for the area. NWI mapped wetlands total about 15,000 acres in the
corridor, with the highest wetland densities in the upper portions of the river, above Laurel (up to 140
acres per valley mile). The vast majority of wetlands are palustrine emergent wetlands, with only about 10
percent of the mapped wetlands being classified as riverine. One study that evaluated historic trends in
two reaches on the Yellowstone estimated that between 1950 and 2001, there was an average loss of 8
percent of total wetland area. It was noted that the construction of artificial freshwater ponds over the last
60 years masks the actual extent of wetland losses.
Invasive Plant Species
Invasive plant species have been introduced to the river corridor both deliberately (pasture grasses and
ornamental shrubs) and unintentionally via birds and wildlife or seed drift from other areas. Of most
concern for the Yellowstone River corridor are Russian olive and saltcedar. Both Russian olive and
Yellowstone River Cumulative Effects Assessment December 2015
30 Executive Summary
saltcedar have substantial effects on native riparian plant communities and can cause geomorphic
changes to the river through their dense growth on banks, bars, and islands.
Russian olive occupies about 4,600 acres of the 100-year floodplain. Its mapped extent expands in a
downstream direction, with an abrupt increase near the mouth of the Clarks Fork River. Russian olive
infestations appear to be especially aggressive in abandoned channels and on islands. About half of the
total mapped Russian olive in the Yellowstone River corridor is located between the mouths of the
Bighorn and Powder Rivers, where the broad floodplain and extensive abandoned channels provide ideal
sites for invasive species. In this region, over 10 percent of the 1950s island areas and river channel has
become colonized by Russian olive. No basin-wide systemic mapping has been completed for saltcedar,
however it is recognized as a major concern, equal to or exceeding that of Russian olive.
Other invasive plant species listed as noxious weeds by the State of Montana occur in the study area,
including spotted knapweed, Russian knapweed, leafy spurge, hounds tongue, and Canada thistle. These
species are rapidly degrading native riparian communities and infesting riparian pastures. Common
buckthorn is an example of a new invasive that is causing concern, but is not listed as noxious at this
time.
Water Quality
The water quality parameters described in this report include hydrogen ion concentrations, dissolved
oxygen, total dissolved solids, nutrients, trace elements, pesticides, hydrocarbons, water temperature,
and suspended sediment. Biological data are discussed with respect to benthic algae, filamentous algae,
macroinvertebrates and fish. Results indicate that the Yellowstone River is generally considered alkaline
with a pH ranging from 7.4 to 8.6, and pH values generally increase in a downstream direction. Dissolved
Oxygen (DO), which is a measure of how much oxygen gas is dissolved in water, is typically measured at
concentrations of around 8 to 10 mg/l. There have been several instances of low DO below Billings, which
may relate to moderate levels of eutrophication.
Tributaries are a major source of the Yellowstone River nutrient load, although total nitrogen and
phosphorous values during the growing season are generally within the numeric standards proposed by
the Montana Department of Environmental Quality (MDEQ). Even so, nutrient enrichment has been
identified on the river, and nuisance growth of filamentous algae occurs in segments of the Bighorn and
Clarks Fork rivers.
Results of nutrient delivery modeling indicate that the estimated delivered aggregated yield of total
nitrogen to the Gulf of Mexico from the Yellowstone River is about 12 kg/ km2/yr compared to other
Mississippi River tributaries that contribute up to an estimated 1,318 kg/ km2/yr. The model predicts that
the largest source of total nitrogen delivered aggregated yield in the Yellowstone River basin is the
Shoshone River basin in Wyoming followed by the Upper Yellowstone area. Farm fertilizers constitute an
estimated 41 percent of the delivered nitrogen.
Water temperature data is very limited on the Yellowstone River, however during several warm summers,
low flow conditions prompted fishing restrictions in the upper Yellowstone River due to elevated water
temperatures. There have also been anecdotal reports of water temperature-related fish kills and
movements of warmwater species further upstream.
Measurements of benthic algae in 2000 indicated the highest algal biomass occurs in the middle
segments of the Yellowstone River near Billings and Forsyth. Values were also high in the Clarks Fork
and Bighorn River. Filamentous algae showed a similar pattern.

Yellowstone River Cumulative Effects Assessment December 2015
31 Executive Summary
Physical and Biological River System Responses to Human Influences
One of the objectives of the CEA is to identify cause and effect relationships associated with human
influences in the Yellowstone River Corridor. . The evaluation of cumulative effects on a natural system is
challenging due to the inherent complexity of interrelated cause and effect relationships. Because of the
vast project area and the myriad of activities on the river, only those influences that have been identified
as having a major effect have been evaluated in detail. These influences include hydrologic changes,
land use changes, and construction of physical features on streambanks and in floodplain areas. The
physical and biological responses to these influences include channel adjustments to altered flows,
altered rates of channel movement due to bank armor, isolated side channel habitat, isolated floodplain
area, and direct habitat alterations due to land development in the river corridor. Each of these responses
then has secondary responses that can be considered in terms of water quality, avian habitat, fisheries
habitat, and a range of other components of the river system. The following sections describe the physical
and biological responses of the river system to the major human activities described above.
Physical Responses to Human Influences
The overall form and rates of change on the Yellowstone River have been affected by many of the human
influences described above. The effects can be seen in channel dimensions, channel migration rates,
floodplain turnover rates, rates of sediment and wood inputs to the river, and the extent and nature of
gravel bars.
The most prominent geomorphic response to flow alterations on the Bighorn River is the reduction in the
size of the river downstream of the mouth of the Bighorn. From there to the confluence with the Missouri
River, the bankfull channel area of the Yellowstone dropped by over 4,000 acres between 1950 and
2001, which is a reduction of 11 percent. Reduced channel-forming flows (those flows most responsible
for determining channel dimensions) as well as the loss of side channels due to blockages have likely
contributed to this reduction in overall channel size. The reduction in size of the active channel footprint
has provided conditions for riparian vegetation encroachment at the expense of in-channel habitat.
Flow and sediment supply alterations on the Bighorn River have resulted in major shifts in gravel bar
features on the lower Yellowstone River. Since 1950, the total extent of mid-channel bars has dropped by
about 1,100 acres or 43 percent. This has been accompanied by a loss of about 40.2 miles of secondary
channels (channels that flow around open gravel bars at low flow). Most of the loss in secondary channel
length occurred between Hysham and Forsyth and below Glendive. There has been a net gain of bank-
attached bars, indicating a conversion of gravel bars in the middle of the river to gravel bars that are
adjacent to the riverbank at low flow.
The combined effects of flow alterations and bank armor have resulted in a reduction in floodplain
turnover rates on the river. Turnover rates reflect the average annual exchange between the river and
floodplain within a given channel segment. This exchange (erosion and deposition) is a critical aspect of
riparian habitat formation and succession. Since the mid-1970s, between the Park/Sweet Grass county
line and the Missouri River confluence (Park County data were not available), the mean annual rate of
total floodplain erosion dropped from 435 acres per year to 331 acres per year, which is a reduction of 27
percent. Mean annual channel migration rates have dropped by over 20 percent in most reaches. One
consequence of lower floodplain turnover rates is reduced recruitment of large woody debris; the post-
1976 data show a reduction in the recruitment of closed timber area (area with over 25% overhead
canopy) by about 50 acres per year.
Land use changes on streambanks have also affected channel migration rates and floodplain turnover.
Over a 25-year period, the river eroded into hay land and irrigated cropland an average of 40 to 50 feet
Yellowstone River Cumulative Effects Assessment December 2015
32 Executive Summary
further than through multiple-use ground which includes riparian forest. Every region shows this
fundamental trend of increased rates of migration through hay/pasture land and ground irrigated by
sprinkler or flood.
Flooding has also affected the geomorphology of the river. For example, upstream of the Bighorn River
confluence, the river has largely maintained its overall size since 1950, with the exception of an abrupt
expansion between 1995 and 2001 (likely a response to the 1996 and 1997 floods). Between the
Park/Sweet Grass County line and the mouth of the Clarks Fork River near Laurel, the bankfull channel
area increased by almost 1,700 acres or 10 percent between 1995 and 2001 suggesting an influence of
major upper river flooding in 1996 and 1997 on channel size.
Riparian Responses to Human Influences
Downstream of the Bighorn River confluence, the reduction in peak flows has caused the active channel
footprint of the Yellowstone River to shrink, and this change has been accompanied by the expansion of
riparian vegetation into the old channel areas. This has resulted in a net increase of riparian vegetation in
the active channel area on the lower river. This riparian expansion has been balanced by losses due to
floodplain clearing, resulting in no net change in overall riparian extent.
The observed riparian expansion in response to altered flows essentially reflects a singular response to
those flow alterations rather than any long-term trend. Below the Powder River confluence, individual
reaches gained an average of about 30 acres of forest since 1950. Most of that can be attributed to gains
in closed timber cottonwood forest, with substantial losses of shrub coverage. This indicates that the
forest extent has increased in the short-term, providing more extensive, later successional cottonwood
forest habitat since 1950 due to the maturation of younger age stands. However, the loss of shrub and
young cottonwood acreage indicates a decline in regeneration that could result in a long-term loss of
forest within these reaches that have historically provided the greatest extent of cottonwood forest habitat
in the corridor. In general, below the mouth of the Bighorn River, there has been a transition to older age
classes of cottonwoods, accompanied by a loss in acreage of younger forest. This transition was also
seen in Park County upstream of Springdale.
Riparian turnover rates are an important indicator of riparian succession and long-term health. The
geomorphic analysis indicates that rates of floodplain turnover in the river corridor have been reduced
due to bank armor and flow alterations. Bank armor, by stopping channel movement, reduces the rates of
point bar growth, which in turn reduces area for riparian colonization. Armor also isolates existing riparian
areas from active erosion and potential recruitment into the river. As part of the Channel Migration Zone
(CMZ) mapping, areas that would normally be in the active migration zone of the river but have become
isolated due to bank armoring or dikes were mapped as Restricted Migration Areas. An analysis of the
cover types in these areas indicates that about 11,200 acres or 7 percent of the riparian area has been
isolated from the active river corridor due to physical features. Most of the isolation (>70 percent) is due to
rock riprap and flow deflectors, with lesser amounts due to dikes and road/railroad prisms.
Russian olive has colonized near-channel areas, abandoned side channels, ditches, canals, surface
drains, abandoned agricultural fields, and general riparian areas. There are some implications that
Russian olive and saltcedar can cause channel narrowing and further restrict channel migration, however
it is unclear how active these processes are on the Yellowstone River.
Avian Response to Human Influences
Many avian species observed along the Yellowstone River are dependent upon large expanses of
cottonwood forest. The reaches with the most extensive forest habitat occur largely in the lower river
below the mouth of the Bighorn River. Many of these reaches gained forest acreage since 1950, but also

Yellowstone River Cumulative Effects Assessment December 2015
33 Executive Summary
experienced a loss in shrub acreage (young forest) during that time period (there was a 41 percent
decline below the Powder River), suggesting reduced regeneration of cottonwood forest, and a potential
future long-term loss of forest habitat.
Many avian species observed along the Yellowstone River are dependent upon riparian grassland. Since
1950, more acres of herbaceous land (approximately 10,000 acres within the floodplain) have been
converted to higher intensity agriculture than any other riparian habitat type.
Residential and agricultural development provides foraging habitat for Brown-headed Cowbirds, which lay
their eggs in the nests of other bird species, causing negative impacts to bird populations in riparian forest
habitats. In 80 percent of the study area reaches, more than one half of the existing cottonwood forest is
potentially affected by cowbird parasitism. Most of the cottonwood habitat with low risk of parasitism in
2001 was located below the Bighorn River confluence, where many bird species that are negatively
impacted by cowbirds also occur. Consequently, this area of the river may currently provide important
habitat for these species, particularly those of conservation concern, such as Ovenbirds and Black-and-
white Warblers.
The loss of mid-channel bars and secondary channels surrounding bars in Regions C and D represent a
decline in the extent of prime nesting and foraging habitat for federally endangered Least Terns.
Fisheries Response to Human Influences
The consequences of physical impacts as well as geomorphic and riparian responses on the Yellowstone
River have the potential to greatly influence the diverse fish communities in the system. However, the
data available for the fisheries study reflect current conditions rather than historic trends. As a result, in a
fashion similar to the avian study, the consequences of human influences on the fishery must be inferred
from a combined understanding of existing conditions, habitat requirements, and habitat preferences for
various fish species.
Results of the CEA indicate that reduced discharge from the Bighorn River and other tributaries has likely
altered the ecological suitability of native fish habitat in these tributaries as well as in the mainstem
Yellowstone River. Altered hydrology has a number of potential effects on the fish community. For
example, floodplain areas are important for the river’s food web and as habitat for fish, and isolation of
those areas can therefore affect the fishery. Reduced side channel availability reduces important fish,
amphibian, and reptile habitats. Altered flow patterns can disrupt cues for fish movements and
reproduction. Diminished channel migration rates reduce Large Woody Debris (LWD) recruitment, which
hinders the creation and maintenance of diverse in-channel habitats. Less bank erosion also reduces
sediment delivery from the banks which may provide important habitat forming materials. The reduction in
summer low flows may increase temperature, as well as the rates of predation, competition and disease
transmission. Increased water temperatures may influence fish distributions. Increased fall and winter
discharges may increase fish energy needs during the cold low-metabolism season, alter ice dynamics
and jamming, and reduce the influence of the low-elevation snowmelt pulse as a fish movement or
spawning cue. Reduced hydrograph rise and fall rates may disrupt or weaken hydrologic spawning cues.
Bank stabilization affects fish communities by increasing floodplain isolation, altering main channel
habitats, and reducing the availability of diverse lateral habitats such as side channels and backwaters.
Altered land use and conversion of floodplain areas to other uses such as irrigated agriculture, urban and
exurban areas may increase pollution, alter urban stream hydrology, and reduce recruitment of LWD,
which in turn may affect the fish community. Altered riparian vegetation and wetlands affect many natural
functions of the river that are important to fish such as dissipating flood energy, trapping sediments,
filtering nutrients and other pollutants, providing fish habitat, and contributing to the biological productivity
Yellowstone River Cumulative Effects Assessment December 2015
34 Executive Summary
of the aquatic ecosystem. Altered water quality on the Yellowstone River is generally moderate and the
potential effects on the fish community are unknown. However, catastrophic events such as oil pipeline
ruptures and associated oil spills have the potential for stronger impacts on the fish community.
Altered longitudinal connectivity on the Yellowstone River is caused by mainstem diversion dams.
Although the degree of fragmentation of fish populations caused by these dams is not fully understood for
all dams and fish species, these dams potentially affect the distribution of some fish species and reduce
the viability of some fish populations. Six large irrigation diversion dams (Huntley, Waco-Custer,
Rancher’s Ditch, Yellowstone Ditch, Cartersville and Intake) have impacted fish passage and habitat
connectivity along the mainstem Yellowstone River. Intake Diversion, which is the downstream-most
structure on the river, is a major passage barrier that is currently the focus of efforts to provide passage
for a range of fish species. The structure currently blocks passage by Pallid Sturgeon, Shovelnose
Sturgeon, and Paddlefish under most flow conditions. Cartersville Diversion Dam appears to be a
complete barrier to passage for Shovelnose Sturgeon.
Altered mainstem to tributary connectivity due to diversions, culverts, and other barriers affects the fish
community because many fish species use both habitats at some point in their life histories. In addition to
creating fish passage barriers, irrigation withdrawals result in the entrainment of fish into ditches and
canals. Although fish screens have been constructed at Intake Dam and at the T&Y dam on the Tongue
River, entrainment is anticipated to remain a considerable cause of fish mortality on the river.
Although introduced species are present, overall the Yellowstone River remains a stronghold of native
fish diversity, with the highest number of native fish in Montana. There are 59 fish species total, of which
22 species (37 percent) are nonnative. In terms of abundance, however, most nonnative fish are rare.
Exceptions are in the coldwater or salmonid zone of the river where introduced Rainbow and Brown Trout
dominate the fishery, and have contributed to the decline of the native Yellowstone Cutthroat Trout.
Although most introduced fish species are relatively rare in the middle and lower river, the effect of
introduced predators such as Smallmouth Bass, Walleye, and Northern Pike has not been studied.
American Bullfrogs are established in the river floodplain near Billings and have the potential to cause
declines in native amphibians and reptiles. There is some concern that the altered hydrologic conditions
on the Yellowstone River may favor these introduced species. Recreational fishing is an important cultural
and economic activity on the Yellowstone River. Sport fish populations are monitored and managed for
sustainability by Montana Fish, Wildlife & Parks.
Cumulative Effects by Region
When considering the cumulative effect of human influences on a large river system, it is critical to
recognize that the ecological responses of the river to a range of physical drivers can overlap, and
complex relationships can develop that intersect the socioeconomic, physical, and biological components
of the system. As a result, it is challenging to assign singular cause and effect relationships to many of
the physical and biological changes that have been documented on the Yellowstone River. The following
section is a general discussion of the changes that have been documented in each region, with some
consideration of cause and effect. A more detailed consideration of both quantified and inferred cause
and effect relationships is described in Chapter 7 of this report.
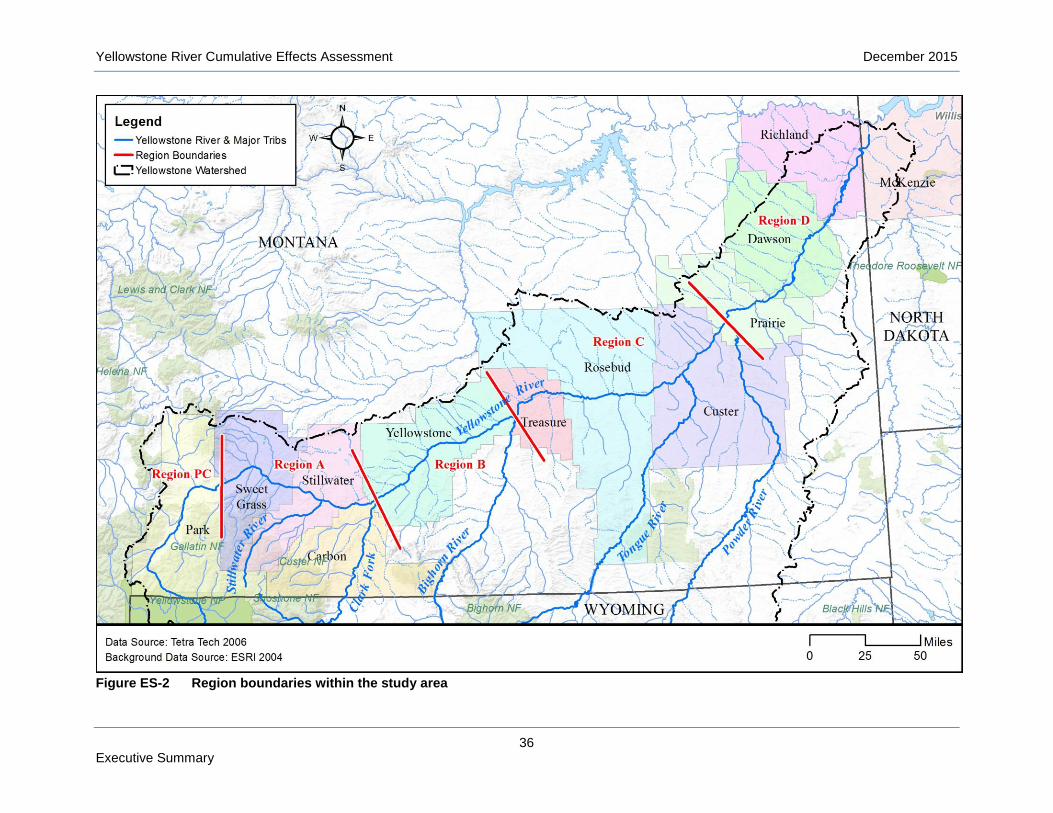
The cumulative effects summary is presented in the following pages by region (Figure ES-2). The
regional breaks are generally located at major tributaries; there are breaks at the Clarks Fork River
(Region A/B boundary), Bighorn River (Regions B/C boundary) and Powder River (C/D boundary).
Region PC in the upper basin was added to the study later, and its break with Region A occurs at the
Park/Sweet Grass county line. The breaks between regions either fall on, or approximate county
Yellowstone River Cumulative Effects Assessment December 2015
35 Executive Summary
boundaries. Regions have been further subdivided into reaches, which are discussed in more detail
throughout the report.
Yellowstone River Cumulative Effects Assessment December 2015
36 Executive Summary
Figure ES-2 Region boundaries within the study area
Yellowstone River Cumulative Effects Assessment December 2015
37 Executive Summary Report Organization
Region PC: Park County
Region PC includes the entirety of Park County at the upper end of the study area, and includes 85 miles
of the Yellowstone River. The population of Park County increased from about 12,000 people in 1950 to
15,636 people in 2011. The largest community in Park County is Livingston, which served as the Northern
Pacific Railroad’s repair and maintenance depot, at one point employing over 1,100 residents. The
railroad has since declined as a major industry in town. More recently, recreation and tourism have begun
to strongly influence the local economy. In 2011, four out of the top 10 industries in the county were
related to recreation and tourism.
The cumulative effects observed in Park County relate primarily to land use changes both before and
after the study baseline of 1950. Prior to 1950, the river corridor had been developed primarily for
agricultural land uses and urban/exurban development in the vicinity of Livingston. Since then, historically
rural areas of Park County have experienced substantial conversion from agricultural lands to
urban/exurban land, much of which is rural residential development.
There has been substantial development within the Yellowstone River Channel Migration Zone (CMZ) in
Park County. In total, about 24 percent of the natural CMZ has been developed, and the majority of that
land is in urban/exurban land uses. Individual reaches in Park County show a relatively high level of CMZ
restrictions by armor and dikes; in several reaches over 25 percent of the natural CMZ has been
restricted.
Development within the CMZ in Park County is an important consideration with regard to cumulative
effects, as it generally is associated with riparian clearing, floodplain isolation, and bank armoring.
Although riparian mapping isn’t available for Park County, the available data do indicate that bank armor
and floodplain dikes are fairly ubiquitous in this region. In 2001, there were a total of 23.1 miles of armor
in the region, and that had expanded to 30.7 miles of armor by 2011. As of 2011, about 18 percent of the
bankline was armored, with the majority of that armor (26 miles) consisting of rock riprap. In several
reaches over 25 percent of the bankline is armored. Between 2001 and 2011, at least 650 feet of rock
riprap and 1,100 feet of flow deflectors were destroyed, primarily by flanking (erosion behind the
revetments).
Extensive levees and dikes protect the community of Livingston, and also protect spring creek fisheries in
the Paradise Valley. As of 2011, there were about 18.7 miles of dikes and levees mapped in the river
corridor. This is the highest concentration of dikes in any region, with 0.22 miles of floodplain dike per
river mile.
In Park County, side channels are probably important natural nursery areas for juvenile salmonids as they
provide shallow, slow current velocity habitat when the main channel does not. Side channels are also
important spawning areas for Yellowstone Cutthroat Trout, and a reduction in side channel habitat may
be a factor in measured declines in cutthroat populations. There are at least nine side channels that have
been blocked in Region PC. A total of 4.7 miles of side channels were blocked by floodplain dikes prior to
1950, and another 4.4 miles have been blocked since.
The hydrologic analyses presented in this report indicate that flood flow alterations due to human
development in Park County have been minimal. The 100-year flood flow has been reduced by less than
1 percent due to human influences, and the 2-year discharge has dropped by about 2 percent in the lower
end of the reach. These alterations are attributed largely to irrigation withdrawals during spring runoff.
Low flows have been impacted more substantially. At the Livingston Gage for example, summer
baseflows have dropped by about 5 percent from 1,760 cfs to 1,680 cfs. These impacts relate to
Yellowstone River Cumulative Effects Analysis U.S. Army Corps of Engineers Omaha District
July 2015 38 Executive Summary
irrigation, consumptive water use, and climate variability. The total estimated water withdrawal in Park
County in 2000 was 356 million gallons per day or almost 400,000 acre-feet per year. The vast majority of
that use is for irrigation. The estimated consumptive use for irrigation is estimated to be about 66,000
acre-feet per year, which is about 362 cfs over a 3-month period. The estimated year 2000 consumptive
use in Park County for public and other domestic water supply was 2.7 million gallons per day, or 3,033
acre-feet per year. There is also evidence that climatic shifts have resulted in a 25 percent reduction in
mean August flows since 1950 at Gardiner.
Region A: Sweet Grass, Stillwater, Carbon Counties
Region A is 95 river miles long and extends from the eastern boundary of Park County at Springdale to
the mouth of the Clarks Fork River, and includes the river corridor extent within Sweet Grass, Stillwater,
and Carbon Counties. These three counties had a combined population of about 23,000 people in 2010.
The economy is diverse, and includes mining, agriculture, and recreation. The economy of these three
counties is currently changing, shifting from a primary focus on extractive natural resource activities,
including mining and agriculture, to more recent expansion of recreation and tourism-based activities.
Similar to Region PC, the primary human influences in Region A are bank armor and to a lesser extent
floodplain dikes, which have been driven by river corridor development. About 37 percent of the natural
CMZ within Region A has been developed, with irrigation as the primary land use in the CMZ (2,919
acres or 32 percent of total CMZ). Since 1950, about 217 acres of riparian area have been cleared and
converted to irrigation. There has also been major conversion of flood irrigated lands to pivot and
sprinkler since 1950, indicating substantial investment in agricultural infrastructure.
These land use changes along with the proximity of the transportation corridor to the river have driven
substantial bank armoring in the region, which is a primary contributor to the cumulative effects of human
development in the region. As of 2011 there were 27.5 miles of bank armor in the region, protecting about
14 percent of the total bankline. Most of that armor (~23 miles) is rock riprap. The lower portions of
Region A show the expanded use of concrete riprap relative to a predominance of rock riprap upstream.
About 13 miles of bank armor is protecting agricultural lands, and another 8 miles protects transportation
infrastructure. In some areas, bank armor has dramatically narrowed the active river corridor to essentially
the active channel width, causing major pinch points in the meander belt. Similarly, the bridge at Reed
Point narrows the corridor to that of the bridge span. Between 2001 and 2011, at least 1,100 feet of rock
riprap, 900 feet of concrete riprap, and 1,500 feet of flow deflectors were destroyed in Region A, primarily
by flanking (erosion around and behind the revetments).
Region A has 2.3 miles of mapped floodplain dikes and levees, which at 0.02 miles of levee per river mile,
is a relatively low concentration for the upper river.
Bank armoring has substantially reduced overall rates of channel movement and floodplain turnover in
Region A, and as a result is a major component of observed cumulative effects. The mean migration
rates measured in Region A dropped from 6.0 feet per year from 1950-1976 to 4.8 feet per year from
1976-2001. The rate of riparian forest erosion and LWD recruitment in Region A dropped by about 4
acres per year from 1950-1976 to 1976-2001.
Side channels have also been blocked in the region, which is another major contributor to the cumulative
effects of human development. A total of 5.6 miles of side channels were blocked by floodplain dikes prior
to 1950, and another 8.2 miles have been blocked since. In 1950, there were a total of 92.6 miles of side
channel in Region A, and by 2001 that had been reduced to 75.3 miles, indicating some passive
abandonment of side channels in addition to the blockages.

Yellowstone River Cumulative Effects Assessment December 2015
39 Executive Summary Report Organization
Between 1950 and 2001, Region A had an increase in total bankfull channel area of 1,210 acres or 17
percent. The majority of that channel expansion (870 acres) occurred between 1995 and 2001, and likely
reflects the influences of the 1996 and1997 floods on channel size. Channel enlargement may also relate
to disproportionate expansion of the main river thread with the loss of side channels.
Approximately 950 acres or 8.6 percent of the 100-year floodplain has become isolated in Region A, and
most of that is due to the transportation corridor, including the active rail line (368 acres) and
highways/roads (421 acres). Within this region, the railroad and frontage road closely follow the edge of
the river corridor, causing most of the floodplain isolation. About 412 acres or 11 percent of the more
frequently inundated 5-year floodplain in Region A has become isolated.
Region A has about 80 acres of cottonwood forest per valley mile, which is a relatively low value
compared to downstream regions. Since 1950 there has been a loss of about 550 acres of forest
considered to be at low risk of cowbird parasitism, which is a consequence of agricultural and
urban/exurban development within and adjacent to riparian areas. This loss has reduced the extent of
forest considered at low risk of cowbird parasitism by 45%. There are a total of 3,140 acres of mapped
wetlands in the region, or a concentration of 36.4 acres of wetland per valley mile, which is the highest
wetland density of any region. Some wetland areas have become isolated from the river by transportation
infrastructure, mainly the active rail line on the south side of the river. There is a major expansion of
Russian olive in the lower portion of Region A relative to upstream reaches.
High flow alterations in Region A have been minimal to moderate, with the changes increasing in the
downstream direction. In the lowermost portions of the region just above the mouth of the Clarks Fork
River, the 100-year flood flow has been reduced by about 2 percent, and the 2-year discharge has
dropped by about 5 percent.
The summer 7Q10, which is the lowest 7-day flow expected to occur every 10 years during summer
months, has been reduced by about 10 percent in the upper portion of Region A near Springdale, and by
almost 30 percent at the lower end near Laurel. These changes are primarily attributable to irrigation and
demonstrate how the influence of irrigation withdrawals on low flow increases in the downstream
direction. The changes also potentially reflect climate variability.
Region B: Yellowstone County
Region B is 86 river miles long, from the mouth of the Clarks Fork River near Laurel to the mouth of the
Bighorn River at Bighorn. It includes the majority of river corridor that lies within Yellowstone County, with
the exception of the community of Laurel, which is just upstream of the mouth of the Clarks Fork River.
Yellowstone County is known by the historical landmark Pompey’s Pillar, as well as its cultural importance
to the Crow Nation. The city of Billings is on the river and is the largest city in the state. Billings serves as
an important economic center for Yellowstone County and the state of Montana. In 2010, over 10 percent
of the total population of Montana was located in Billings. At that time, all of Yellowstone County had a
population of 147,972 people.
The cumulative effects within the majority of Yellowstone County reflect the consequences of extensive
river corridor development. This includes extensive CMZ development, riparian clearing, bank armoring,
side channel blockages, floodplain isolation, and flow alterations. All of these impacts have cumulatively
created a substantially altered river segment relative to historic conditions, with reduced rates of
geomorphic change and highly altered aquatic and riparian habitats.
About 42 percent of the CMZ within Region B has been developed, with irrigation as the primary land use
(3,406 acres or 32 percent of total CMZ). Almost 1,500 acres of land within the CMZ had been developed
Yellowstone River Cumulative Effects Analysis U.S. Army Corps of Engineers Omaha District
July 2015 40 Executive Summary
for urban/exurban and transportation land uses by 2011, which is the largest amount of such CMZ
development in the entire study area. Of that area, 164 acres are in the Historic Migration Zone (HMZ),
which is the area that was occupied by either stream channel or an island since 1950.
Since 1950, about 930 acres of riparian vegetation have been cleared in Region B for other land uses.
This reflects an 8 percent reduction in the total extent of mapped riparian acreage. Most of that cleared
area (618 acres) was converted to urban/exurban development. This clearing was concentrated around
Billings; in one reach, 317 acres or 50 percent of the riparian vegetation was cleared, primarily for urban
development. The development within Region B has substantially affected avian habitat. Since 1950 the
forest extent considered at low risk of cowbird parasitism had dropped by 312 acres or 35%.
Development in the river corridor in Region B has resulted in extensive bank armoring, especially around
Billings. As of 2011 there were 27.5 miles of bank armor in Region B, protecting about 14 percent of the
total bankline. Most of that armor (~23 miles) is rock riprap. Region B also has 9 miles of mapped
floodplain dikes and levees. In the vicinity of Billings, one 15.4 mile long reach has 11 miles of bank
armor.
Between 2001 and 2011, at least 250 feet of rock riprap, 4,600 feet of concrete riprap, and 2,200 feet of
flow deflectors were destroyed in Region B, primarily by flanking (erosion around and behind the
revetments).
Bank armoring has reduced the rates of floodplain erosion and turnover in Region B. The average
migration rates measured in Region B dropped from 11 feet per year from 1950-1976 to eight feet per
year from 1976-2001. Floodplain turnover rates dropped from 113 acres per year from 1950-1976 to 91
acres per year from 1976-2001, a reduction of 22 percent. The rate of riparian forest erosion in Region B
dropped by about 9 acres per year from 1950-1976 to 1976-2001.
Side channels have also been lost in Region B, where a total of 8.9 miles of side channels were blocked
by floodplain dikes prior to 1950, and another 6.6 miles have been blocked since. In 1950, there were a
total of 122 miles of side channel in Region B, and in 2001, there were 108 miles.
Approximately 2,600 acres or 11 percent of the 100-year floodplain have become isolated in Region B,
and most of that is due to the transportation corridor, including the active rail line (1,100 acres) and
highways/roads (1,200 acres). About 3,000 acres or 20 percent of the more frequently inundated 5-year
floodplain in Region B have become isolated.
High flow alterations in Region B have been moderate. In the lowermost portions of the region just above
the mouth of the Bighorn River, the 100-year flood flow has been reduced by about 4 percent, and the 2-
year discharge has dropped by about 11 percent.
The impact of human influences on low flows has been more substantial. At the Billings gage, summer
baseflows have dropped by about 42 percent, from 3,846 cfs to 2,227 cfs. The low flows and warmer
water have exacerbated the effect of nutrient enrichment leading to elevated growth of benthic (attached)
algae.
The Huntley and Waco-Custer diversion dams are located in Region B. Huntley Dam is located at a point
of split flow on the river, and blocks only the main channel. At low flows, however, the unblocked
secondary channels are essentially dry and therefore incapable of passing fish. As part of repairs
required after recent flooding on the river, a fish passage channel was constructed around the north end
of the dam. At Waco-Custer, the Yellowstone River flows through two main channels, and the structure
Yellowstone River Cumulative Effects Assessment December 2015
41 Executive Summary Report Organization
itself blocks only the right channel. The current status of these structures with respect to fish passage is
not clearly known. Sauger have been sampled as far upstream as Billings, which is upstream of both
dams.
Region C: Treasure, Rosebud, and Custer Counties
Region C is 149 river miles long, from the mouth of the Bighorn River to the mouth of the Powder River. It
includes the entirety of Treasure, Rosebud and Custer counties, as well as about seven river miles of
western Prairie County. The area is sparsely populated, with a regional economy highly dependent on
agriculture and energy development. In 2010, Treasure, Rosebud, and Custer counties had a combined
population of 21,650 people. Region C has experienced only minor changes in land use since 1950.
The cumulative effects in Region C are dominated by the combination of flow alterations and agricultural
development on the floodplain. These influences have driven floodplain isolation, bank armoring, riparian
clearing, diversion structure construction, and side channel blockage. In turn, these activities have
resulted in the reduction in channel size and substantial alterations to aquatic and riparian habitats.
Region C is immediately below the mouth of the Bighorn River and as a result, changes in high flows
have been substantial. The 100-year flood flow has been reduced by 16 percent just below the Bighorn
River confluence, to 19 percent immediately upstream of the mouth of the Powder River. The 2-year
discharge has dropped by about 24 percent. The change in flows in Region C has resulted in a shrinking
of the overall Yellowstone River footprint. Between 1950 and 2001, Region C had reduction in total
bankfull channel area of 1,092 acres or six percent. In addition, Region C lost 124 acres of mid-channel
bar area between 1950 and 2001, as well as about 10 miles of low flow channels
Summer baseflows have dropped by an average of 53 percent in Region C, from 6,483 cfs under
undeveloped conditions to 3,434 cfs currently. This major reduction in baseflows has strong implications
with respect to water quality and aquatic habitat conditions during summer months.
About 38 percent of the natural CMZ within Region C has been developed, with irrigated agriculture as
the primary land use in the CMZ (6,810 acres or 34 percent of total CMZ). The river corridor is also locally
followed by the active railroad line and the abandoned Milwaukee Rail Line on the north side of the river;
about 360 acres of the CMZ has been consumed by transportation infrastructure.
As of 2011 there were 37.3 miles of bank armor in the region, protecting about 13 percent of the total
bankline. Most of that armor (~32 miles) is rock riprap. The majority of the bank armor in the reach (20
miles) is protecting the railroad, and another 10 miles protects irrigated agricultural land. Region C also
has 15.8 miles of mapped floodplain dikes and levees. Between 2001 and 2011, at least 230 feet of rock
riprap and 7,250 feet of flow deflectors were destroyed in Region C, primarily by flanking (erosion around
and behind the revetments).
Bank armoring and flow reductions have dampened erosion rates in Region C, where mean migration
rates dropped from 8.1 feet per year from 1950-1976 to 4.9 feet per year from 1976-2001. Similarly, rates
of floodplain turnover have dropped from 130 acres per year from 1950-1976 to 90 acres per year from
1976-2001, a reduction of 40 percent. As a result, the rate of riparian forest erosion in Region C dropped
by about 25 acres per year.
In 1950, there were a total of 124 miles of side channel in Region C, and in 2001, there were 103 miles. A
total of 11.4 miles of side channels were blocked by floodplain dikes prior to 1950, and another 18.8 miles
have been blocked since. The 21 mile net loss indicates that there has been some natural recovery from
the blockages.
Yellowstone River Cumulative Effects Analysis U.S. Army Corps of Engineers Omaha District
July 2015 42 Executive Summary
Region C has experienced extensive riparian clearing, due primarily due to expansion of irrigated lands
into riparian areas. Between 1950 and 2001 about 10% of the riparian vegetation or 2,200 acres were
converted to irrigated land.
About 18,000 acres or 52 percent of the 5-year floodplain in Region C has become isolated due to human
influences. Approximately 11,000 acres or 21 percent of the 100-year floodplain has become isolated,
and most of that is due to flow alterations (3,400 acres) and agricultural infrastructure such as field dikes
(2,900 acres). About 2,300 acres of 100-year floodplain in Region C has become isolated by the
abandoned rail line.
There are three in-stream diversion structures in Region C: Rancher’s Ditch Diversion, Yellowstone Ditch
Diversion, and Cartersville Dam. Cartersville Dam at Forsyth is considered to be a major fish passage
barrier, particularly for Shovelnose Sturgeon.
Russian olive extent and density increases in a downstream direction through Region C where saltcedar
has also become prevalent throughout the Region.
Region D: Prairie, Dawson, Richland, and McKenzie Counties
Region D is 149 river miles long, from the mouth of the Powder River to the Yellowstone River’s
confluence with the Missouri River in North Dakota. It includes the river corridor footprint in eastern Prairie
County, Dawson County, Richland County, Montana, and McKenzie County, North Dakota. This area is
known for both its agricultural importance as well as its rich oil and gas resources. After peaking in the
1980’s the economic boom driven by the oil and gas industry experienced a downturn during the 1990’s,
coincident with drought conditions and a poor agricultural economy through much of the 2000’s. However,
the oil and gas sector is once again experiencing a boom, resulting in an increase in the population in
areas that have previously experienced net out-migration. In 2010, Prairie, Dawson, Richland, and
McKenzie Counties had a combined population of 26,251 people.
Similar to Region C, the cumulative effects in Region D are dominated by the combination of flow
alterations and agricultural development on the floodplain. These influences have driven floodplain
isolation, riparian clearing, diversion structure construction, and side channel blockage. In turn, these
activities have resulted in a reduction in channel size, reduction in rates of channel change, and
substantial alterations to aquatic and riparian habitats. Bank armoring is relatively rare in Region D.
High flow alterations in Region D have been substantial. The 100-year flood flow has been reduced by
about 12 percent, and the 2-year discharge has dropped by about 22 percent. The reduction in stream
flows in Region D has affected the size of the river and the rates of bank movement. Between 1950 and
2001, Region D had a reduction in total bankfull channel area of 3,370 acres or 16 percent. The mean
migration rates dropped from 9.4 feet per year from 1950-1976 to 4.9 feet per year from 1976-2001. As a
result, floodplain turnover rates have dropped from 136 acres per year to 78 acres per year, a reduction
of 58 percent. The rate of riparian forest recruitment has dropped by about 12 acres per year. Region D
also lost a total of 977 acres of mid-channel bar area between 1950 and 2001, and the length of low flow
secondary channels was reduced by 30.1 miles.
The change in low flows has been even more significant. Summer baseflows in Region D have dropped
by an average of 45 percent from 6,787 cfs to 3,029 cfs.
About 38 percent of the CMZ within Region D has been developed, with the primary land use in the CMZ
of irrigated agriculture (6,876 acres or 35 percent of total CMZ).

Yellowstone River Cumulative Effects Assessment December 2015
43 Executive Summary Report Organization
As of 2011 there were 9.7 miles of bank armor in the region, protecting about 3 percent of the total
bankline. Between 2001 and 2011, at least 450 feet of rock riprap, 1,400 feet of concrete riprap, and 760
feet of flow deflectors were destroyed in Region D, primarily by flanking (erosion around and behind the
bank armor structures).
Region D also has 3.2 miles of mapped floodplain dikes and levees, which at 0.02 miles of dikes/levees
per river mile, is a relatively low concentration. A total of 11.3 miles of side channels were blocked by
floodplain dikes prior to 1950, and another 8.9 miles have been blocked since.
Region D has experienced extensive riparian clearing, primarily due to expansion of irrigated lands into
riparian areas. Between 1950 and 2001, about 11% of the riparian vegetation or 2,900 acres were
converted to irrigated land.
Approximately 6,800 acres or 14 percent of the 100-year floodplain have become isolated in Region D,
and most of that is due to flow alterations (5,000 acres). About 8,300 acres or 40 percent of the more
frequently inundated 5-year floodplain in Region D have become isolated.
Region D has the greatest extent of riparian forest on the river, with over 150 acres per valley mile of total
forest, and about 140 acres per valley mile of closed timber cottonwood forest. Russian olive extent and
density is lower than in Region C.
Intake Diversion Dam is located in Region D. It is the largest diversion dam on the river, and was built in
1911. Previous studies have indicated that approximately 500,000 fish were being entrained into the main
irrigation canal annually. Prior to the 2012 irrigation season, the diversion headworks were reconstructed
with fish screens, and fish passage issues at this structure are currently being addressed.
Yellowstone River Recommendations
The Yellowstone River, while experiencing the cumulative effects described above, remains a dynamic
and ecologically diverse river. Multiple opportunities still exist to ensure the long-term sustainability of the
river corridor ecosystem and to maintain the diversity of socioeconomic benefits that the river provides to
numerous communities. A number of Yellowstone River Recommended Practices (YRRPs) are
summarized in Chapter 8 of this document and explained in more detail in the companion document --
Yellowstone River Recommendations – Practical Applications with a Cumulative Effects Perspective -
2015.
The Yellowstone River Recommended Practices include the following:
Isolated Floodplain Restoration – Agricultural and Urban/Residential Development
Isolated Floodplain Restoration – Active/Abandoned Railroads and Public Roads
Side Channel Blockage Removal
Channel Bank Stabilization
Riparian and Wetlands Management
Invasive Woody Plant Control
Noxious Weed Control
Yellowstone River Cumulative Effects Analysis U.S. Army Corps of Engineers Omaha District
July 2015 44 Executive Summary
Water Quality – Nutrient Reduction: Agricultural Land Use
Water Quality – Nutrient Reduction: Residential Development
Solid Waste Removal
Irrigation Water Management
Oil/Gas/Brine Water Pipeline Crossings
Altered Flows
Channel Migration Zone
Fish Passage and Entrainment
The companion document Yellowstone River Recommendations – Practical Applications with a
Cumulative Effects Perspective – 2015 outlines an Implementation Strategy and identifies additional data
needs. The Yellowstone River Conservation District Council (YRCDC) and U.S. Army Corps of Engineers
(Corps) will continue to identify opportunities to partner with individuals, groups, organizations, and
agencies to implement recommendations from this study.
This Cumulative Effects Analysis Report presents in detail the data and logic for the above findings of
cumulative effects on the Yellowstone River Corridor. This document and supporting appendices
(provided in a separate volume), prior study reports, and GIS database are available as resources for
local, state, federal, and tribal agencies, stakeholders, and the general public to use to improve their
management of the river and its floodplain. The goal is to ensure that important environmental, economic,
and cultural values can be sustained for the long-term benefit of the citizens within the watershed.
Report Organization
This document consists of 11 chapters:
Chapter 1, Introduction—Provides background information including description of the study area,
authorization, study participants, and the scope of the study.
Chapter 2, Natural and Human History of the Yellowstone River Corridor—Includes an overview of
the natural history of the Yellowstone River corridor and implications for this study.
Chapter 3, Study Area and Study Reaches—Summarizes the development of reach narratives for
specific segments of the Yellowstone River and of a supporting database.
Chapter 4, Primary River Element Cause-and-Effect Analysis—Analyzes causes and effects for the
primary river elements addressed in the study, including descriptions of the affected environment
and impacts of various stressors.
Chapter 5, Socioeconomics—Describes the economic profiles of the counties in the study area, the
economic sectors, and a summary of a cultural values survey that was conducted of study area
residents.
Yellowstone River Cumulative Effects Assessment December 2015
45 Executive Summary Report Organization
Chapter 6, Cumulative Effects Analysis by Land Use—Describes the cumulative effects resulting from
various land uses.
Chapter 7, Primary Cumulative Effects—Describes the primary cumulative effects.
Chapter 8, Recommendations—Includes recommendations such as Management Practices and
possible restoration opportunities for consideration.
Chapter 9, Public Participation and Tribal Coordination—Describes the public participation process
and tribal coordination that occurred during the study.
Chapter 10, List of Authors.
Chapter 11, References.
Accompanying appendices and datasets are provided in a separate volume. The appendices include:
Appendix 1 - Land Use
Appendix 2 – Hydrology
Appendix 3 – Floodplain Connectivity
Appendix 4 – Geomorphology
Appendix 5 – Water Quality
Appendix 6 - Terrestrial Plants (Riparian Systems)
Appendix 7 – Aquatic Plants (Wetland Systems)
Appendix 8 – Fisheries
Appendix 9 – Avian
Appendix 10 – Socioeconomics
Yellowstone River Cultural Inventory- 2006
Socioeconomic Report: Regional Profile of the Yellowstone River Corridor
Socioeconomic Report: Analysis of Agriculture, Urban/Ex-Urban Development and
Transportation Sectors
Socioeconomic Report: Analysis of Ecosystem Services in the Yellowstone River Corridor
and Economic Impacts of Tourism and Yellowtail Dam
Appendix 11 – Reach Narratives
Appendix 12- Public and Tribal Coordination