youressential linkto o qualitylife - psc.state.fl.us · pdf file3.2.3 industrial accounts 3-4...
TRANSCRIPT

^LAKELANDELECTRIC
Your Essential Linkto o Quality Life
Director, Office ofCommission Clerk March 29,2017Florida Public Service Commission2540 Shumard Oak BoulevardTallahassee, Florida 32399-0850Attn: Carlotta Stauffer
Dear Ms. Stauffer,
Pursuant to Section 186.801, Florida Statutes and Rules 25-22.070-072 of FloridaAdministrative Code, Lakeland Electric hereby submits 5printed copies ofits 2017 TenYear Site Plan.
If you have anyquestions please donothesitate to contact us.
Sincerely,
JaJjL &iiJade Gu
Energy Production - Power ResourcesLakeland Electric501 E Lemon St. Lakeland, FL 33801Phone: 863-834-6560Email: [email protected] COM
AFD g ppAPA ®
O gEGO ^
501 f. Lemon St > Lakeland, Florida 33801Phone: 863.834.6300 -f Fax: 863.834.6344
Enclosure .5^ ^ ^GOL 1IDM ^ CD
cnTEL
GLK

LAKELANDELECTRIC
2017 Ten-Year Site Plan
Electrical Generating Facilities & Associated Transmission Lines
April 2017

Lakeland Electric
2017 Ten-Year Site Plan Contents
Table of Contents
1.0 Introduction 1-1
1.1 General Description of the Utility 1-1
1.2 Forecast of Electrical Power Demand and Energy Consumption 1-1
1.3 Energy Conservation & Management Programs 1-2
1.4 Forecasting Methods and Procedures 1-3
1.5 Forecast of Facilities Requirements 1-3
1.6 Generation Expansion 1-3
1.7 Environmental and Land Use Information 1-3
1.8 Ten-Year Site Plan Schedules 1-3
2.0 General Description of Utility 2-1
2.1 City of Lakeland Historical Background 2-1
2.1.1 Generation 2-1
2.1.2 Transmission 2-4
2.2 General Description: Lakeland Electric 2-6
2.2.1 Existing Generating Units 2-6
2.2.2 Capacity and Power Sales Contracts 2-8
2.2.3 Capacity and Power Purchase Contracts 2-8
2.2.4 Planned Unit Retirements 2-8
2.2.5 Load and Electrical Characteristics 2-8
2.3 Service Area 2-10
3.0 Forecast ofElectrical Power Demand and Energy Consumption 3-1
3.1 Service Territory Population Forecast 3-3
3.2 Account Forecasts 3-3
3.2.1 Residential Accounts 3-4
3.2.2 Commercial Accounts 3-4
3.2.3 Industrial Accounts 3-4
3.2.4 Other Accounts 3-5
3.2.5 Total Accounts Forecast 3-5
3.3 Energy Sales Forecast 3-5
3.3.1 Residential Energy Sales Forecast 3-5
3.3.2 Commercial Energy Sales 3-8
3.3.3 Industrial Energy Sales 3-8
TC-1

Lakeland Electric
2017 Ten-Year Site Plan Contents
Table of Contents (Continued)
3.3.4 Other Sales Forecast 3-9
3.3.5 Total Sales Forecast 3-9
3.4 Net Energy for Load Forecast 3-9
3.5 Peak Demand Forecast 3-9
3.6 Hourly Load Forecast 3-10
3.7 Sensitivities Cases 3-10
3.7.1 High & Low Load Forecast Scenarios 3-10
4.0 Energy Conservation & Management Programs 4-1
4.1 Existing Energy Conservation & Management Programs 4-1
4.1.1 Non-Measurable Demand and Energy Savings 4-1
4.1.2 Energy Conservation & Management Technology Research 4-2
4.1.3 Conservation Programs 2017 4-3
4.2 Solar Program Activities 4-4
4.2.1 Solar Powered Street Lights 4-4
4.2.2 Solar Thermal Collectors for Water Heating 4-5
4.2.3 Renewable Energy Credit Trading 4-6
4.2.4 Utility Expansion of Solar Water Heating Program 4-6
4.2.5 Utility-Interactive Net Metered Photovoltaic Systems 4-7
4.2.6 Utility-Interactive Photovoltaic Systems on PCS 4-7
4.2.7 Integrated Photovoltaics for Florida Residences 4-9
4.2.8 Utility-Scale Solar Photovoltaic Program 4-11
4.2.9 Community Solar 4-12
4.2.10 Energy Storage Solution Pilot 4-13
4.3 Green Pricing Program 4-13
4.4 LED Traffic Light Retrofit Program 4-14
5.0 Forecasting Methods and Procedures 5-1
5.1 Integrated Resource Planning 5-1
5.2 Florida Municipal Power Pool 5-1
5.3 Economic Parameters and Evaluation Criteria 5-1
5.3.1 Economic Parameters 5-2
5.3.2 Fuel Price Projections 5-3
5.3.3 Fuel Forecast Sensitivites 5-10
TC-2

Lakeland Electric
2017 Ten-Year Site Plan Contents
Table of Contents (Continued)
6.0 Forecast ofFacilities Requirements 6-1
6.1 Need for Capacity 6-1
6.1.1 Load Forecast 6-1
6.1.2 Reserve Requirements 6-1
6.1.3 Additional Capacity Requirements 6-2
7.0 Generation Expansion 7-1
7.1 Reliability and Security of Power Supply 7-1
8.0 Environmental and Land Use Information 8-1
9.0 Ten-Year Site Plan Schedules 9-1
9.1 Abreviations and Descriptions 9-2
TC-3
Lakeland Electric
2017 Ten-Year Site Plan Contents
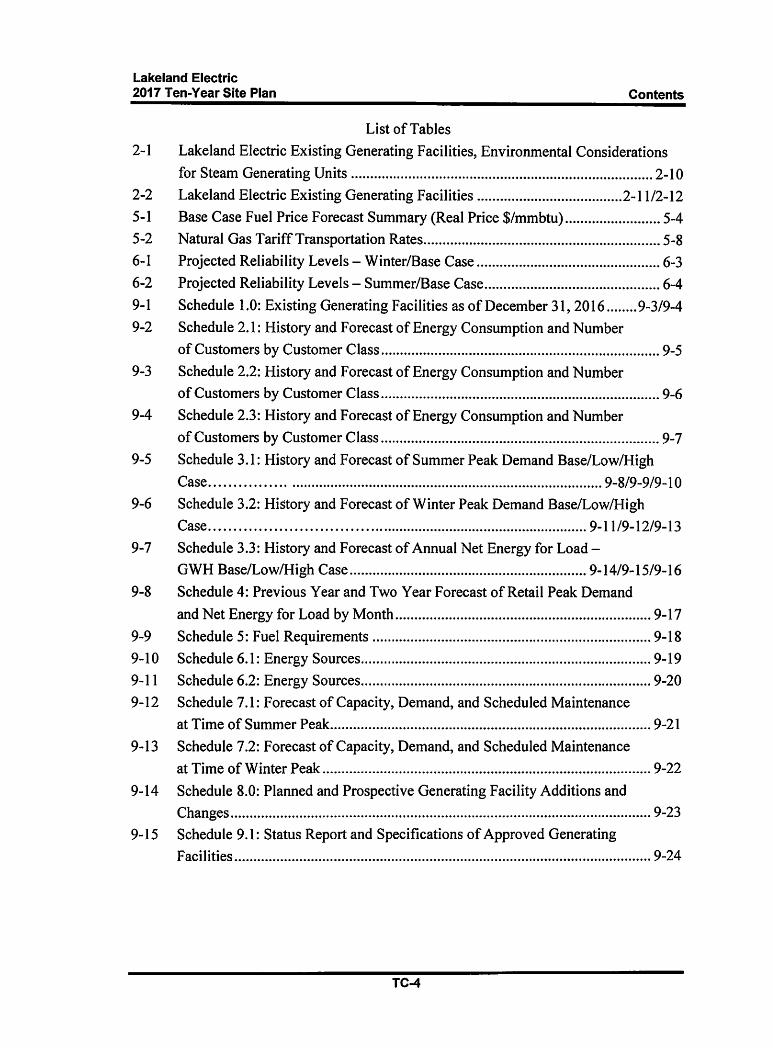
List of Tables
2-1 Lakeland Electric Existing Generating Facilities, Environmental Considerations
for Steam Generating Units 2-10
2-2 Lakeland Electric Existing Generating Facilities 2-11/2-12
5-1 Base Case Fuel Price Forecast Summary (Real Price $/mmbtu) 5-4
5-2 Natural Gas Tariff Transportation Rates 5-8
6-1 Projected Reliability Levels - Winter/Base Case 6-3
6-2 Projected Reliability Levels - Summer/Base Case 6-4
9-1 Schedule 1.0: Existing Generating Facilities as of December 31, 2016 9-3/9-4
9-2 Schedule 2.1: History and Forecast of Energy Consumption and Number
of Customers by Customer Class 9-5
9-3 Schedule 2.2: History and Forecast of Energy Consumption and Numberof Customers by Customer Class 9-6
9-4 Schedule 2.3: History and Forecast of Energy Consumption and Number
of Customers by Customer Class 9-7
9-5 Schedule 3.1: Historyand Forecastof SummerPeak DemandBase/Low/High
Case 9-8/9-9/9-10
9-6 Schedule 3.2: History and Forecast of Winter Peak Demand Base/Low/High
Case 9-11/9-12/9-13
9-7 Schedule 3.3: History and Forecast of Annual Net Energy for Load -
GWH Base/Low/High Case 9-14/9-15/9-16
9-8 Schedule 4: Previous Year and Two Year Forecast of Retail Peak Demand
and Net Energy for Load by Month 9-17
9-9 Schedule 5: Fuel Requirements 9-18
9-10 Schedule 6.1: Energy Sources 9-19
9-11 Schedule 6.2: Energy Sources 9-20
9-12 Schedule 7.1: Forecast of Capacity, Demand, and Scheduled Maintenance
at Time of Summer Peak 9-21
9-13 Schedule 7.2: Forecast of Capacity, Demand, and Scheduled Maintenance
at Time of Winter Peak 9-22
9-14 Schedule 8.0: Planned and Prospective Generating Facility Additions and
Changes 9-23
9-15 Schedule 9.1: Status Report and Specifications ofApproved Generating
Facilities 9-24
TC-4

Lakeland Electric
2017 Ten-Year Site Plan Contents
List ofTables (Continued)
9-16 Schedule 9.2: Status Report and Specifications ofProposed Generating
Facilities 9-25
9-17 Schedule 10: Status Report and Specifications ofProposed Directly
Associated Transmission Lines 9-26
List of Figures
2-1 Electrical System Transmission Map 2-13
4-1 Solar Powered Streetlight 4-05
4-2 Portable Classroom Topped by PV Panels 4-09
4-3 Solar House and Control House 4-11
5-1 Florida Gas Transmission Company System Map 5-06
5-2 Gulfstream Natural Gas Pipeline 5-07
TC-5

Lakeland Electric
2017 Ten-Year Site Plan Introduction
1.0 Introduction
This report contains the 2017 Lakeland Electric Ten-Year Site Plan (TYSP)pursuant to Florida Statutes and as adopted by Order No. PSC-97-1373-FOF-EU on
October 30,1997. The Lakeland TYSP reports the status of the utility's resource plans as
of December 31, 2016. The TYSP is divided into the following nine sections:
Introduction, General Description of Utility, Forecast of Electrical Power Demand and
Energy Consumption, Energy Conservation & Management Programs, Forecasting
Methods and Procedures, Forecast of Facilities Requirements, Generation Expansion
Analysis Results and Conclusions, Environmental and Land Use Information, and Ten-
Year Site Plan Schedules. The contents of each section are summarized briefly in the
remainder of this Introduction.
1.1 General Description of the Utility
Section 2.0 of the TYSP discusses Lakeland's existing generation and
transmission facilities. The section includes a historical overview of Lakeland's system,
and a description of the existing power generating and transmission facilities. This
section includes tables which show the source of the utility's current 890 MW of net
winter generating capacity and 844 MW of net summer generating capacity (as of the end
of calendar year 2016).
1.2 Forecast of Electrical Power Demand and EnergyConsumption
Section 3.0 of the TYSP provides a summary of Lakeland's load and energy
forecast. Lakeland is projected to remain a winter peaking system throughout the
planning period. The forecasts included in this section are for service territory population,
accounts, energy sales, net energy for load, peak demand, and hourly load. In addition,
sensitivity cases are developed for customers, energy sales, system net energy for load
and peaks.
1-1

Lakeland Electric
2017 Ten-Year Site Plan Introduction
1.3 Energy Conservation & Management Programs
Section 4.0 provides descriptions of the existing conservation and energyconservation & management programs. Additional details regarding Lakeland's energyconservation & management programs are on file with the Florida Public Service
Commission (FPSC).
Lakeland's existing energy conservation & management programs include the
followingprograms which promote non-measurable demand and energy savings:
• Residential Programs:
- Energy Audit Program.
- Public Awareness Program.
- Informational Bill Inserts.
• Commercial Programs:
- Commercial Audit Program.
- High efficiency lighting
- Thermal Energy Storage Devices
In addition to Lake Electric's retail conservation programs, the utility is
continuing the following Energy Efficiency & Conservation Programs during 2017:
Insulation rebate
Energy Saving Kits
HVAC Maintenance Incentive
Heat Pump Rebate
LED Lighting
On-line Energy Audit
Energy Star Appliance Rebate
Section 4.0 also contains discussions of Lakeland's solar technology programs.
While these types of programs are not traditionally thought of as DSM, they have the
same effect of conserving energy normally generated by fossil fuels as DSM programs do
by virtue of their avoidance of fossil fuels through the use of renewable energy.
1-2

Lakeland Electric
2017 Ten-Year Site Plan Introduction
1.4 Forecasting Methods and Procedures
Section 5.0 discusses the forecasting methods used for the TYSP and outlines the
assumptions applied for system planning. This section also summarizes the integratedresource plan for Lakeland and provides planning criteria for the Florida MunicipalPower Pool, of which Lakeland is a member. Fuel price projections are provided for
coal, natural gas, and oil; with brief descriptions of the methodology. Assumptions for the
economic parameters and evaluation criteria which are being applied in the evaluation are
also included in Section 5.0.
1.5 Forecast of Facilities Requirements
Section 6.0 integrates the electrical demand and energy forecast with the energy
conservation & management forecast to determine Lakeland's requirements for the ten-
year planning horizon. Application of the reserve margin criteria indicates no need for
additional capacity during the current ten year reporting period.
1.6 Generation Expansion
Section 7.0 discusses the current status of any supply-side and reliability
evaluation being undertaken by Lakeland to identify the best option for its system. It also
discusses basic methodology used by Lakeland in its Generation Expansion Planning
Process.
1.7 Environmental and Land Use Information
Section 8.0 discusses the land and environmental features of Lakeland's TYSP.
1.8 Ten-Year Site Pian Schedules
Section 9.0 presents the schedules required by the Florida Public Service
Commission (FPSC) for the TYSP.
1-3

Lakeland Electric
2017 Ten-Year Site Plan General Description of Utility
2.0 General Description of Utility
2.1 City of Lakeland Historical Background
2.1.1 Generation
The City of Lakeland was incorporated on January 1, 1885, when 27 citizens
approved and signed the city charter. Shortly thereafter the original light plant was built
by Lakeland Light and Power Company at the comer of Cedar Street and Massachusetts
Avenue. This plant had an original capacity of 50 kW. On May 26, 1891, plant manager
Harry Sloanthrew the switch to light Lakelandby electricityfor the first time with five arc
lamps. Incandescent lights were first installed in 1903.
Public power in Lakeland was established in 1904,when foresighted citizens and
municipal officials purchased the small private 50 kW electric light plant from owner
Bmce Neff for $7,500. The need for an expansion led to the constmction of a new power
plant on the north side of Lake Mirror in 1916. The initial capacity of the Lake Mirror
Power Plant was 500 kW. The plant was expanded three times. The first expansion
occurred in 1922 with the addition of 2,500 kW; in 1925, 5,000 kW additional capacity
was added, followed by another 5,000 kW in 1938. With the final expansion, the removal
of the initial 500 kW unit was required to make room for the addition of the 5,000 kW
generating unit, resulting in a total peak plant capacity of 12,500 kW.
As the community continued to grow, the need for a new power plant emerged and
the Charles Larsen Memorial Power Plant was constmcted on the southeast shore of Lake
Parker in 1949. The initial capacity ofthe Larsen Plant Steam was Unit No. 4 (20,000kW)
and it was completed in 1950. The first addition to the Larsen Plant was Steam Unit No.
5 (1956) which had a capacity of 25,000 kW. In 1959, Steam Unit No. 6 was added and
increased the plant capacity by another 25,000 kW. Three gas turbines, each with a
nominal rating of 11,250 kW, were installed as peaking units in 1962. In 1966, a third
steam unit capacity addition was made to the Larsen Plant. This was Steam Unit No.7
having a nominal 44,000 kW capacity and an estimated cost of$9.6 million. This brought
the total Larsen Plant nameplate capacity up to a nominal 147,750 kW.
2-1

Lakeland Electric
2017 Ten-Year Site Plan General Description of Utility
In the meantime, the Lake Mirror Plant, with its old and obsolete equipment,
became relatively inefficient and hence was no longer in active use. It was kept in cold
standby and then retired in 1971.
As the city continued to grow during the late 1960's, the demand for power and
electricity grew at a rapid rate, making evident need for a new power plant (Plant 3). A
site was purchased on the north side of Lake Parker and construction commenced during
1970. Initially, two diesel units with a peaking capacity ofa nominal rating 2,500 kW each
were placed into commercial operation in 1970.
Steam Unit No. 1, with a nominal rating of 90,000 kW, was put into commercial
operation in February 1971, for a total cost of$15.22 million. In June of 1976, Steam Unit
No. 2 was placed into commercial operation, with a nominal rated capacity of 114,707 kW
and at a cost of $25.77million. This addition increased the total capacity of the Lakeland
system to approximately 360,000 kW. At this time. Plant 3 was renamed the C. D.
Mclntosh, Jr. Power Plant in recognition of the former Electric and Water Department
Director.
On January 2, 1979, construction was started on Mclntosh Unit No. 3, a nominal
334 MW coal fired steam generating unit which became commercial on September 1,1982.
The unit was designed to use low sulfur oil as an alternate fuel, but this feature was later
decommissioned. The unit uses a minimal amount of natural gas for flame stabilization
during startups. The plant utilizes sewage effluent for cooling tower makeup water. This
unit is jointly owned with the Orlando Utilities Commission (OUC) which has a 40 percent
undivided interest in the unit.
As load continued to grow. Lakeland continually studied and reviewed alternatives
for accommodating the additional growth. Altematives included both demand- and supply-
side resources. A wide variety of conservation and energy conservation & management
programs were developed and marketed to Lakeland customers to encourage increased
energy efficiency and conservation in keeping with the Florida Energy Efficiency and
Conservation Act of 1980 (FEECA). Changes to the FEECA rules in 1993 exempted
Lakeland from conservation requirements, but Lakeland has remained active in promoting
and implementing cost-effective conservation programs. These programs are discussed in
further detail in Section 4.0.
2-2

Lakeland Electric
2017 Ten-Year Site Plan General Description of Utility
Although demand and energy savings arose from Lakeland's conservation and
energy conservation & management programs, additional capacity was required in the
early 1990's. Leastcostplanningstudiesresulted in the construction ofLarsenUnitNo. 8,
a natural gas fired combinedcycle unit with a nameplategeneratingcapabilityof 114,000
kW. Larsen Unit No. 8 began simple cycle operation in July 1992, and combined cycle
operation in November of that year.
In 1994, Lakeland made the decision to retire the first unit at the Larsen Plant,
Steam UnitNo. 4. This unit, put in service in 1950 with a capacity of 20,000 kW, had
reached the end of its economic life. In March of 1997, Lakeland retired Larsen Unit No. 6,
a 25 MW oil fired unit that was also nearing the end of its economic life. In October of
2004, Lakeland retired Larsen Unit 7, a 50MW oil fired steam unit.
In 1999, the construction of Mclntosh Unit No. 5, a simple cycle combustion
turbine was completed, having a summer nominal 225MW. The unit was released for
commercial operation in May, 2001. Beginning in September 2001, the unit underwent
conversion to a combined cycle unit through the addition of a nominal 120 MW steam
turbine generator. Construction was completed in spring 2002 with the unit being declared
commercial in May 2002. The resulting combined cycle gross capacity of the unit is 345
MW summer and 360 MW winter.
During the summer of 2001, Lakeland took its first steps into the world of
distributed generation with the groundbreaking of its Winston Peaking Station. The
Winston Peaking Station consists of20 quick start reciprocating engines each driving a 2.5
MW electric generator. This provides Lakeland with 50 MW ofpeaking capacity that can
be started and put on line at full load in ten minutes. The Station was declared commercial
in late December 2002.
In 2009 Lakeland Electric installed selective catalytic reduction (SCR) on the
Mclntosh Unit 3 for NOx control to provide full flexibility in implementing the Federal
Cap and Trade program for nitrogen oxides (NOx) required under the Clean Air Interstate
Rule (CAIR).
Steam Unit No. 1 at the Mclntosh Plant was retired from service on December 31,
2015. This unit had a nominal rating of 90,000 kW and had been in service since 1971.
2-3

Lakeland Electric
2017 Ten-Year Site Plan General Description of Utility
2.1.2 Transmission
The first phase of the Lakeland 69 kV transmission system was placed in operation
in 1961 with a step-down transformer at the Lake Mirror Plant to feed the 4 kV bus, nine
4 kV feeders, and a new substation in the southwest section of the town with two step-
down transformers feeding four 12 kV feeders.
In 1966, a 69 kV line was completed from the Northwest substation to the South
west substation, completing the loop around the town. At the same time, the old tie to
Bartow was reinsulatedfor a 69 kV line and placed in operation, feedinga new step-down
substation in Highland City with four 12 kV feeders. In addition, a 69 kV line was
completed from Larsen Plant around the Southeast section of the town to the southwest
substation. By 1972, 20 sections of 69 kV lines, feeding a total of nine step-down
substations, with a total of 41 distribution feeders, were completed and placed in service.
By the fall of 1996,all ofthe original4 kV equipment and feeders had been replaced and/or
upgraded to 12 kV service. By 1998, 29 sections of 69 kV lines were in service feeding
20 distribution substations.
As the Lakeland system continued to grow, the need for additional and larger
transmission facilities grew as well. In 1981, Lakeland's first 230 kV facilities went into
service to accommodate Lakeland's Mclntosh Unit No. 3 and to tie Lakeland into the State
transmission grid at the 230 kV level. A 230 kV line was built fi*om Mclntosh Plant to
Lakeland's west substation. A 230/69 kV autotransformer was installed at each of those
substations to tie the 69 kV and 230 kV transmission systems together. In 1988, a second
230 kV line was constructed from the Mclntosh Plant to Lakeland's Eaton Park substation
along with a 230/69 kV autotransformer at Eaton Park. That line was the next phase ofthe
long-range goal to electrically circle the Lakeland service territory with 230 kV
transmission to serve as the primary backbone of the system.
In 1999, Lakeland added generation at its Mclntosh Power Plant that resulted in a
new 230/69/12kV substation being built and energized in March ofthat year. The Tenoroc
substation, replaced the switching station called North Mclntosh. In addition to Tenoroc,
another new 230/69/12kV substation was built. The substation, Interstate, went on line
June of 1999 and is connected by what was the Mclntosh West 230 kV line. This station
2-4

Lakeland Electric
2017 Ten-Year Site Plan General Descriptionof Utility
was built to address concerns about load growth in the areas adjacent to the 1-4 corridor
which were causing problems at both the 69kV and distribution levels in this area.
In 2001, Lakeland began the next phase of its 230kV transmission system with the
construction of the Crews Lake 230/69kV substation. The substation was completed and
placed in service in 2001. This project includes two 230kV ties and one 69kV tie with
Tampa Electric, a 150MVA230/69kV autotransformerand a 230kV line from Lakeland's
Eaton Park 230kV substation to the Crews Lake substation.
Early transmission interconnections with other systems included a 69 kV tie at
Larsen Plant with Tampa Electric Company (TECO), was established in mid-1960s. A
second tie with TECO was later established at Lakeland's Highland City substation. A
115 kV tie was established in the 1970s with Progress Energy of Florida (PEP), now Duke
EnergyFlorida(DEF)and Lakeland's West substation andwas subsequently upgradedand
replaced with the current two 230 kV lines to PEF in 1981. At the same time. Lakeland
interconnected with Orlando Utilities Commission (OUC) at Lakeland's Mclntosh Power
Plant. In August 1987,the 69 kV TECO tie at Larsen Power Plant was taken out ofservice
and a new 69 kV TECO tie was put in service connecting Lakeland's Orangedale
substation to TECO's Polk City substation. In mid-1994, a new 69 kV line was energized
connecting Larsen Plant to the Ridge Generating Station (Ridge), an independent power
producer. Lakeland has a 30-year firm power-wheeling contract with Ridge to wheel up
to 40 MW of their power to DEF. In early 1996, a new substation, East, was inserted in
the Larsen Plant to the Ridge 69 kV transmission line. Later in 1996, the third tie line to
TECO was built from East to TECO's Gapway substation. As mentioned above, in August
of 2001, Lakeland completed two 230kV ties and one 69kV tie with TECO at Lakeland's
Crews Lake substation. The multiple 230 kV interconnection configuration ofLakeland is
also tied into the bulk transmission grid and provides access to the 500 kV transmission
network via DEF, providing greater reliability. At the present time. Lakeland has a total
of approximately 128 miles of 69 kV transmission and 28 miles of 230 kV transmission
lines in service along with six 150 MVA 230/69 kV autotransformers.
2-5

Lakeland Electric
2017 Ten-Year Site Plan General Description of Utility
2.2 General Description: Lakeland Electric
2.2.1 Existing Generating Units
This section provides additional detail on Lakeland's existing units and
transmission system. Lakeland's existing generating units are located at two existing plant
sites: Charles Larsen Memorial (Larsen) and C.D. Mclntosh Jr. (Mclntosh). Both plant
sites are located on Lake Parker in Polk County, Florida. The two plants have multiple
units with different technologies and fuel types. The following paragraphs provide a
summary of the existing generating units for Lakeland. Table 2-1 summarizes the
environmental considerations for Lakeland's steam turbine generators and Table 2-2
provides other physical characteristics of all Lakeland generating units.
The Larsen site is located on the southeast shore of Lake Parker in Lakeland. The
site has three units. The total net winter (summer) capacity of the plant is 151 MW
(124 MW). Units 2 and 3, General Electric combustion turbines, have a combined net
winter (summer) rating of 27 MW (19 MW). The units bum natural gas as the primary
fuel with diesel as the backup. Historically, Larsen Unit No. 5 consisted of a boiler for
steam generation and steam turbine generator to convert the steam to electrical power.
When the boiler began to show signs of degradation beyond economical repair, a gas
turbine with a heat recovery steam generator. Unit No. 8, was added to the facility. This
allowed the gas turbine (Unit No. 8) to generate electricity and the waste heat from the gas
turbine to repower the former Unit No. 5 steam turbine in a combined cycle configuration.
The former Unit No. 5 steam turbine currently has a net winter (summer) rating of 31 MW
(29 MW) and is referred to as Unit No. 8 Steam Turbine from this point on in this document
and in the reporting of this unit. The Unit No. 8 combustion turbine has a net winter
(summer) rating of 93 MW (76 MW).
The Mclntosh site is located in the City of Lakeland along the northeastem shore
ofLake Parker and encompasses 513 acres. Electricity generated by the Mclntosh units is
stepped up in voltage by generator step-up transformers to 69 kV and 230 kV for
transmission via the power grid. The Mclntosh site currently includes six (6) units in
commercial operation having a total net winter and summer capacity of 689 MW and
670 MW, respectively. Unit CTl consists of a General Electric combustion turbine with a
net winter (summer) output rating of 19MW (16 MW). Unit No. 2 is a natural gas/oil fired
2-6

Lakeland Electric
2017 Ten-Year Site Plan General Description of Utility
Westinghouse steamturbine with a net winterand summeroutputof 106MW. UnitNo. 3
is a 342 MW pulverizedcoal fired unit owned 60 percent by Lakeland and 40 percent by
OUC. Lakeland's share of the unit yields net winter and summer output of 205 MW.
Technologies used for Unit 3 are very innovative makingit a very environmentally friendly
coal unit. Unit No. 3 was one ofthe first "zero-discharge" plants built, meaning no waste
water products leave the plant site untreated. Unit No. 3 also includes a wet flue gas
scrubber for SO2 removal and uses treated sewage water for cooling water. Two small
diesel units with a net output of 2.5 MW each are also located at the Mclntosh site.
Mclntosh Unit No. 5, a Siemens 50IG combined cycle unit, was initially built and
operated as a simple cycle combustion turbine that was placed into commercial operation
May, 2001. The unit was taken off line for conversion to combined cycle starting in mid-
September 2001 and was returned to commercial service in May 2002 as a combined cycle
unit with a rating of 354 MW winter and 338 MW summer. The unit is equipped with
Selective Catalytic Reduction (SCR) for NOx control.
Lakeland Electric constructed a 50-megawatt electric peaking station adjacent to
its Winston Substation in 2001. The purpose ofthe peaking plant was to provide additional
quick start generation for Lakeland's system during times ofpeak loads.
The station consists oftwenty (20) HMD 20 cylinder reciprocating engines driving
2.5 MW generators. The units are currently fueled by #2 fuel oil but have the capability to
bum a mix of 5% #2 oil and 95% natural gas. Lakeland currently does not have natural gas
service to the site.
The plant has remote start/mn capability for extreme emergencies at times when
the plant is unmanned. The station does not use open cooling towers. This results in
minimal water or wastewater requirements. Less than three quarters ofthe six (6) acre site
was developed leaving considerable room for water retention.
The engines are equipped with hospital grade noise suppression equipment on the
exhausts. Emissioncontrol is achievedby Selective CatalyticReduction (SCR) using 19%
aqueous ammonia. The SCR system will allow the plant to operate within the Minor New
Source levels permitted by the Florida Department of EnvironmentalProtection (DEP).
Winston Peaking Station (WPS) was constructed adjacent to Lakeland's Winston
Distribution Load Substation. Power generated at WPS goes directly into Winston
2-7

Lakeland Electric
2017 Ten-Year Site Plan General Description of Utility
Substation at 12.47kV distribution level of the substation and has sufficient capacity to
serve the substation loads. Winston Substation serves several of Lakeland's largest and
most critical accounts. Should Winston lose all three 69kV circuits to the substation, the
WPS can be on line and serving load within ten minutes. In addition to increasing the
substation's reliability, this arrangement will allow Lakeland to delay the installation of a
third 69kVto 12.47kV transformer by severalyears and also contributes to lowering loads
on Lakeland's transmission system.
2.2.2 Capacity and Power Sales Contracts
Lakeland currently has no long-term firm power sales contract in place as of
December 31, 2016.
Lakelandsharesownershipof the C.D. MclntoshUnit 3 with OUC. Theownership
breakdown is a 60 percent share for Lakeland and a 40 percent ownership share for OUC.
The energyand capacitydeliveredto OUCfrom MclntoshUnit 3 is not considereda power
sales contract because of the OUC ownership share.
2.2.3 Capacity and Power Purchase Contracts
Lakeland currently has no long-term firm power purchase contracts in place as of
December 31, 2016.
2.2.4 Planned Unit Retirements
Other than the retirement of Mclntosh Steam Unit 1 (85MW) on December 31,
2015, Lakeland has no set retirement plans in place for any other units due to the current
economic conditions ofthe electric utility industry and the uncertainty that those conditions
present.
2.2.5 Load and Electrical Characteristics
Lakeland's load and electrical characteristics have many similarities with those of
other peninsular Florida utilities. The peak demand has historically occurred during the
winter months. Lakeland's actual total peak demand (Net Integrated) in the winter of
2016/2017 was 539 MW which occurred on January 9, 2017. The actual summer peak in
2016 was 647 MW and occurred on July 27, 2016, Lakeland normally is winter peaking
and expects to continue to do so in the future based on expected normal weather.
2-8

Lakeland Electric
2017 Ten-Year Site Plan General Description of Utility
Lakeland's historical and projected summer and winter peak demands are presented in
Section 9.0.
Lakeland is a member of the Florida Municipal Power Pool (FMPP), along with
Orlando Utilities Commission (OUC) and the Florida Municipal Power Agency's (FMPA)
All-Requirements Power Supply Project. The FMPP operates as an energy pool with all
FMPP capacity from its members committed and dispatched economically together.
Commitment and dispatch services for FMPPare provided by OUC. Each memberof the
FMPP retains the responsibilityofadequatelyplanning its own systemto meet native loads,
obligations and reserve requirements.
2-9

Lakeland Electric
2017 Ten-Year Site Pian General Description of Utility
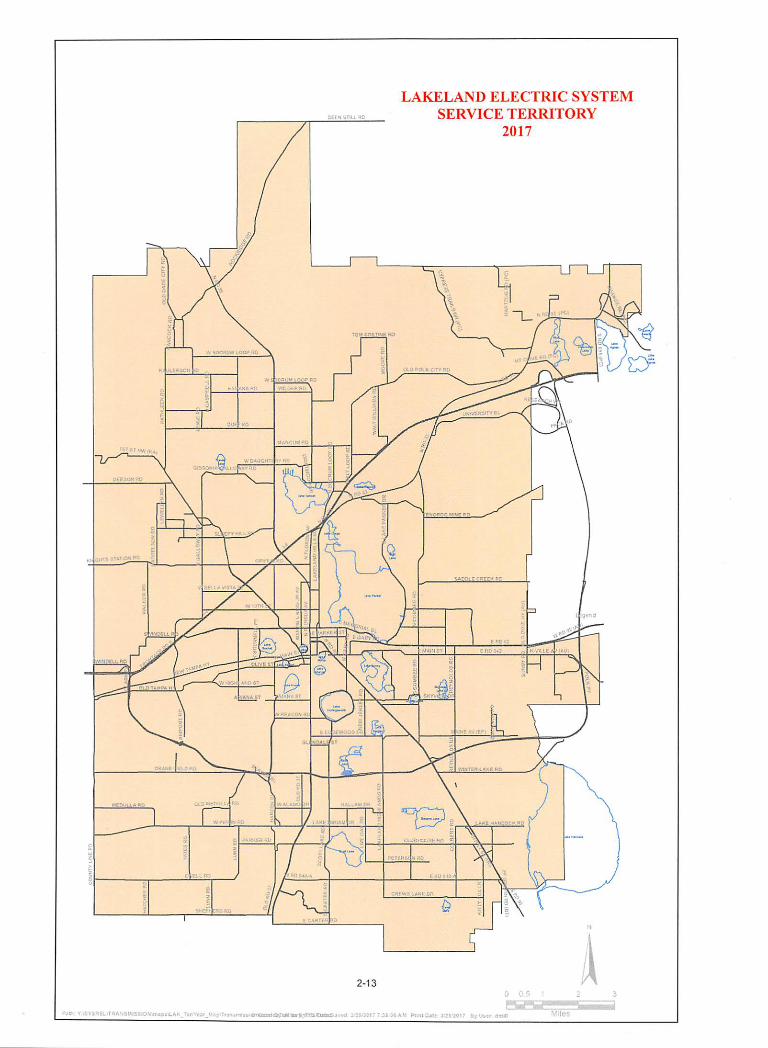
2.3 Service Area
Lakeland's electric service area is shown on Figure 2-1 and is entirely located in
Polk County. Lakeland serves approximately 246 square miles of which approximately
174 square miles is outside of Lakeland's city limits.
Table 2-1
Lakeland Electric
Existing Generating FacilitiesEnvironmental Considerations for Steam Generating Units
Plant Name
Flue Gas Cleaning
Charles Larsen Memorial
C. D. Mclntosh, Jr.
Unit
8ST
2
3
5ST
Particulate
N/A
None
EP
N/A
SO,
N/A
LS
S
N/A
FGR Flue gas recirculationLNB Low NOx burnersEP Electrostatic precipitatorsLS Low sulfur fuel
S Scrubbed
OTF Once-through flowWCTM = Water cooling tower mechanicalN/A Not applicable to waste heat applications
Source: Lakeland Environmental Staff
2-10
NO,
N/A
FGR
LNB
N/A
Type
OTF
WCTM
WCTM
WCTM

Lakeland Electric
2017 Ten-Year Site Plan
Plant Name
Charles Larsen
Memorial
Plant Total
Unit
No.Location
16-17/28S/24E
Unit
Type'
GT
GT
CA
CT
General Description of Utility
Table 2-2a
Lakeland Electric Existing Generating Facilities
FueP
Pri
NG
NG
WH
NG
Alt
DFO
DFO
DFO
Fuel
Transport'
Pri
PL
PL
PL
Alt
TK
TK
TK
Alt Fuel
Days
Use'
Commercial
In-Service
Month/Year
11/62
12/62
04/56
07/92
Expected
Retirement
Month/Year
Unknown
Unknown
Unknown
Unknown
'Lakeland does not maintainrecordsof the numberof days thatalternate fuel is used.
Gen. Max.
Nameplate
kW
11,250
11,250
26,000
88.000
Net Capability
Summer
MW
10
9
29
76
124
Winter
MW
14
13
31
93
151
'Unit Type *FuelType 'Fuel Transportation Method
CA Combined Cycle Steam Part DFO Distillate Fuel Oil PL Pipeline
CT Combined Cycle Combustion Turbine RFO Residual Fuel Oil TK Truck
GT Combustion Gas Turbine BIT Bituminous Coal RR Railroad
ST Steam Turbine WH Waste Heat
NG Natural Gas
2-11

Lakeland Electric
2017 Ten-Year Site Plan General Description of Utility
Table 2-2b
Lakeland Electric Existing Generating Facilities
Fuel''Fuel
Transport'Net Capability
Plant NameUnit
No.Location
Unit
Type'Pri Alt Pri Alt
Alt Fuel
Days
Use'
Commercial
In-Service
Month/Year
Expected
Retirement
Month/Year
Gen. Max.
Nameplate
kW
Summer
MW
Winter
MW
Winston
Peaking Station1-20 21/28S/23E IC DFO ... TK ... NR 12/01 Unknown 2,500 each 50 50
Plant Total 50 50
C.D. Mclntosh, D1 4-5/28S/24E IC DFO — TK NR 01/70 Unknown 2,500 2.5 2.5Jr. D2 IC DFO TK — NR 01/70 Unknown 2,500 2.5 2.5
GTl GT NG DFO PL TK NR 05/73 Unknown 20,000 16 19
2 ST NG RFO PL TK 14 06/76 Unknown 114,700 106 106
3' ST BIT — RR TK NR 09/82 Unknown 219,000 205 205
5 CT NG ... PL — NR 05/01 Unknown 245,000 213 233
5 CA WH ...
— —NR 05/02 Unknown 120,000 125 121
Plant Total 670 689
System Total 844 890
'Lakeland's 60percent portion ofjointownership withOrlando Utilities Commission.^Lakeland doesnotmaintain records of thenumberof daysthatalternate fuel is used.
'Unit Type ''Fuel Type 'Fuel Transportation MethodOA Combined Cycle Steam Part DFO Distillate Fuel Oil PL PipelineCT Combined Cycle Combustion Turbine RFO Residual Fuel Oil TK Truck
GT Combustion Gas Turbine BIT Bituminous Coal RR Railroad
ST Steam Turbine WH Waste Heat
NG Natural Gas
2-12
WINPU,
rj'. ;!-l; IiU
2-13
LAKELAND ELECTRIC SYSTEM
SERVICE TERRITORY
2017
%
S-.O'-OC'.' St-:
Mi;.: £;
-r.mv.-
0 0.5 I
I _ui: ;;i ;oi7 iy us.-i
Lakeland Electric Forecast of Electrical Power2017 Ten-Year Site Plan Demand and Energy Consumption
3.0 Forecast of Electrical Power Demand and
Energy Consumption
Annually, Lakeland Electric (LB) develops a detailed short-term (1-year) electric
load and energy forecast for budget purposes and short-term operational studies. The
annual long-term forecast is developed for the Utility's long-term planning studies.
Sales and customer forecasts ofmonthly data are prepared by rate classification or
revenue class. Separate forecast models are developed for inside and outside Lakeland's
corporate limits for the Residential, Commercial, Industrial and outdoor lighting rate
classifications. Monthly forecasts are summarized annually using fiscal period ending
September 30^.
LE uses MetrixND, an advanced statistical program developed by Itron, to assist
with the development of LE's energy, number of customers, and demand forecasts.
MetrixND allows LE to incorporate economic, demographic, price, elasticities, end-use
appliance saturations and efficiencies, and various weather variables into the forecast.
LE also uses Itron MetrixLT, which integrates with MetrixND, to develop the long-
term system hourly load forecast.
Many variables are evaluated for the development of the forecast. The variables
that have proven to be significant and are included in the forecast are: Gross State Product
(GSP), total employment, disposable personal income per household, persons per
household, growth in number of households, growth in population, price, structural
changes (appliance saturation and efficiency trends), and weather. Binary variables are also
used to explain outliers in historical billing discrepancies, trend shifts, monthly seasonality,
rate migration between classes, etc.
The economic projections used in the forecast are purchased from Moody's
Analytics (Economy.com).
The real price of electricity is developed using a 12-month moving average of real
average price. The historical price data, along with the Consumer Price Index (CPI), is used
to develop a price forecast for the MetrixND modeling structure. The end-use saturation
and efficiency indices used in the models are purchased from Itron. Itron's Energy
Forecasting Group (EFG) offers end-use data services and forecasting support. EFG's
3-1
Lakeland Electric Forecast of Electrical Power2017 Ten-Year Site Plan Demand and EnergyConsumption
projections are based on data derived from the Energy Information Administration's South
Atlantic Census Division. Itron is also contracted to further calibrate the indices based on
LB' service area average square footage by building type.
Heating and cooling degree days are weather variables that attempt to explain a
customer's usage behavior as influenced by either hot or cold weather. The industry
standard for calculating degree days is Average Daily Temperature - 65 degrees (base
temperature) = Heating (HDD) or Cooling Degree Day (CDD).
These HDD and CDD variables are used in the forecasting process to correlate
electric consumption with weather. The HDD and CDD variablesare weighted to capture
the impacts ofweather on revenue month billed consumption.
LE uses weather data from its own weather stations, which are strategically placed
throughout the electric serviceterritoryto providethe best estimate of overall temperature
for the Lakeland service area. The forecast models are developed using historical 20-year
normal weather.
Normal temperatures at time ofpeak are used for peak modeling. HDDs and CDDs
are calculated for each historical monthly peak and the weather variables are ranked from
the highest to lowest value within each year. Normal peak day HDDs and CDDs are then
defined as an average across the rankings. Finally, the average values are mapped back to
the month during which the highest HDD or CDD typically occurs.
Historical monthly data is available and is analyzed for the 20-year period. Careful
evaluation ofthe data and model statistics is performed, which results in most models being
developed using less than a 10-year estimation period.
The modeling techniques used to generate the forecast include: multiple regression,
study of historical relationships and growth rates, trend analysis, and exponential
smoothing. LE also reviews the forecast for reasonableness, compares projections to
historical patterns, and modifies the results as needed using informed judgment. LE utilizes
Itron's Statistically Adjusted End-Use (SAE) econometric modeling approach for the
residential and commercial sectors. The SAE approach is designed to capture the impact
of changing end-use saturation and efficiency trends as well as economic conditions on
long-term residential and commercial energy sales and demand.
3-2

Lakeland Electric Forecast of Electrical Power2017 Ten-Year Site Plan Demand and Energy Consumption
The winter peak forecast is developedunder the assumptionthat its occurrence will
be on a January weekday. Historical winter peaks have occurred between the months of
January to March, on weekdays, and between the hours of 7 and 8 a.m. Temperatures at
time of winter peaks range from 27° F to 44° F.
The summer peak forecast is developed under the assumption that its occurrences
will be on a July weekday. Historical summerpeaks have occurred between the monthsof
June to August, on weekdays, and between the hours of 3 and 6 p.m. Temperatures at time
of summer peaks range from 92° F to 99° F.
LE currently does not have any Demand Side Management (DSM), therefore, LE
does not assume any deductions in peak load for the forecast period.
The results of the energy sales forecasts for all revenue classes are addedtogether
to create a total sales forecast. A loss-factor of approximately 3.2% (based on historical
monthlydata) is appliedto convert total energy sales to net energy for load (NEL).
3.1 Service Territory Population Forecast
Electric Service Territorv Population Estimate
EE's service area encompasses approximately 246 square miles of which
approximately 174 square miles are outside the City of Lakeland's corporate limits. The
estimated electric service territory population for LE for 2016 is 279,331 persons.
Population Forecast
LE's service territory population is projected to increase at an estimated 1.39%
average annual growth rate (AAGR) for years 2017 - 2026.
Polk County's population (Lakeland/Winter-Haven MSA) is forecasted to grow at
1.79% AAGR for the same 10-year period. Historically, Polk County's population has
grown faster than LE's service territory population.
3.2 Account Forecasts
Lakeland forecasts the number of monthly electric accounts for the following
categories and subcategories:
3-3

Lakeland Electric Forecast of Electrical Power2017 Ten-Year Site Plan Demand and EnergyConsumption
• Residential
• Commercial
• Industrial
• Other
3.2.1 Residential Accounts
A regression model was used to develop the Residential account forecast using
monthly customer data. Total Residential accounts were projected as a function of
population in the LakelandAVinter-Haven Metropolitan Statistical Area (MSA). Binary
variables were also used to explain outliers in historical billing data and to account for
seasonality.
3.2.2 Commercial Accounts
Commercial accounts consist of the General Service (OS), General Service
Business Demand (GSBD) and General Service Demand revenue classes.
Due in large part to energy efficiency, LE is experiencing a long term trend of
General Service Large Demand (GSLD) customers migrating to the Commercial rate
classes. For this reason, a regression model combining both Commercial and GSLD rate
classes is being used. The number of Commercial and GSLD accounts is projected as a
function of total employment in the LakelandAVinter Haven Metropolitan Statistical Area
(MSA).
A ratio of the Commercial and GSLD rate classes is then applied to generate the
Commercial and GSLD account forecasts.
3.2.3 Industrial Accounts
Industrial accounts consist of General Service Large Demand (GSLD),
Interruptible (INT) and Extra Large Demand Customer (ELDC) revenue classes.
The GSLD rate class is defined by customers reaching a billing demand of 500KW
at least three times in the past rolling 12 months. As noted in section 3.2.2, the GSLD
account forecast is a ratio of the combined Commercial and GSLD account forecast.
The INT rate class is defined as customers reaching a billing demand of 1000 KW
or greater at least three times in the past rolling 12 months.
3-4

Lakeland Electric Forecast of Electrical Power2017 Ten-Year Site Plan Demand and Energy Consumption
The ELDC rate class is defined by customers reaching a billing demand above 5000
KW at least three times in the past rolling 12 months.
Projections for the INT and ELDC accounts are modeled independently of
MetrixND. Special consideration is given to account for new major commercial and
industrial development projects that may impactfuture demand and energyrequirements.
3.2.4 Other Accounts
The Other account category consists of those accounts within the Municipal,
Electric, and Water Departments of the City of Lakeland as well as private area lighting
and roadway lighting.
Historical data for these classes is inconsistent and difficult to model. Therefore,
the account projections for this category are based on time trends and historical growth
rates. LE also takes into consideration any future projects and potential developments.
These forecasts are developed outside of MetrixND.
3.2.5 Total Account Forecast
The Total Account Forecast for LE is the sum of all the individual forecasts
mentioned above.
3.3 Energy Sales Forecast
Lakeland's Energy Sales Forecast is the sum ofthe following forecasts:
• Residential
• Commercial
• Industrial
• Other
3.3.1 Residential Energy Sales Forecast
The Residential energy sales forecast is developed using the Statistically Adjusted
End-Use (SAE) modeling approach. The SAE approach uses regression models and
independent variables that are designed to capture the impact of changing end-use
saturation and efficiency trends as well as economic conditions on long-term residential
3-5

Lakeland Electric
2017 Ten-Year Site PlanForecast of Electrical Power
Demand and Energy Consumption
energy and demand. The residential sales models are average use models and are estimated
with historical monthly energy sales data.
The Residential average use models for inside and outside Lakeland's corporate
limits are driven by disposablepersonal incomeper household, the numberof personsper
household, appliance saturation and efficiency trends, and weather. Binary variables are
also used to explain outliers in the historical billing data.
The average use regressionmodel is based on the following average use equation:
AvgUsey,m = a + bi x XCooly,m + hi x XHeaty,m + bs x XOthery,ni
Where:
XCool = Cooling equipment saturation levels (central, room), cooling equipment
efficiency, thermal efficiency, home size (square footage), household income, average
persons per household, energy price and cooling degree days (ODD).
XCooly^ =CoollndeXy xCoolUseym
XCooly.m is the estimated cooling energy use in year (y) and month (m).
CoolIndexy,m is the annual index of cooling equipment.
CoolUsey,m is the monthly usage multiplier.
The CoolIndexy,m is calculated as follows:
(Sat^""/CoolIndeXy =Structural Indexy x^ Weight x
Type
y
CoolUsey,m is defined as follows:
CoolUse^„ =.' CDD.
ODD.. A f HHSize.. „VfHHIncome.. „VfPrice.. „ ^
01 y HHSize,01 y HHIncome.01 y Pr ice.01 y
3-6

Lakeland Electric
2017 Ten-Year Site Plan
Forecast of Electrical Power
Demand and Energy Consumption
XHeat = Heating equipment saturation levels (resistance, heat pump), heating efficiency,
thermal efficiency, home size (square foot), household income, average persons per
household, energy price and heating degree.days (HDD).
XHeaty ^ = HeatlndeXy^ x HeatUsey^
Where:
XHeaty.m is the estimated heating energy use in year (y) and month(m).
Heatlndexy,m is the annual index ofheating equipment.
HeatUsey,m is the monthly usage multiplier.
The Heatlndex•y,m is calculated as follows:
HeatUsey,m is defined as follows:
Heatlndexy =Structural Indexy x^Weight^^^^ xType
Satl""
saiir.EffT)
HeatUse^„ =y^tn
( HDD,v.ttt
r////5/ze... V® (HHIncome..„Y^'' f?rice,.^
HDD,01 y HHSize,01 y HHIncomeQ^ ^ VPr/ceoi y
XOther = Other equipment saturation levels (water heat, appliances, lighting densities, plug
loads), appliance efficiency, household income and average persons per household size.
The explanatory variables for other uses are defined as follows:
XOthery^ - OtherlndeXy^ x OtherUsey^
The OtherIndexy,m is calculated as follows:
Otherlndex, = Structural Index, El x ,^ t SatT
Sat'̂ 'P"Type
y y
TypeI /Wc
3-7

Lakeland Electric
2017 Ten-Year Site Plan
Forecast of Electrical Power
Demand and Energy Consumption
OtherUsey,m is defined as follows:
OtherUse^ „ = xrHHSize^
0.10
( HHImome^ „ ^0.20 0.0
^ HHSize,,, ^ ^ HHIncomeQ^ , Pr/ceo, ^
The equation used to develop residential energy sales is as follows:
ResidentialSaleSy.m = ResidentialCustomery^m xAverageUsePerCustomery,m
3.3.2 Commercial Energy Sales
As mentioned in section 3.2.2, there is increasingrate migration betweenthe GSLD
and Commercial rate classes due to energy efficiency. Further, the majority of GSLD
customers in the LE service area are in buildings that are classified as Commercial as
defined by the U.S. Energy Information Administration. Therefore, a combined
Commercial and GSLD energy sales model is generated. This model is also developed
using the SAE modeling approach.
Commercial energy sales are projected for both inside and outside the corporate
limits. The Commercial sales models are driven by Gross State Product (GSP), weather,
and appliance saturations and efficiencies. Binary variables are also used to help explain
fluctuations in historical billing data due to rate migrations, billing discrepancies,
seasonality, etc.
3.3.3 Industrial Energy Sales
While the GSLD demand and energy sales are forecast in combination with
Commercial energy sales, the remainder of the Industrial class - the INT and ELDC rate
classes - are modeled independently of MetrixND and later imported into the model to
generate the Total Sales Forecast. Each INT and ELDC customer is evaluated individually
to account for their expected future energy and demand consumption. Usage data compiled
by the utility's Account Managers and the forecasting group is also integrated into the
forecasting process.
3-8

Lakeland Electric Forecast of Electrical Power2017 Ten-Year Site Plan Demand and Energy Consumption
3.3.4 Other Sales Forecast
Other energy sales consist of sales for the City's Municipal, Electric and Water
Departments, private area lighting, roadway lighting, and unmetered (street lighting) rate
classes. Models are difficult to develop for these rate classes due to the large fluctuations
in the historical billing data. Therefore, the projections for this category are based on
historical trends and growth rates. Special consideration is given to account for new
projects and potential developments.
3.3.5 Total Sales Forecast
The Total Energy Sales Forecast for Lakeland is the sum ofthe individual forecasts
mentioned above.
3.4 Net Energy for Load Forecast
Models are estimated in MetrixND to forecast monthly sales by customer class
(Residential, Commercial, Industrial, Other). The results of the energy sales forecasts for
all revenue classes are added together to create a total sales forecast. To determine the total
system net energy for load (NEL) a loss-factor is applied to the total sales forecast to
convert sales to NEL. Electric losses, the measure of the amount of energy lost during the
generation, transmission, and distribution of electricity are developed using a historical
average.
3.5 Peak Demand Forecast
A regression model is estimated in MetrixND to forecast monthly peaks. The model
is developed using Itron's SAE modeling approach to ensure that end-use appliance
saturations and efficiencies that may affect peak are being accounted for. The models are
driven by monthly energy coefficients and actual peak-producing weather conditions. The
forecast is generated under the assumption of"normal" peak-producing weather conditions.
Normal peak-producing weather is developed using historical 20-year normal weather.
3-9

Lakeland Electric
2017 Ten-Year Site PianForecast of Electrical Power
Demand and Energy Consumption
3.6 Hourly Load Forecast
Twenty-fourhourly regressionmodels are developed in MetrixND to generate the
20-year hourly load forecast. Each ofthese models relates weather and calendar-conditions
(day-of-week, month, holidays, seasonal periods, etc.) to load. The un-calibrated hourly
load shape is then scaled to the energy forecast and the peak forecast using MetrixLT. The
result is an hourly load shape that is calibrated to the system energy and system peak
forecasts produced using MetrixND.
3.7 Sensitivity Cases
3.7.1 High & Low Load Forecast Scenarios
A forecast is generated based on the projections of its drivers and assumptions at
the time of forecast development. This base forecast (50/50) is intended to represent the
forecast that is "most likely" to occur.
It should be noted, that there may be some conditions arising that may cause
variation from what is expected in the base forecast. For these reasons, high and low case
scenario forecasts are developed for customers, energy sales, system net energy for load
and peaks. The high and low forecasts are based on variations of the primary drivers
including population and economic growth.
Model Evaluation and Statistics
The results of the Electric Load and Energy Forecast are reviewed by an outside
consultant. Itron is contracted to review all sales, customer, peak and energy forecast
models for reasonableness and statistical significance. Itron also evaluates and reviews all
key forecast assumptions.
Additionally, the MetrixND software is used to calculate the following list of
statistical tests for determining a significant model: Adjusted R-Squared, Durbin Watson
Statistic, F-Statistic, Probability (F-Statistic), Mean Absolute Deviation (MAD) and Mean
Absolute Percent of Error (MAPE).
3-10

Lakeland Electric
2017 Ten-Year Site Plan Energy Conservation & ManagementPrograms
4.0 Energy Conservation & Management Programs
Lakeland Electric is committed to the efficient use of electric energy and is
committed to provide cost-effective energy conservation and demand reduction programs
for all its consumers. Lakeland is not subject to FEECA rules but has in place several
Energy Conservation & Management Programs and remains committed to utilize cost-
effectiveconservation and EnergyConservation & Management Programs that will benefit
its customers. Presented in this section are the currently active programs.
This section also includes a brief description of Lakeland's advances in solar
technology and a new LED traffic light retrofit program. Lakeland has been a pioneer in
the deployment and commissioning of solar energy devices and continues to support and
look for opportunities to promote solar energy technologies.
4.1 Existing Energy Conservation & Management Programs
Lakeland has the following energy conservation & management programs that are
currently available and address two major areas of energy conservation & management:
• Reduction of energy needs on a per customer basis.
• Movement of energy to off-peak hours when it can be generated at a lower
cost.
4.1.1 Non-Measurable Demand and Energy Savings
The programs outlined in this section cannot be measured directly in terms of
demand and energy savings, but are very important in that they have been shown to
influence public behavior and thereby help reduce energy consumption and generation
requirements. Lakeland considers the following programs to be an important part of its
objective to cost-effectively reduce energy consumption:
• Residential Programs:
- Energy Audit Program.
- Public Awareness Program.
- Informational Bill Inserts.
4-1

Lakeland Electric
2017 Ten-Year Site Plan Energy Conservation &Management
Programs
• Commercial Programs:
- Commercial Audit Program.
4.1.1.1 Residential Programs.
4.1.1.1.1 Residential Energy Audits.
The Energy Audit Program promotes the usage of high energy-efficiency
appliances in the home and gives the customeran opportunity to learn about other utility
conservation programs. The program provides Lakeland with a valuable customer
interface and a good avenue for increased customer awareness.
4.1.1.1.2 Public Awareness Program.
Lakeland believes that public awareness of the need to conserve electricity is the
greatest conservation resource. Lakeland's public awareness programs provide customers
with information to help them reduce their electric bills by being more conscientious in
their energy usage.
4.1.1.1.3 informational Biii inserts.
Monthly billing statements provide an excellent avenue for communicating timely
energy conservation information to its customers. In this way, Lakeland conveys the
message of better utilizing their electric resources on a regular basis in a low cost manner.
4.1.1.2 Commercial Programs.
4.1.1.2.1 Commercial Energy Audits.
The Lakeland Commercial Audit Program includes educating customers about high
efficiency lighting and thermal energy storage devices for customers to consider in their
efforts to reduce costs associated with their electric usage.
4.1.2 Energy Conservation & Management Technology Research
Lakeland has made a commitment to study and review promising technologies in
the area of energy conservation & management programs. Some of these efforts are
summarized below.
4-2

Lakeland Electric
2017 Ten-Year Site Pian Energy Conservation & ManagementPrograms
4.1.2.1 Time-of'Day Rates.
Lakeland is currently offering a time of day program and plans to continue as this
makes consumers aware of the variation in costs during the day. To date, there has been
limited interest by Lakeland's customers in this demand-side management program.
4.1.3 Conservation Programs 2017
In keeping with Lakeland Electric's plan to promote retail conservationprograms,
the utility is continuing the following Energy Efficiency & Conservation Programs
during 2017:
Residential
Commercial
Insulation rebate - $200 rebate for adding attic insulation to achieve R30total. Certificate issued to resident at energy audit/visit and redeemed toInsulation Contractor. Can be homeowner installed
Energy Saving Kits - giveaway at audits contains weather-stripping,outlet gaskets, low flow showerhead, LED, etc.
HVAC Maintenance Incentive - $50 rebate for residential customers
that have A/C maintenance done.
Heat Pump Rebate - $300 rebate for installing a SEER 15 or higher heatpump
LED Lighting - giveaway at audits, up to 3 per residence
On-line Energy Audit
Energy Star Appliance Rebateo Refrigerator $75o Dishwasher $40
o Clothes Washer $ 100
o Freezer $40
o Pool Pump $200
Conservation Rebate - rebate of $150/kw for GSLD, Contract, and
Interruptible customers that make energy efficiency improvements.Promoted by Account Executives
Commercial Lighting - rebate of $150/kw reduced per customer forenergy efficient lighting upgrades
Expected Results
• 2.6 mw demand reduction and over 4,600,000 kwh
4-3
Lakeland Electric
2017 Ten-Year Site Plan Energy Conservation &Management
Programs
4.2 Solar Program Activities
LakelandElectricviewssolar energydevicesas distributedgenerators whetherthey
interconnectto the utility grid or not. Solar also contributes to reducing both peak demand
and energy, linking it to energy conservation & management programs. As such they can
potentially fill the much-desired role that an electric utility needs to avoid future costs of
building new (and/or re-working existing) supply side resources and delivery systems.
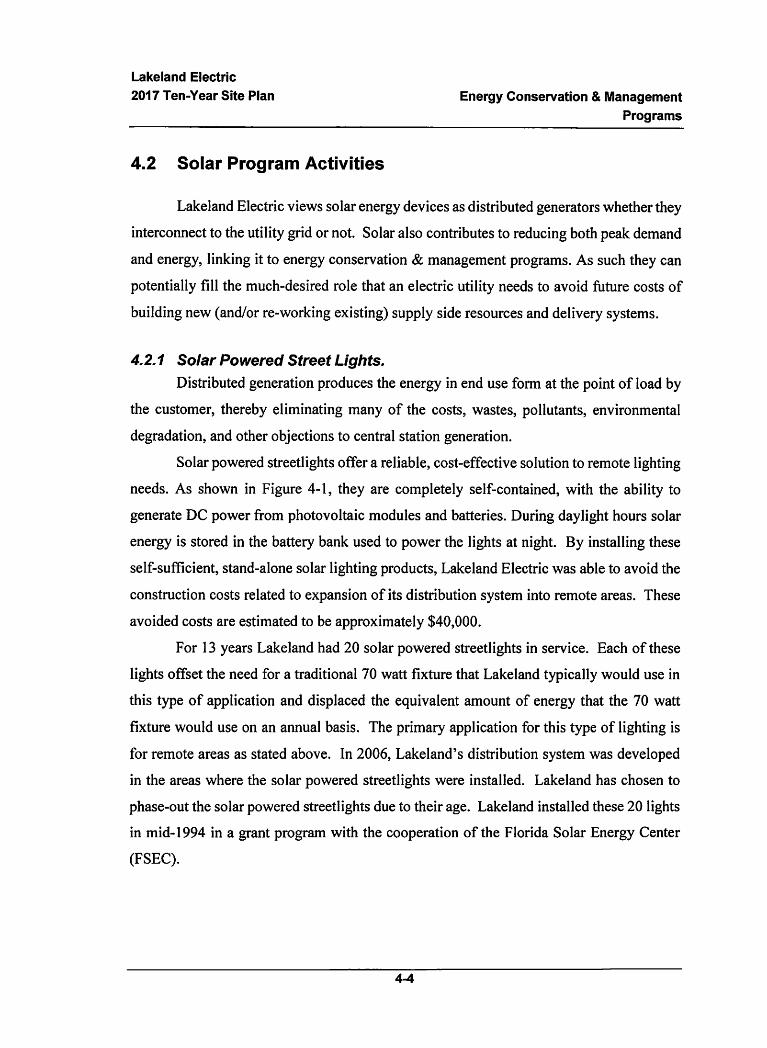
4.2.1 Solar Powered Street Lights.
Distributed generation produces the energy in end use form at the point of load by
the customer, thereby eliminating many of the costs, wastes, pollutants, environmental
degradation, and other objections to central station generation.
Solar powered streetlights offer a reliable, cost-effective solution to remote lighting
needs. As shown in Figure 4-1, they are completely self-contained, with the ability to
generate DC power from photovoltaic modules and batteries. During daylight hours solar
energy is stored in the battery bank used to power the lights at night. By installing these
self-sufficient, stand-alone solar lighting products, Lakeland Electric was able to avoid the
construction costs related to expansion of its distribution system into remote areas. These
avoided costs are estimated to be approximately $40,000.
For 13 years Lakeland had 20 solar powered streetlights in service. Each of these
lights offset the need for a traditional 70 watt fixture that Lakeland typically would use in
this type of application and displaced the equivalent amount of energy that the 70 watt
fixture would use on an annual basis. The primary application for this type of lighting is
for remote areas as stated above. In 2006, Lakeland's distribution system was developed
in the areas where the solar powered streetlights were installed. Lakeland has chosen to
phase-out the solar powered streetlights due to their age. Lakeland installed these 20 lights
in mid-1994 in a grant program with the cooperation of the Florida Solar Energy Center
(FSEC).
4-4

Lakeland Electric
2017 Ten-Year Site Plan Energy Conservation & ManagementPrograms
4-5
il
Figure 4-1 Solar Powered Streetlight
4.2.2 Solar Thermal Collectors for Water Heating.
Themost effective application for solarenergy is the heatingof water for residential
use. Solarwaterheating provides energy directly to the end-user and results ina highlevel
of end-user awareness. The sun's energy is stored directly in the heated water itself,
eliminating the losses incurred when converting the energy to other forms.
During a ten-year pilot program, Lakeland installed and operated 57 solar water
heaters in single family homes. Lakeland chose active solar water heaters as well as
passive. All units were installedon the roofsof residential customers' homes, i.e. - at the
point of consumption. Since this method of energy delivery bypasses the entire
transmission and distribution system, there are benefits other than avoided generation costs.
In Lakeland's program, each solar water heater remainedthe propertyof the utility,
thereby allowing the customer to avoid the financial cost of the purchase. Lakeland's
return on this investment was realized through the sale of the solar generated energy as a
separate line item on the customer's monthly bill. This energy device was monitored by
using a utility-quality Btu meter calibrated to read in kWh.
One of the purposes of this program was to demonstrate that solar thermal energy
can be accurately metered and profitably sold to the everyday residential end-user as hot
water. Lakeland Electric's fleet of 57 solar thermal energy generators displaces over 2,000
kWh per year per installation on average. During 2012 Lakeland Electric chose to end the
pilot program, giving the participants the choice to either:
• assume ownership of the solar heater at no cost (or)
• have the solar heater removed and replaced with a standard electric
water heater, also at no cost.
Sixty-two percent of the participants chose to keep the solar heaters at their premises.
Lakeland Electric
2017 Ten-Year Site Plan Energy Conservation & Management
Programs
4.2.3 Renewable Energy Credit Trading
Lakeland Electric is also the first utility to successfully trade Renewable Energy
Credits (REC's) that were produced by these solar water heaters. In 2004 a cash transaction
took place between Lakeland and two REG buyers: Keys Energy Services of Key West
and the Democratic National Convention in Boston. Keys Energy needed the REC's for
its retail Green Pricing program. The Democratic National Convention used the REC's to
offset the emissions produced during that convention.
4.2.4 Utiiity Expansion of Solar Water Heating Program
During November, 2007 Lakeland Electric issued a Request for Proposals for the
expansion of its Residential Solar Water Heating Program. In this solicitation Lakeland
sought the servicesof a venture capital investorwho would purchase, install,own, operate
and maintain 3,000 - 10,000 solar water heaters on Lakeland Electric customers'
residences in return for a revenue-sharing agreement. Lakeland Electric would provide
customer service and marketing support, along with meter reading, billing and collections.
During December, 2007 a successful bidder was identifiedand notified. In August 2009,
Lakeland Electric approved a contract with the vendor with plans to resume installations
of solar water heaters. Annual projected energy savings from this project will range
between 7,500 and 25,000 megawatt-hours. These solar generators will also produce
Renewable Energy Credits that will contribute toward Florida's expected mandate for
renewable energy as a part of the utility's energy portfolio.
During the summer of 2010 the "Solar for Lakeland" program began installing
residential solar water heaters. Under this expanded program the solar thermal energy will
be sold for the fixed monthly amount of $34.95. All solar heating systems will continue to
be metered for customers' verification of solar operation and for tracking green credits for
the utility. Through the end of 2016 there were 261 solar heaters installed in Lakeland
residences.
4-6

Lakeland Electric
2017 Ten-Year Site Plan Energy Conservation & ManagementPrograms
4.2.5 Utility-Interactive Net Metered Photovoltaic SystemsThis project started as a collaborative effort between the Florida Energy Office
(PEG), FloridaSolarEnergyCenter(FSEC), Lakeland Electric, and ShellSolar Industries.
Theprimaryobjective of this program wasto developapproaches anddesignsthat integrate
photovoltaic (PV) arrays into residential buildings,and to developworkableapproaches to
interconnect PV systems into the utility grid. Lakeland originally installed 3 PV systems,
all ofwhich were directly interconnected to the utility grid. These systems have an average
nominal power rating of approximately 2.6 kilowatts peak (kwp) and are displacing
approximately 2900 kWh per year per installation at standard test conditions.
During 2005 title to these systems was transferred to those homeowners in return
for their extended voluntary participation. At the end of 2016 only one of these three
original systems was still in operation.
Lakeland owned, operated, and maintained the systems for at least 7 years. FSEC
conducted periodic site visits for testing and evaluation purposes. System performance
data was continuously collected via telephone modem line during those years. FSEC
prepared technical reports on system performance evaluation, onsite utilization,
coincidence of PV generation with demand profiles, and utilization of PV generated
electricity as a demand-side management option.
As of January 2017, there were a total of 181 PV systems that had been privately
owned in the Lakeland Electric service territory. These systems now generate a total of
880 kw of electric capacity. Lakeland Electric has allowed the interconnection of these
systems in "net meter" fashion.
4.2.6 Utility-Interactive Photovoltaic Systems on Polk County Schools
Lakeland was also actively involved in a program called "Portable Power." The
focus of the program was to install Photovoltaic Systems on portable classrooms in the
Polk County School District. This program included Lakeland Electric, Polk County
School District, Shell Solar Industries, Florida Solar Energy Research and Education
Foundation (FSEREF), Florida Solar Energy Center (FSEC) and the Solar Electric Power
Association (SEPA), formerly known as the Utility Photovoltaic Group. The program
4-7

Lakeland Electric
2017 Ten-Year Site Plan Energy Conservation & Management
Programs
allowed seventeen portable classrooms to be enrolled in former President Clinton's
"Million Solar Roofs Initiative." With the installation of the photovoltaic systems 80
percent of the electricity requirements for these classrooms were met.
Along with the photovoltaic systems, a specially designed curriculum on solar
energy appropriate to various grade levels was developed. This education package was
delivered to the schools for their teachers' use for the instruction of solar sciences. By
addressing solar energy technologies in today's public school classrooms. Lakeland is
informing the next generation ofthe environmental and economic need for alternate forms
of energy production.
The "Portable Power" in the schools, shown in Figure 4-2, consisted of l.SkWp
photovoltaic systems on 17 portable classrooms. In addition to the educational awareness
benefits of photovoltaic programs in schools, there were several practical reasons why
portable classrooms were most appropriate as the platforms for photovoltaics. They
provided nearly flat roofs and were installed in open spaces, so final orientation is of little
consequence. Another reason was the primary electric load of the portable classroom was
air conditioning. That load was reduced by the shading effect of the panels on their short
stand-off mounts. Most important, the total electric load of the portable classroom was
highly coincidental with the output from the PV system. The hot, sunny days which
resulted in the highest cooling requirements also produced the maximumPV output.
Of extreme value to the photovoltaic industry. Lakeland Electric, in a partnership
with the FSEC, provided on-site training sessions while installing the solar equipment on
these school buildings. Attendees from other electric utilities were enrolled and given a
hands-on opportunity to develop the technical and business skills needed to implement
their own solar energy projects. The training classes covered all aspects of the solar
photovoltaic experience from system design and assembly, safety and reliability, power
quality, troubleshooting to distributed generation, and future requirements ofderegulation.
4-8

Lakeland Electric
2017 Ten-Year Site Plan Energy Conservation & ManagementPrograms
Figure 4-2
Portable Classroom Topped by PV Panels
Lakeland owned, operated, and maintained the systems on these classrooms.
Lakeland monitored the performance and FSEC conducted periodic testing of the
equipment. Through the cooperative effort of the partnership, different ways to use a
photovoltaic system efficiently and effectively in today's society were evaluated.
As a result of aging, all of the portable classrooms have been retired. And, where
shifting populations have caused school officials to relocate some classrooms to schools
outside Lakeland's service territory. Lakeland has removed the PV systems from those
classrooms. Because the equipment is still capable of generating, budgets are being created
so that these systems can be re-installed on buildings owned by the City of Lakeland.
4.2.7 Integrated Photovoltaics for Florida Residences
Lakeland's existing integrated photovoltaic program supports former President
Clinton's "Million Solar Roofs Initiative". The Department of Energy granted five million
dollars for solar electric businesses in addition to the existing privately funded twenty-
seven million dollars, for a total of thirty-two million dollars for the program. Through the
Utility Photovoltaic Group, the investment supported 1,000 PV systems in 12 states and
Puerto Rico with hopes to bring photovoltaic systems to the main market. The 1,000
4-9

Lakeland Electric
2017 Ten-Year Site Plan Energy Conservation & Management
Programs
systemswere part of the 500,000commitments receivedfor the initiativeto date. The goal
was to have installed solardevices on one millionroofsby the year2010. Lakeland helped
to accomplish this national goal.
This program provides research in the integration of photovoltaics in newly
constructed homes. Two new homes, having identical floor plans, were built in "side-by-
side" fashion. The dwellings were measured for performance under two conditions:
occupiedand unoccupied. Data is beingcollectedfor end-useloadandPV systeminterface.
As a researchproject, the goal is to see how much energycould be saved without factoring
in the cost of the efficiency features.
The first solar home was unveiled on May 28, 1998, in Lakeland, Florida. The
home construction includes a 4 kW photovoltaic system, white tiled roof, argon filled
windows, exterior wall insulation, improved interior duct system, high performance heat
pump and high efficiency appliances. An identical home with strictly conventional
construction features was also built as a control home. The homes are 1 block apart and
oriented in the same direction as shown in Figure 4-3. For the month of July 1998, the
occupied solar home air conditioning consumption was 72 percent lower than the
unoccupied control house. Living conditions were simulated in the unoccupied home.
With regard to total power, the solar home used 50 percent less electricity than the air
conditioning consumption of the control home. The solar home was designed to provide
enough power during the utility peak that it would not place a net demand on the grid. If
the solar home produces more energy than what is being consumed on the premises, the
output of the photovoltaic system could be sent into the utility grid. The objective was to
test the feasibility of constructing a new, single family residence that was engineered to
reduce air conditioning loads to an absolute minimum so most of the cooling and other
daytime electrical needs could be accomplished by the PV component.
4-10

Lakeland Electric
2017 Ten-Year Site Plan
PVRES House
Energy Conservation & Management
Programs
Control
Figure 4-3
Solar House and Control House
4.2.8 Utility-Scale Solar Photovoltaic Program
During November, 2007 Lakeland Electric issued a Request for Proposal seeking
an investor to purchase and install investor-owned PV systems totaling 24 megawatts on
customer-owned sites as well as City of Lakeland properties. During December, 2007 a
successful bidder was identified. In October 2008, Lakeland Electric approved the contract
with the vendor. Installation of these PV systems began in 2010. Projected reduction in
annual fossil-fuel generation is expected to be 31,800 megawatt-hours. This project will
not only offset future energy generation, but will also produce highly valuable Renewable
Energy Credits in anticipation of a Florida mandate to produce renewable energy as a part
of the utility's overall portfolio.
During 2010 an investor-owned 250kw PV system was installed on the roof of
Lakeland's Civic Center. This system became operational during March and has produced
a total of 2,470 MWh through 2015.
During 2011 a 2.25 megawatt PV system (Phase 1) was installed at the Lakeland
Linder Airport. This system is interconnected directly to the utility's medium voltage
4-11

Lakeland Electric
2017 Ten-Year Site Plan Energy Conservation & Management
Programs
distribution circuit on Hamilton Road. This system has generated a total of 18,540 MWh
through the end of2015.
During 2012, another 2.75 megawatt PV system (Phase 2) was added to the
Hamilton Road site bringing the project total to 5.0 MWac. The Phase 2 system has
generated 20,560 MWh through 2015.
In December of 2013 LE entered into another Solar Energy Purchase Agreement
with this vendor. This agreementcalls for the constructionofa 6.0 MWac solargeneration
system on property adjacent to the Sutton substation. This system was completed and
commissioned duringJuly 2015. This systemgenerated a total of 5,910MWhthroughthe
end of 2015.
DuringOctoberof 2015,another3.15MWprojectwas startedon Lakeland Airport
propertyat MedullaRd. This projectwas commissioned in December2016. The plan call
for the developmentofanother 6.0 MW has been postponed indefinitely. LakelandElectric
has a total of—14.4 MW ofsolar capacity which has the potential to produce approximately
3.5% ofthe average daytime system-wide summer load.
4.2.9 Community Solar
Community Solar programs provide an alternative to the traditional process of
individuals or businesses placing solar on their property. In this program LE's customers
will have the choice ofpurchasing solar energy from a designated solar generation facility
instead of a traditional power plant.
Joining other utilities across the United States, LE has chosen Community Solar as
a mean to increase participation in solar energy for the people who may have physical,
financial, or other limitations to installing solar on their own property.
During the second halfof2015, Lakeland Electric conducted telephone surveys and
held focus group meetings to determine the level of interest in a Community Solar Program.
Program specifics and policies are expected to be developed in 2016. A rollout date for
this program was not determined at the end of 2016.
4-12

Lakeland Electric
2017 Ten-Year Site Plan Energy Conservation & ManagementPrograms
4.2.10 Energy Storage Solution Pilot
The City of Lakeland is constantly looking to provide its customer base with the
highest value by offering creative solutions to improve reliability and efficiency.The COL
is planning to deploy a pilot battery energy storage solution in 2017. The energy storage
solution is intended to provide energy storage capability to shave customer's peak demand
which can potentially lead to monetary savings.
4.3 Green Pricing Program
Because no long-term budgets have been established for the deployment of solar
energy devices, many utilities are dependent on infrequent, somewhat unreliable sources
of funding for their solar hardware purchases. To provide for a more regularly available
budget, a number ofutilities are looking into the voluntary participationoftheir customers.
Recent market studies performed in numerous locations and among diverse population
groups reveal a public willingness to pay equal or even slightly higher energy prices
knowing that their payments are being directed towards renewable fuels.
The Florida Municipal Electric Association (FMEA) has assembled a workgroup
called "Sunsmart". This workgroup is a committee composed ofmember utilities.
Its purpose is to raise environmental awareness and implement "Green Pricing"
programsthat would call for regularperiodicpayments from customers who wish to invest
in renewables. The Florida Solar Energy Center (FSEC) co-hosts this effort by providing
meeting places and website advertising to recruit from statewide responses. A grant from
the State of Florida Department of Community Affairs, Florida Energy Office has been
appropriated to encourage utility involvement with Green Pricing. Lakeland Electric is an
active member of this committee and is investigating the marketability and public
acceptance ofa Green Pricing Program in its service territory.
4-13
Lakeland Electric
2017 Ten-Year Site Plan Energy Conservation & Management
Programs
4.4 LED Traffic Light Retrofit Program
The City of Lakeland is responsible for the operation and maintenance of 3,411
traffic lights at over 171 intersections. Historically, these traffic signals have used
incandescent bulbs which are replaced every 18 months and use approximately 135 watts
of electricityper bulb. This amounts to an annual electrical consumption of 1,633,525 kwh
for all 12" red and green signals, arrow signals and pedestrian crossing signals.
This project retrofitted the existing bulbs with highly efficient Light Emitting
Diodes (LEDs). The LEDs use approximately 10 watts of energy which is more than a
90% decrease in energy consumption as compared to their incandescent counterparts and
have a longer life span, up to seven years, which reduces maintenance costs as well.
The Florida Department ofTransportation (FDOT) agreed to help fund Lakeland's
project to retrofit the signals. The FDOT contributed $50,000 for these new LED traffic
lamps on all roadways within Lakeland's city limits. The FDOT views this as a "good
neighbor policy" since FDOT depends on city crews to maintain the signals on its roads
and highways within the city's limits.
Theproject beganin December, 2002 and was completedin June 2003. Theproject
is expected to save the City of Lakeland $150,000per year in maintenance and electricity
costs.
As a next step. Lakeland Electric added backup power supply equipment at 14
critical intersectionsearmarked for FDOT-fundedLED signals. These improvementswere
limited to those intersections that are located on state-funded roadways. The UPS systems
will improve safety by keeping traffic signals operating during power outages and
accidents. Emergency vehicles in Lakeland will see the added benefit of having easier
access to desired areas such as fire and medical locations. Lakeland anticipates being one
of the first cities in Florida to have the UPS systems applied to the LED signals.
4-14

Lakeland Electric
2017 Ten-Year Site Plan Forecasting Methods and Procedures
5.0 Forecasting Methods and Procedures
This section describes and presents Lakeland's long-term integrated resource
planning process, the economic parameter assumptions, plus the fuel price projectionsbeing used in the current evaluation process.
5.1 Integrated Resource Planning
Lakeland selects its capacity resources through an integrated resource planning
process. Lakeland's planning process considers energy conservation, and supply-side
resources along with the needs of the T&D system. The integrated resource planning
process employed by Lakeland continuously monitors supply and energy conservation
programs. As promising alternatives emerge, they are included in the evaluation process.
5.2 Florida Municipal Power Pool
Lakeland is a member ofthe Florida Municipal Power Pool (FMPP) along with the
Orlando Utilities Commission (OUC) and the Florida Municipal Power Agency's (FMPA)
All-Requirements Power Supply Project. The three utilities operate as one control area.
All FMPP capacity resources are committed and dispatched together from the OUC
Operations Center.
The FMPP is not a capacity pool meaning that each member must plan for and
maintain sufficient capacity to meet their own individual demands and reserve obligations.
Any member of the FMPP can withdraw from FMPP with a three-year written notice.
Lakeland, therefore, must ultimately plan to meet its own load and reserve requirements as
reflected in this document.
5.3 Economic Parameters and Evaluation Criteria
This section presents the assumed values adopted for economic parameters and
inputs used in Lakeland's planning process. The assumptions stated in this section are
applied consistently throughout this document. Subsection 5.3.1 outlines the basic
economic assumptions. Subsections 5.3.2 and 5.3.3 outline the constant differential fuel
forecasts, and base case, high and low.
5-1

Lakeland Electric
2017Ten-Year Site Plan Forecasting Methods and Procedures
5.3.1 Economic Parameters
This section presents the values assumed for the economic parameters currently
being used in Lakeland's least-cost planning analysis.
5.3.1.1 Inflation and Escalation Rates
The general inflation rate applied is assumed to be 2.0 percent per year based on
the CBO's projection for the GDP deflator as ofJanuary 2017. Fuel price escalation rates
are discussed below in Section 5.3.2.
5.3.1.2 Bond Interest Rate
Consistent with the traditional tax exempt financing approach used by Lakeland,
the self-owned supply-side alternatives assume 100 percent debt financing. Lakeland's
long-termtax exempt bond interest rate is assumed to be 4.5 percent.
5.3.1.3 Present Worth Discount Rate
The present worth discount rate used in the analysis is set equal to Lakeland's
assumed bond interest rate of4.5 percent.
5.3.1.4 Interest During Construction
During construction of the plant, progress payments will be made to the EPC
contractor and interest charges will accrue on loan draw downs. The interest during
construction rate is assumed to be 4.5 percent.
5.3.1.5 Fixed Charge Rates
The fixed charge rate is the sum of the project fixed charges as a percent of the
project's total initial capital cost. When the fixed charge rate is applied to the initial
investment, the product equals the revenue requirements needed to offset fixed costs for a
given year. A separate fixed charge rate can be calculated and applied to each year of an
economic analysis, but it is most common to use a Levelized Fixed Charge Rate that has
the same present value as the year by year fixed charged rates. Included in the fix charged
5-2

Lakeland Electric
2017 Ten-Year Site Plan Forecasting Methods and Procedures
rate calculation is an assumed 2.0 percent issuance fee, a 1.0 percent annual insurance cost,
and a 6-month debt reserve fund earning interest at a rate equal to the bond interest rate.
5.3.2 Fuel Price Projections
This section presents the fuel price projections for coal, natural gas and oil. The
fuel price forecast for solid fuels and oils and natural gas is prepared by LakelandElectric's
Fuels Department. The coal commodity escalation rate is 2.4% base off the 2017 U.S.
Energy InformationAdministration (EIA) forecast. Transportation inflationrate is base off
the January 2017-2027 Congressional Budget Office (CBO) GDP inflation rate of 2%.
Natural Gas forecast uses a blended average from a consultant forecast and the NYMEX
Natural Gas forward curve along with including the following: transport rate, usage, fuel
to provide a total delivered price. The Oil prices use the ten-year NYMEX Crude Oil
forward curve. The diesel oil forecast is based off the EIA Annual Energy Outlook 2017
Table: Energy prices by Sector and Source.
5.3.2.1 Natural Gas
Natural gas is a colorless, odorless fuel that burns cleaner than many other
traditional fossil fuels. Natural gas can be used for heating, cooling, and production of
electricity, and other industrial uses.
Natural gas is found in the Earth's crust. Once the gas is brought to the surface, it
is refined to remove impurities such as water, sand, and other gases. The natural gas is
then transported through pipelines and delivered to the customer either directly from the
pipeline or through a distribution company or utility.
5-3

Lakeland Electric
2017 Ten-Year Site Plan Forecasting Methods and Procedures
Table 5-1
Base Case Fuel Price Forecast Summary
Mclntosh 3 Coal'
Natural
Gas'
Low Sulfur
#6 Oil'
#2
Diesel Oil'
2017 $3.32 $3.96 $9.57 $14.33
2018 $3.40 $3.87 $9.82 $16.22
2019 $3.48 $3.61 $9.82 $17.26
2020 $3.55 $3.57 $9.88 $17.75
2021 $3.63 $3.59 $9.88 $18.10
2022 $3.71 $4.09 $9.94 $18.36
2023 $3.80 $4.30 $10.06 $18.69
2024 $3.88 $4.51 $10.25 $19.00
2025 $3.96 $4.84 $10.37 $19.48
2026 $4.05 $5.12 $10.43 $19.84
AverageGrowth Rate
2.2% 3.0% 1.0% 3.7%
^Prices represent delivered prices
5.3.2.1.1 Natural gas supply and availability
Significant natural gas reserves exist, both in the United States and throughout the
North American mainland and coastalregions. Natural gas reserves are mostlydependent
on domesticproduction. Increasingproduction ofnatural gas from the Marcellus shale and
advance drilling technology has lower mining cost contributing to increasesupply which
reducesprice volatility seen in recent years. Recent periods have experiencedgas trading
in the mid $3.30 per MMBtu and the five-year NYMEX Natural Gas forward curve is
projecting the price to remain under $4.00 per MMBtu.
5.3.2.1.2 Natural gas transportation
There are now two transportation companies serving Peninsular Florida, Florida
Gas Transmission Company (FGT) and Gulfstream. Lakeland Electric has
interconnections and service agreements with both companies to provide diversification
and competition in delivery.
5-4

Lakeland Electric
2017 Ten-Year Site Plan Forecasting Methods and Procedures
5.3.2.1.2.1 Florida Gas Transmission Company
FGT is an open access interstate pipeline company transporting natural gas for
third partiesthroughits 5,000-mile pipelinesystemextending from SouthTexasto Miami,
Florida.
The FGT pipeline system accesses a diversity of natural gas supply regions,
including:
Anadarko Basin (Texas, Oklahoma, and Kansas).
Arkona Basin (Oklahoma and Arkansas).
Texas and Louisiana GulfAreas (Gulf of Mexico).
Black Warrior Basin (Mississippi and Alabama).
Louisiana - Mississippi —Alabama Salt Basin.
FGT's total receipt point capacity is in excess of 3.0 billion cubic feet per day and
includes connections with 12 interstate and 12 intrastate pipelines to facilitate transfers of
natural gas into its pipeline system. FGT reports a current delivery capability to Peninsular
Florida of approximately 3.1 billion cubic feet per day.
5.3.2.1.2.2 Florida Gas Transmission market area pipeline system
FGT's total receipt point capacity is in excess of3.0 billion cubic feet per day and
includes connections with 12 interstate and 12 intrastate pipelines to facilitate transfers of
natural gas into its pipeline system. Lakeland Electric currently has in excess of 28,000
MMBtu / day of firm transportation contracted with FGT for natural gas delivery to
Lakeland Electric's generation facilities.
The FGT multiple pipeline system corridor enters the Florida Panhandle in northern
Escambia County and runs easterly to a point in southwestern Clay County, where the
pipeline corridor turns southerly to pass west of the Orlando area. The mainline corridor
then turns to the southeast to a point in southern Brevard County, where it turns south
generally paralleling Interstate Highway 95 to the Miami area. A major lateral line (the St.
Petersburg Lateral) extends from a junction point in southern Orange County westerly to
terminate in the Tampa, St Petersburg, and Sarasota area. A major loop corridor (the West
Leg Pipeline) branches from the mainline corridor in southeastern Suwannee County to run
southward through western Peninsular Florida to connect to the St. Petersburg Lateral
5-5

Lakeland Electric
2017 Ten-Year Site Plan Forecasting Methods and Procedures
system in northeastern Hillsborough County. Each of the above major corridors includes
stretches of multiplepipelines(loops) to provideflow redundancy and transport capability.
Numerous lateral pipelines extend from the major corridors to serve major local
distribution systems and industrial/utility customers.
FGT's Phase VIII Expansion Project came into full operation April 1, 2011. It
consists of approximately 483.2 miles of multi diameter pipeline in Alabama, Mississippi
and Florida with approximately 365.8 miles built parallel to existing pipelines. The project
added 213,600 horsepower of additional mainline compression. One new compressor
station was built in Highlands County, Fla. The project provides an annual average of
820,000 MMBtu/day of additional firm transportation capacity. Currently, Lakeland is
considering purchasing additional pipeline capacity.
'H /•
^LAn Ut >
Florida Goo Transmltslon CompanyMEtMwTrMiitrKMH llMSHMfjsle
STSTBIIrUP
ttUKCr/UCA
ttntlOi
Figure 5-1Florida Gas Transmission Company System Map
5.3.2.1.2.3 Gulfstream pipeline
The Gulfstream pipeline is a 744-mile pipeline originating in the Mobile Bay
region and crossing the Gulf of Mexico to a landfall in Manatee County (south Tampa
Bay). The pipeline supplies Florida with up to 1.1 billion cubic feet of gas per day serving
5-6

Lakeland Electric
2017 Ten-Year Site Plan Forecasting Methods and Procedures
existing and prospective electric generation and industrial projects in southern Florida.
Figure 5-2 showsthe route for the Gulfstream pipeline. Phase I of the pipeline is complete
and ends in Polk County, Florida. The pipeline extends to FP&L's Martin Plant.
Construction for the Gulfstream pipeline began in 2001 and it was placed in service in
May, 2002. Phase II was completed in 2005.
••
J... \
Figure 5-2Gulfstream Natural Gas Pipeline
5.3.2.1.3 Natural gas price forecast
The price forecast for natural gas is based on historical experience and future
expectations for the market. The forecast takes into account the spot purchases of gas to
meet its needs along with its risk management holdings intended to reduce price volatility.
To address the historic volatility of the natural gas market. Lakeland Electric initiated a
formal fuels hedging program in 2003. The Energy Authority (TEA), a company located
in Jacksonville, FL, is Lakeland's consultant assisting in the administration and adjustment
of policies and procedures as well as the oversight of the program.
5-7

Lakeland Electric
2017 Ten-Year Site Plan Forecasting Methods and Procedures
Lakeland purchases "seasonal" gas to supplement the base requirement and
purchase "as needed" daily gas, known commonly as "spot gas", to round out its supply
needs.
Natural gas transportation from FGT is currently supplied under three rates in
FGT's tariff, FTS-1, FTS-2 and FTS-3. Rates in FTS-1 are based on FGT's Phase II
expansion and rates in FTS-2 are based on the Phase III expansion. Rates in FTS-3 are
based on the Phase VIII expansion, which went in service April 1, 2011'. The FTS-1 and
FTS-2 rates have the same reservation rate but the FTS-2 has a $0.10 surcharge added to it
effective February 1, 2016 for sixty-six months as part of the November 2014 rate case
settlement. Rates for the Phase IV, Phase V, and Phase VI are included in the FTS-2 rate
structure. Transportation rates are reflected in Table 5-2. Once the surcharge expires, the
FTS-1 and FTS-2 rate classes will merge as a result of the settlement of FGT's rate case.
Lakeland's rate for FGT transportation decreased on an overall basis as a result of the rate
case lowering the FTS-2 rate which Lakeland owns 67% of its FGT capacity proving a
savings to our ratepayers. The FGT tariff rates became effective, February 1, 2016.
Table 5-2
Natural Gas TariffTransportation Rates
Rate Schedules
Rates
And
Surcharges
FGT
FTS-1
w/surcharges
(cents/DTH)*
FGT
FTS-2
w/surcharges
(cents/DTH)*
**FGT
FTS-3
w/surcharges
(cents/DTH)*
FGT
lTS-1
Gulfstream
FTS-1
Gulfstream
FTS-6%
Reservation
Usage
55.18
1.13
65.18
1.13
132.99
-0.20
94.55
0.00
55.00
0.0213
70.41
0.0068
Total 56.31 66.31 132.79 94.55 55.0213 70.4168
Fuel Charge 3.10% 3.10% 3.10% 3.10% 1.70% 1.70%
* A DTH is equivalent to 1 MMBtu or 1 MCF
** Lakeland does not currently subscribe to any FTS-3 Capacity
Lakeland does not currently subscribe to any FTS-3 capacity.
5-8

Lakeland Electric
2017 Ten-Year Site Plan Forecasting Methods and Procedures
A combination rate of $0.62/MMBtu will be used for purposes of projecting
delivered gas prices, transportation charges applied to existing units as this is the average
cost for Lakeland to obtain natural gas transportation for those units. This average rate is
realized through a current mix of FTS-1, FTS-2 and Gulfstream transportation, including
consideration of Lakeland's ability to relinquish its FTS and Gulfstream transportation or
acquire other firm and interruptible gas transportationon the market.
5.3.2.2 Coal
Coal is a long-standing and reliable fuel used primarily for electric generation.
Lakeland's Mclntosh Unit #3 is a 365 megawatt coal burning generatorplaced into service
in the early 1980's.
5.3.2.2.1 Coal supply and availability
Lakeland's current coal purchase contract equals approximately 100 percent of
Lakeland Electric's annual requirements for calendar 2017. Under normal supply
conditions. Lakeland maintains a 40 - 75 day coal supply reserve (100,000 -150,000 tons).
5.3.2.2.2 Coal transportation
Mclntosh Unit 3 is Lakeland's only unit burning coal. Lakeland projects Mclntosh
Unit 3 will bum approximately 620,000 tons of coal per year. The coal sourcesare located
in southwest Indiana, westem Kentucky, southem Illinois, Pennsylvania, West Virginia,
Tennessee, Alabama and North & South Carolina which affords Lakeland multiple
transportation options by water or a single rail line haul via CSX Transportation. Lakeland
at times may also imports a portion of its coal needs from South American sources,
primarily from the nation ofColombia. Coal transportation for U.S. rail origins is provided
under a contract signed with CSX in January 2017, which expires on December 31, 2019.
5.3.2.2.3 Coal price forecast
Currently, Lakeland's long term purchase of coal for Mclntosh 3 is effective
through December 31,2019. Coal prices are expected to continue increasing this year with
stable IB pricing with modest price increases. The plant is pursuing implanting compliance
5-9

Lakeland Electric
2017 Ten-Year Site Plan Forecasting Methods and Procedures
for the 2018 standards on the Flue Desulfurization (FDG) and effluentlimitation guideline
(ELD) for sulfur, mercury and arsenic to meet EPA regulations.
5.3.2.3 Fuel Oil
5.3.2.3.1 Fuel oil supply and availability
The City of Lakeland obtains all fuel oil through spot market purchases and has no
long-term contracts. This strategy provides the lowest cost for fuel oil consistent with
usage, current price stabilization, and on-site storage. Lakeland's Fuels Section continually
monitors the cost-effectiveness of spot market purchasing.
5.3.2.3.2 Fuei oil transportation
Although the City of Lakeland is not a large consumer of fuel oils, a small amount
is consumed during operations for backup fuel and diesel unit operations. Fuel oil is
transported to Lakeland by truck.
5.3.2.3.3 Fuel oil price forecast
Changes in production levels and methods are placing oil prices at a lower level in
the world market. Lakeland adjusts its oil price forecast to reflect current market pricing
and what the anticipated future price may be.
5.3.3 Fuei Forecast Sensitivities
Lakeland is not presenting specific forecasted fuel price sensitivities.
5-10

Lakeland Electric
2017Ten-YearSite Plan Forecast of Facilities Requirements
6.0 Forecast of Facilities Requirements
6.1 Need for Capacity
This section addresses the need for additional electric capacity to serve Lakeland's
electric customers in the future. The need for capacity is based on Lakeland's load
forecast, reserve margin requirements, power sales contracts, existing generatingand unit
capability and scheduled retirements of generating units,
6.1.1 Load Forecast
The load forecast described in Section 3.0 is used to determine the need for
capacity. A summary of the load forecast for winter and summer peak demand for base
high, and low projections are provided in Section 9.
6.1.2 Reserve Requirements
Prudent utility planning requires that utilities secure firm generating resources
over and above the expected peak system demand to account for unanticipated demand
levels and supply constraints. Several methods of estimating the appropriate level of
reserve capacity are used. A commonly used approach is the reserve margin method,
which is calculated as follows:
svstem net capacitv - svstem net peak demandsystem net peak demand
Lakeland has looked at probabilistic approaches to determine its reliability needs
in the past. These have included indices such as Loss of Load Probability (LOLP) and
Energy Use Efficiency (EUE). Lakeland has found that due to the strength of its
transmission system, assisted LOLP or EUE values were so small that reserves based on
those measures would be nearly non-existent. Conversely, isolated probabilistic values
come out overly pessimistic calling for excessively high levels of reserves due to more
than 50% of Lakeland's capacity being made up by only two units. As a result. Lakeland
has stayed with the reserve margin method based on the equation presented above. When
combined with regular review of unit performance at times of peak. Lakeland finds
reserve margin to be the proper reliability measure for its system.
6-1

Lakeland Electric
2017 Ten-Year Site Plan Forecast of FacilitiesRequirements
Generation availability is reviewed annually and is found to be within industry
standards for the types of units that Lakeland has in its fleet, indicating adequate and
prudent maintenance is taking place. Lakeland's winter and summer reserve margin
target is currently 15%. This complies with the FRCC reserve margin criteria for the
FRCC Region. As Lakeland's needs and fleet of resources continue to change through
time, reserve margin levels will be reviewed and adjusted as appropriate.
6.1.3 Additional Capacity RequirementsBy comparing the load forecast plus reserves with firm supply, the additional
capacity required on a system over time can be identified. Lakeland's requirements for
additional capacity are presented in Tables 6-1 and 6-2 which show the projected
reliability levels for winter and summer base case load demands, respectively.
Lakeland's capacity requirements are driven by the basewinter peak demandforecasts.
The last column of tables 6-1 and 6-2 indicate that using the base winter and
summer forecast. Lakeland will not need any additional capacity in the current ten year
planning cycle.
6-2

Lakeland Electric
2017 Ten-Year Site Plan Forecast of Facilities Requirements
Table 6-1
ProjectedReliabilityLevels- Winter / BaseCase
Year
Net
GeneratingCapacity
(MW)
Net
SystemPurchases
(MW)
Net
SystemSales
(MW)
Net
SystemCapacity
(MW)
System Peak Demand Reserve MarginExcess/ (Deficit) to Maintain
15% Reserve Margin
Before
Interruptibleand Load
Management(MW)
After
Interruptibleand Load
Management(MW)
Before
Interruptibleand Load
Management(%)
After
Interruptibleand Load
Management(%)
Before
Interruptibleand Load
Management(MW)
After
Interruptibleand Load
Management(MW)
2017/18 890 0 0 890 687 687 29.5 29.5 100 100
2018/19 890 0 0 890 695 695 28.1 28.1 91 91
2019/20 890 0 0 890 699 699 27.3 27.3 86 86
2020/21 890 0 0 890 702 702 26.8 26.8 83 83
2021/22 890 0 0 890 710 710 25.4 25.4 74 74
2022/23 890 0 0 890 718 718 24.0 24.0 64 64
2023/24 890 0 0 890 729 729 22.1 22.1 52 52
2024/25 890 0 0 890 735 735 21.1 21.1 45 45
2025/26 890 0 0 890 744 744 19.6 19.6 34 34
2026/27 890 0 0 890 753 753 18.2 18.2 24 24
6-3

Lakeland Electric
2017 Ten-Year Site Plan Forecast of Facilities Requirements
Table 6-2
Projected Reliability Levels - Summer / Base Case
Year
Net
GeneratingCapacity
(MW)
Net
SystemPurchases
(MW)
Net
SystemSales
(MW)
Net
SystemCapacity
(MW)
System Peak Demand Reserve MarginExcess/ (Deficit) to Maintain
15% Reserve Margin
Before
Interruptibleand Load
Management(MW)
After
Interruptibleand Load
Management(MW)
Before
Interruptibleand Load
Management
(%)
After
Interruptibleand Load
Management(%)
Before
Interruptibleand Load
Management(MW)
After
Interruptibleand Load
Management(MW)
2017 844 0 0 844 641 641 31.7 31.7 107 1072018 844 0 0 844 649 649 30.0 30.0 98 982019 844 0 0 844 654 654 29.1 29.1 92 922020 844 0 0 844 659 659 28.1 28.1 86 862021 844 0 0 844 664 664 27.1 27.1 80 802022 844 0 0 844 671 671 25.8 25.8 72 72
2023 844 0 0 844 679 679 24.3 24.3 63 63
2024 844 0 0 844 687 687 22.9 22.9 54 54
2025 844 0 0 844 695 695 21.4 21.4 45 45
2026 844 0 0 844 702 702 20.2 20.2 37 37
6-4

Lakeland Electric Generation Expansion2017 Ten-Year Site Plan Analysis Results and Conclusions
7.0 Generation Expansion
As shown in Section 6 and again in the Tables in Section 9, Lakeland does not have
an immediate capacity need in the current ten-year planning horizon if all existing large
units are available. After Lakeland Electric (LE) retired Mclntosh 1 Steam Unit in
December2015, LE has occasionally purchased capacity when the larger units (i.e.. Unit
5 and Unit 3) were in outages. Short-term deficits were fulfilled from market purchases.
Takingconsideration of maintainingcapacityand adequatereliabilityunder various future
scenarios, LE is continuously evaluating new supply/demand-side options along with
existing resources to provide affordable/economic supply of electrical power for our
ratepayers. In addition, there is slowerthan expected loadgrowth in currentandprojected
future demand of electricity, which is likely due to shifts in customer behavior (voluntary
conservation), increase in government efficiency standards, and limited customer growth
in the Lakeland territory.
7.1 Reliability and Security of Power Supply
The purpose of the Generation Expansion Plan is to maintain a reliable and
affordable power supply portfolio in a system. In the U.S. power systems, 1-in-lO
reliability standard (1 day equivalent of loss of load hours in 10 years) is a well adopted
benchmarkwhile developing a supply portfolio. This reliability benchmark, in most cases,
translates into the requirement of 15% reserve margin in long-term planning. LE is
committed not only to plan for meeting the present energy requirement, but also the
additional 15% reserve capacity. This is needed because the generating resources of the
utility can be in planned or forced outages and existing available resources may not be able
to meet the customers' demand. In that aspect. Lakeland Electric is in an agreement with
other Florida Municipal Power Pool (FMPP) members (i.e., OUC and FMPA), to dispatch
all available members' generating resources to meet the total energy demand and maintain
sufficient capacity, since the reserve margin is an individual member's responsibility.
As far as daily operating reliability is concerned, FRCC, as per the NERC criteria,
requires its member utilities (including LE) to have operating reserve capacity
7-1

Lakeland Electric Generation Expansion2017 Ten-Year Site Plan Analysis Results and Conclusions
(contingency reserves) to maintain the continuous supply and demand balance at all time.
This is required to provide voltage regulation and local system protection as well as to
compensate for load forecast error and equipment outage, as per NERC standard (BAL-
002-0). In this context, FMPP, as a representative for Lakeland Electric, uses power
exchange agreements with other neighboring utilities (such as. Duke Energy, TECO, and
FP&L) encompassing 10 different Balancing Authorities in an emergency (contingency)
condition. This group of utilities is called the Florida Reserve Sharing Group (FRSG)
making the use of the contingency reserve through the network interconnections and
reducingthe riskof not servingindividual native loadrequirement. The FRSGcontingency
reserves are maintained at this greater value to its most severe single contingency. The
FRSG adjusts 102%for the most severe single contingency loss of capacity in Florida (i.e.,
1386MW, Cape Canaveral Unit) and adjusts to 1414MW for contingencyreserve in 2017.
Contingency reservesmay be comprisedof differentgeneratingresources and interruptible
load that are available within 15 minutes after the reportable disturbance. As ofDecember
2016, FMPP and Lakeland Electric's share of contingency reserves was 114 MW and 27
MW, respectively. As a part ofFMPP agreement, each member also plans for the 10% of
the generation reserves over the projected annual peak for the next year.
LakelandElectricensures capacity and energy sufficiencythrough Pool agreements
and comply Reliability Standard (BAL-001-2) through the FRSG agreement with
neighboring utilities to maintain system frequency limits in the Lakeland Electric system.
7-2

Lakeland Electric
2017 Ten-Year Site Plan Environmental and Land Use Information
8.0 Environmental and Land Use Information
Lakeland's 2017 Ten-Year Site Plan has no capacity additions in it and thus no
additional environmental or land use information is required at this time. All existing
units are fully permitted and meet all permitted requirements. Any future additionswould complywith all applicable environmental and land use requirements.
8-1

Lakeland Electric
2017 Ten-Year Site Plan Ten-Year Site PlanSchedules
9.0 Ten-Year Site Plan Schedules
The following section presents the schedules required by the Ten-Year Site Plan
rules for the Florida Public Service Commission. Lakeland has attempted to provide
complete information for the FPSC whenever possible.
9-1

Lakeland Electric
2017 Ten-Year Site Plan Ten-Year Site Plan Schedules
9.1 Abbreviations and DescriptionsThe following abbreviations are used throughout the Ten-Year Site Plan
Schedules.
Abbreviation Descrintion
Unit Type
CA Combined Cycle Steam Part
GT Combustion Gas Turbine
ST Steam Turbine
CT Combined Cycle Combustion Turbine
IC Internal Combustion Engine
Fuel Type
NO Natural Gas
DFO Distillate Fuel Oil
RFO Residual Fuel Oil
BIT Bituminous Coal
WH Waste Heat
Fuel TransportationMethod
PL Pipeline
TK Truck
RR Railroad
Unit Status Code
RE Retired
SB Cold Standby (Reserve)
TS Construction Complete, not yet in commi
U Under Construction
P Planned for installation
9-2
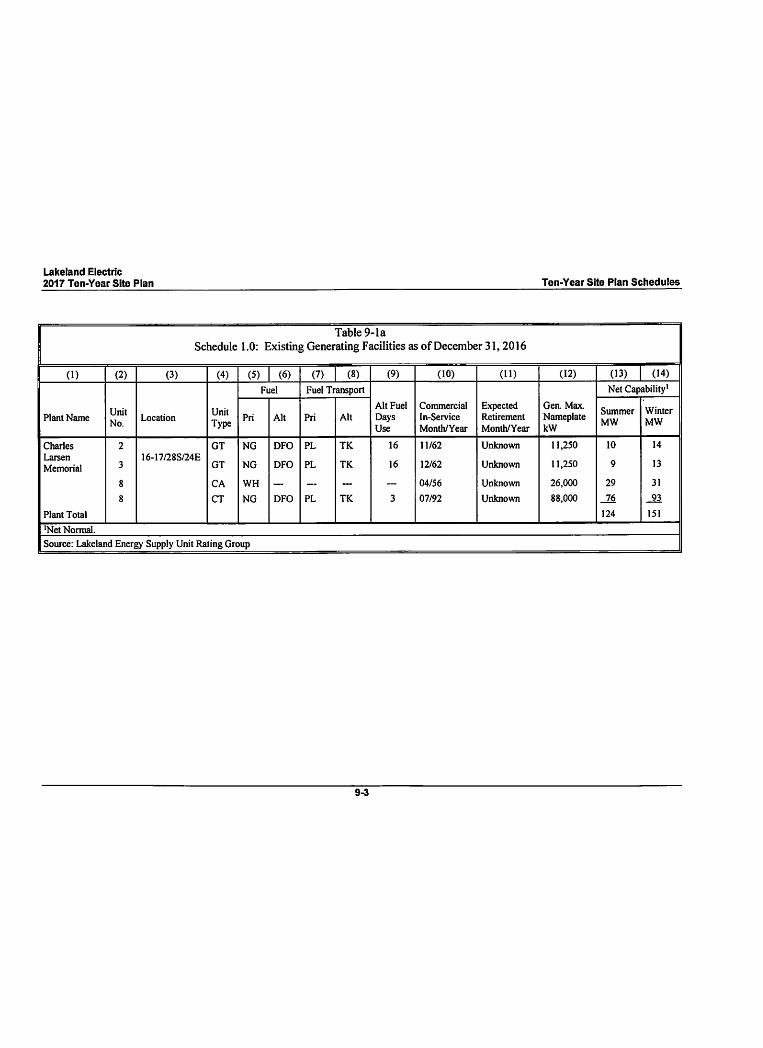
Lakeland Electric
2017 Ten-Year Site Plan
Table 9-la
Schedule 1.0: Existing Generating Facilities as ofDecember 31,2016
Ten-Year Site Plan Schedules
(1) (2) (3) (4) (5) (6) (7) (8) (9) (10) (11) (12) (13) (14)
Fuel Fuel Transport Net Capability'
Plant NameUnit
No.Location
Unit
TypePri Alt Pri Alt
Alt FuelDaysUse
Commercial
In-Service
MonthA'ear
ExpectedRetirement
Month/Year
Gen. Max.
NameplatekW
Summer
MW
Winter
MW
Charles 2 GT NG DFO PL TK 16 11/62 Unknown 11,250 10 14
Larsen
Memorial 316-17/28S/24E
GT NG DFO PL TK 16 12/62 Unknown 11,250 9 13
8 CA WH ...— ~ 04/56 Unknown 26,000 29 31
8 CT NG DFO PL TK 3 07/92 Unknown 88,000 76 93
Plant Total 124 151
'Net Normal.
Source: Lakeland Energy Supply Unit Rating Group
9-3

Lakeland Electric
2017 Ten-Year Site Plan
Table 9-la
Schedule 1.0: Existing Generating Facilities as of December 31,2016
Ten-Year Site Plan Schedules
Fuel" Fuel Transport' Net Capability
Plant NameUnit
No.Location
Unit
Type'Pri Alt Pri Alt
Alt Fuel
Days
Use'
Commercial
In-Service
Month/Year
Expected
Retirement
Month/Year
Gen. Max.
Nameplate
kW
Summer
MW
Winter
MW
Winston
Peaking Station1-20 21/28S/23E IC DFO — TK •— NR 12/01 Unknown 2,500 each 50 50
Plant Total 50 50
C.D. Mclntosh,Jr.
D1 4-5/28S/24E IC DFO ... TK~ NR 01/70 Unknown 2,500 2.5 2.5
D2 IC DFO ... TK NR 01/70 Unknown 2,500 2.5 2.5
GTl GT NG DFO PL TK NR 05/73 Unknown 20,000 16 19
2 ST NG RFO PL TK 14 06/76 Unknown 114,700 106 106
3' ST BIT ~ RR TK NR 09/82 Unknown 219,000 205 205
5 CT NG — PL ._ NR 05/01 Unknown 245,000 213 233
5 CA WH-- — NR 05/02 Unknown 120,000 125 121
Plant Total 670 689
System Total 844 890
'Lakeland's 60 percent portion ofjointownership with Orlando Utilities Commission.^Lakeland doesnotmaintain records of thenumber ofdaysthatalternate fuel is used.
'Unit TypeCA Combined Cycle Steam Part
CT Combined Cycle Combustion Turbine
GT Combustion Gas Turbine
ST Steam Turbine
"Fuel Type
DFO Distillate Fuel Oil
RFO Residual Fuel Oil
BIT Bituminous Coal
WH Waste Heat
'Fuel Transportation MethodPL Pipeline
TK Truck
RR Railroad
NG Natural Gas
9^

Lakeland Electric
2017 Ten-Year Site Plan Ten-Year Site Pian Schedules
Table 9-2
Schedule2.1: History and Forecastof EnergyConsumptionand Number of Customersby CustomerClass
(I) (2) (3) (4) (5) (6) (7) (8) (9)
Rural & Residential Commercial
Year PopulationMembers per
Household GWh
Average No. ofCustomers
Average kWhConsumptionper Customer GWh
Average No.of Customers
Average kWhConsumptionper Customer
2007 253,027 2.52 1,444 100,524 14,365 781 11,898 65,641
2008 252,731 2.51 1,383 100,739 13,729 762 11,914 63,958
2009 253,084 2.51 1,417 100,641 14,080 749 11,836 63,282
2010 253,009 2.51 1,530 100,719 15,191 753 11,806 63,781
2011 260,567 2.59 1,437 100,784 14,258 744 11,786 63,126
2012 262,288 2.59 1,343 101,252 13,264 727 11,765 61,793
2013 264,023 2.59 1,368 101,968 13,416 742 11,864 62,542
2014 271,379 2.63 1,400 103,099 13,579 752 12,022 62,552
2015 274,861 2.63 1,468 104,581 14,037 789 12,157 64,901
2016 279,331 2.64 1,473 105,932 13,905 795 12,225 65,031
Forecast
2017 283,472 2.64 1,457 107,259 13,584 815 12,407 65,689
2018 287,668 2.65 1,475 108,701 13,569 830 12,560 66,083
2019 291,914 2.65 1,490 110,207 13,520 841 12,685 66,299
2020 296,178 2.65 1,493 111,744 13,361 849 12,772 66,474
2021 300,389 2.65 1,506 113,281 13,294 860 12,847 66,942
2022 304,545 2.65 1,522 114,791 13,259 874 12,932 67,584
2023 308,683 2.65 1,540 116,273 13,245 890 13,026 68,325
2024 312,795 2.66 1,560 117,742 13,249 906 13,117 69,071
2025 316,869 2.66 1,580 119,201 13,255 922 13,206 69,817
2026 320,923 2.66 1.600 120,646 13,262 937 13,296 70,472
9-5

Lakeland Electric2017 Ten-Year Site Plan Ten-Year Site Plan Schedules
Table 9-3
Schedule2.2: Historyand Forecastof Energy Consumptionand Number of Customersby CustomerClass
(1) (2) (3) (4) (5) (6) (7) (8)
IndustrialOther Sales to Public
Authorities
GWh
Total Sales to Ultimate
Consumers
GWhYear GWh
Average No. ofCustomers
Average kWhConsumption per
Customer
Railroads and
RailwaysHighwayLighting
GWh
2007
2008
2009
2010
2011
2012
2013
2014
2015
2016
615
607
590
581
578
579
618
649
670
655
88
87
84
84
86
81
79
77
76
74
6,988,636
6,977,011
7,023,810
6,916,667
6,720,930
7,148,148
7,822,785
8,428,571
8,815,789
8,851,351
0
0
0
0
0
0
0
0
0
0
31
32
33
33
33
33
33
33
34
34
77
74
71
69
73
70
70
70
73
73
2,949
2.859
2.860
2,966
2,864
2,751
2,831
2,903
3,034
3,030
Forecast
2017
2018
2019
2020
2021
2022
2023
2024
2025
2026
672
685
695
699
703
710
717
725
732
739
74
75
76
76
76
77
77
77
78
78
9,081,081
9,133,333
9,144,737
9,197,368
9,250,000
9,220,779
9,311,688
9,415,584
9,384,615
9,474,359
0
0
0
0
0
0
0
0
0
0
34
34
34
34
35
35
35
35
35
35
73
73
73
73
74
74
74
75
75
75
3,051
3,097
3,134
3,148
3,177
3,215
3,256
3,301
3,343 13,386 1
9-6

Lakeland Electric
2017 Ten-Year Site Plan Ten-Year Site Plan Schedules
Table 9-4
Schedule 2.3: History and Forecast ofEnergy Consumption and Number ofCustomers by Customer Class
(1) (2) (3) (4) (5) (6)
Year
Wholesale Purchases
for ResaleGWH
Wholesale Sales for
Resale
GWH
Net Energy for LoadGWh
Other Customers
(Average No.) Total No. of Customers
2007 0 0 3,068 9,869 122,379
2008 0 0 2,975 9,685 122,425
2009 0 0 2,992 9,430 121,991
2010 0 0 3,118 9,207 121,815
2011 0 0 2,893 9,070 121,725
2012 0 0 2,873 8,953 122,050
2013 0 0 2,919 8,892 122,803
2014 0 0 3,006 8,820 124,019
2015 0 0 3,126 8,860 125,674
2016 0 0 3,116 8,921 127,152
Forecast
2017 0 0 3,151 8,920 128,660
2018 0 0 3,198 8,945 130,281
2019 0 0 3,236 8,979 131,946
2020 0 0 3,251 9,012 133,605
2021 0 0 3,281 9,046 135,250
2022 0 0 3,320 9,080 136,880
2023 0 0 3,363 9,115 138,491
2024 0 0 3,409 9,149 140,085
2025 0 0 3,452 9,184 141,669
2026 0 0 3,497 9,219 143,240
9-7

Lakeland Electric
2017 Ten-Year Site Plan Ten-Year Site Plan Schedules
Table 9-5
Schedule3.1: Historyand Forecastof Summer Peak Demand Base Case (MW)
(1) (2) (3) (4) (5) (6) (7) (8) (9) (10)
Residential Commercial/IndustrialNet Firm
DemandYear Total Wholesale Retail Interrupt. Load
ManagementConservation
Load
ManagementConservation
2007 648 0 648 0 0 0 0 0 648
2008 615 0 615 0 0 0 0 0 615
2009 625 0 625 0 0 0 0 0 625
2010 638 0 638 0 0 0 0 0 638
2011 611 0 611 0 0 0 0 0 611
2012 590 0 590 0 0 0 0 0 590
2013 602 0 602 0 0 0 0 0 602
2014 627 0 627 0 0 0 0 0 627
2015 630 0 630 0 0 0 0 0 630
2016 646 0 646 0 0 0 0 0 646
Forecast
2017 641 0 641 0 0 0 0 0 641
2018 649 0 649 0 0 0 0 0 649
2019 654 0 654 0 0 0 0 0 654
2020 659 0 659 0 0 0 0 0 659
2021 664 0 664 0 0 0 0 0 664
2022 671 0 671 0 0 0 0 0 671
2023 679 0 679 0 0 0 0 0 679
2024 687 0 687 0 0 0 0 0 687
2025 695 0 695 0 0 0 0 0 695
2026 702 0 702 0 0 0 0 0 702
9-8

Lakeland Electric
2017 Ten-Year Site Plan Ten-Year Site Plan Schedules
Table 9-5a
Schedule 3.1a: History and Forecast of Summer Peak Demand Low Case (MW)
(1) (2) (3) (4) (5) (6) (7) (8) (9) (10)
Residential Commercial/IndustrialNet Firm
DemandYear Total Wholesale Retail Interrupt. Load
ManagementConservation
Load
ManagementConservation
2007 648 0 648 0 0 0 0 0 648
2008 615 0 615 0 0 0 0 0 615
2009 625 0 625 0 0 0 0 0 625
2010 638 0 638 0 0 0 0 0 638
2011 611 0 611 0 0 0 0 0 611
2012 590 0 590 0 0 0 0 0 590
2013 602 0 602 0 0 0 0 0 602
2014 627 0 627 0 0 0 0 0 627
2015 630 0 630 0 0 0 0 0 630
2016 646 0 646 0 0 0 0 0 646
Forecast
2017 638 0 638 0 0 0 0 0 638
2018 645 0 645 0 0 0 0 0 645
2019 651 0 651 0 0 0 0 0 651
2020 655 0 655 0 0 0 0 0 655
2021 660 0 660 0 0 0 0 0 660
2022 667 0 667 0 0 0 0 0 667
2023 675 0 675 0 0 0 0 0 675
2024 683 0 683 0 0 0 0 0 683
2025 690 0 690 0 0 0 0 0 690
2026 698 0 698 0 0 0 0 0 698
9-9

Lakeland Electric
2017 Ten-Year Site Plan Ten-Year Site Plan Schedules
Table 9-5b
Schedule 3.1b: Hlstor>' and Forecast of Summer Peak Demand High Case (MW)
(1) (2) (3) (4) (5) (6) (7) (8) (9) (10)
Residential Commercial/1ndustrialNet Firm
DemandYear Total Wholesale Retail Interrupt. Load
ManagementConservation
Load
ManagementConservation
2007 648 0 648 0 0 0 0 0 648
2008 615 0 615 0 0 0 0 0 615
2009 625 0 625 0 0 0 0 0 625
20)0 638 0 638 0 0 0 0 0 638
2011 611 0 611 0 0 0 0 0 611
2012 590 0 590 0 0 0 0 0 590
2013 602 0 602 0 0 0 0 0 602
2014 627 0 627 0 0 0 0 0 627
2015 630 0 630 0 0 0 0 0 630
2016 646 0 646 0 0 0 0 0 646
Forecast
2017 642 0 642 0 0 0 0 0 642
2018 650 0 650 0 0 0 0 0 650
2019 656 0 656 0 0 0 0 0 656
2020 660 0 660 0 0 0 0 0 660
2021 665 0 665 0 0 0 0 0 665
2022 672 0 672 0 0 0 0 0 672
2023 680 0 680 0 0 0 0 0 680
2024 688 0 688 0 0 0 0 0 688
2025 696 0 696 0 0 0 0 0 696
2026 704 0 704 0 0 0 0 0 704
9-10

Lakeland Electric
2017 Ten-Year Site Plan Ten-Year Site Plan Schedules
Schedule 3.2
Table 9-6
History and Forecast ofWinter Peak Demand Base Case (MW)
(1) (2) (3) (4) (5) (6) (7) (8) (9) (10)
Residential Comm./Ind.Net FirmDemandYear Total Wholesale Retail Interrupt. Load
ManagementConservation
Load
ManagementConservation
2007/08 684 0 684 0 0 0 0 0 684
2008/09 710 0 710 0 0 0 0 0 710
2009/10 804 0 804 0 0 0 0 0 804
2009/10 665 0 665 0 0 0 0 0 665
2011/12 612 0 612 0 0 0 0 0 612
2012/13 553 0 553 0 0 0 0 0 553
2013/14 579 0 579 0 0 0 0 0 579
2014/15 656 0 656 0 0 0 0 0 656
2015/16 589 0 589 0 0 0 0 0 589
2016/17 677 0 677 0 0 0 0 0 677
Forecast
2017/18 687 0 687 0 0 0 0 0 687
2018/19 695 0 695 0 0 0 0 0 695
2019/20 699 0 699 0 0 0 0 0 699
2020/21 702 0 702 0 0 0 0 0 702
2021/22 710 0 710 0 0 0 0 0 710
2022/23 718 0 718 0 0 0 0 0 718
2023/24 729 0 729 0 0 0 0 0 729
2024/25 735 0 735 0 0 0 0 0 735
2025/26 744 0 744 0 0 0 0 0 744
2026/27 753 0 753 0 0 0 0 0 753
9-11

Lakeland Electric2017 Ten-Year Site Plan Ten-Year Site Plan Schedules
Table 9-6a
Schedule 3.2a: History and Forecast of Winter Peak Demand Low Case (MW)
(1) (2) (3) (4) (5) (6) (7) (8) (9) (10)
Residential Comm./Ind.Net Firm
DemandYear Total Wholesale Retail Interrupt. Load
ManagementConservation
Load
Management Conservation
2007/08 684 0 684 0 0 0 0 0 684
2008/09 710 0 710 0 0 0 0 0 710
2009/10 804 0 804 0 0 0 0 0 804
2009/10 665 0 665 0 0 0 0 0 665
2011/12 612 0 612 0 0 0 0 0 612
2012/13 553 0 553 0 0 0 0 0 553
2013/14 579 0 579 0 0 0 0 0 579
2014/15 656 0 656 0 0 0 0 0 656
2015/16 589 0 589 0 0 0 0 0 589
2016/17 672 0 672 0 0 0 0 0 672
Forecast
2017/18 682 0 682 0 0 0 0 0 682
2018/19 690 0 690 0 0 0 0 0 690
2019/20 694 0 694 0 0 0 0 0 694
2020/21 697 0 697 0 0 0 0 0 697
2021/22 705 0 705 0 0 0 0 0 705
2022/23 713 0 713 0 0 0 0 0 713
2023/24 724 0 724 0 0 0 0 0 724
2024/25 730 0 730 0 0 0 0 0 730
2025/26 738 0 738 0 0 0 0 0 738
2026/27 747 0 747 0 0 0 0 0 747
9-12

Lakeland Electric
2017 Ten-Year Site Pian Ten-Year Site Pian Schedules
Table 9-6b
Schedule 3.2b: History and Forecast ofWinter Peak Demand High Case (MW)
(1) (2) (3) (4) (5) (6) (7) (8) (9) (10)
Residential Cotnm./lnd.Net Firm
DemandYear Total Wholesale Retail Interrupt. Load
ManagementConservation
Load
ManagementConservation
2007/08 684 0 684 0 0 0 0 0 684
2008/09 710 0 710 0 0 0 0 0 710
2009/10 804 0 804 0 0 0 0 0 804
2009/10 665 0 665 0 0 0 0 0 665
2011/12 612 0 612 0 0 0 0 0 612
2012/13 553 0 553 0 0 0 0 0 553
2013/14 579 0 579 0 0 0 0 0 579
2014/15 656 0 656 0 0 0 0 0 656
2015/16 589 0 589 0 0 0 0 0 589
2016/17 678 0 678 0 0 0 0 0 678
Forecast
2017/18 688 0 688 0 0 0 0 0 688
2018/19 696 0 696 0 0 0 0 0 696
2019/20 700 0 700 0 0 0 0 0 700
2020/21 704 0 704 0 0 0 0 0 704
2021/22 711 0 711 0 0 0 0 0 711
2022/23 720 0 720 0 0 0 0 0 720
2023/24 731 0 731 0 0 0 0 0 731
2024/25 737 0 737 0 0 0 0 0 737
2025/26 745 0 745 0 0 0 0 0 745
2026/27 754 0 754 0 0 0 0 0 754
9-13
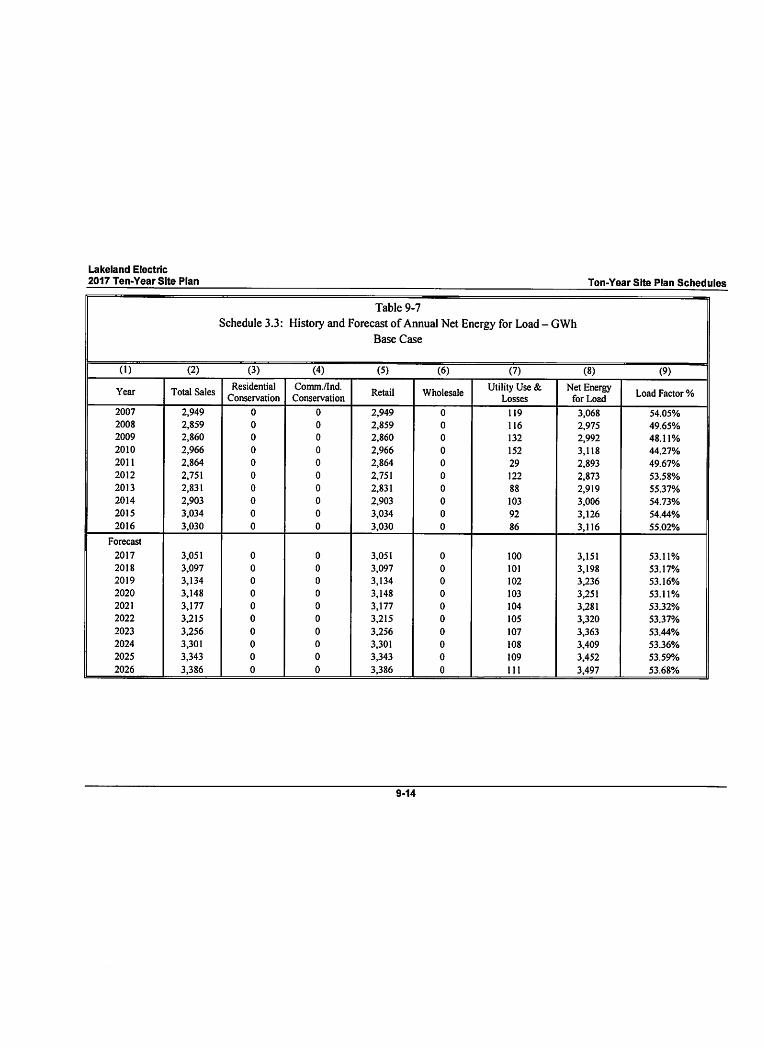
Lakeland Electric2017 Ten-Year Site Plan Ten-Year Site Plan Schedules
Schedule 3.3:
Table 9-7
Historyand Forecastof Annual Net Energyfor Load- GWhBase Case
(1) (2) (3) (4) (5) (6) (7) (8) (9)
Year Total SalesResidential
Conservation
Comm./Ind.
ConservationRetail Wholesale
Utility Use &Losses
Net Energyfor Load
Load Factor %
2007
2008
2009
2010
2011
2012
2013
2014
2015
2016
2,949
2.859
2.860
2,966
2,864
2,751
2,831
2,903
3,034
3,030
0
0
0
0
0
0
0
0
0
0
0
0
0
0
0
0
0
0
0
0
2,949
2.859
2.860
2,966
2,864
2,751
2,831
2,903
3,034
3,030
0
0
0
0
0
0
0
0
0
0
119
116
132
152
29
122
88
103
92
86
3,068
2,975
2.992
3,118
2,893
2,873
2,919
3,006
3,126
3,116
54.05%
49.65%
48.11%
44.27%
49.67%
53.58%
55.37%
54.73%
54.44%
55.02%
Forecast
2017
2018
2019
2020
2021
2022
2023
2024
2025
2026
3,051
3,097
3,134
3,148
3,177
3,215
3,256
3,301
3,343
3,386
0
0
0
0
0
0
0
0
0
0
0
0
0
0
0
0
0
0
0
0
3,051
3,097
3,134
3,148
3,177
3,215
3,256
3,301
3,343
3,386
0
0
0
0
0
0
0
0
0
0
100
101
102
103
104
105
107
108
109
111
3,151
3,198
3,236
3,251
3,281
3,320
3,363
3,409
3,452
3,497
53.11%
53.17%
53.16%
53.11%
53.32%
53.37%
53.44%
53.36%
53.59%
53.68%
9-14

Lakeland Electric
2017 Ten-Year Site Plan Ten-Year Site Plan Schedules
Table 9-7a
Schedule 3.3a: History and Forecast ofAnnual Net Energy for Load - GWhLow Case
(1) (2) (3) (4) (5) (6) (7) (8)
Year Total SalesResidential
Conservation
ComnL/Ind.
ConservationRetail Wholesale
Utility Use &Losses
Net Energy for Load
2007
2008
2009
2010
2011
2012
2013
2014
2015
2016
2,949
2.859
2.860
2,966
2,864
2,751
2,831
2,903
3,034
3,030
0
0
0
0
0
0
0
0
0
0
0
0
0
0
0
0
0
0
0
0
2,949
2.859
2.860
2,9662,864
2,751
2,831
2,903
3,034
3,030
0
0
0
0
0
0
0
0
0
0
119
116
132
152
29
122
88
103
92
86
3,068
2,975
2,992
3,118
2,893
2,873
2,919
3,006
3,126
3,116
Forecast
2017
2018
2019
2020
2021
2022
2023
2024
2025
2026
3,032
3,078
3,114
3,128
3,157
3,195
3,235
3,280
3,321
3,364
0
0
0
0
0
0
0
0
0
0
0
0
0
0
0
0
0
0
0
0
3,032
3,078
3,114
3,128
3,157
3,195
3,235
3,280
3,321
3,364
0
0
0
0
0
0
0
0
0
0
99
100
101
102
103
104
106
107
109
110
3,131
3,178
3,215
3,230
3,2603,299
3,341
3,387
3,430
3,474
9-15

Lakeland Electric
2017 Ten-Year Site Plan Ten-Year Site Plan Schedules
Table 9-7b
Schedule 3.3b: History and Forecast ofAnnual Net Energy for Load - GWhHigh Case
(1) (2) (3) (4) (5) (6) (7) (8)
Year Total SalesResidential
Conservation
Comm./Ind.
ConservationRetail Wholesale
Utility Use &Losses
Net Energy for Load
2007
2008
2009
2010
2011
2012
2013
2014
2015
2016
2,949
2.859
2.860
2,966
2,864
2,751
2,831
2,903
3,034
3,030
0
0
0
0
0
0
0
0
0
0
0
0
0
0
0
0
0
0
0
0
2,949
2.859
2.860
2,966
2,864
2,751
2,831
2,903
3,034
3,030
0
0
0
0
0
0
0
0
0
0
119
116
132
152
29
122
88
103
92
86
3,068
2,975
2,992
3,118
2,893
2,873
2,919
3,006
3,126
3,116
Forecast
2017
2018
2019
2020
2021
2022
2023
2024
2025
2026
3,070
3,117
3,153
3,169
3,198
3,236
3,277
3,323
3,365
3,408
0
0
0
0
0
0
0
0
0
0
0
0
0
0
0
0
0
0
0
0
3,070
3,117
3,153
3,169
3,198
3,236
3,277
3,323
3,365
3,408
0
0
0
0
0
0
0
0
0
0
101
101
103
103
104
106
107
108
110
112
3,171
3,218
3,256
3,272
3,302
3,342
3,384
3,431
3,475
3,520
9-16

Lakeland Electric
2017 Ten-Year Site Plan Ten-Year Site Plan Schedules
Table 9-8
Schedule 4: Previous Year and Two Year Forecast of Retail Peak Demand and Net Energy for Load by Month
(1)
Month
January
February
March
April
May
June
July
August
September
October
November
December
(2)Actual
Peak Demand'MW
589
564
495
556
566
622
646
646
598
579
441
455
'Includes Conservation
(3)
NEL GWh
235
221
234
235
273
297
319
310
292
258
214
228
(4) (5)2017 Forecast
Peak Demand' MW
677
570
478
537
595
624
641
635
605
568
458
498
9-17
NEL GWh
249
207
236
246
291
293
305
315
284
259
220
246
(6) (7)2018 Forecast
Peak Demand' MW
687
578
485
543
602
631
649
643
613
575
466
507
NEL GWh
252
210
239
250
295
297
310
319
289
263
224
250
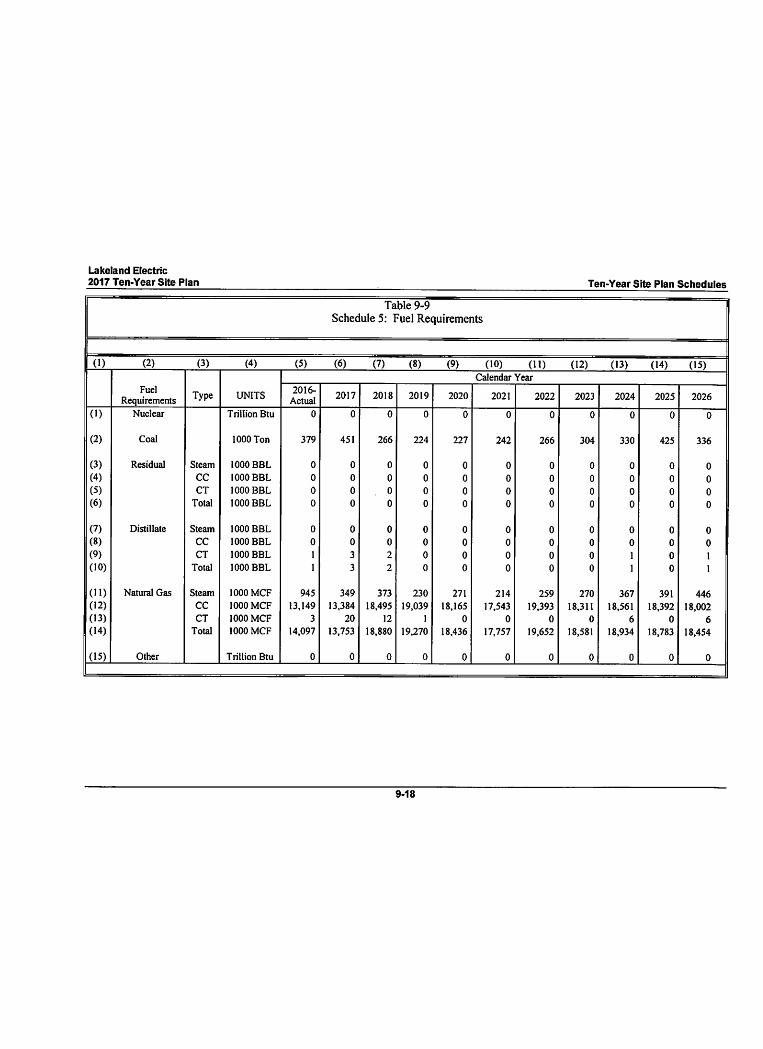
Lakeland Electric
2017 Ten-Year Site Plan Ten-Year Site Plan Schedules
Table 9-9
Schedule 5: Fuel Requirements
(1) (2) (3) (4) (5) (6) (7) (8) (9) (10) (11) (12) (13) (14) (15)Calendar Year
Fuel
Requirements Type UMTS2016-
Actual2017 2018 2019 2020 2021 2022 2023 2024 2025 2026
(1) Nuclear Trillion Btu 0 0 0 0 0 0 0 0 0 0 0
(2) Coal 1000 Ton 379 451 266 224 227 242 266 304 330 425 336
(3)
(4)(5)
(6)
Residual Steam
CO
CT
Total
1000 BBL
1000 BBL
1000 BBL
1000 BBL
0
0
0
0
0
0
0
0
0
0
0
0
0
0
0
0
0
0
0
0
0
0
0
0
0
0
0
0
0
0
0
0
0
0
0
0
0
0
0
0
0
0
0
0
(7)(8)
(9)(10)
Distillate Steam
CO
CT
Total
1000 BBL
1000 BBL
1000 BBL
1000 BBL
0
0
1
1
0
0
3
3
0
0
2
2
0
0
0
0
0
0
0
0
0
0
0
0
0
0
0
0
0
0
0
0
0
0
1
1
0
0
0
0
0
0
1
1
(11)(12)
(13)(14)
Natural Gas Steam
CC
CT
Total
1000 MCF
1000 MCF
1000 MCF
1000 MCF
945
13,149
3
14,097
349
13,384
20
13,753
373
18,495
12
18,880
230
19,039
1
19,270
271
18,165
0
18,436
214
17,543
0
17,757
259
19,393
0
19,652
270
18,311
0
18,581
367
18,561
6
18,934
391
18,392
0
18,783
446
18,002
6
18,454
(15) Other Trillion Btu 0 0 0 0 0 0 0 0 0 0 0
9-18

Lakeland Electric
2017 Ten-Year Site Plan Ten-Year Site Plan Schedules
Table 9-10
Schedule 6.1: Energy Sources
(1) (2) (3) (4) (5) (6) (7) (8) (9) (10) (11) (12) (13) (14) (15)
Calendar Year
Energy Sources Type UNITS2016-
Actual2017 2018 2019 2020 2021 2022 2023 2024 2025 2026
(1)
(2)
(3)
Inter-Regional Interchange
Nuclear
Coal
GWh
GWh
GWh
0
0
805
0
0
1009
0
0
593
0
0
492
0
0
504
0
0
533
0
0
600
0
0
685
0
0
746
0
0
964
0
0
763
(4)
(5)
(6)
(7)
Residual Steam
CO
CT
Total
GWh
GWh
GWh
GWh
0
0
0
0
0
0
0
0
0
0
0
0
0
0
0
0
0
0
0
0
0
0
0
0
0
0
0
0
0
0
0
0
0
0
0
0
0
0
0
0
0
0
0
0
(8)
(9)
(10)
(11)
Distillate Steam
CO
CT
Total
GWh
GWh
GWh
GWh
0
0
0
0
0
0
2
2
0
0
1
1
0
0
0
0
0
0
0
0
0
0
0
0
0
0
0
0
0
0
0
0
0
0
1
1
0
0
0
0
0
0
0
0
(12)
(13)
(14)
(15)
(16)(17)
(18)
(19)
Natural Gas
NUG
Solar
Other(Specify)'Net Energy for Load
Steam
CC
CT
Total
GWh
GWh
GWh
GWh
GWh
64
1793
0
1,857
0
24
430
3,116
28
1939
I
1,968
0
39
133
3,151
31
2696
1
2,7280
39
-163
3,198
18
2779
0
2,7970
39
-92
3,236
21
2648
0
2,669
0
39
39
3,251
17
2556
0
2,573
0
39
136
3,281
21
2828
0
2,849
0
39
-168
3,320
22
2668
0
2,690
0
39
-51
3,363
31
2702
0
2,733
0
39
-110
3,409
32
2664
0
2,696
0
39
-247
3,452
38
2605
0
2643
0
39
52
3,497
' Intra-Regional Net Interchange
9-19
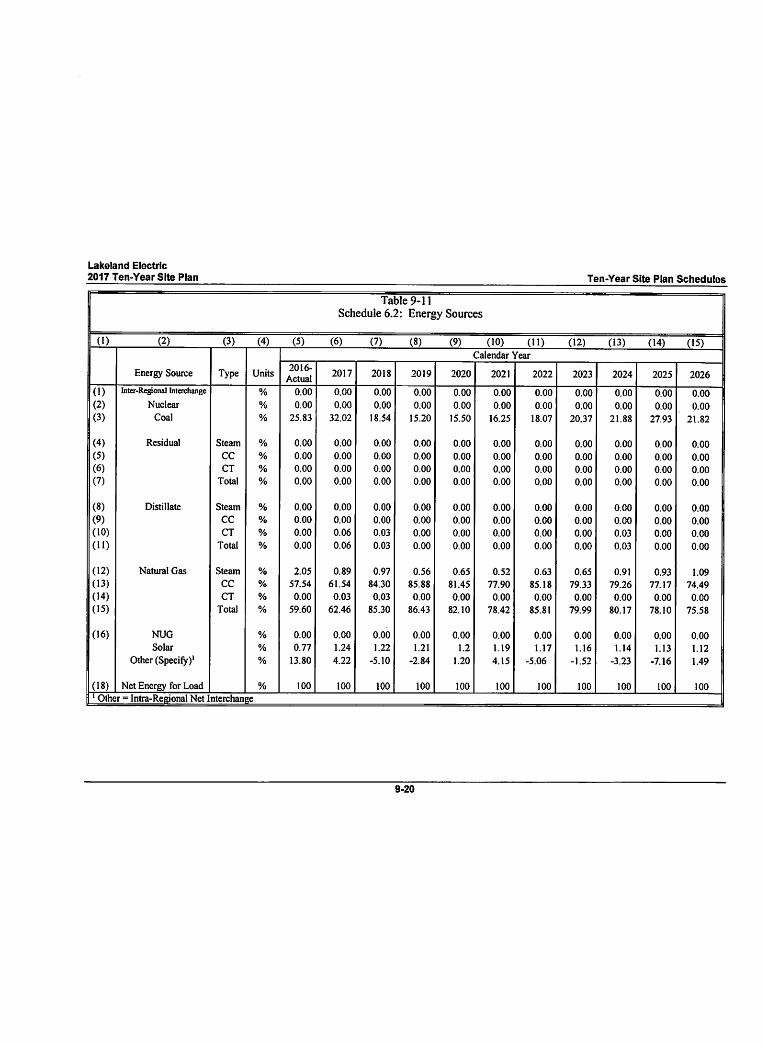
Lakeland Electric
2017 Ten-Year Site Plan Ten-Year Site Plan Schedules
Table 9-11
Schedule 6.2: Energy Sources
(1) (2) (3) (4) (5) (6) (7) (8) (9) (10) (11) (12) (13) (14) (15)
Calendar Year
Energy Source Type Utiits2016-
Actual2017 2018 2019 2020 2021 2022 2023 2024 2025 2026
(1)(2)(3)
Inter-Re^^onalInterchange
Nuclear
Coal
%
%
%
0.00
0.00
25.83
0.00
0.00
32.02
0.00
0.00
18.54
0.00
0.00
15.20
0.00
0.00
15.50
0.00
0.00
16.25
0.00
0.00
18.07
0.00
0.00
20.37
0.00
0.00
21.88
0.00
0.00
27.93
0.00
0.00
21.82
(4)
(5)(6)(7)
Residual Steam
CC
CT
Total
%
%
%
%
0.00
0.00
0.00
0.00
0.00
0.00
0.00
0.00
0.00
0.00
0.00
0.00
0.00
0.00
0.00
0.00
0.00
0.00
0.00
0.00
0.00
0.00
0.00
0.00
0.00
0.00
0.00
0.00
0.00
0.00
0.00
0.00
0.00
0.00
0.00
0.00
0.00
0.00
0.00
0.00
0.00
0.00
0.00
0.00
(8)(9)(10)
(11)
Distillate Steam
CC
CT
Total
%
%
%
%
0.00
0.00
0.00
0.00
0.00
0.00
0.06
0.06
0.00
0.00
0.03
0.03
0.00
0.00
0.00
0.00
0.00
0.00
0.00
0.00
0.00
0.00
0.00
0.00
0.00
0.00
0.00
0.00
0.00
0.00
0.00
0.00
0.00
0.00
0.03
0.03
0.00
0.00
0.00
0.00
0.00
0.00
0.00
0.00
(12)
(13)
(14)
(15)
Natiual Gas Steam
CC
CT
Total
%
%
%
%
2.05
57.54
0.00
59.60
0.89
61.54
0.03
62.46
0.97
84.30
0.03
85.30
0.56
85.88
0.00
86.43
0.65
81.45
0.00
82.10
0.52
77.90
0.00
78.42
0.63
85.18
0.00
85.81
0.65
79.33
0.00
79.99
0.91
79.26
0.00
80.17
0.93
77.17
0.00
78.10
1.09
74.49
0.00
75.58
(16) NUG
Solar
Other (Specify)'
%
%
%
0.00
0.77
13.80
0.00
1.24
4.22
0.00
1.22
-5.10
0.00
1.21
-2.84
0.00
1.2
1.20
0.00
1.19
4.15
0.00
1.17
-5.06
0.00
1.16
-1.52
0.00
1.14
-3.23
0.00
1.13
-7.16
0.00
1.12
1.49
(18) Net Energy for Load % 100 100 100 100 100 100 100 100 100 100 100
' Other = Intra-Regional Net Interchange
9-20

Lakeland Electric
2017 Ten-Year Site Plan Ten-Year Site Plan Schedules
Table 9-12
Schedule 7.1: Forecastof Capacity, Demand,and ScheduledMaintenanceat Time of Summer Peak
(1) (2) (3) (4) (5) (6) (7) (8) (9) (10) (11) (12)
Projected SystemTotal Firm Firm Firm Net Total Firm
Installed Capacity Capacity To Grid Capacity Peak Reserve Margin Scheduled Reserve Margin AfterYear Capacity Import Export fromNUG Available Demand Before Maintenance' Maintenance Maintenance'
MW MW MW MW MW MW MW % MW MW %
2017 844 0 0 0 844 641 203 32 0 203 32
2018 844 0 0 0 844 649 195 30 0 195 30
2019 844 0 0 0 844 654 190 29 0 190 29
2020 844 0 0 0 844 659 185 28 0 185 28
2021 844 0 0 0 844 664 180 27 0 180 27
2022 844 0 0 0 844 671 173 26 0 173 26
2023 844 0 0 0 844 679 165 24 0 165 24
2024 844 0 0 0 844 687 157 23 0 157 23
2025 844 0 0 0 844 695 149 21 0 149 21
2026 844 0 0 0 844 702 142 20 0 142 20
'Includes Conservation
9-21

Lakeland Electric2017 Ten-Year Site Plan Ten-Year Site Plan Schedules
Table 9-13
Schedule 7,2: Forecast ofCapacity, Demand, and Scheduled Maintenance at Time of Winter Peak
(1) (2) (3) (4) (5) (6) (7) (8) (9) (10) (11) (12)
Projected SystemTotal Firm Firm Firm Net Total Firm
Installed Capacity Capacity To Grid Capacity Peak Reserve Margin Scheduled Reserve Margin AfterYear Capacity Import Export fromNUG Available Demand Before Maintenance' Maintenance Maintenance'
MW MW MW MW MW MW MW % MW MW %
2017/18 890 0 0 0 890 687 203 30 0 203 30
2018/19 890 0 0 0 890 695 195 28 0 195 28
2019/20 890 0 0 0 890 699 191 27 0 191 27
2020/21 890 0 0 0 890 702 188 27 0 188 27
2021/22 890 0 0 0 890 710 180 25 0 180 25
2022/23 890 0 0 0 890 718 172 24 0 172 24
2023/24 890 0 0 0 890 729 161 22 0 161 22
2024/25 890 0 0 0 890 735 155 21 0 155 21
2025/26 890 0 0 0 890 744 146 20 0 146 20
2026/27 890 0 0 0 890 753 137 18 0 137 18
'Includes Conservation
9-22

Lakeland Electric2017 Ten-Year Site Plan Ten-Year Site Plan Schedules
Table 9-14
Schedule 8.0: Planned and Prospective Generating Facility Additions and Changes
(1) (2) (3) (4) (5) (6) (7) (8) (9) (10) (11) (12) (13) (14) (15)
Plant
Name
Unit
No.Location
Unit
TypeFuel
Fuel
TransportConst
Start
Commercial
In-Service
ExpectedRetirement
Gen Max
NameplateNet Capability Status
Pri. Alt. Pri. Alt. Mo/Yr MoA'r Mo/Yr kW SumMW WinMW
None At Time ofThis Filing
9-23

Lakeland Electric
2017 Ten-Year Site Plan Ten-Year Site Plan Schedules
Table 9-15
Schedule9.1: Status Report and Specifications of Approved GeneratingFacilities
(1) Plant Name and Unit Number: N/A
(2) Capacity:
(3) Summer MW
(4) Winter MW
(5) Technology Type:
(6) Anticipated Construction Timing:
(7) Field Construction Start-date:
(8) Commercial In-Service date:
(9) Fuel
(10) Primary
(11) Alternate
(12) Air Pollution Control Strategy:
(13) Cooling Method:
(14) Total Site Area:
(15) Construction Status:
(16) Certification Status:
(17) Status with Federal Agencies:
(18) Projected Unit Performance Data:
(19) Planned Outage Factor (PDF):
(20) Forced Outage Factor (FOF):
(21) Equivalent Availability Factor (EAF):
(22) Resulting Capacity Factor (%):
(23)Average Net Operating Heat Rate(ANOHR):
(24) Projected Unit Financial Data:
(25) Book Life:
(26)Total Installed Cost (In-Service year$/kW):
(27) Direct Construction Cost ($/kW):
(28) AFUDC Amount ($/kW):
(29) Escalation ($/kW):
(30) Fixed O&M ($/kW-yr):
(31) Variable O&M ($/MWh):
9-24

Lakeland Electric
2017 Ten-Year Site Plan Ten-Year Site Plan Schedules
Table 9-16
Schedule9.2: StatusReport and Specifications of Proposed GeneratingFacilities
(1) Plant Name and Unit Number: None in Current Planning Cycle
(2) Capacity:
(3) Summer MW
(4) Winter MW
(5) Technology Type:
(6) Anticipated Construction Timing:
(7) Field Construction Start-date:
(8) Commercial In-Service date:
(9) Fuel
(10) Primary
(11) Alternate
(12) Air Pollution Control Strategy:
(13) Cooling Method:
(14) Total Site Area:
(15) Construction Status:
(16) Certification Status:
(17) Status with Federal Agencies:
(18) Projected Unit Performance Data:
(19) Planned Outage Factor (PDF):
(20) Forced Outage Factor (FOF):
(21) Equivalent Availability Factor (EAF):
(22) Resulting Capacity Factor (%):
(23) Average Net Operating Heat Rate (ANOHR):
(24) Projected Unit Financial Data:
(25) Book Life:
(26) Total Installed Cost (In-Service year $/kW):
(27) Direct Construction Cost ($/kW):
(28) AFUDC Amount ($/kW):
(29) Escalation ($/kW):
(30) Fixed O&M ($/kW-yr):
(31) Variable O&M ($/MWh):
9-25

Lakeland Electric
2017 Ten-Year Site Plan Ten-Year Site Plan Schedules
Table 9-17
Schedule 10: Status Report and Specifications of ProposedDirectly Associated Transmission Lines
(1) Point of Origin and Termination: None planned.
(2) Number of Lines: None planned.
(3) Right of Way: None planned.
(4) Line Length: None planned.
(5) Voltage: None planned.
(6) Anticipated Construction Time: None planned.
(7) Anticipated Capital Investment: None planned.
(8) Substations: None planned.
(9) Participation with Other Utilities: None planned.
9-26