youth risk behavior survey - florida health...
TRANSCRIPT
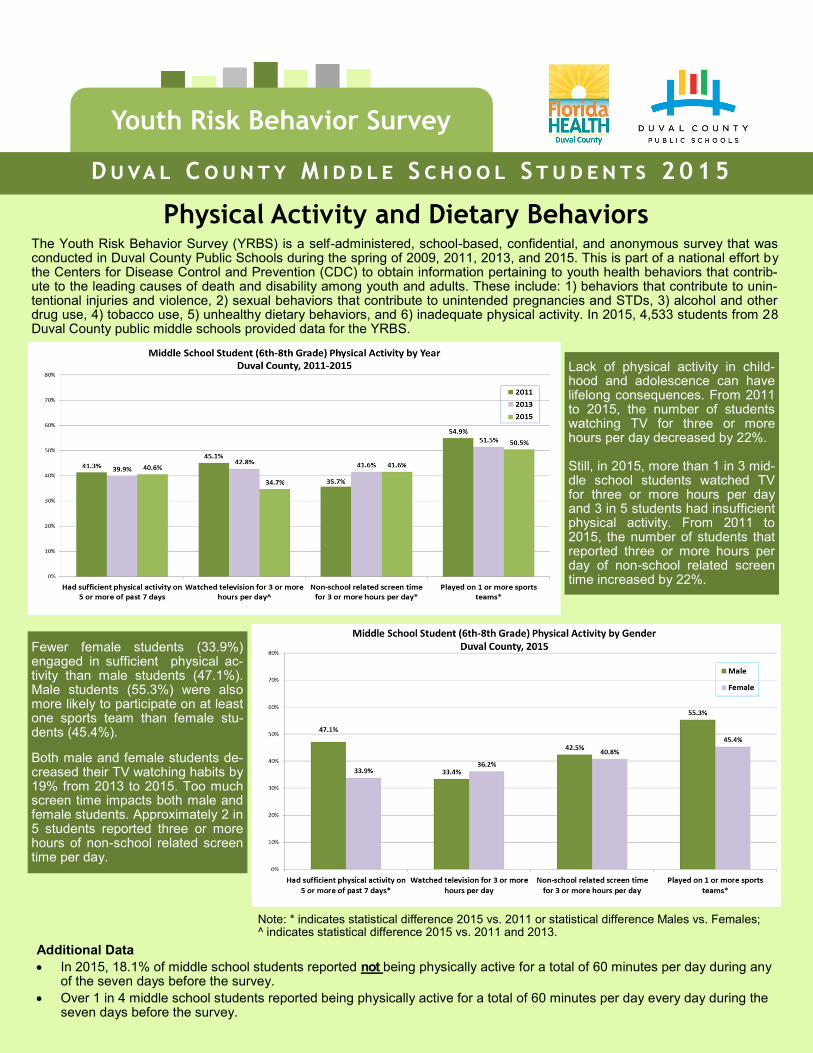
Physical Activity and Dietary Behaviors
Youth Risk Behavior Survey
D u va l C o u n t y M i d d l e S c h o o l S t u d e n t s 2 0 1 5
Additional Data
In 2015, 18.1% of middle school students reported not being physically active for a total of 60 minutes per day during any of the seven days before the survey.
Over 1 in 4 middle school students reported being physically active for a total of 60 minutes per day every day during the seven days before the survey.
Note: * indicates statistical difference 2015 vs. 2011 or statistical difference Males vs. Females; ^ indicates statistical difference 2015 vs. 2011 and 2013.
Fewer female students (33.9%) engaged in sufficient physical ac-tivity than male students (47.1%). Male students (55.3%) were also more likely to participate on at least one sports team than female stu-dents (45.4%).
Both male and female students de-creased their TV watching habits by 19% from 2013 to 2015. Too much screen time impacts both male and female students. Approximately 2 in 5 students reported three or more hours of non-school related screen time per day.
Lack of physical activity in child-hood and adolescence can have lifelong consequences. From 2011 to 2015, the number of students watching TV for three or more hours per day decreased by 22%. Still, in 2015, more than 1 in 3 mid-dle school students watched TV for three or more hours per day and 3 in 5 students had insufficient physical activity. From 2011 to 2015, the number of students that reported three or more hours per day of non-school related screen time increased by 22%.
The Youth Risk Behavior Survey (YRBS) is a self-administered, school-based, confidential, and anonymous survey that was conducted in Duval County Public Schools during the spring of 2009, 2011, 2013, and 2015. This is part of a national effort by the Centers for Disease Control and Prevention (CDC) to obtain information pertaining to youth health behaviors that contrib-ute to the leading causes of death and disability among youth and adults. These include: 1) behaviors that contribute to unin-tentional injuries and violence, 2) sexual behaviors that contribute to unintended pregnancies and STDs, 3) alcohol and other drug use, 4) tobacco use, 5) unhealthy dietary behaviors, and 6) inadequate physical activity. In 2015, 4,533 students from 28 Duval County public middle schools provided data for the YRBS.

P a g e 2 Duval County Health Zones (HZ)
HZ1 had the fewest students that de-scribed themselves as overweight (22.9%) and that felt hungry because there was not enough food in their home (16.7%). Only 48.0% of students slept for eight or more hours each night, the lowest in the County. Students in HZ1 reported drinking more water than teens in other HZs, with nearly 1 in 2 students drinking three or more glasses of water per day. One in 4 students in HZ1 have ever been diagnosed with asthma.
HZ2 had the most students that felt hun-gry because there was not enough food in their home (20.7%). HZ2 had the most stu-dents that ate breakfast at least once during the seven days before the survey (88.7%). Nearly 2 in 5 students reported three or more hours of non-school related screen time per day. Almost 1 in 4 students de-scribed themselves as overweight, and over 2 in 5 were trying to lose weight. Over 2 in 5 students reported sufficient physical activity.
HZ3 had the most students that were trying to lose weight (44.9%), did not eat breakfast during the seven days before the survey (13.5%), and described themselves as overweight (29.0%). HZ3 had the fewest students that ate fast food regularly (16.5%) and felt hungry because there was not enough food in their home (16.8%). Compared to the rest of the County, HZ3 had the fewest students that played on at least one sports team (48.5%).
HZ5 had the most students that watched TV for three or more hours per day (41.6%), consumed energy drinks (27.0%), ate fast food regularly (28.9%), and felt hungry be-cause there was not enough food in their home (18.1%). HZ4 had the fewest students that were trying to lose weight (40.7%), ate vegetables three or more times per day (13.9%), ate fruit three or more times per day (18.3%), and reported drinking three or more glasses of water per day (38.9%).
HZ6 had the highest levels of physical activity (48.7%) and participation on at least one sports team (58.0%). HZ6 (21.2%) had the lowest rate of asthma in the County. HZ6 had the most students that ate vegetables three or more times per day (20.0%), ate fruit three or more times per day (29.2%), drank three or more glasses of water per day (52.1%), and slept for eight or more hours per night (60.4%). Non-school related screen time (33.7%) was lower than in other HZs.
HZ4 had the lowest levels of physical activity (36.1%) and the most students that reported three or more hours of non-school related screen time per day (49.9%). In HZ4, 28.5% of students described them-selves as overweight and more than 2 in 5 students were trying to lose weight. Almost 1 in 4 students ate fast food regularly. More than 1 in 2 students in HZ4 slept for eight or more hours on the average school day.
Duval County is located on the northeast coast of Florida and is comprised of urban, suburban, and pockets of rural areas. The County is divid-ed into six Health Zones (HZ) which differ in terms of demographics, socio-economic factors, and health outcomes. The HZs are based on mu-tually exclusive zip codes tied to county organization and demographics. The geographic analysis of the YRBS data informs data-driven deci-sion-making and policy changes, a targeted approach to programming, and effective allocation of resources. In the 2015 YRBS reports, HZ data was determined using the zip code of the school that students attended, rather than students’ home zip code. Therefore, the HZ analyses in the 2015 YRBS reports are not comparable to the HZ data in prior YRBS reports.

Duval County Health Zone Comparison, 2015 P a g e 3
Note: * = During the seven days before the survey; ** = On an average school day; *** = During the 12 months before the survey; **** = During the 30 days before the survey. The superscript number refers to a specific Health Zone (i.e., superscript 1 refers to Health Zone 1) and indicates that the data for that Health Zone is statistically significantly different from data for the reference Health Zone. Comparison analysis by County, State and Nation are provided by CDC (See YRBS methodology at www.CDC.gov). Comparisons by Health Zone is provided by the Florida Department of Health in Duval County (See YRBS methodology at http://duval.floridahealth.gov/programs-and-services/community-health-planning-and-statistics/youth-risk-behavior-survey/index.html).
Risk Factors HZ1 HZ2 HZ3 HZ4 HZ5 HZ6 Duval
County
Physical Activity
Were physically active at least 60 minutes per day on 5 or more days*
41.7% 41.0% 39.6% 36.1%6
37.8%6
48.7% 40.6%6
Watched TV three or more hours per day** 34.1% 33.6% 32.5%5
37.3% 41.6%6
29.5% 34.7%5
Played video or computer games or used a computer three or more hours per day for something that was not school work**
40.6%4
38.0%4
44.0%6
49.9%6
43.4% 33.7% 41.6%4,6
Played on at least one sports team*** 51.7% 48.8%6
48.5%6
49.2% 48.7%6
58.0% 50.5%6
Obesity and Body Image
Described themselves as slightly or very overweight
22.9% 24.2% 29.0% 28.5% 24.4% 26.0% 25.3%
Were trying to lose weight 43.2% 42.5% 44.9% 44.8% 40.7% 41.5% 43.1%
Dietary
Did not eat breakfast* 13.0% 11.3% 13.5% 12.0% 11.6% 11.7% 12.3%
Ate at least one meal or snack from a fast food restaurant on three or more days*
23.0% 20.6% 16.5%5
22.5% 28.9%6
19.0% 21.7%5
Sometimes, most of the time, or always went hungry because there was not enough food in the home****
16.7% 20.7% 16.8% 16.8% 18.1% 17.0% 17.8%
Drank three or more glasses of water yesterday 47.2%5
41.0%6
46.0% 40.0%6
38.9%6
52.1% 44.1%5,6
Drank an energy drink at least one time yesterday 16.6%5
23.0% 16.1%5
22.3% 27.0% 21.2% 20.4%5
Ate vegetables three or more times yesterday 15.7% 16.8% 14.7% 15.3% 13.9% 20.0% 16.0%
Ate fruit three or more times yesterday 23.0% 24.2% 19.7%6
21.8% 18.3%6
29.2% 22.8%6
Other Health-Related
Were ever told by a doctor or nurse that they had asthma
25.9% 23.2% 23.4% 21.6% 24.7% 21.2% 23.7%
Slept for eight or more hours** 48.0%6
54.0% 54.3% 51.2% 54.0% 60.4% 52.5%6

For more information about the YRBS, e-mail Duval County Public Schools at [email protected]. Visit http://www.duvalschools.org/Page/11295 or http://duval.floridahealth.gov/programs-and-services/community-health-planning-and-statistics/
youth-risk-behavior-survey/index.html to view or download YRBS data.
Middle School Physical Activity/Dietary Behavior in Duval P a g e 4
Additional Data
More than 1 in 6 middle school students sometimes, most of the time, or always went hungry because there was not enough food in their home.
Only 52.5% of students slept for eight hours or more hours on the average school night.
Close to 1 in 4 middle school students have been told by a doctor or nurse that they had asthma.
Duval County middle school students have poor dietary intake and engage in many unhealthy eating habits. More than 77% of students reported not consuming the recommended amount of fruits each day and 84.0% reported not consuming the rec-ommend amount of vegetables each day. More male students ate the recommended number of fruits and vegetables the day before the survey than female students. From 2013 to 2015, there has been a 28% increase in the number of students that consumed energy drinks. Male students (23.1%) were more likely to consume energy drinks than females (17.2%). More than 1 in 4 students described themselves as slightly or very overweight, a 15% increase from 2011 to 2015. More fe-male students (29.3%) than male students (21.5%) described themselves as overweight. The negative health effects on the population in 10, 20, or 30 years from now is concerning, especially considering the lack of physical activity among middle school students.
Note: * indicates statistical difference 2015 vs. 2011 or statistical difference Males vs. Females; **indicates statistical difference 2015 vs. 2013.