survey of hydration knowledge and behavior in youth
TRANSCRIPT

University of Arkansas, FayettevilleScholarWorks@UARK
Theses and Dissertations
5-2018
Survey of Hydration Knowledge and Behavior inYouth Mountain Bike TeamsNatasha BrandUniversity of Arkansas, Fayetteville
Follow this and additional works at: http://scholarworks.uark.edu/etd
Part of the Community Health and Preventive Medicine Commons, Exercise Science Commons,Expeditionary Education Commons, Human and Clinical Nutrition Commons, and the Maternaland Child Health Commons
This Thesis is brought to you for free and open access by ScholarWorks@UARK. It has been accepted for inclusion in Theses and Dissertations by anauthorized administrator of ScholarWorks@UARK. For more information, please contact [email protected], [email protected].
Recommended CitationBrand, Natasha, "Survey of Hydration Knowledge and Behavior in Youth Mountain Bike Teams" (2018). Theses and Dissertations.2783.http://scholarworks.uark.edu/etd/2783

Survey of Hydration Knowledge and Behavior in Youth Mountain Bike Teams
A thesis submitted in partial fulfillment of the requirements for the degree of
Master of Science in Kinesiology
by
Natasha Ann Brand Northeastern State University
Bachelor of Science in Human and Family Science, 2014
May 2018 University of Arkansas
This thesis is approved for recommendation to the Graduate Council
________________________________ Stavros Kavouras, PhD Thesis Advisor
________________________________ Dean Gorman, PhD Committee Member
________________________________ Erin Howie, PhD Committee Member
Abstract
Many youth sports organizations recognize the importance of educating on hydration practices
and awareness, although according to recent research current hydration education is not
correlating to effective practices. PURPOSE: The purpose of this study was to assess and
describe the hydration knowledge and behavior of student-athletes participating in competitive
junior high and high school mountain bike teams, in order to substantiate further research.
METHODS: A total of 133 male and female participants, ranging from 11-18 years were
surveyed on their hydration knowledge and behavior. All participants were apparently healthy
and were active members of a National Interscholastic Cycling Association (NICA) Mountain
Bike Team. RESULTS: The mean score for knowledge was 9.28, SD 1.52. Less than 30% of
participants received an adequate score (=>10.5). 65% of participants received hydration
education but mean knowledge scores were still inadequate (M=9.5, SD =1.51). Significant
differences (p < 0.05) in knowledge scores were seen between genders, year in school, receiving
education, and drinking behaviors. CONCLUSION: Despite understanding the importance of
keeping hydrated, mean knowledge scores indicated inadequate knowledge, while behavior
responses indicated inconsistency in translation of knowledge.

Acknowledgements
I would first like to thank my thesis advisor, Dr. Kavouras, for allowing me to become a
member of the Hydration Science Lab and supporting my crazy notion of obtaining a national
sample for my thesis; without your guidance this would not have been possible.
To my committee members, thank you for your guidance and support with this project.
Dr. Gorman, as my advisor, your support and belief in my abilities over the past three years has
driven me to challenge myself, while exploring my research interests. Dr. Howie, the day I cited
your work 3 years ago, I could never have imagined you would become my mentor here at
University of Arkansas. I am grateful for all of your input – especially with the analysis, and
provision of good chocolate!
To the Hydration Science Lab group, I am grateful to you all and for the friendships I
have made, special thanks to J.D Adams and Dylan Scott for believing in me, and always being
on hand for advice and support. We were a great team!
To my NEO and NSU family, especially Bobbie, JulieAnna, and Shani who came along
for the ride - your continued belief in my abilities has kept me focused and driven, and to David
Loving for challenging me to a Ph.D! Each one of you played an integral part in the choices I
made throughout this journey.
My family, close friends, and Scouting family, both here and at home who have
continued to encourage me even though it has meant missing out on things; without all of your
support this journey would have meant nothing.
Lastly and most importantly I want to thank my husband David; this has been a wild ride,
with so many ups and downs. You are always the calm in my storm. You have supported me
from the very start of this journey, and most importantly cooked for me so I didn’t starve!

Table of Contents
1. Introduction.......................................................................................................................... 1
2. Review of Literature……………………………………………….……………………... 1
3. Purpose................................................................................................................................. 4
3.1. Hypotheses.................................................................................................................... 4
4. Methods………………………………………………………………………………….... 4
4.1. Participants.................................................................................................................... 4
4.2. Research Design............................................................................................................ 5
4.3. Procedures..................................................................................................................... 6
4.4. Statistical Analysis........................................................................................................ 6
5. Results.................................................................................................................................. 7
5.1. Hydration Knowledge………………………………………………………………... 7
5.2. Hydration Behavior………………………………………………………………….. 11
6. Discussion............................................................................................................................ 14
7. Conclusion........................................................................................................................... 18
8. References............................................................................................................................ 19
9. Appendix.............................................................................................................................. 22
A. Results: Demographics………………………………………………………………... 22
B. Results: Hydration Knowledge Questionnaire (HKQ-c)……………………………… 23
C. Results: Hydration Behavior Questionnaire (HBQ-c)………………………………… 25
D. Knowledge Scores……………………………………………………………………... 27
E. IRB Approval Letter…………………………………………………………………… 28

1
1. Introduction
Hydration is considered one of the most important priorities for youth athletes (Bergeron,
2015), yet there is a distinct lack of hydration studies conducted with this age group in the heat,
in sport specific situations. (Arnaoutis et al., 2013; Garth & Burke, 2013; S. A. Kavouras et al.,
2012; Rowland, 2011). Lack of age and sport specific studies in free-living conditions, lead to
difficulties in developing and disseminating effective hydration education to parents, coaches,
and athletes. While many youth sports organizations recognize the importance of educating on
hydration practices and awareness - according to current research - hydration education is not
correlating to effective practices (Decher et al., 2008; Stavros A. Kavouras & Arnaoutis, 2012).
In addition, in a recent survey of 7 – 9 year olds, by the Natural Hydration Council, data revealed
that more than 40% of those surveyed do not drink water while playing sports or exercising, and
35% do not drink water when thirsty; the survey also identified significant gaps in knowledge
(Natural Hydration Council, 2014).
2. Review of Literature
Many current guidelines on hydration are based upon early research, which reported that
thermoregulatory responses differ between adult and youth athletes. Early studies highlighted
differences in several major areas – greater heat gain (Astrand, 1952; MacDougall, Roche, Bar-
Or, & Moroz, 1983), lower age related sweat rates (until early puberty) (Bar-Or, 1980; Falk, Bar-
Or, & MacDougall, 1992; Falk, Bar-Or, MacDougall, Goldsmith, & McGillis, 1992; Meyer, Bar-
Or, MacDougall, & Heigenhauser, 1992), differences in sex related performance (post-puberty)
(Astrand, 1952), differences in core body temperature (Bar-Or, 1980), and differences in heat
acclimatization (Bar-Or, 1980, 1989; O. Inbar, 1980).

2
Since many of the early studies were conducted in climate controlled laboratory
conditions (Falk, Bar-Or, & MacDougall, 1992 a; Falk, Bar-Or, MacDougall, et al., 1992 b; O.
Inbar, 1980; MacDougall et al., 1983); in male only studies (Falk, Bar-Or, & MacDougall, 1992
a; Falk, Bar-Or, MacDougall, et al., 1992 b ; O. Inbar, 1980); in non-acclimatized or artificially-
acclimatized children (O. Inbar, 1980), and with little mention of fluid intake - this has led to
more recent research focusing on hydration and exertion levels in different age groups, and in
free-living conditions (Omri, Inbar, Morris, Epstein, & Gass, 2004; Rivera-Brown AM, Rowland
TW, Ramírez-Marrero FA, Santacana G, & Vann A, 2006; Rowland, 2008, 2011; Rowland T,
Garrison A, & Pober D, 2007).
Rowland (2008, 2011) and Inbar (2004) revisit their earlier research and the early
research of Bar-or et.al to conclude that thermoregulatory adjustment can be achieved in children
and adolescents when dehydration is prevented. In fact in a review as early as 1994 Meyer and
Bar-Or concluded “when correcting for body mass, children are generally similar to adults with
regard to their water losses during exercise” (p. 777). Therefore adequate hydration practices are
an important factor (Bergeron, 2015) regardless of age, sex, sweat rates, or body mass. In
addition appropriate acclimatization is a contributing factor since studies show that children can
take up to twice as long to acclimatize to a hot environment (O. Inbar, 1980).
In 2011, due to these new findings, the American Academy of Pediatrics (AAP) updated
its policy statement regarding climatic stress and exercise in children and adolescents (Bergeron,
Devore, & Rice, 2011) and is currently the only professional policy statement that specifically
addresses children and adolescents with regards to exercise. Certain youth sports organizations
such as the U.S. Soccer Federation have youth specific guidelines (Casa, 2006), which although
3
based upon the AAP guidelines, still refer to earlier research. The AAP in their revised policy
statement state:
These newer findings indicate that children and adults have similar rectal and skin temperatures, cardiovascular responses, and exercise-tolerance time during exercise in the heat. Accordingly, modifiable evidence-based determinants of exertional heat-illness risk in youth should be the focus of prevention measures (p. e741). Some of these modifiable evidence-based determinants include excessive physical
exertion, insufficient recovery time or closely scheduled practices or races, practices in excessive
heat, poor preparation, not heat-acclimatized, and inappropriate clothing (Bergeron et al., 2011).
Modifying these risk factors and increasing the frequency of breaks can help prevent heat related
illness (Bergeron, 2013; Armstrong et al., 2007). In addition, recent field studies have suggested
that when breaks are provided for fluid intake, and fluid is offered, that initial levels of hydration
can be maintained (Rivera-Brown et al., 2006; Rivera-Brown AM et al., 2006).
In addition to modifying risk factors, adequate hydration before and during exercise is
necessary in order to maintain performance and prevent heat illness (Bergeron, 2014; Sawka,
Burke, & Eichner, E R, 2007); losses as small as 2% of body weight have been shown to have a
negative impact on thermoregulation and performance. (Casa et al., 2000; Rowland, 2011) Heat
–induced illness is one of the most preventable sports injuries if appropriate guidelines are
followed (Casa, 2006). According to the AAP a child should be well hydrated before beginning
any type of physical activity, and that periodic drinking should be enforced even if the child does
not feel thirsty (Bergeron et al., 2011). This finding is supported in a review by Rowland (2011),
which concludes, “coaches and parents need to take responsibility for enforcing fluid intake
guidelines in young athletes” (p. 287).
It can be seen from the aforementioned studies, when working with youth athletes a
combination of approaches are needed in order to avoid heat illness, and safely achieve optimum

4
performance while exercising in the heat. Drinking according to thirst (Arnaoutis et al., 2013),
regular breaks, nor hydration education alone (Decher et al., 2008; Kavouras et al., 2012) have
been found to be effective measures to combat risk and reduce thermal strain. A more holistic
approach is needed including more sport specific hydration education programs aimed at
athletes, coaches and parents. Athletes and parents need to have the knowledge and provision for
the student-athlete to begin exercise euhydtrated, while coaches need to plan for ad libitum fluid
intake, schedule breaks for recovery and fluid intake, and offer fluids during breaks. Therefore it
is essential to conduct more sport specific studies of youth athletes with regards to hydration
status, knowledge and practices in order to educate all involved – athlete, coach, and parents, as
well as impact whole-school and team practices.
3. Purpose of the Study
To assess and describe the hydration knowledge and behavior of student athletes
participating in competitive junior high and high school mountain bike teams, within the
National Interscholastic Cycling Association (NICA) in order to substantiate further research
3.1 Hypotheses
• Current hydration awareness education does not translate to effective hydration
behavior in student athletes.
• Youth Mountain Bike Teams are not receiving adequate hydration education.
4. Methods
4.1 Participants
The study included 133 student-athletes (98 males, 35 females) between the ages of 11-
18. These participants were from junior high and high school mountain bike teams, in eighteen
states. The subject inclusion criteria included that all participants were required to be physically

5
healthy with no pre-existing medical conditions, and have obtained a medical release from a
physician, through their corresponding NICA teams.
4.2 Research Design
This study consisted of a survey design, which collected information on hydration
knowledge and behavior of student-athletes participating in competitive youth mountain bike
teams.
Questionnaire Description: Participants were asked to complete questionnaires regarding their
hydration knowledge and behavior. The survey was completed online, using the Qualitrics
survey platform, from a link accessed through the parents NICA League email.
• Demographics section – 5 questions (Appendix A)
• Hydration Knowledge Questionnaire - cycling (HKQ-c) – 15 questions including
True/false, multiple-choice options (Appendix B)
• Hydration Behavior Questionnaire - cycling (HBQ-c) – 10 questions including
True/false, multiple-choice options (Appendix C)
Questionnaire Development: Both the HKQ-c and HBQ-c were developed using questionnaires
provided by the University of Connecticut’s Department of Kinesiology. Permission was granted
for use. Questionnaires and questions were modified with input from Dr. Stavros Kavouras –
Professor and Director of the Hydration Science Laboratory, University of Arkansas, to address
the sport specific nature of this study.
Prior to the study, the questionnaires were pilot tested on ten students from various teams
in the Arkansas NICA League. The student-athletes were asked to provide feedback on any
questions they did not understand; questionnaires were updated after assessing the feedback. The
University of Arkansas Institutional Review Board has approved this study. (Appendix E)

6
4.3 Procedures
One week prior to the survey being emailed, NICA sent out an informational email
regarding the study in their National newsletter, including instructions on how to complete the
survey. Seven days later a link to the survey was emailed from NICA in their coaches newsletter
with instructions on how to distribute the link to parents. The extended process of getting the
survey to the parents was due to NICA 3rd party mailing list restrictions. The survey was
administered using the Qualtrics online platform. Consent was obtained from parents via digital
acknowledgment prior to the collection of any data; assent was obtained from the child in the
same way, before beginning the survey.
4.4 Statistical Analysis
Data from the HKQ-c was analyzed to provide mean, minimum and maximum scores.
The questionnaire was scored out of a 15-point maximum. A score for adequate knowledge was
determined from the upper 25th quartile scores, (Fig.1), and determined as =>10.5, or 70%.
Figure 1. Knowledge Scores
Knowledge scores were then analyzed by demographics, and hydration education
received using independent samples t-tests, analysis of variance (ANOVA), and chi-square test
of association. Behavior responses were analyzed by demographics using chi-square test of
7
independence (X2). Results from the HBQ-c were also used to describe behaviors. An alpha
level of .05 defined significance for all tests.
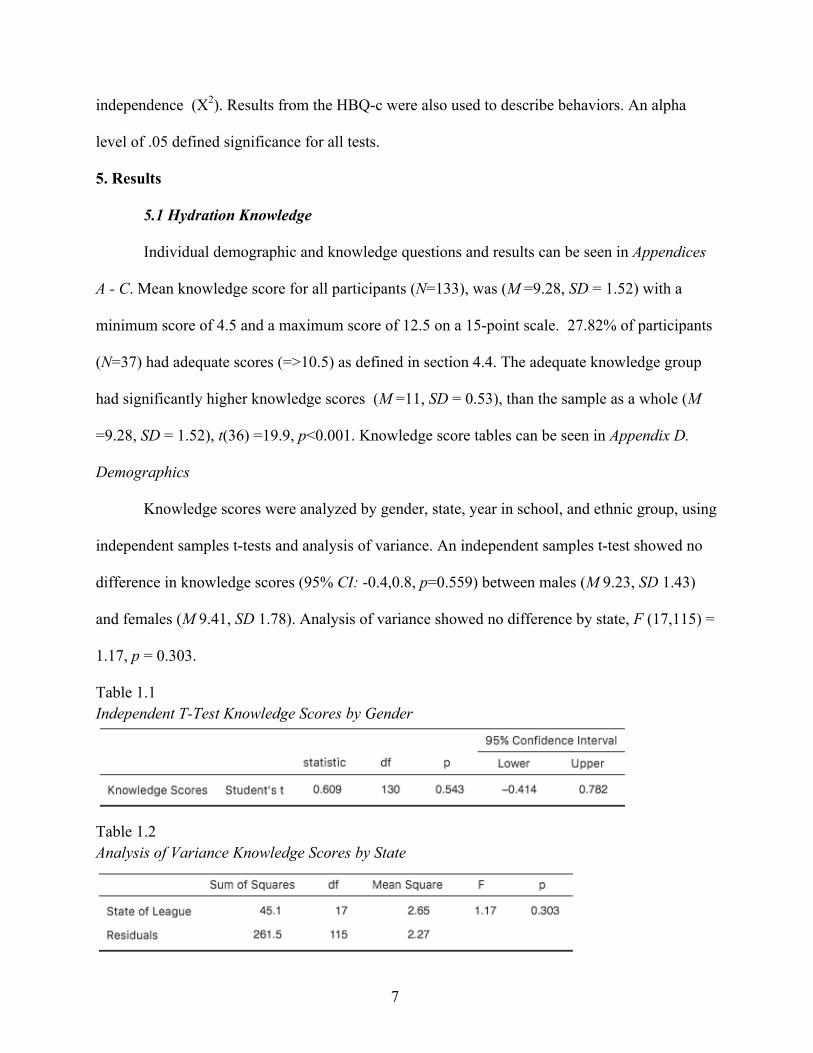
5. Results
5.1 Hydration Knowledge
Individual demographic and knowledge questions and results can be seen in Appendices
A - C. Mean knowledge score for all participants (N=133), was (M =9.28, SD = 1.52) with a
minimum score of 4.5 and a maximum score of 12.5 on a 15-point scale. 27.82% of participants
(N=37) had adequate scores (=>10.5) as defined in section 4.4. The adequate knowledge group
had significantly higher knowledge scores (M =11, SD = 0.53), than the sample as a whole (M
=9.28, SD = 1.52), t(36) =19.9, p<0.001. Knowledge score tables can be seen in Appendix D.
Demographics
Knowledge scores were analyzed by gender, state, year in school, and ethnic group, using
independent samples t-tests and analysis of variance. An independent samples t-test showed no
difference in knowledge scores (95% CI: -0.4,0.8, p=0.559) between males (M 9.23, SD 1.43)
and females (M 9.41, SD 1.78). Analysis of variance showed no difference by state, F (17,115) =
1.17, p = 0.303.
Table 1.1 Independent T-Test Knowledge Scores by Gender
Table 1.2 Analysis of Variance Knowledge Scores by State

8
Analysis of variance showed a significant difference in Knowledge Scores by Year in
School, F (4, 128) =3.59, p=0.008. Analysis of variance also showed a significant difference in
knowledge scores by ethnic group, F (6,126) = 2.34, p =0.036. A point to note about significance
by ethnic group is that 88.72% of participants identified as White (Non-Latino).
Table 1.3 Analysis of Variance Knowledge Scores by Year in School
Table 1.4 Analysis of Variance Knowledge Scores by Ethnic Group

9
Education
An independent samples t-test showed knowledge scores to be significantly higher, (CI
95%: -1.14, -0.07, p=0.028) in participants who had received hydration education (M = 9.5, SD
= 1.51) than those who did not (M = 8.89, SD = 1.49). 65% of participants reported receiving
hydration education.
Table 2.1 Independent Samples T-Test Knowledge Scores by Hydration Education Received
Analysis of variance showed mean knowledge scores to be significantly different by
urine color choice, F(3,129) = 10.7, p=<0.01. Post-hoc comparisons using the Tukey HSD test
indicated that the mean score for selecting correct urine color (M = 9.67, SD = 1.29) was
significantly higher. In addition the chi-square test of association showed a significant
relationship between urine color choice and adequate/inadequate knowledge scores, X2 (3, N =
133) = 11.3, p = 0.010, V= 0.29). Only 5.4% of those with adequate knowledge scores identified
urine color incorrectly compared to 32.3% with inadequate knowledge scores.
Table 2.2 Analysis of Variance Urine Color by Knowledge Scores

10
Table 2.3 Chi-Square Test of Association Urine Color by Adequate/Inadequate Knowledge Scores
Sweat Loss and Dehydration
Frequency tables for knowledge questions regarding sweating and weight loss split by
post exercise checks for dehydration show that 90.9% of participants reported that excessive
sweating leads to weight loss, and 81.9% reported that post practice weight loss is due to
sweating, yet there were no correct answers for weight being the best check for dehydration, post
exercise.
Table 2.4 Frequencies Sweating and Dehydration

11
Table 2.3 Frequencies Weight Loss and Dehydration
5.2 Hydration Behavior
Demographic and behavior questions can be seen in Appendices A and C. The HBQ-c
was not scored. Behavior questions were analyzed by demographics. Drinking perceptions were
analyzed by knowledge scores, by adequate knowledge, and by education received.
Demographics
For all behavior questions by demographics, chi-square test of association was used.
There was no relationship found by ethnic group. By gender, a significant relationship was seen
in drinking perceptions, X2 (2, N = 132) = 9.2, p = 0.01), drinking locations, X2 (23, N = 132) =
44.6, p = 0.004), and heat stoppages, X2 (1, N = 132) =5.36, p=0.021.
Table 3.1 Chi-Square Test of Association Perceptions of Drinking by Gender

12
Table 3.2 Chi-Square Test of Association Drinking Locations by Gender
Table 3.3 Chi-Square Test of Association Heat Stoppages by Gender
By State of league a significant relationship was seen in those receiving hydration education. X2 (17, N = 133) = 30.1, p = 0.026. By State temperature a significant relationship was seen in drink preference X2 (2, N = 133) =7.41, p = 0.025; but not in drink choice. Table 3.4 Chi-Square Test of Association Hydration Education by State

13
Table 3.5 Chi-Square Test of Association Drink Preference by State Temperature
V=0.236
Behavior - Drinking Perceptions
Analysis of variance showed that knowledge scores did not differ by drinking
perceptions, F(2, 130) = 0.544, p=0.582.
Table 4.1 Analysis of Variance Knowledge Scores by drinking perceptions
A chi-square test of association showed there was also no relationship between drinking
perceptions and adequate knowledge scores X2 (2,N=133)=1.24, p=0.538 or by hydration
education received F (2.36, 133)=2, p=0.307

14
Table 4.2 Chi-Square Test of Association Drinking perceptions by Adequate Knowledge
Table 4.3 Chi-Square Test of Association Drinking perceptions by Hydration Education Received
6. Discussion
The present study surveyed knowledge and behavior in youth mountain bike teams across
eighteen states. Results support the current literature that hydration education is not correlating to
effective practices (Decher et al., 2008; Stavros A. Kavouras & Arnaoutis, 2012). Findings also
support both hypotheses that current hydration awareness education does not translate to
effective hydration behavior in student athletes, and that youth mountain bike teams are not
receiving adequate hydration education.

15
Knowledge Scores
Results of the HKQ-c determined knowledge to be of an inadequate level, with less than
a third of participants meeting the required score of 70%. Receiving hydration education
significantly increased knowledge scores, although those who received education still did not
meet the level required for adequate knowledge.
Knowledge Demographics
No differences in knowledge scores were seen by gender or State, but significant
differences were seen by year in school, which could be attributed to age-related learning.
Despite an upward trend in mean scores, none of the grades met the required level for adequate
knowledge.
Knowledge Understanding and Translation
With regards to understanding the importance of fluids on performance, students scored
extremely well. 99.24% of participants reported that they felt keeping hydrated was very
important, while 99.74% reported that they needed fluids to perform at their best in cycling, and
98.5% reported it was important for them to drink before, during and after a race or practice.
Despite understanding the importance of keeping hydrated, mean knowledge scores indicated
inadequate knowledge, while behavior responses indicated inconsistency in translation of
knowledge.
Inconsistencies in behavior translation can be seen in the study by Decher (2008), which
expected that young athletes who understood the importance of hydration would better prevent
dehydration during sports camp; however, this expectation was not supported. Kavouras et al.
(2012) had similar findings with 60% of subjects remaining dehydrated even after an educational

16
intervention program, and self reporting that they were well hydrated The results of the present
study are in line with these findings that knowledge is not translating to effective behaviors.
Knowledge responses in the current study revealed that 90.98% of participants
understood that post exercise weight loss was due to sweating, while 81.95% understood that
sweat loss can lead to dehydration, yet no one answered correctly that weight loss was the best
way to check for dehydration post exercise, with responses being varied. This is another
indicator of inconsistency in translation of knowledge.
Although having received hydration education did increase knowledge scores
significantly, it did not translate to behavior differences. Despite higher knowledge scores in
those who had received hydration education, drinking perceptions did not differ based on
hydration education received, or adequate knowledge. No difference was seen in knowledge
scores based on drinking perceptions, and 70% of those who felt they did drink enough, had
inadequate knowledge scores. These findings indicate that future education methods need to be
relatable to performance outcomes so that athletes are equipped to better understand how much
they need to drink and why.
Drinking Practices and Preference
With regards to drink choice knowledge and behaviors; only 30% correctly answered the
knowledge question that sports drinks should be consumed when exercising for more than an
hour, and less than 40% selected Gatorade, or hydration tablets, as their drink choice in the
behavior section. In addition only 30% selected sports drink as their preferred choice; which
could indicate a lack of knowledge regarding proper fluid replacement with sports drinks during
longer practices or races. It would be difficult to attribute the high percentage of plain water
consumption to parental provision, since preferred drink choice was also plain water. When

17
analyzing drink choice and preference by State temperature there was a significant relationship
seen in drink preference, but none seen in drink choice. In plain water or flavored water
drinkers, preference was significantly higher in the cooler States, while sports drink preference
was higher in the warmer States. No relationship was seen in drink choice, and no correlation
between preference and choice.
According to the review by Garth and Burke (2013) there are little data on drinking
practices in most continuous sports, particularly in higher levels of completion and among youth
athletes, and almost no information on the athletes’ rationale for their drinking behaviors. Also
noted was the need for further field studies during competitive events that represent the true
nature of the specific sport, while concluding that a range of individualized and flexible drinking
strategies and hydration practices may be needed. These findings support the aims of this study
that a more holistic approach is needed toward education.
Due to a combination of lack of knowledge and inadequate education, there is
inconsistency in hydration practices among athletes, which can be seen in the current study, this
issue has also been highlighted in several studies during summer sports camps. McDermott et al.
(2009) and Arnaoutis (2013) found that participants that arrived at camp hypohydrated remained
so throughout their stay, Arnaoutis (2013) also found that those who were hypohydrated pre-
exercise became more dehydrated during practice, despite fluid being readily available. Decher
et al. (2008) reported differences in drinking perceptions and actual hydration state.
Gender Differences in Behavior
Certain behaviors were also seen to differ by gender, such as heat stoppages, with more
boys having to stop than girls. Differences were also seen in drinking perceptions by gender; a
higher amount of girls reported not knowing if they drank enough. Differences in choice of

18
drinking location were also seen by gender. According to Garth and Burke (2013) more data are
needed before a clear pattern can be established for any sport, with observations modified by
caliber, age, and sex; the findings from this study indicate that observations by gender,
particularly in youth cycling may need further research.
Limitations
Limitations for this study include the self-reporting on questionnaires by student athletes,
individual team coaches’ hydration education and experience, as well as the small number of
participants due to the blind survey design, and the fact it was off-season during the survey
period. Despite limitations the results identify the need for more effective hydration education,
particularly with regards to youth athletes, participating in continuous sports.
7. Conclusion
It can be seen from the present study and the current literature, that hydration knowledge
is both inadequate and not translating to effective hydration behaviors. A more holistic approach
is needed if we are to increase knowledge and translation. In creating effective hydration
interventions, strategies, and education programs it may be necessary to use an interdisciplinary
approach. The fact that existing education and interventions are not working well, future research
and applications should explore several critical areas; using developmentally appropriate
strategies to translate knowledge to behavior, increasing coaching knowledge and understanding
with regards to approaches towards hydration education, and relating drinking to performance
and health. If knowledge can be successfully translated into effective behaviors then youth
athlete hydration status will improve, ultimately increasing cycling performance, while reducing
risk of heat related injuries.

19
8. References
Armstrong, L. E., Casa, D. J., Millard-Stafford, M., Moran, D. S., Pyne, S. W., & Roberts, W. O. (2007). American College of Sports Medicine position stand. Exertional heat illness during training and competition. Medicine And Science In Sports And Exercise, 39(3), 556–572.
Arnaoutis, G., Kavouras, S. A., Kotsis, Y. P., Tsekouras, Y. E., Makrillos, M., & Bardis, C. N.
(2013). Ad Libitum Fluid Intake Does Not Prevent Dehydration in Suboptimally Hydrated Young Soccer Players During a Training Session of a Summer Camp. International Journal of Sport Nutrition & Exercise Metabolism, 23(3), 245–251.
Astrand, P. O. (1952). Experimental studies of physical working capacity in relation to sex and
age. Copenhagen; Fjnar Munksgaard. Retrieved from http://0-search.ebscohost.com.library.uark.edu/login.aspx?direct=true&db=s3h&AN=SPH83918&site=ehost-live&scope=site
Bar-Or, O. (1980). Climate and the exercising child - a review. International Journal of Sports
Medicine, 1(2), 53–65. Bar-Or, O. (1989). Temperature regulation during exercise in children and adolescents. In In,
Gisolfi, C.V. and Lamb, D.R. (eds.), Youth, exercise and sport, Indianapolis, Ind., Benchmark, c1989, p. 335-367.
Bergeron, M. F. (2013). Reducing sports heat illness risk. Pediatrics in Review, 34(6), 270–279
10p. Bergeron, M. F. (2014). Hydration and thermal strain during tennis in the heat. British Journal of
Sports Medicine, 48(Suppl 1), i12–i17. Bergeron, M. F. (2015). Hydration in the Pediatric Athlete — How to Guide Your Patients.
Current Sports Medicine Reports, 14(4). Bergeron, M. F., Devore, C. D., & Rice, S. G. (2011). Climatic heat stress and exercising
children and adolescents. Pediatrics, 128(3), e741–e747. Casa, D. J. (2006). U.S. Soccer Federation 2006 Youth Soccer Heat & Hydration Guidelines.
Http://Www.usyouthsoccer.org/Assets/1/15/Heat_Hydration_GuidelinesUSSF.pdf. Casa, D. J., Armstrong, L. E., Hillman, S. K., Montain, S. J., Reiff, R. V., Rich, B. S. E., …
Stone, J. A. (2000). National Athletic Trainers’ Association Position Statement: Fluid Replacement for Athletes. Journal of Athletic Training, 35(2), 212–224.
Decher, N. R., Casa, D. J., Yeargin, S. W., Ganio, M. S., Levreault, M. L., Dann, C. L., …
Brown, S. W. (2008). Hydration Status, Knowledge, and Behavior in Youths at Summer Sports Camps. International Journal of Sports Physiology & Performance, 3(3), 262–278.

20
Falk, B., Bar-Or, O., & MacDougall, J. D. (1992). Thermoregulatory responses of pre-,mid-, and late-pubertal boys to exercise in dry heat. / Thermoregulation chez les preadolescents et adolescents a l’ exercice en chaleur seche. Medicine & Science in Sports & Exercise, 24(6), 688–694.
Falk, B., Bar-Or, O., MacDougall, J. D., Goldsmith, C. H., & McGillis, L. (1992). Longitudinal
analysis of the sweating response of pre-, mid-and late-pubertal boys during exercise in the heat. American Journal of Human Biology, (4), 527–535.
Garth, A. K., & Burke, L. M. (2013). What Do Athletes Drink During Competitive Sporting
Activities? Sports Medicine, 43(7), 539–564. Inbar, O. (1980). Acclimatization to dry and hot environment in young adults and children 8-10
years old. Retrieved from http://0-search.ebscohost.com.library.uark.edu/login.aspx?direct=true&db=s3h&AN=SPH74587&site=ehost-live&scope=site
Inbar, O., Morris, N., Epstein, Y., & Gass, G. (2004). Comparison of thermoregulatory responses
to exercise in dry heat among prepubertal boys, young adults and older males. Experimental Physiology, 89(6), 691–700.
Kavouras, S. A., & Arnaoutis, G. (2012). Hydration Status in Active Youth. Nutrition Today,
47(4). Kavouras, S. A., Arnaoutis, G., Makrillos, M., Garagouni, C., Nikolaou, E., Chira, O., …
Sidossis, L. S. (2012). Educational intervention on water intake improves hydration status and enhances exercise performance in athletic youth. Scandinavian Journal of Medicine & Science in Sports, 22(5), 684–689.
MacDougall, J., Roche, P., Bar-Or, O., & Moroz, J. (1983). Maximal aerobic capacity of
Canadian schoolchildren: prediction based on age-related oxygen cost of running. International Journal of Sports Medicine, 4(3), 194–198.
Meyer, F., Bar-Or, O., MacDougall, D., & Heigenhauser, G. J. F. (1992). Sweat electrolyte loss
during exercise in the heat: effects of gender and maturation. / Perte de sueur lors de l’ exercice effectue dans un environnement chaud, effet du sexe et de la maturation. Medicine & Science in Sports & Exercise, 24(7), 776–781.
Natural Hydration Council. (2014). Survey of 500 children aged 7-9 years old - Opinion Matters. Rivera-Brown, A. M., Cabrera-Dávila, Y., Frontera-Cantero, J. E., Berríos, L. E., González, J., &
Ramírez-Marrero, F. (2006). Fluid Intake in Heat-Acclimatized Girl Athletes When Sports Drink and Water are Provided During Training. Medicine & Science in Sports & Exercise, 38, S111–S111.

21
Rivera-Brown AM, Rowland TW, Ramírez-Marrero FA, Santacana G, & Vann A. (2006). Exercise tolerance in a hot and humid climate in heat-acclimatized girls and women. International Journal of Sports Medicine, 27(12), 943–950 8p.
Rowland, T. (2008). Thermoregulation during exercise in the heat in children: old concepts
revisited. Journal of Applied Physiology, 105(2), 718–724. Rowland, T. (2011). Fluid Replacement Requirements for Child Athletes. Sports Medicine,
41(4), 279–288. Rowland T, Garrison A, & Pober D. (2007). Determinants of endurance exercise capacity in the
heat in prepubertal boys. International Journal of Sports Medicine, 28(1), 26–32 7p. Sawka, M. N., Burke, L. M., & Eichner, E R. (2007). Exercise and Fluid Replacement. Medicine
& Science in Sports & Exercise, 39(2).

22
9. Appendix A Demographics
Answer % Count Gender
Male 73.68% 98 Female 26.32% 35 Ethnic group
White (non-Latino) 88.72% 118 Other 1.50% 2 Native American 0.75% 1 Mixed Race 4.51% 6 Latino 2.26% 3 Asian & Pacific Islander 1.50% 2 African American 0.75% 1 Year in school
Freshman 21.37% 28 Junior High 29.01% 38 Sophomore 23.66% 31 Junior 14.50% 19 Senior 11.45% 15 State of League Alabama 4.51% 6 Arkansas 19.55% 26 Colorado 2.26% 3 Georgia 3.01% 4 Idaho 6.02% 8 Minnesota 11.28% 15 Nevada 0.75% 1 New Jersey 8.27% 11 New York 10.53% 14 NorCal 5.26% 7 North Carolina 2.26% 3 Pennsylvania 1.50% 2 SoCal 3.76% 5 Tennessee 2.26% 3 Texas 1.50% 2 Utah 6.77% 9 Virginia 0.75% 1 Wisconsin 9.77% 13 Total participants 133

23
9. Appendix B Hydration Knowledge Questionnaire (HKQ-c) Answer % Count DURING exercise, the best way to tell that I am dehydrated would be
Thirst 51.88% 69 Sweat 9.02% 12 Dizziness / Headache 27.07% 36 Muscle cramps 12.03% 16 AFTER exercise, the best way to tell that I am dehydrated would be
Urine color 48.12% 64 Weight loss 0.00% 0 Thirst 37.59% 50 Nausea 14.29% 19 When I am thirsty it means (you may select more than one answer)
My body is hot / body temperature is high 41.12% 64 It is not related to my hydration or my body temperature 5.26% 7 I am already dehydrated 46.61% 62 I am almost dehydrated 51.13% 68 It is important for me to drink
Before exercise 14.29% 19 During exercise 14.29% 19 After exercise 13.53% 18 All of the above 98.5% 131 When exercising for more than an hour, what is the best choice of drink?
Plain water 69.17% 92 Sports drink 30.08% 40 Juice 0.75% 1 Soda 0.00% 0 I need to drink fluids to perform at my best in cycling
TRUE 97.74% 130 Not sure 2.26% 3 FALSE 0.00% 0 I need to drink fluids during cold weather practices or races
TRUE 93.23% 124 Not sure 5.26% 7 FALSE 1.50% 2 During practices or races on average I should drink
As much as I sweat out 29.32% 39 Less than I sweat out 2.26% 3 More than I sweat out 66.92% 89 It doesn't matter 1.50% 2 What color is your urine if you are hydrated?
Pale yellow (similar to lemonade) 75.94% 101 Dark yellow (similar to apple juice) 9.02% 12 Brown Yellow (similar to mustard) 1.50% 2 Bright Yellow (similar to Mountain Dew 13.53% 18

24
Appendix B cont. Answer % Count Excessive sweating can lead to dehydration
TRUE 90.98% 121 FALSE 3.76% 5 Not Sure 5.26% 7 If I weigh less after a practice or a race than I did at the beginning, then the weight I lost is probably due to
Fat loss 4.51% 6 Carbohydrate loss 10.53% 14 Sweat loss 81.95% 109 Protein loss 3.01% 4 In pre-season practice, how long does it take for my body to get used to the temperature?
1 day 16.54% 22 4 days 54.14% 72 12 days 23.31% 31 20 days 6.02% 8 If I feel like I am experiencing heat illness at a practice or a race, I should (you may select more than one answer)
Tell my coach or teammate 90.23% 120 Drink plain water 74.44% 99 Drink a sports drink 33.83% 45 Find a cool place to rest 81.12% 108 Finish my practice or race 9.02% 12 Heat-induced illness is one of the most preventable sports injuries
TRUE 87.97% 117 FALSE 2.26% 3 Not sure 9.77% 13 The most serious form of heat illness is
Heat Cramps 0.75% 1 Heat Exhaustion 3.01% 4 Heat Stroke 90.23% 120 Dehydration 6.02% 8
Total participants 133

25
9.Appendix C Hydration Behavior Questionnaire (HBQ-c) responses Answer % Count At a practice or a race, how Important do you feel drinking fluids is?
Not that important 0.76% 1 Very important 99.24% 130 Do you feel like you drink enough fluids when you are at a practice or a race?
Yes 60.15% 80 No 26.32% 35 Not sure 13.53% 18 WHAT kind of fluids do you drink when you are at a practice or a race? (you may select more than one answer)
Water with hydration tablet added 29.32% 39 Water 93.98% 125 None 0.00% 0 Juice 0.75% 1 Gatorade 39.85% 53 Which type of drink do you prefer, given the choice?
Sports drink 29.77% 39 Plain water 54.20% 71 Flavored water 16.03% 21 During a practice or race HOW do you drink? (you may select more than one answer)
Water supplied by coach 13.53% 18 Team cooler during breaks 16.54% 22 Friend/teammate 2.26% 3 Camelbak 66.17% 88 Bottle on bike 69.17% 92 During a practice or race, WHEN do you drink? (you may select more than one answer)
When I am thirsty 95.49% 127 When I am hot 60.90% 81 Only during scheduled breaks 5.26% 7 When my coach tells me to 25.56% 34 I don't drink during practices or races 0.00% 0 During a practice or a race, WHERE do you drink? (you may select more than one answer)
Easy sections of the trail 87.97% 117 During a descent 12.78% 17 Before start of practice or race 77.44% 103 At the top of climb 46.61% 62 At end of practice or race 72.18% 96 Have you received any hydration education?
Yes 64.89% 85 No 35.11% 46

26
Appendix C cont. Answer % Count If you answered YES to the last question, where did receive the hydration education? (you may select more than one answer)
School 32.33% 43 Parents 33.08% 44 Other 14.29% 19 Gatorade Website 0.75% 1 Coach 52.63% 70 At a practice or a race have you ever had to stop due to being too hot?
Yes 30.53% 40 No 69.47% 91 Does your coach talk to the team regularly about keeping hydrated?
Yes 87.79% 115 No 12.21% 16
Total participants 133

27
Appendix D Knowledge Scores 1. Knowledge Scores Descriptives and Graph
2. Adequate Knowledge Scores Descriptives and Graph
3. One-sample T-Test Adequate Scores by Mean Scores

28
Appendix E Institutional Review Board Approval
To: Natasha A BrandBELL 4188
From: Douglas James Adams, ChairIRB Committee
Date: 01/16/2018Action: Expedited ApprovalAction Date: 01/16/2018Protocol #: 1711087019Study Title: Survey of Hydration Knowledge and Behavior in Youth Mountain Bike TeamsExpiration Date: 01/04/2019Last Approval Date:
The above-referenced protocol has been approved following expedited review by the IRB Committee that overseesresearch with human subjects.
If the research involves collaboration with another institution then the research cannot commence until the Committeereceives written notification of approval from the collaborating institution's IRB.
It is the Principal Investigator's responsibility to obtain review and continued approval before the expiration date.
Protocols are approved for a maximum period of one year. You may not continue any research activity beyond theexpiration date without Committee approval. Please submit continuation requests early enough to allow sufficient time forreview. Failure to receive approval for continuation before the expiration date will result in the automatic suspension of theapproval of this protocol. Information collected following suspension is unapproved research and cannot be reported orpublished as research data. If you do not wish continued approval, please notify the Committee of the study closure.
Adverse Events: Any serious or unexpected adverse event must be reported to the IRB Committee within 48 hours. Allother adverse events should be reported within 10 working days.
Amendments: If you wish to change any aspect of this study, such as the procedures, the consent forms, study personnel,or number of participants, please submit an amendment to the IRB. All changes must be approved by the IRB Committeebefore they can be initiated.
You must maintain a research file for at least 3 years after completion of the study. This file should include allcorrespondence with the IRB Committee, original signed consent forms, and study data.
cc: Stavros A Kavouras, Investigator
Page 1 of 1