zagreb – 27 april 2012 - zse=.pdf · zagreb – 27 april 2012 ... the dial-in ... a presentation...
TRANSCRIPT
Zagreb – 27 April 2012
T-Hrvatski Telekom
Results for the three months to 31 March 2012
Economic climate, regulatory framework and competitive landscape getting tougher; revenues fall 4.7%; rigorous cost cutting measures continue to protect margins; innovative services
building solid platform for the future
T-Hrvatski Telekom (Reuters: THTC.L, HT.ZA; Bloomberg: THTC LI, HTRA CZ), Croatia’s leading telecommunications provider, announces unaudited results for the three months to 31 March 2012. Group Highlights
Revenues down 4.7% to HRK 1,806 million or EUR 239 million (Q1 2011: HRK 1,894 million, EUR 256 million)
IP and ICT revenues show continued growth EBITDA slightly below Q1 2011 level at HRK 762 million (EUR 101 million) and 42.2% margin
(Q1 2011: HRK 767 million or EUR 104 million, 40.5%) o Number of cost control initiatives across the Group continue to protect margins o Lower merchandise costs against Q1 2011
Net profit 3.7% up at HRK 364 million (EUR 48 million) Operating cash flow up 15.9% to HRK 546 million (EUR 72 million) General Assembly approved dividend of HRK 22.14 per share; residual part of HRK 11.07 to be
paid on 21 May 2012 o Advance dividend payment of HRK 11.07 paid on 27 February 2012
Residential Segment T-HT maintained its leading position in all three markets (mobile, fixed line and IP) Mobile subscribers down 6.5% (down 5.2% on Q4 2011) 535,970 ADSL mainlines, up 0.2% (down 0.6% on Q4 2011), and 325,014 TV customers, up
8.9% (up 1.2% on Q4 2011) Revenues down 5.3%, due mainly to lower voice revenues in mobile and fixed Contribution to EBITDA of HRK 691 million, up 4.1% LTE network put into operation in March
Business Segment Substantial customer base across all segments and products Mobile subscribers up 11.7% (up 7.5% on Q4 2011) 118,411 ADSL mainlines, up 11.0% (up 6.2% on Q4 2011) and 19,720 TV customers, up 8.5%
(up 1.2% on Q4 2011) Revenues down 3.9%, due largely to lower voice revenues in mobile and fixed Contribution to EBITDA of HRK 481 million, up 2.3% ICT focus on further development and monetisation of Cloud services portfolio
Ivica Mudrinić, President of the Management Board (CEO), said: “The recession in the Croatian economy persists and the country still faces rising unemployment, wage deflation, lower investment and increasing payment arrears in the corporate sector. Against this backdrop, T-HT reported lower revenue, but our business is demonstrating the positive impact of the ongoing transformation program.
2
“At the same time, we have retained our position as market leading provider across all areas of business, introducing a range of innovative products and services during the first quarter. T-HT has now become one of the first European telecoms providers to give its customers access to super-fast mobile internet services with the recent commercial launch of its LTE network.
“Nevertheless, the regulatory regime continues to hamper any meaningful investment by the Group in the fibre network and accelerated development of mass market broadband services. A solution to this issue would represent a significant step towards the development of the Croatian telecommunications sector and contribute to the recovery of the domestic economy.”
Contact details T-Hrvatski Telekom Investor Relations
Erika Kašpar, Corporate Communications and Investor Relations
+ 385 1 4912 000
Elvis Knežević, Investor Relations + 385 1 4911 114 Anita Marić Šimek, Investor Relations + 385 1 4911 884 Email [email protected] College Hill
Kay Larsen / Adrian Duffield +44 207 457 2020 A conference call for analyst and investors will start at 14:00 UK time / 15:00 CET today. The dial-in details are as follows: International Dial In +44 (0) 1452 555 566 UK Free Call Dial In 0800 694 0257 Conference ID 74098676 A replay of the call will be available until Thursday, 3 May 2012 using the following details: International Dial In +44 (0) 1452 550 000 UK Free Call Dial In (from landlines only) 0800 953 1533 Replay Access Code 74098676# A presentation covering results for the first three months of 2012 can downloaded from the T-HT website (www.t.ht.hr/eng/investors)
3
Results for the three months to 31 March 2012 Business and financial review Introduction T-Hrvatski Telekom is Croatia’s largest telecommunications provider and the market leader in all segments in which it operates. At 31 March 2012, the Group served more than 1.2 million fixed-line customers, more than 2.3 million mobile subscribers, 654,381 broadband connections and provided TV services to 344,734 customers. In March 2010, T-HT acquired the ICT company Combis, significantly expanding its ability to provide integrated solutions to Croatia’s business market. Market overview
Negative economic trends, regulatory tightening and increased competition are significantly impacting the Croatian telecommunications market.
A key development in Q1 2012 was the launch of the LTE mobile network in March. Since April, the Group has offered two new T-Mobile Extreme tariffs that provide enhanced mobile broadband based on LTE technology.
March also saw the introduction of prepaid mobile brand MultiPlus, a brand reseller concept with a major retail chain that is carried on the Group’s network infrastructure. A key competitor has also launched its first integrated commercial offer for private and business customers, offering bundles of fixed voice, mobile voice, fixed broadband and mobile Internet services on one bill. In addition, the 6% fee on revenues from mobile services was re-introduced by the new Croatian government from 26 January 2012, having been abolished at the end of 2011. Fixed-line market Fixed telephony remains highly competitive in Croatia, with 10 active operators including T-HT Group. Major market consolidation last year increased competition in bundled telecommunication offers. Nevertheless, T-HT successfully maintained its leading position reflecting the Group’s continuing dedication to high-quality services and improved marketing, with offers tailored to suit the needs of specific customer segments. According to the Croatian Central Bureau of Statistics, the number of fixed-line minutes of use (MOU) decreased by 10% in 2011, following similar global trends. According to the Cullen International report for 2011, fixed-line penetration is estimated at 39% of the Croatian population at the end of 2011. Mobile telecommunications In mobile, T-HT, through its T-Mobile brand, still maintains a leading market position in a saturated mobile market, which has been served by three operators since 2005. At the end of March 2012, mobile
4
penetration in Croatia was estimated at 117%, with the Group’s share of total mobile customers at 47%. Despite increased usage of mobile services, mobile voice and messaging revenue declined in first three months of 2012 due to lower mobile termination rates, intense pricing competition and changes in customer behaviour. According to the Croatian Central Bureau of Statistics, total Croatian mobile market minutes of use (MOU) increased by 3.5%, but SMS traffic declined by 4.8% in 2011 compared with the previous year as users switched to social networks as a channel of communication. Demand for mobile Internet continued to grow in first three months of 2012, with all three mobile operators promoting mobile broadband services, driven by increased use of smartphones and tablet devices. Internet T-HT’s IPTV and DTH satellite TV services were enhanced by new and exclusive sports content and pay per view and “try and buy” offers. Satellite TV also became an increasingly important element of the Group’s TV offer. At the end of Q1 2012, the Group had 654,381 ADSL subscribers (Q1 2011: 641,823). The number of TV customers at the end of Q1 2012 was 344,734, representing 52.7% of T-HT's total ADSL customer base. Despite the strong increase in broadband subscribers, the Croatian broadband market remains a significant growth opportunity for T-HT, with just 46% of Croatian households connected to fixed broadband compared to an average of more than 62% in Western Europe. Data (traditional) T-HT maintained its leading position in a market that is migrating from traditional data services to more cost-effective, IP-based services. Although the data market is relatively small, representing less than 1% of total telecommunication market revenues, it represents an important service for business customers. The Group’s main data service competitors continued to develop their own networks, targeting the corporate and government sectors. Wholesale Following fixed line market liberalization, the result of the introduction of Wholesale Line Rental (WLR) and naked bitstream services in 2011, demand for infrastructure services requested by alternative operators remains high. The number of WLR customers continues to increase and totalled 148,920 at the end of Q1 2012. There is still significant demand for Unbundled Local Loop (ULL), with the number of customers increasing to 154,845 at the end of Q1 2012 from 148,305 at the end of 2011. From 1 January 2012, wholesale prices were amended for the following regulated services: call origination, fixed and mobile call termination. Economic background
5
Amid a lack of public sector reforms and investment to stimulate growth, the Croatian economy stagnated in 2011. According to the Croatian Central Bureau of Statistics, Croatian GDP in 2011 flattened to zero growth. At the same time, further negative factors are emerging from the Eurozone: increasing cost of capital; declining demand for Croatian exports and continued lack of investment. Unemployment has continued to rise in 2012 and hit 20.0% in March 2012 (compared with 19.3% in March 2011). This is negatively impacting personal consumption. According to the Croatian Central Bureau of Statistics, average net earnings in January 2012 were in real terms 1.1% higher than in January 2011. However, VAT was increased to 25% from 23% in March 2012. Business payments arrears rose again to a new record level of HRK 42.8bn in February 2012, as a result of by 72,600 companies and business facing insolvency issues. Update on 6% fee on mobile network services As announced in January 2012, the Croatian Parliament adopted the newly elected Government’s proposal to reinstate the 6% fee on revenues generated by mobile services, including SMS, MMS and voice, to be payable by the operator. The Fee for the Provision of Services in Mobile Electronic Communications Networks Act was adopted on 20 January 2012 and came into force as of 26 January 2012, the date it was published in the Official Gazette. It will remain in place until 30 June 2013, when Croatia is expected to accede to the European Union. The impact of the 6% tax in Q1 2012 was HRK 21 million (Q1 2011: HRK 34 million).
Update on dividend payment Hrvatski Telekom d.d. realized a net profit (after taxation) of HRK 1,813,295,187.26 in the year ended 31 December 2011. The Management Board and Supervisory Board of Hrvatski Telekom d.d. have proposed a dividend distribution to shareholders of HRK 1,813,012,164.90 or HRK 22.14 per share. The remaining amount of HRK 283,022.36 will be allocated to retained earnings. The Supervisory Board gave its consent to the Management Board to pay to shareholders an advance dividend of HRK 11.07 per share or HRK 906,506,082.45 in total. The advance dividend was paid on 27 February 2012 to shareholders registered at the Central Depository & Clearing Company (SKDD) on 20 February 2012. At the General Assembly session, held on 25 April 2012, it was decided that the residual amount of HRK 11.07 per share will be paid to shareholders registered at the Central Depository & Clearing Company on the day of the session. The due date for the residual dividend payment is 21 May 2012. Regulatory environment
6
Croatia’s Law on Electronic Communications, which replaced the previous Law on Telecommunications, has been in force since 1 July 2008 and transposed the 2002 EU Regulatory Framework onto Croatia’s electronic communications market. In order to align the Croatian regulatory framework with EU framework amendments from 2009, the Croatian Parliament adopted amendments to the Law on Electronic Communications in July 2011 and these came into force in August 2011. Croatian operators were given 90 days’ notice to comply with the new provisions of the Law.
In line with the Croatian regulatory framework, and taking into account the latest EU recommendations, the Agency can impose regulatory remedies only after analysing the market and determining the existence of significant market power (SMP). According to market analysis conducted by the Agency in 2009, in 2011 and in 2012, T-HT holds an SMP position in the following markets:
1. call origination in the fixed network
2. call termination in the fixed network
3. wholesale (physical) network infrastructure access (including shared or fully unbundled access)
4. wholesale broadband access
5. call termination in the mobile network
6. wholesale terminating segments of leased lines
7. wholesale trunk segments of leased lines (non-competitive lines)
8. retail access to the public communications network at a fixed location
9. publicly available local and/or national telephone services provided at a fixed location for residential customers
10. publicly available local and/or national telephone services provided at a fixed location for non-residential customers
11. retail broadband Internet access (regulated as of 23 March 2012)
12. retail market for transmission of TV programs with remuneration (IPTV market) – regulated as of 23 March 2012)
In these markets, remedies that had been in place before the market analysis ceased to apply and the following remedies were imposed:
- in markets 1 - 7: network access and use of special network facilities (this obligation is extended to Company’s optical fiber access network), non-discrimination, transparency, price control and cost accounting, accounting separation (applies only to the Company’s fixed business)
- in market 8: network access and use of special network facilities (obligation to offer wholesale line rental - WLR), non-discrimination, transparency, price control and cost accounting (notification of retail prices 30 days in advance; prohibition to unreasonably bundle services - introduction of naked DSL, provision of “pure” network access), accounting separation; in line with these obligations, the Company published wholesale reference offers for naked bitstream and WLR in June/July 2011.
- in markets 9 - 12: price controls and regulation of promotional offers were imposed on the Company and Iskon.
7
In January 2011, the Agency imposed changes to the Company’s Reference Unbundling Offer (RUO) incorporating almost 70 amendments, including the obligation to provide access to the network even where there is no existing access line available, the introduction of VDSL technology, a reduction in installation fees, and a reduction of monthly fees for second and third access lines to the same end user.
In March 2011, the Agency reduced the Company’s prices (monthly fees) charged for the wholesale unbundled local loop service (ULL) from HRK 52.14 to HRK 43.61. The Company’s monthly fee for Shared ULL was reduced in October 2011 from HRK 18.17 to HRK 16.92.
In May 2011, the Agency issued a non binding interpretation of the decision dated 6 April 2011 under which existing Carrier Pre-selection (CPS) customers shall be automatically migrated to WLR unless they make an objection within a reasonable period. In addition, on 8 June 2011, the Agency issued a decision imposing changes to the Company’s General Terms and Conditions for provision of services to its subscribers such that in the case of migration to WLR, a subscriber contract signed between the Company and its subscriber shall be automatically terminated (without the explicit request of the subscriber in question). Subsequently, on 6 July 2011 and 8 July 2011 the Agency issued two decisions that amend the Company’s reference interconnection offer and reference offer for WLR so that existing CPS customers (customers who have contracted CPS before the reference offer for WLR came into force) may be automatically migrated to WLR without any written request.
Decisions of this kind by the Agency represent a significant intervention in the contractual relationship between the Company and its subscribers. As such, they are contrary to the relevant regulations, including the general ordinance adopted by the Agency, and thereby discriminate against the Company in comparison to all other operators on which such obligations have not been imposed.
In addition, by these two decisions (dated 6 July and 8 July 2011) the Agency has prohibited the Company from charging operators activation costs for wholesale services it provides them, thus forcing the Company to provide certain services to operators free of charge, i.e. at its own cost, as well as prohibiting the Company from protecting its finances against debtors despite substantial undisputed debt on the part of the alternative operators to the Company. Such regulatory practice by Agency can be considered to have significant impact on the Company’s business and related activities.
The Company is likely to be designated as an SMP operator in the remaining wholesale and retail (leased lines) markets, which are to be analysed in 2012.
Under a decision adopted in November 2011, the Agency increased the “x” percentage used to calculate the Company’s prices for wholesale bitstream access on copper - IP level (retail minus methodology) from 40% to 60%.
In December 2011, the Agency adopted a decision on amendments of the Company’s reference offer for wholesale bitstream access on copper and FttH (fiber to the home). This decision imposed more than 60 amendments and defined final concepts for the provision of wholesale bitstream access on copper and FttH.
In October 2010, the Company was (re)designated as the universal service provider for the next five years for all services (except for the subscribers’ directory, which the Company can continue to provide on a commercial basis). Tariffs for universal services must be set at an “affordable level.” Other tariffs, besides those mentioned above, are subject to ex-post review and are essentially unregulated.
ln October 2011, the Croatian Parliament approved the Government’s proposal to abolish the 6% fee on revenues generated by mobile services, including SMS, MMS and voice, to be payable by all mobile operators. The 6% fee was terminated as of 1 January 2012, but during January 2012 it was reintroduced by the Croatian Parliament and became effective as of 26 January 2012. It will apply until Croatian accession in the EU (expected on 1 July 2013).
8
Accounting separation (this applies only to the Company’s fixed business): the cost accounting project, initiated at the end of 2008, is ongoing. In Q3 2011 the Agency started developing its own cost modelling for all regulated services.
The registration of pre-paid customers in mobile networks is underway. A revision of fixed origination and termination fees and mobile termination fee was initiated in Q4 2011, to adjust these prices to the EU benchmark on an annual basis as prescribed by Agency decisions from 2009 (on SMP designation and imposition of remedies in fixed/mobile interconnection markets). As a consequence, T-HT’s interconnection prices were amended as follows (new prices started to apply from 1 January 2012):
- Local origination and termination fees in fixed (peak/off peak): 4.2 lp/min / 2.1 lp/min - Single tandem origination fees in fixed (peak/off peak): 5.4 lp/min / 2.7 lp/min - Single tandem termination fees in fixed (peak/off peak): 6.2 lp/min / 3.1lp/min - Double tandem origination fee in fixed (peak/off peak): 10.3 lp/min / 5.15 lp/min - Double tandem termination fee in fixed (peak/off peak): 12 lp/min / 6 lp/min - Mobile termination fee: 30.1 lp/min
Prior to 1 January 2012, HT’s interconnection prices were set at the following level:
- Local origination and termination fees in fixed (peak/off peak): 3.9 lp/min / 1.95 lp/min, - Single tandem origination and termination fees in fixed (peak/off peak): 5.9 lp/min / 2.95
lp/min - Double tandem origination fee in fixed (peak/off-peak): 11.3 lp/min / 5.65 lp/min and double
tandem termination fee in fixed (peak/off-peak): 11.4 lp/min / 5.7 lp/min - Mobile termination fee: 39.6 lp/min.
Segmental reporting On 1 January 2010, the former operating segments T-Com and T-Mobile, serving fixed and mobile markets respectively, were replaced by a new structure based upon Residential and Business units. As of the first quarter of 2011, a new reporting structure based on this customer segmentation was introduced with three separate operating segments: Residential Segment, Business Segment and Network and Support Functions. The Residential Segment (RS) includes marketing, sales and customer services, focused on providing mobile, fixed line telecommunications and TV distribution services to residential customers. The Business Segment (BS) includes marketing, sales and customer services, focused on providing mobile and fixed line telecommunications and systems integration services to corporate customers, small- and medium-sized businesses and the public sector. The Business Segment is also responsible for the wholesale business in both fixed and mobile services. The Network and Support Functions (NSF) performs cross-segment management and support functions, and includes the Technology department, Procurement, Accounting, Treasury, Legal and other central functions. Fully owned subsidiaries Iskon Internet, Combis and KDS are consolidated within the respective operating segments.
9
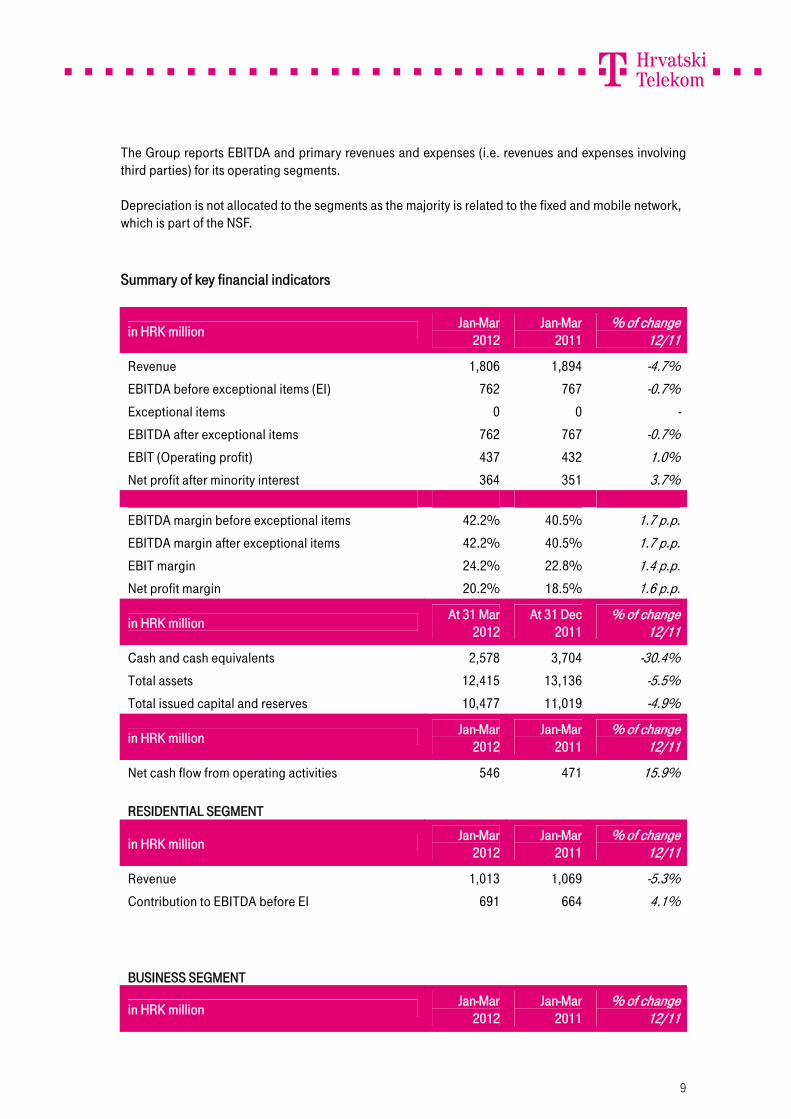
The Group reports EBITDA and primary revenues and expenses (i.e. revenues and expenses involving third parties) for its operating segments. Depreciation is not allocated to the segments as the majority is related to the fixed and mobile network, which is part of the NSF. Summary of key financial indicators
in HRK million Jan-Mar 2012
Jan-Mar 2011
% of change 12/11
Revenue 1,806 1,894 -4.7% EBITDA before exceptional items (EI) 762 767 -0.7% Exceptional items 0 0 - EBITDA after exceptional items 762 767 -0.7% EBIT (Operating profit) 437 432 1.0% Net profit after minority interest 364 351 3.7% EBITDA margin before exceptional items 42.2% 40.5% 1.7 p.p. EBITDA margin after exceptional items 42.2% 40.5% 1.7 p.p. EBIT margin 24.2% 22.8% 1.4 p.p. Net profit margin 20.2% 18.5% 1.6 p.p.
in HRK million At 31 Mar 2012
At 31 Dec 2011
% of change 12/11
Cash and cash equivalents 2,578 3,704 -30.4% Total assets 12,415 13,136 -5.5% Total issued capital and reserves 10,477 11,019 -4.9%
in HRK million Jan-Mar 2012
Jan-Mar 2011
% of change 12/11
Net cash flow from operating activities 546 471 15.9% RESIDENTIAL SEGMENT
in HRK million Jan-Mar 2012
Jan-Mar 2011
% of change 12/11
Revenue 1,013 1,069 -5.3% Contribution to EBITDA before EI 691 664 4.1% BUSINESS SEGMENT
in HRK million Jan-Mar 2012
Jan-Mar 2011
% of change 12/11
10
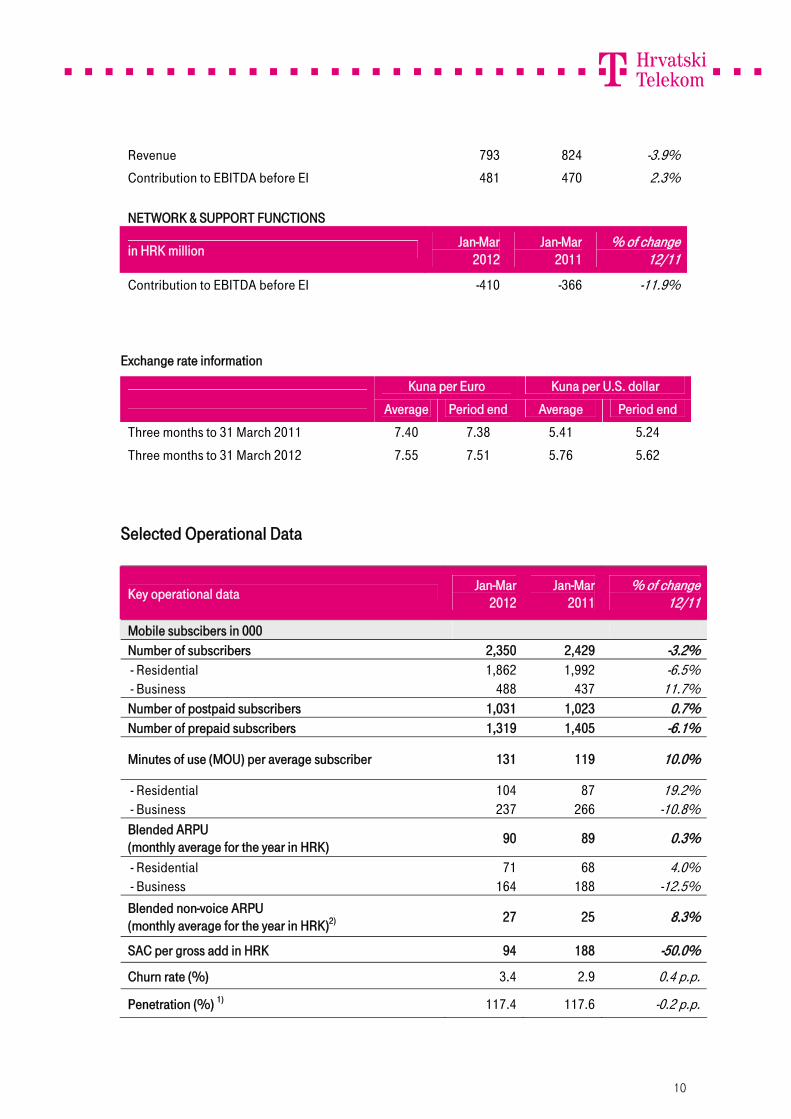
Revenue 793 824 -3.9% Contribution to EBITDA before EI 481 470 2.3% NETWORK & SUPPORT FUNCTIONS
in HRK million Jan-Mar 2012
Jan-Mar 2011
% of change 12/11
Contribution to EBITDA before EI -410 -366 -11.9% Exchange rate information
Kuna per Euro Kuna per U.S. dollar Average Period end Average Period end
Three months to 31 March 2011 7.40 7.38 5.41 5.24
Three months to 31 March 2012 7.55 7.51 5.76 5.62
Selected Operational Data
Key operational data Jan-Mar 2012
Jan-Mar 2011
% of change 12/11
Mobile subscibers in 000 Number of subscribers 2,350 2,429 -3.2% - Residential 1,862 1,992 -6.5% - Business 488 437 11.7% Number of postpaid subscribers 1,031 1,023 0.7% Number of prepaid subscribers 1,319 1,405 -6.1%
Minutes of use (MOU) per average subscriber 131 119 10.0%
- Residential 104 87 19.2% - Business 237 266 -10.8% Blended ARPU (monthly average for the year in HRK) 90 89 0.3%
- Residential 71 68 4.0% - Business 164 188 -12.5% Blended non-voice ARPU (monthly average for the year in HRK)2) 27 25 8.3%
SAC per gross add in HRK 94 188 -50.0%
Churn rate (%) 3.4 2.9 0.4 p.p.
Penetration (%) 1) 117.4 117.6 -0.2 p.p.
11
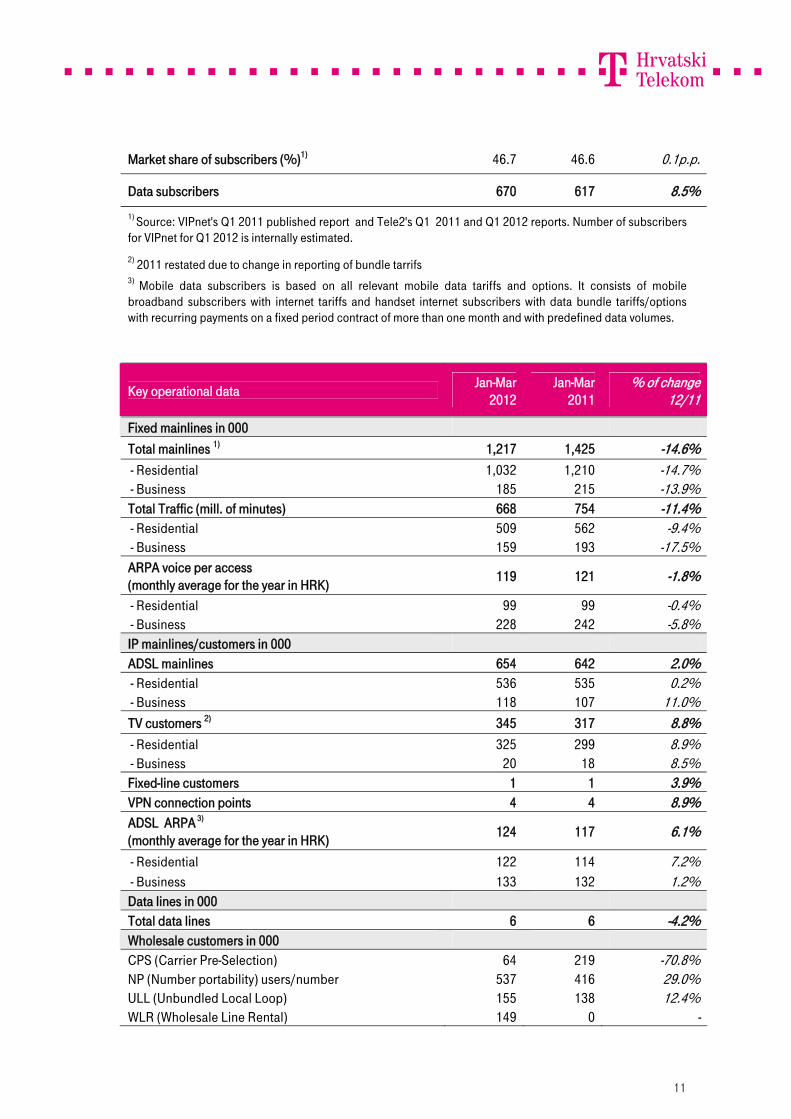
Market share of subscribers (%)1) 46.7 46.6 0.1p.p.
Data subscribers 670 617 8.5% 1) Source: VIPnet's Q1 2011 published report and Tele2's Q1 2011 and Q1 2012 reports. Number of subscribers for VIPnet for Q1 2012 is internally estimated.
2) 2011 restated due to change in reporting of bundle tarrifs 3) Mobile data subscribers is based on all relevant mobile data tariffs and options. It consists of mobile broadband subscribers with internet tariffs and handset internet subscribers with data bundle tariffs/options with recurring payments on a fixed period contract of more than one month and with predefined data volumes.
Key operational data Jan-Mar 2012
Jan-Mar 2011
% of change 12/11
Fixed mainlines in 000 Total mainlines 1) 1,217 1,425 -14.6% - Residential 1,032 1,210 -14.7% - Business 185 215 -13.9% Total Traffic (mill. of minutes) 668 754 -11.4% - Residential 509 562 -9.4% - Business 159 193 -17.5% ARPA voice per access (monthly average for the year in HRK) 119 121 -1.8%
- Residential 99 99 -0.4% - Business 228 242 -5.8% IP mainlines/customers in 000 ADSL mainlines 654 642 2.0% - Residential 536 535 0.2% - Business 118 107 11.0% TV customers 2) 345 317 8.8% - Residential 325 299 8.9% - Business 20 18 8.5% Fixed-line customers 1 1 3.9% VPN connection points 4 4 8.9% ADSL ARPA 3) (monthly average for the year in HRK) 124 117 6.1%
- Residential 122 114 7.2% - Business 133 132 1.2% Data lines in 000 Total data lines 6 6 -4.2% Wholesale customers in 000 CPS (Carrier Pre-Selection) 64 219 -70.8% NP (Number portability) users/number 537 416 29.0% ULL (Unbundled Local Loop) 155 138 12.4% WLR (Wholesale Line Rental) 149 0 -
12
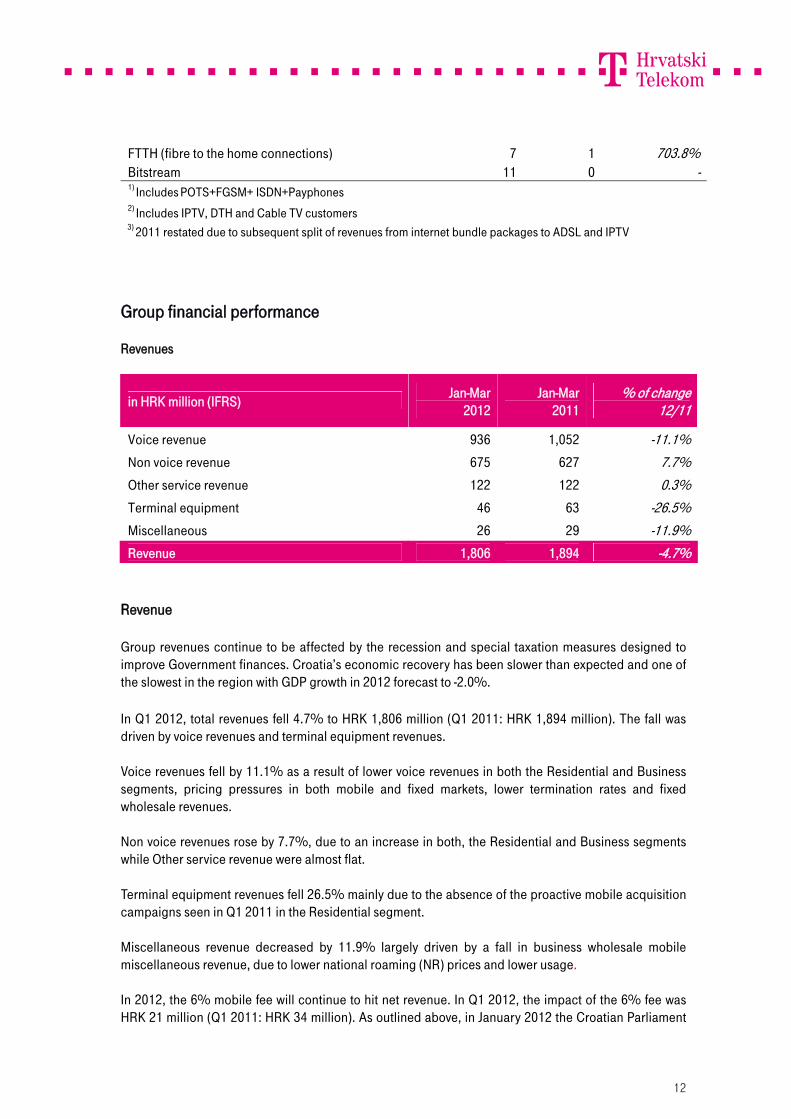
FTTH (fibre to the home connections) 7 1 703.8% Bitstream 11 0 - 1) Includes POTS+FGSM+ ISDN+Payphones 2) Includes IPTV, DTH and Cable TV customers
3) 2011 restated due to subsequent split of revenues from internet bundle packages to ADSL and IPTV
Group financial performance Revenues
in HRK million (IFRS) Jan-Mar 2012
Jan-Mar 2011
% of change 12/11
Voice revenue 936 1,052 -11.1% Non voice revenue 675 627 7.7% Other service revenue 122 122 0.3% Terminal equipment 46 63 -26.5% Miscellaneous 26 29 -11.9% Revenue 1,806 1,894 -4.7%
Revenue Group revenues continue to be affected by the recession and special taxation measures designed to improve Government finances. Croatia’s economic recovery has been slower than expected and one of the slowest in the region with GDP growth in 2012 forecast to -2.0%. In Q1 2012, total revenues fell 4.7% to HRK 1,806 million (Q1 2011: HRK 1,894 million). The fall was driven by voice revenues and terminal equipment revenues. Voice revenues fell by 11.1% as a result of lower voice revenues in both the Residential and Business segments, pricing pressures in both mobile and fixed markets, lower termination rates and fixed wholesale revenues. Non voice revenues rose by 7.7%, due to an increase in both, the Residential and Business segments while Other service revenue were almost flat. Terminal equipment revenues fell 26.5% mainly due to the absence of the proactive mobile acquisition campaigns seen in Q1 2011 in the Residential segment. Miscellaneous revenue decreased by 11.9% largely driven by a fall in business wholesale mobile miscellaneous revenue, due to lower national roaming (NR) prices and lower usage. In 2012, the 6% mobile fee will continue to hit net revenue. In Q1 2012, the impact of the 6% fee was HRK 21 million (Q1 2011: HRK 34 million). As outlined above, in January 2012 the Croatian Parliament
13
adopted the newly elected Government’s proposal to reinstate the 6% fee from 26 January 2012 after it had been cancelled for a brief period. The Q1 2012 contribution by subsidiaries to Group revenue was as follows: Iskon HRK 72 million (Q1 2011: HRK 56 million) and Combis HRK 74 million (Q1 2011: HRK 68 million). Operating expenses Total consolidated operating expenses before depreciation and amortization decreased by 10.2% to HRK 1,085 million in 2012 from HRK 1,208 million in 2011. This was mainly a result of decrease in material expenses. Material expenses Material expenses decreased from HRK 578 million in Q1 2011 to HRK 456 million in Q1 2012. This decrease was mainly due to lower merchandise cost compared to the first quarter of 2011 when proactive mobile acquisitions campaigns were underway which resulted in a different handset mix and smart pricing management to attract new customers. Services expenses decreased 5.7% due to lower telecommunication costs (lower roaming prices and traffic as well as lower mobile termination rates imposed by the Agency) and higher copyright fees as a result of larger TV customer base and more exclusive content offers. Employee benefits expenses Total employee benefits expenses decreased by 2.4% to HRK 285 million in 2012 from HRK 292 million in 2011. This is an effect of 9.3% lower number of employees and saving measures. Other expenses Other expenses decreased by 1.8% to HRK 320 million in 2012 from HRK 326 million in 2011. This was primarily due to lower sales commission costs, advertising expenses and postal charges. This decrease in costs is a result of reduced investment in media and sponsorships and improvements in billing procedures (single bill, e-bill) and costs reductions due to lower negotiated prices. Write down of assets Asset write-downs increased by 35.8% to HRK 34 million in 2012 from HRK 25 million in 2011 due to the higher value adjustment of inventories. However, the value adjustment of receivables decreased by 25.9% as a result of collected receivables from the previous year and improved dunning procedures. Depreciation and amortization
14
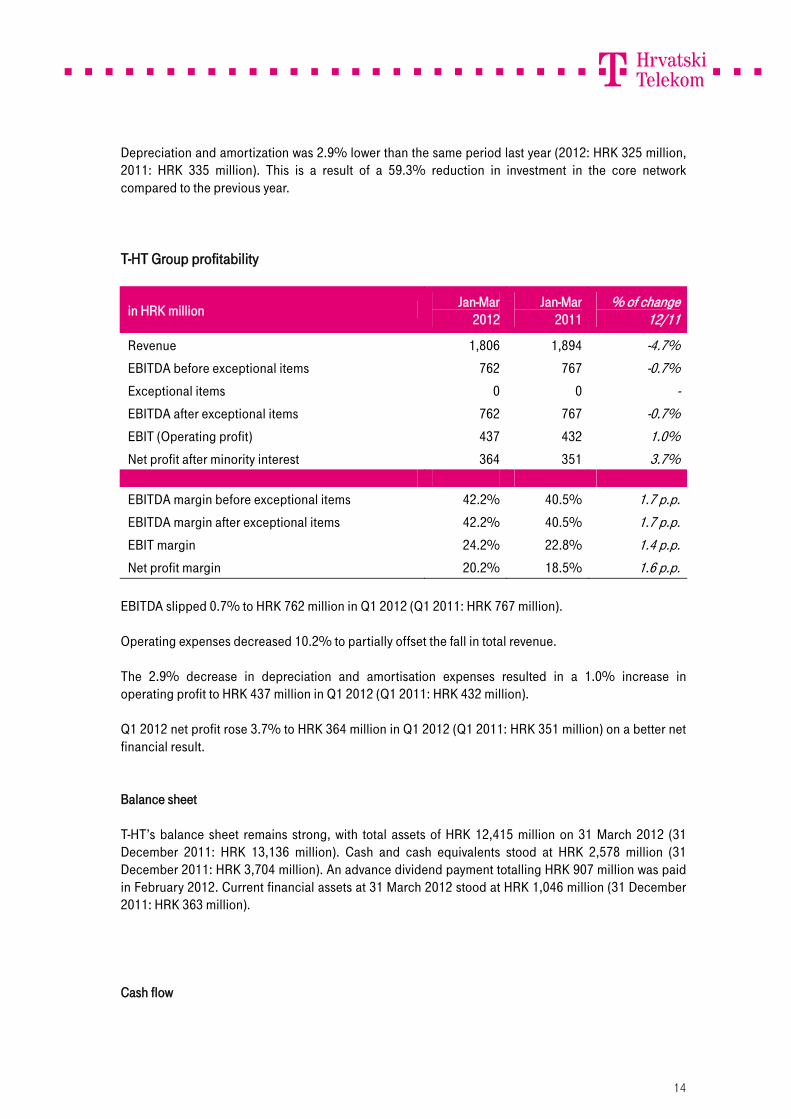
Depreciation and amortization was 2.9% lower than the same period last year (2012: HRK 325 million, 2011: HRK 335 million). This is a result of a 59.3% reduction in investment in the core network compared to the previous year. T-HT Group profitability
in HRK million Jan-Mar 2012
Jan-Mar 2011
% of change 12/11
Revenue 1,806 1,894 -4.7% EBITDA before exceptional items 762 767 -0.7% Exceptional items 0 0 - EBITDA after exceptional items 762 767 -0.7% EBIT (Operating profit) 437 432 1.0% Net profit after minority interest 364 351 3.7% EBITDA margin before exceptional items 42.2% 40.5% 1.7 p.p. EBITDA margin after exceptional items 42.2% 40.5% 1.7 p.p. EBIT margin 24.2% 22.8% 1.4 p.p. Net profit margin 20.2% 18.5% 1.6 p.p.
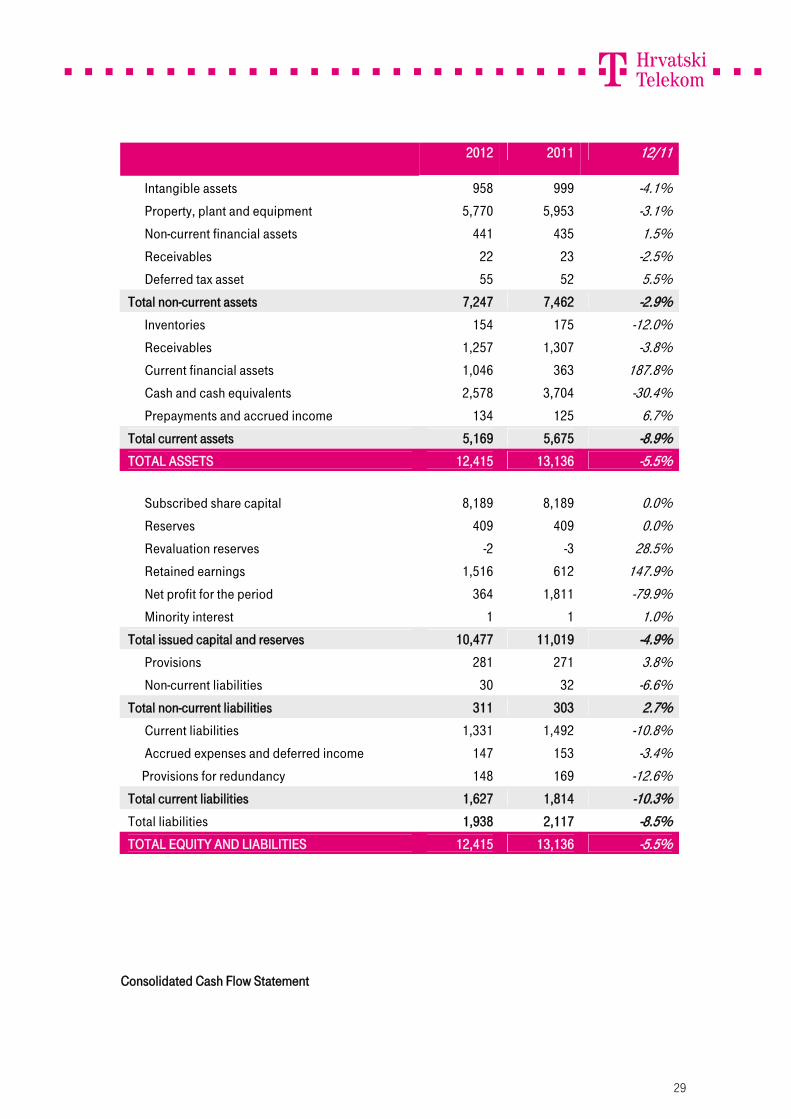
EBITDA slipped 0.7% to HRK 762 million in Q1 2012 (Q1 2011: HRK 767 million). Operating expenses decreased 10.2% to partially offset the fall in total revenue. The 2.9% decrease in depreciation and amortisation expenses resulted in a 1.0% increase in operating profit to HRK 437 million in Q1 2012 (Q1 2011: HRK 432 million). Q1 2012 net profit rose 3.7% to HRK 364 million in Q1 2012 (Q1 2011: HRK 351 million) on a better net financial result. Balance sheet T-HT’s balance sheet remains strong, with total assets of HRK 12,415 million on 31 March 2012 (31 December 2011: HRK 13,136 million). Cash and cash equivalents stood at HRK 2,578 million (31 December 2011: HRK 3,704 million). An advance dividend payment totalling HRK 907 million was paid in February 2012. Current financial assets at 31 March 2012 stood at HRK 1,046 million (31 December 2011: HRK 363 million). Cash flow
15
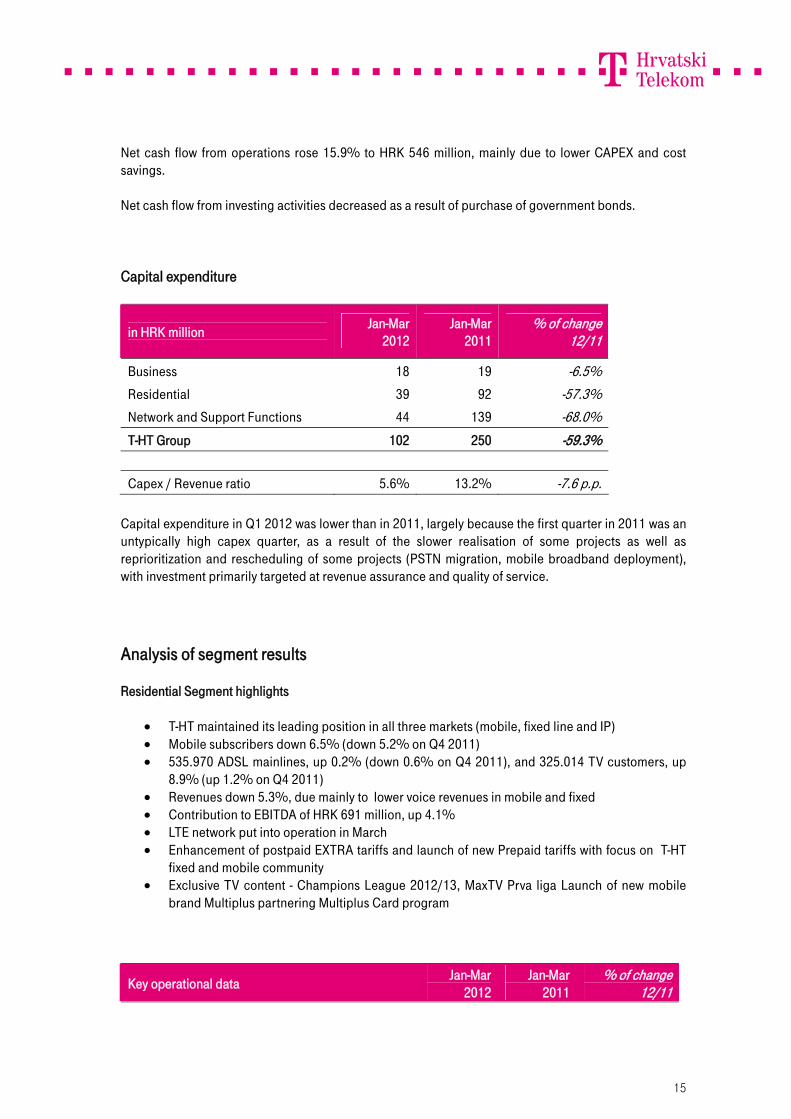
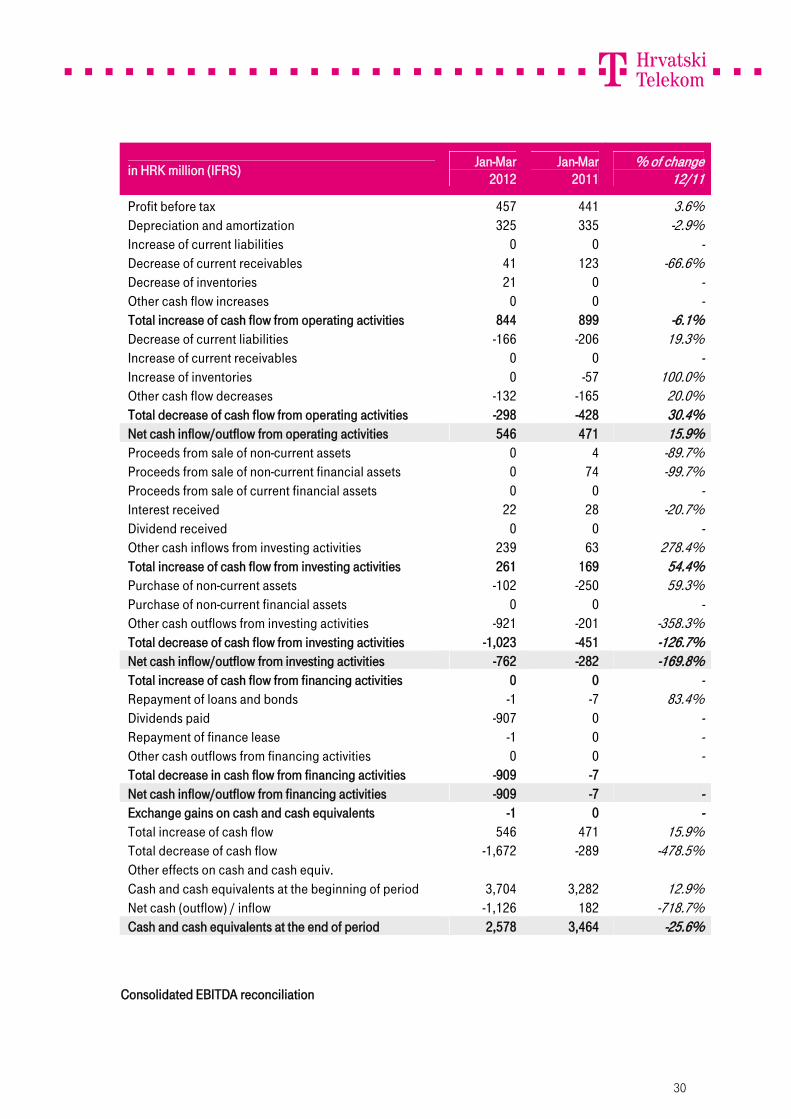
Net cash flow from operations rose 15.9% to HRK 546 million, mainly due to lower CAPEX and cost savings. Net cash flow from investing activities decreased as a result of purchase of government bonds. Capital expenditure
in HRK million Jan-Mar 2012
Jan-Mar 2011
% of change 12/11
Business 18 19 -6.5% Residential 39 92 -57.3% Network and Support Functions 44 139 -68.0% T-HT Group 102 250 -59.3% Capex / Revenue ratio 5.6% 13.2% -7.6 p.p.
Capital expenditure in Q1 2012 was lower than in 2011, largely because the first quarter in 2011 was an untypically high capex quarter, as a result of the slower realisation of some projects as well as reprioritization and rescheduling of some projects (PSTN migration, mobile broadband deployment), with investment primarily targeted at revenue assurance and quality of service.
Analysis of segment results Residential Segment highlights
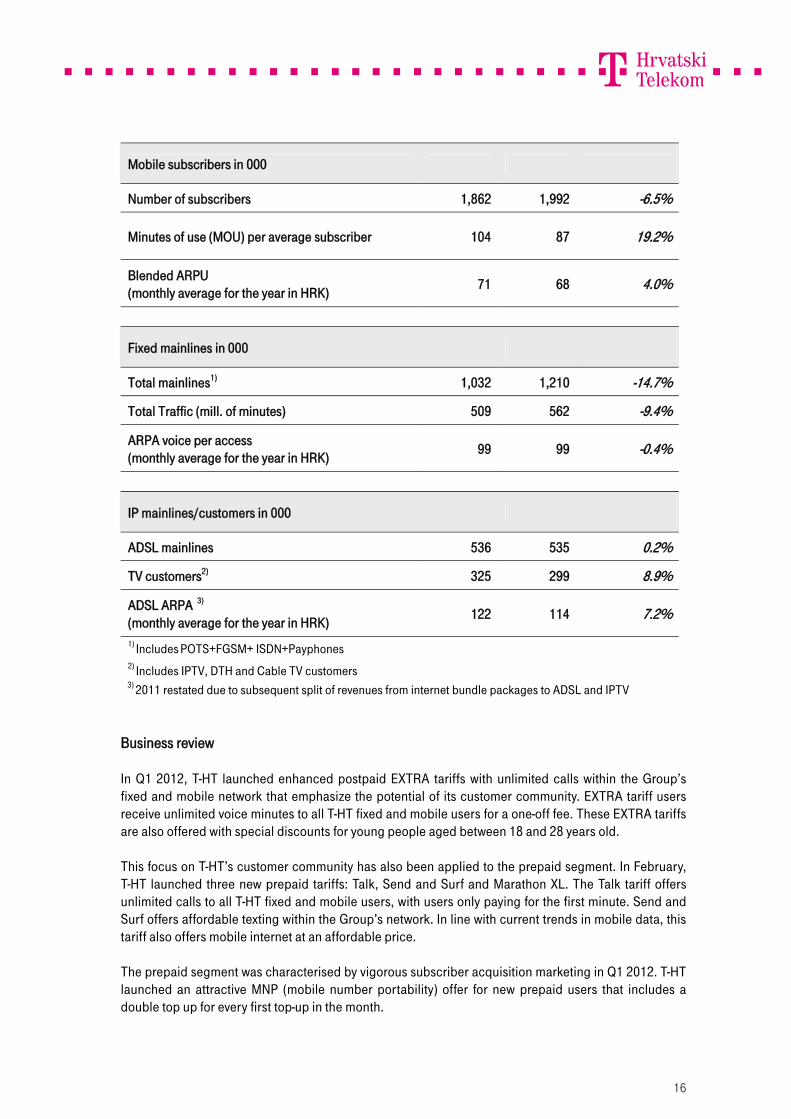
T-HT maintained its leading position in all three markets (mobile, fixed line and IP) Mobile subscribers down 6.5% (down 5.2% on Q4 2011) 535.970 ADSL mainlines, up 0.2% (down 0.6% on Q4 2011), and 325.014 TV customers, up
8.9% (up 1.2% on Q4 2011) Revenues down 5.3%, due mainly to lower voice revenues in mobile and fixed Contribution to EBITDA of HRK 691 million, up 4.1% LTE network put into operation in March Enhancement of postpaid EXTRA tariffs and launch of new Prepaid tariffs with focus on T-HT
fixed and mobile community Exclusive TV content - Champions League 2012/13, MaxTV Prva liga Launch of new mobile
brand Multiplus partnering Multiplus Card program
Key operational data Jan-Mar 2012
Jan-Mar 2011
% of change 12/11
16
Mobile subscribers in 000
Number of subscribers 1,862 1,992 -6.5%
Minutes of use (MOU) per average subscriber 104 87 19.2%
Blended ARPU (monthly average for the year in HRK) 71 68 4.0%
Fixed mainlines in 000
Total mainlines1) 1,032 1,210 -14.7%
Total Traffic (mill. of minutes) 509 562 -9.4%
ARPA voice per access (monthly average for the year in HRK) 99 99 -0.4%
IP mainlines/customers in 000
ADSL mainlines 536 535 0.2%
TV customers2) 325 299 8.9%
ADSL ARPA 3) (monthly average for the year in HRK) 122 114 7.2%
1) Includes POTS+FGSM+ ISDN+Payphones 2) Includes IPTV, DTH and Cable TV customers
3) 2011 restated due to subsequent split of revenues from internet bundle packages to ADSL and IPTV Business review In Q1 2012, T-HT launched enhanced postpaid EXTRA tariffs with unlimited calls within the Group’s fixed and mobile network that emphasize the potential of its customer community. EXTRA tariff users receive unlimited voice minutes to all T-HT fixed and mobile users for a one-off fee. These EXTRA tariffs are also offered with special discounts for young people aged between 18 and 28 years old. This focus on T-HT’s customer community has also been applied to the prepaid segment. In February, T-HT launched three new prepaid tariffs: Talk, Send and Surf and Marathon XL. The Talk tariff offers unlimited calls to all T-HT fixed and mobile users, with users only paying for the first minute. Send and Surf offers affordable texting within the Group’s network. In line with current trends in mobile data, this tariff also offers mobile internet at an affordable price. The prepaid segment was characterised by vigorous subscriber acquisition marketing in Q1 2012. T-HT launched an attractive MNP (mobile number portability) offer for new prepaid users that includes a double top up for every first top-up in the month.
17
For new Simpa users, the new MNP offer includes 1,000 free text messages to any network and 1 GB of free internet traffic. “bonbon” launched a new subscriber acquisition campaign offering 1,000 free text messages within the network every month for all new users until 2020. Additionally, bonbon launched a promotion for all new and existing bonbon users providing a 50% discount on the monthly package of choice. In January 2012, T-HT launched MyT web portal with combined functionalities for both fixed and mobile services. In March, T-HT completed the commercial launch of its new 4G network based on LTE technology, which offers data transmission up to 10 times faster than the current 3G network. March also saw the introduction of prepaid mobile brand MultiPlus, brand reseller concept with a major retail chain that is carried on the Group’s network infrastructure. . Multiplus mobile is a brand targeted at users who prefer simple and affordable mobile solutions. It has just one simple tariff, affordable cross-net prices, no minimum top-up conditions and an option to collect points within the Multiplus Card program. Also in Q1, T-HT launched 12 and 24-month contract-based MAXadsl offers and MAXtv promotions, focused on customer acquisition and retention. In Q1 2012, the Group’s mobile subscriber base fell 6.5% to 1,862,042 (Q1 2011: 1,991,882), mainly as a result of a decrease of customers with dual and promotional SIM cards. Minutes of usage per average subscriber in Q1 2012 rose 19.2%. Blended ARPU in Q1 2012 was up 4.0% , as a result of attractive offers and increased minutes of usage. At the end of March 2012, total fixed access mainlines stood at 1,031,943, down 14.7% on Q1 2011. The fall was accelerated by regulation that introduced new wholesale products and is in line with the general trend in the telecommunication market toward fixed to mobile and IP substitution. In Q1 2012, fixed telephony users generated 509 million minutes, down 9.4% on Q1 2011, as fixed traffic was substituted by mobile and IP traffic. Q1 2012 fixed voice ARPA decreased 0.4%, as a result of the market trends mentioned above. At the end of March 2012, ADSL mainlines totalled 535,970, up 0.2% over the previous year. At the same time, ADSL mainline ARPA rose by 7.2%, due to a greater share of customers with higher traffic packages. The Group’s pay TV customer base continues to show steady growth. At the end of March, subscribers totalled 325,014, up 8.9% on Q1 2011. Satellite TV, which is an extension of the IPTV service, continues to grow following its repositioning and re-pricing in 2011, and is expected to contribute fairly to the overall success of the Group’s payTV services.
18
Residential Segment financial performance
in HRK million Jan-Mar 2012
Jan-Mar 2011
% of change 12/11
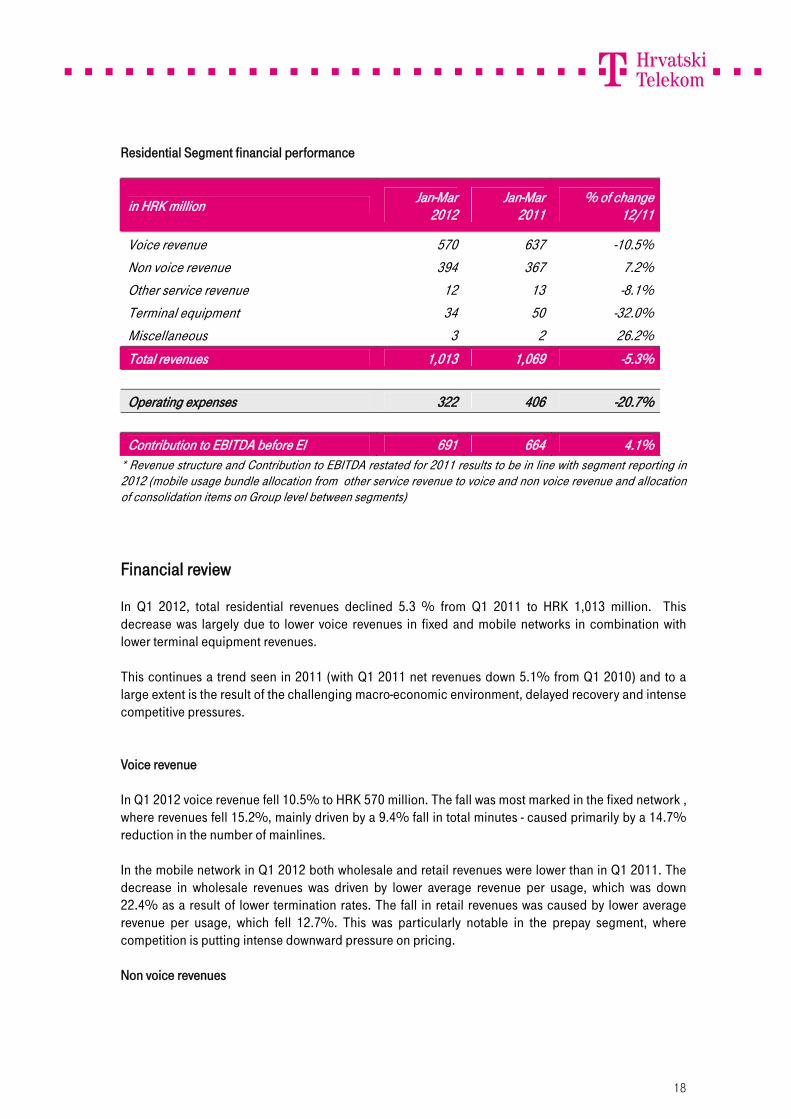
Voice revenue 570 637 -10.5% Non voice revenue 394 367 7.2% Other service revenue 12 13 -8.1% Terminal equipment 34 50 -32.0% Miscellaneous 3 2 26.2% Total revenues 1,013 1,069 -5.3% Operating expenses 322 406 -20.7% Contribution to EBITDA before EI 691 664 4.1%
* Revenue structure and Contribution to EBITDA restated for 2011 results to be in line with segment reporting in 2012 (mobile usage bundle allocation from other service revenue to voice and non voice revenue and allocation of consolidation items on Group level between segments)
Financial review In Q1 2012, total residential revenues declined 5.3 % from Q1 2011 to HRK 1,013 million. This decrease was largely due to lower voice revenues in fixed and mobile networks in combination with lower terminal equipment revenues. This continues a trend seen in 2011 (with Q1 2011 net revenues down 5.1% from Q1 2010) and to a large extent is the result of the challenging macro-economic environment, delayed recovery and intense competitive pressures. Voice revenue In Q1 2012 voice revenue fell 10.5% to HRK 570 million. The fall was most marked in the fixed network , where revenues fell 15.2%, mainly driven by a 9.4% fall in total minutes - caused primarily by a 14.7% reduction in the number of mainlines. In the mobile network in Q1 2012 both wholesale and retail revenues were lower than in Q1 2011. The decrease in wholesale revenues was driven by lower average revenue per usage, which was down 22.4% as a result of lower termination rates. The fall in retail revenues was caused by lower average revenue per usage, which fell 12.7%. This was particularly notable in the prepay segment, where competition is putting intense downward pressure on pricing. Non voice revenues
19
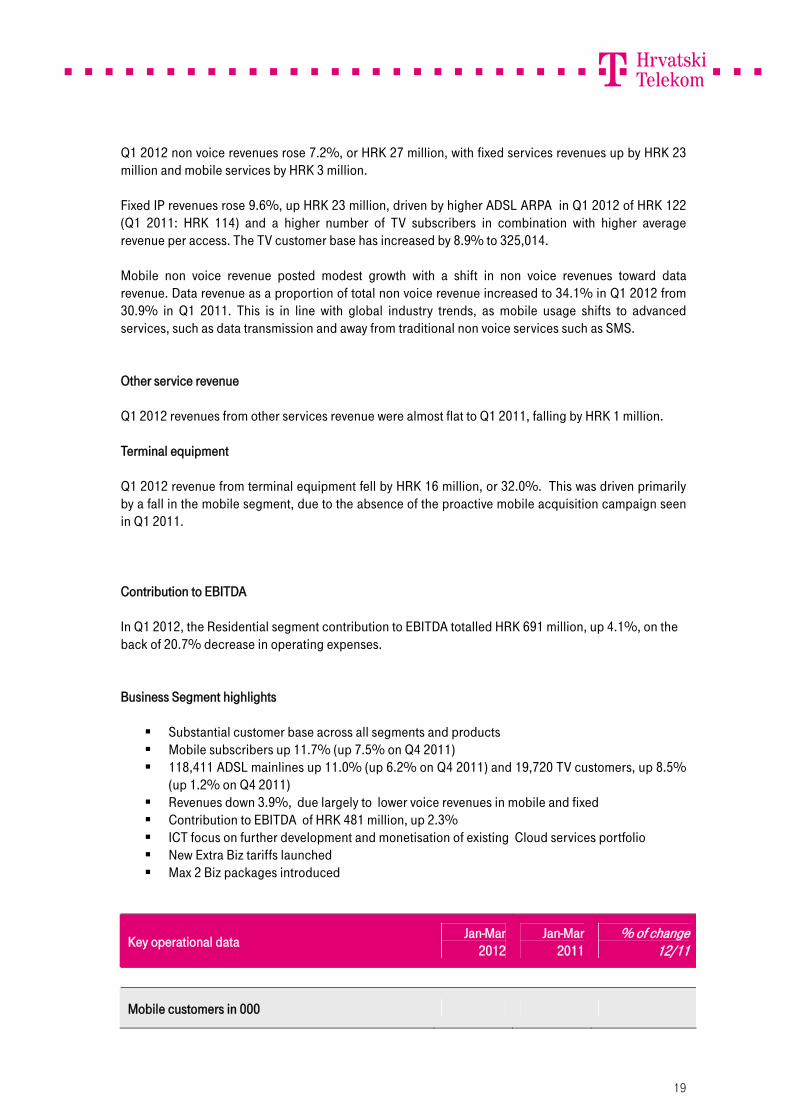
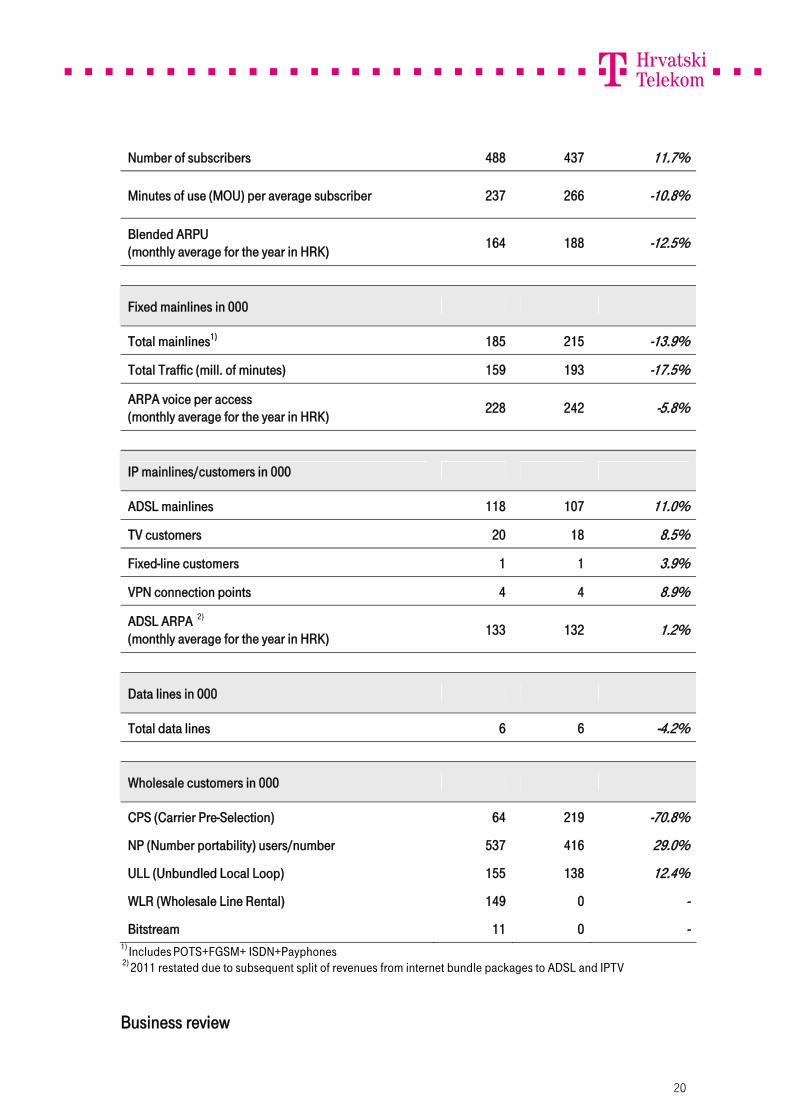
Q1 2012 non voice revenues rose 7.2%, or HRK 27 million, with fixed services revenues up by HRK 23 million and mobile services by HRK 3 million. Fixed IP revenues rose 9.6%, up HRK 23 million, driven by higher ADSL ARPA in Q1 2012 of HRK 122 (Q1 2011: HRK 114) and a higher number of TV subscribers in combination with higher average revenue per access. The TV customer base has increased by 8.9% to 325,014. Mobile non voice revenue posted modest growth with a shift in non voice revenues toward data revenue. Data revenue as a proportion of total non voice revenue increased to 34.1% in Q1 2012 from 30.9% in Q1 2011. This is in line with global industry trends, as mobile usage shifts to advanced services, such as data transmission and away from traditional non voice services such as SMS. Other service revenue Q1 2012 revenues from other services revenue were almost flat to Q1 2011, falling by HRK 1 million. Terminal equipment Q1 2012 revenue from terminal equipment fell by HRK 16 million, or 32.0%. This was driven primarily by a fall in the mobile segment, due to the absence of the proactive mobile acquisition campaign seen in Q1 2011. Contribution to EBITDA In Q1 2012, the Residential segment contribution to EBITDA totalled HRK 691 million, up 4.1%, on the back of 20.7% decrease in operating expenses. Business Segment highlights Substantial customer base across all segments and products Mobile subscribers up 11.7% (up 7.5% on Q4 2011) 118,411 ADSL mainlines up 11.0% (up 6.2% on Q4 2011) and 19,720 TV customers, up 8.5%
(up 1.2% on Q4 2011) Revenues down 3.9%, due largely to lower voice revenues in mobile and fixed Contribution to EBITDA of HRK 481 million, up 2.3% ICT focus on further development and monetisation of existing Cloud services portfolio New Extra Biz tariffs launched Max 2 Biz packages introduced
Key operational data Jan-Mar 2012
Jan-Mar 2011
% of change 12/11
Mobile customers in 000
20
Number of subscribers 488 437 11.7%
Minutes of use (MOU) per average subscriber 237 266 -10.8%
Blended ARPU (monthly average for the year in HRK) 164 188 -12.5%
Fixed mainlines in 000
Total mainlines1) 185 215 -13.9%
Total Traffic (mill. of minutes) 159 193 -17.5%
ARPA voice per access (monthly average for the year in HRK) 228 242 -5.8%
IP mainlines/customers in 000
ADSL mainlines 118 107 11.0%
TV customers 20 18 8.5%
Fixed-line customers 1 1 3.9%
VPN connection points 4 4 8.9%
ADSL ARPA 2) (monthly average for the year in HRK) 133 132 1.2%
Data lines in 000
Total data lines 6 6 -4.2%
Wholesale customers in 000
CPS (Carrier Pre-Selection) 64 219 -70.8%
NP (Number portability) users/number 537 416 29.0%
ULL (Unbundled Local Loop) 155 138 12.4%
WLR (Wholesale Line Rental) 149 0 -
Bitstream 11 0 - 1) Includes POTS+FGSM+ ISDN+Payphones 2) 2011 restated due to subsequent split of revenues from internet bundle packages to ADSL and IPTV
Business review
21
The Q1 2012 mobile customer base was 11.7% up on the Q1 previous year. Minutes of use per subscriber fell 10.8% and blended ARPU declined 12.5%, both owing to the impact of the tough economic climate. The Group launched new tariffs in Q1 2012: new Extra Biz tariffs included Talk , Mix and Total. Extra Biz Total tariffs with the Unlimited talk option offer unlimited calls within the T-Com and T-Mobile network, flat-rate Internet and packages of messages and minutes across other networks, depending on the tariff model. Under the VPN Exclusive tariff, unlimited calls within the T-mobile HR network and all HR fixed networks were introduced in March. T-HT’s fixed line customer base was down 13.9%, in line with the overall trend in the telecommunication market of mobile and IP substitution. The lower customer base led to a 17.5% fall in total fixed traffic. Q1 2012 fixed voice ARPA decreased 5.8% to HRK 228 from the same period in 2011. The Q1 2012 ADSL subscriber base was 11.0% higher than the previous year, at 118,411 business users, as result of attractive retention and acquisition campaigns. ARPA increased 1.2%. T-HT introduced the Max2 Biz S, M and Flat packages at the beginning of March. Customers signing up for 12/24 months receive a flat package with 4Mbps speed. The TV subscriber base rose 8.5% to 19,720 over the previous year as result of continuous improvements in service and program offers. Until the end of February 2012, promotional offers were available to new IPTV and Satellite TV users. Customers signing a 24 month contract received a 50% discount for the first 12 months and 6 months free subscription to one of the following: Sports plus package and HBO (both IPTV and Satellite TV ) or Snimalica 10 (only for IPTV customers). Existing IPTV customers were offered a promotional deal of a 24 month contract for IPTV and 6 months free subscription to one of the following: Sports plus package, HBO or Snimalica 10. The IP fixed line customer base increased 3.9%. The VPN customer base increased 8.9% over the previous year. T-HT continues to promote the migration of existing traditional data customers to the IP based products. The number of data lines declined 4.2% compared to the same period last year. Traditional data lines are decreasing, but the Metro Ethernet service is growing. After initial successes with IaaS and SaaS, ICT is further developing Cloud services portfolio. tportal
22
In Q1 2012, tportal.hr maintained its ranking as one of the top three web portals in Croatia by reach, with more than 800,000 unique visitors per month according to Gemius, an independent Internet traffic research agency. In addition, tportal's Facebook page now has over 200,000 fans, consolidating the portal’s positioning within social networks and further improving the clickthrough rate and other key metrics. Wholesale The ULL (unbundled local loop) market is still growing as operators are still very much focused on the fully unbundled local loop as infrastructure for broadband services. At the end of Q1 2012, 154,845 active ULL lines were registered, against 137,819 at the end of Q1 2011. To date, nine operators have signed contracts for wholesale bitstream services and eight operators have already started commercial operations (based on standard wholesale bitstream offer). In Q1 2012, five operators started commercial operations based on naked bitstream. Wholesale bitstream on copper is becoming increasingly prevalent and gross additions totalled 4,500 new ADSL lines in Q1 2012. The number of naked DSL lines is not significant (less than 1,000 in total) but is expected to grow in the future. At the end of Q1 2012, 148,920 active WLR lines were provided to four operators. As a consequence of WLR, the number of pure CPS customers fell to 64,038 at the end of Q1 2012. New CPS activations are primarily connected with WLR activations and will contribute to WLR gross additions (not to CPS gross additions). At the end of Q1 2012, ported numbers from T-HT’s fixed network to other fixed networks came to 536,539 (Q1 2011: 416,045), due largely to ULL activations. In December 2011, the Agency reached a decision regarding the regulation of Wholesale Leased Lines. Along with the regulation of SDH/PDH lines, regulation was extended to Ethernet and xWDM lines. The new offer is valid from April 1 2012 and will be updated on October 1 2012 with a new distance oriented pricing scheme. The data and IP business saw 76% growth of sold IP volumes. Business Segment financial performance
in HRK million Jan-Mar 2012
Jan-Mar 2011
% of change 12/11
23
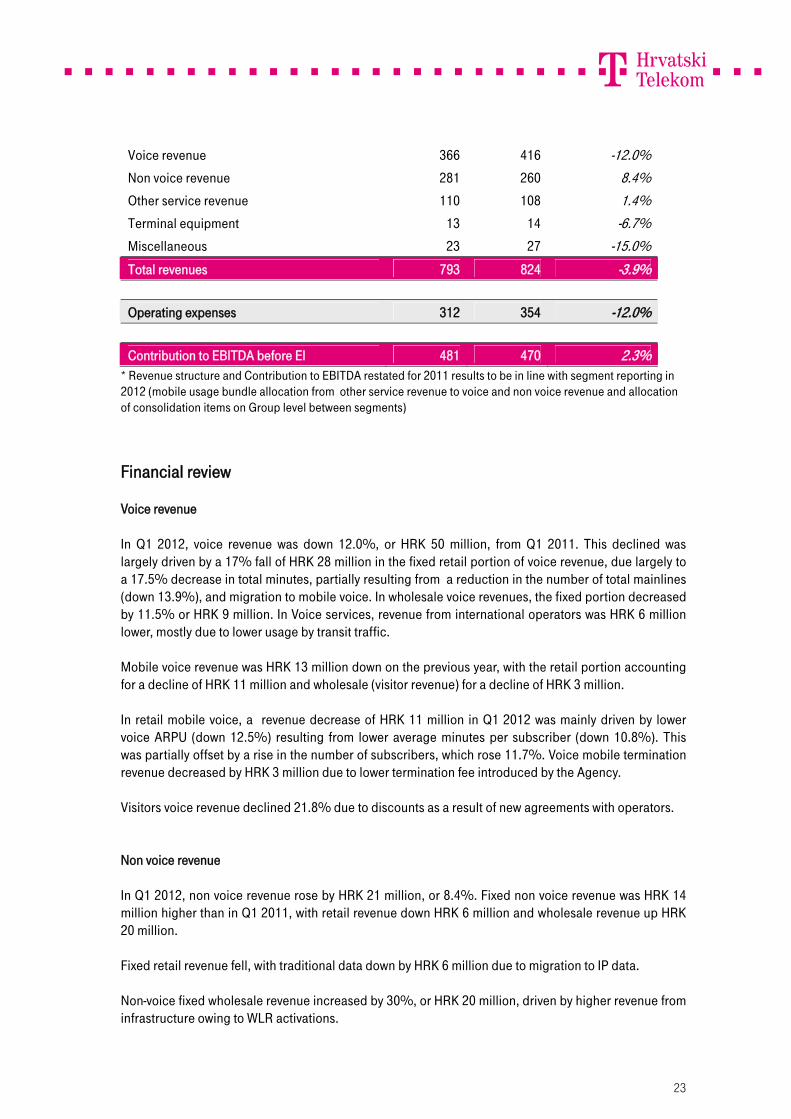
Voice revenue 366 416 -12.0% Non voice revenue 281 260 8.4% Other service revenue 110 108 1.4% Terminal equipment 13 14 -6.7% Miscellaneous 23 27 -15.0% Total revenues 793 824 -3.9% Operating expenses 312 354 -12.0% Contribution to EBITDA before EI 481 470 2.3%
* Revenue structure and Contribution to EBITDA restated for 2011 results to be in line with segment reporting in 2012 (mobile usage bundle allocation from other service revenue to voice and non voice revenue and allocation of consolidation items on Group level between segments) Financial review Voice revenue In Q1 2012, voice revenue was down 12.0%, or HRK 50 million, from Q1 2011. This declined was largely driven by a 17% fall of HRK 28 million in the fixed retail portion of voice revenue, due largely to a 17.5% decrease in total minutes, partially resulting from a reduction in the number of total mainlines (down 13.9%), and migration to mobile voice. In wholesale voice revenues, the fixed portion decreased by 11.5% or HRK 9 million. In Voice services, revenue from international operators was HRK 6 million lower, mostly due to lower usage by transit traffic. Mobile voice revenue was HRK 13 million down on the previous year, with the retail portion accounting for a decline of HRK 11 million and wholesale (visitor revenue) for a decline of HRK 3 million. In retail mobile voice, a revenue decrease of HRK 11 million in Q1 2012 was mainly driven by lower voice ARPU (down 12.5%) resulting from lower average minutes per subscriber (down 10.8%). This was partially offset by a rise in the number of subscribers, which rose 11.7%. Voice mobile termination revenue decreased by HRK 3 million due to lower termination fee introduced by the Agency. Visitors voice revenue declined 21.8% due to discounts as a result of new agreements with operators. Non voice revenue In Q1 2012, non voice revenue rose by HRK 21 million, or 8.4%. Fixed non voice revenue was HRK 14 million higher than in Q1 2011, with retail revenue down HRK 6 million and wholesale revenue up HRK 20 million. Fixed retail revenue fell, with traditional data down by HRK 6 million due to migration to IP data. Non-voice fixed wholesale revenue increased by 30%, or HRK 20 million, driven by higher revenue from infrastructure owing to WLR activations.
24
An increase in non-voice mobile revenue of HRK 7 million was due to HRK 6 million from retail, driven by mobile data, while visitors’ revenue accounted for HRK 2 million as a result of higher usage. Other service revenue Other service revenue in Q1 2012 rose by HRK 1.5 million driven by higher ICT revenue. Terminal equipment Q1 2012 revenue from terminal equipment decreased by HRK 1 million, or 6.7%. Miscellaneous revenue Miscellaneous revenue decreased by 15.0%, or HRK 4 million, compared with the previous year. The decline was largely driven by business wholesale mobile miscellaneous revenue, which fell 18.5%, or HRK 5 million, due to lower national roaming (NR) prices and lower usage. Contribution to EBITDA The Business Segment contribution to EBITDA rose 2.3%, to HRK 481 million driven by a significant decrease in operating expenses. Network and support functions financial performance
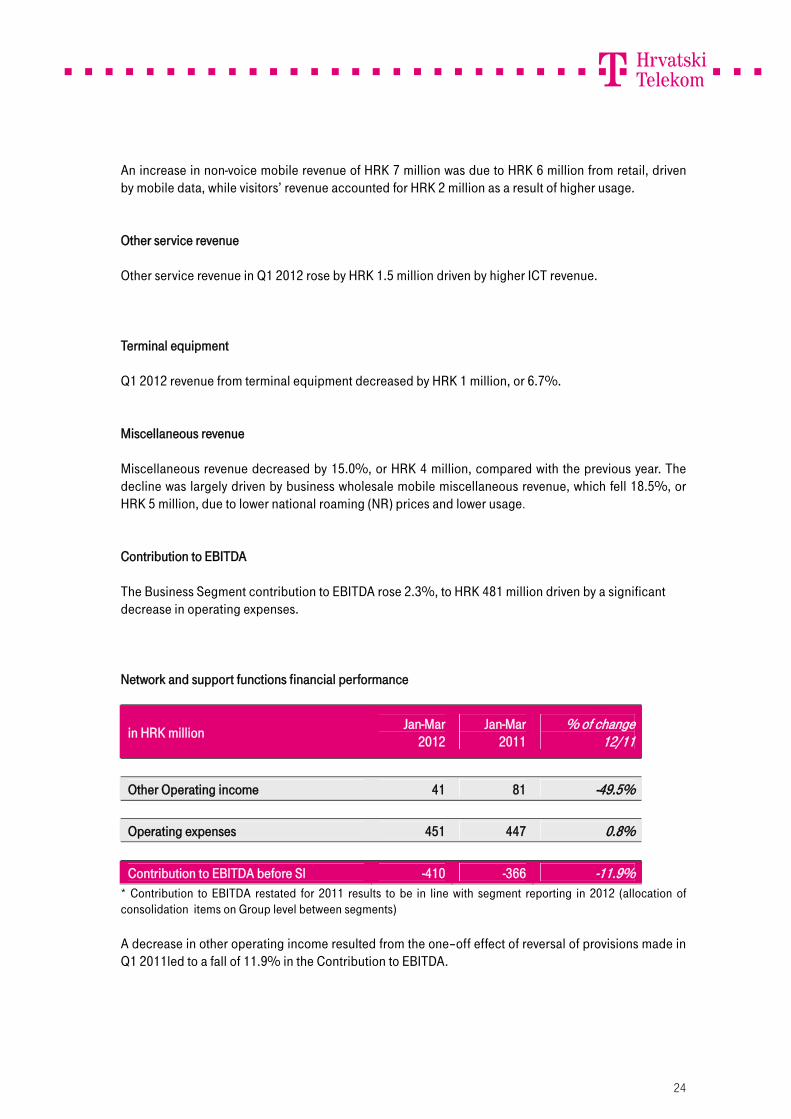
in HRK million Jan-Mar 2012
Jan-Mar 2011
% of change 12/11
Other Operating income 41 81 -49.5% Operating expenses 451 447 0.8% Contribution to EBITDA before SI -410 -366 -11.9%
* Contribution to EBITDA restated for 2011 results to be in line with segment reporting in 2012 (allocation of consolidation items on Group level between segments) A decrease in other operating income resulted from the one–off effect of reversal of provisions made in Q1 2011led to a fall of 11.9% in the Contribution to EBITDA.
25
Network and Service Platforms Network and Service Platforms are T-HT’s core infrastructure, and it is continuously being upgraded and improved in line with the Group’s strategy and marketing plans. By consolidating the Group’s business operations, T-HT started to converge the functionalities of its resources in both the fixed and mobile networks on joint service platforms, thus achieving improved availability of services and more cost efficient operations. In Q1 2012, the Group has been working on the further development of its network infrastructure, increasing broadband access capacity and modernizing the transport and core network. In the field of fixed networks, T-HT has adopted a strategy of providing all services mainly via one common broadband port. This resulted in the transformation of its access network with the construction of a new optical access network, including an optical access platform (GPON) and selective modernization of the copper access network. Furthermore, the Group continued functional upgrades of the existing PSTN network to enable VoIP telephony provision over broadband. In the field of mobile networks, continuous radio access and core network transformation will support the development and rapid implementation of new, economically optimized technologies (e.g. HSPA, LTE), while taking into account the maximum utilization of existing infrastructure and frequency resources. The Group has focused significantly on developing Mobile BroadBand (MBB) access, through existing and newly deployed technologies such as UMTS900, in order to improve data services coverage. Expansion of the network by building new infrastructural points has also continued, along with capacity expansion to support strong data traffic increase. Network infrastructure Fiber optical infrastructure The Group is involved in ongoing activities related to the opening of FTTC (Fiber-to-the-curb) and FTTN (Fiber-to-the-node) options, which would allow a shortening of the copper local loop by opening new facilities. This will allow the increase of copper network BB (broadband) throughput in areas where optical access network extension is not planned and where the existing copper local loop is too long to enable provisioning of appropriate BB services. Evolution and modernization of 2G radio access network The total aggregation layer of the radio access network has been modernized, as part of the evolution of the 2G network and 14 new base station controllers have been integrated. A tender for the supply of RAN hardware, software and services was completed in March. The evolution of the 2G network, replacing existing 2G HW with next generation multiradio equipment, is a prerequisite for mobile broadband in rural areas and for the introduction of more energy efficient hardware and a smooth transition to LTE technology. 3G radio access network upgrades The Group is working to optimize the radio access network to enable top level services for an increasing number of smartphones and tablets in the 3G network. Data traffic continues to increase in the 3G network, requiring constant data capacity upgrades. HSPA+ functionality is now enabled on 426
26
3G locations covering 33% of population with access to 21 Mb/s downlink speeds and uplink speeds of 5.8 Mb/s. LTE radio access network T-HT was the first amongst its domestic rivals to launch a commercial 4G network on-air in Croatia. The LTE radio signal became available in Zagreb, Split, Rijeka and Osijek in March 2012. In the first phase, LTE is available on the 1800 MHz frequency band, which provides download data speeds of up to 75 Mb/s.
Risk management Besides the business and regulatory developments detailed in this statement, and in audited financial statements for 2011 made public, there were no material changes to the Group’s risk profile in the period under review.
Group 2012 outlook Revenue
27
The Croatian economy continues to be sluggish with no signs of recovery since entering recession in 2009 and, according to recent forecasts, growth is still not expected to materialize in 2012. In this economic environment, with domestic regulatory pressures and progress towards alignment with EU regulation as well as intensifying competition, last year’s trend in Group revenue decline is expected to continue. This will be additionally impacted by the recently introduced increase in the VAT rate and the reinstatement of the 6% fee on mobile services. EBITDA before exceptional items The Group will continue its cost management program throughout the year. Nevertheless, due to continued severe economic and market conditions in Croatia, leading to lower expectations for revenue, the Group expects 2012 EBITDA to be somewhat lower than the 2011 level. CAPEX The current regulatory framework continues to deter investment in fiber infrastructure by the Group. However, T-HT will continue investment to transform its fixed core network and enhance its infrastructure to support further growth in fixed and mobile broadband demand. As a consequence, capex in 2012 is expected to be higher than the previous year.
Regional Expansion The Group continues to monitor and evaluate expansion opportunities to increase shareholder value.
T-HT Group Financial statements
Consolidated Income Statement
in HRK million (IFRS) Jan-Mar Jan-Mar % of change
28
2012 2011 12/11
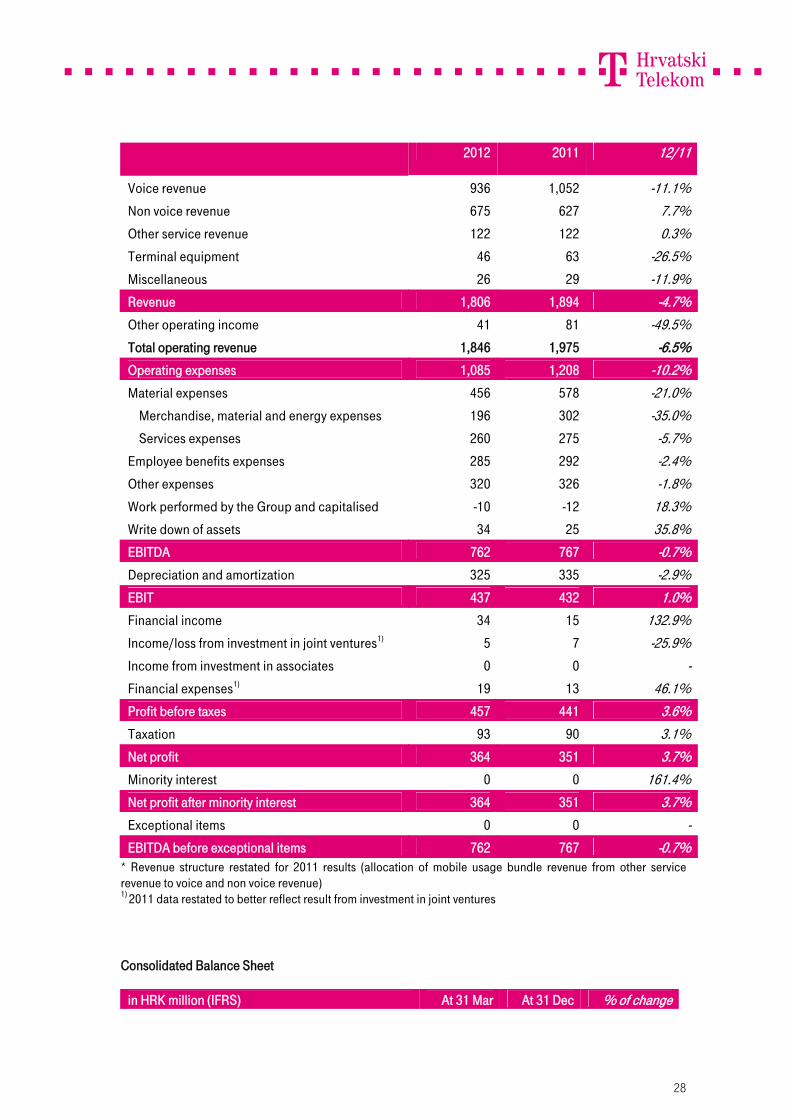
Voice revenue 936 1,052 -11.1% Non voice revenue 675 627 7.7% Other service revenue 122 122 0.3% Terminal equipment 46 63 -26.5% Miscellaneous 26 29 -11.9% Revenue 1,806 1,894 -4.7% Other operating income 41 81 -49.5% Total operating revenue 1,846 1,975 -6.5% Operating expenses 1,085 1,208 -10.2% Material expenses 456 578 -21.0% Merchandise, material and energy expenses 196 302 -35.0% Services expenses 260 275 -5.7% Employee benefits expenses 285 292 -2.4% Other expenses 320 326 -1.8% Work performed by the Group and capitalised -10 -12 18.3% Write down of assets 34 25 35.8% EBITDA 762 767 -0.7% Depreciation and amortization 325 335 -2.9% EBIT 437 432 1.0% Financial income 34 15 132.9% Income/loss from investment in joint ventures1) 5 7 -25.9% Income from investment in associates 0 0 - Financial expenses1) 19 13 46.1% Profit before taxes 457 441 3.6% Taxation 93 90 3.1% Net profit 364 351 3.7% Minority interest 0 0 161.4% Net profit after minority interest 364 351 3.7% Exceptional items 0 0 - EBITDA before exceptional items 762 767 -0.7%
* Revenue structure restated for 2011 results (allocation of mobile usage bundle revenue from other service revenue to voice and non voice revenue) 1) 2011 data restated to better reflect result from investment in joint ventures
Consolidated Balance Sheet
in HRK million (IFRS) At 31 Mar At 31 Dec % of change
29
2012 2011 12/11
Intangible assets 958 999 -4.1% Property, plant and equipment 5,770 5,953 -3.1% Non-current financial assets 441 435 1.5% Receivables 22 23 -2.5% Deferred tax asset 55 52 5.5% Total non-current assets 7,247 7,462 -2.9% Inventories 154 175 -12.0% Receivables 1,257 1,307 -3.8% Current financial assets 1,046 363 187.8% Cash and cash equivalents 2,578 3,704 -30.4% Prepayments and accrued income 134 125 6.7% Total current assets 5,169 5,675 -8.9% TOTAL ASSETS 12,415 13,136 -5.5% Subscribed share capital 8,189 8,189 0.0% Reserves 409 409 0.0% Revaluation reserves -2 -3 28.5% Retained earnings 1,516 612 147.9% Net profit for the period 364 1,811 -79.9% Minority interest 1 1 1.0% Total issued capital and reserves 10,477 11,019 -4.9% Provisions 281 271 3.8% Non-current liabilities 30 32 -6.6% Total non-current liabilities 311 303 2.7% Current liabilities 1,331 1,492 -10.8% Accrued expenses and deferred income 147 153 -3.4% Provisions for redundancy 148 169 -12.6% Total current liabilities 1,627 1,814 -10.3% Total liabilities 1,938 2,117 -8.5% TOTAL EQUITY AND LIABILITIES 12,415 13,136 -5.5%
Consolidated Cash Flow Statement
30
in HRK million (IFRS) Jan-Mar 2012
Jan-Mar 2011
% of change 12/11
Profit before tax 457 441 3.6% Depreciation and amortization 325 335 -2.9% Increase of current liabilities 0 0 - Decrease of current receivables 41 123 -66.6% Decrease of inventories 21 0 - Other cash flow increases 0 0 - Total increase of cash flow from operating activities 844 899 -6.1% Decrease of current liabilities -166 -206 19.3% Increase of current receivables 0 0 - Increase of inventories 0 -57 100.0% Other cash flow decreases -132 -165 20.0% Total decrease of cash flow from operating activities -298 -428 30.4% Net cash inflow/outflow from operating activities 546 471 15.9% Proceeds from sale of non-current assets 0 4 -89.7% Proceeds from sale of non-current financial assets 0 74 -99.7% Proceeds from sale of current financial assets 0 0 - Interest received 22 28 -20.7% Dividend received 0 0 - Other cash inflows from investing activities 239 63 278.4% Total increase of cash flow from investing activities 261 169 54.4% Purchase of non-current assets -102 -250 59.3% Purchase of non-current financial assets 0 0 - Other cash outflows from investing activities -921 -201 -358.3% Total decrease of cash flow from investing activities -1,023 -451 -126.7% Net cash inflow/outflow from investing activities -762 -282 -169.8% Total increase of cash flow from financing activities 0 0 - Repayment of loans and bonds -1 -7 83.4% Dividends paid -907 0 - Repayment of finance lease -1 0 - Other cash outflows from financing activities 0 0 - Total decrease in cash flow from financing activities -909 -7 -13505.1% Net cash inflow/outflow from financing activities -909 -7 - Exchange gains on cash and cash equivalents -1 0 - Total increase of cash flow 546 471 15.9% Total decrease of cash flow -1,672 -289 -478.5% Other effects on cash and cash equiv. Cash and cash equivalents at the beginning of period 3,704 3,282 12.9% Net cash (outflow) / inflow -1,126 182 -718.7% Cash and cash equivalents at the end of period 2,578 3,464 -25.6%
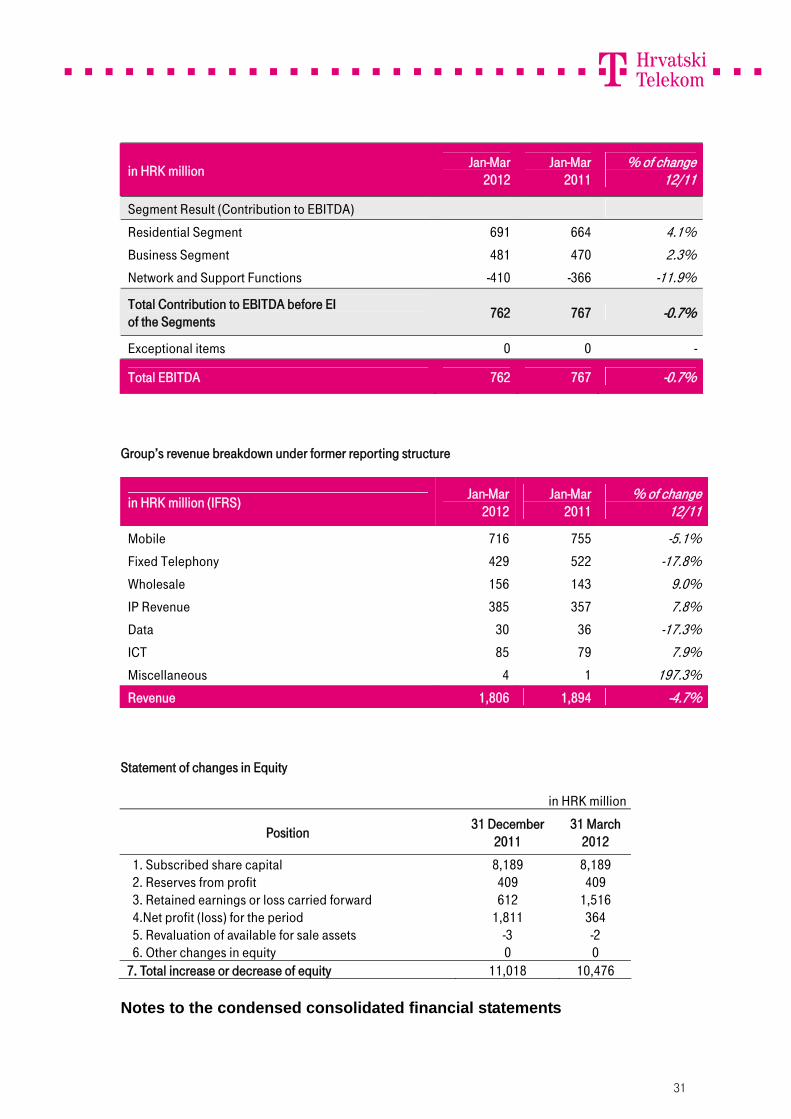
Consolidated EBITDA reconciliation
31
in HRK million Jan-Mar 2012
Jan-Mar 2011
% of change 12/11
Segment Result (Contribution to EBITDA) Residential Segment 691 664 4.1% Business Segment 481 470 2.3% Network and Support Functions -410 -366 -11.9%
Total Contribution to EBITDA before EI of the Segments 762 767 -0.7%
Exceptional items 0 0 -
Total EBITDA 762 767 -0.7%
Group’s revenue breakdown under former reporting structure
in HRK million (IFRS) Jan-Mar 2012
Jan-Mar 2011
% of change 12/11
Mobile 716 755 -5.1% Fixed Telephony 429 522 -17.8% Wholesale 156 143 9.0% IP Revenue 385 357 7.8% Data 30 36 -17.3% ICT 85 79 7.9% Miscellaneous 4 1 197.3% Revenue 1,806 1,894 -4.7%
Statement of changes in Equity
in HRK million
Position 31 December 2011
31 March 2012
1. Subscribed share capital 8,189 8,189 2. Reserves from profit 409 409 3. Retained earnings or loss carried forward 612 1,516 4.Net profit (loss) for the period 1,811 364 5. Revaluation of available for sale assets -3 -2 6. Other changes in equity 0 0 7. Total increase or decrease of equity 11,018 10,476
Notes to the condensed consolidated financial statements
32
For the three months ended on 31 March 2012
Basis of preparation
The condensed consolidated financial statements as of 31 March 2012 and for the three months then
ended, have been prepared using accounting policies consistent with International Financial
Reporting Standards.
Significant Accounting Policies
The consolidated financial statements have been prepared under the historical cost convention,
except for investments available-for-sale stated at fair value.
The same accounting policies, presentation and methods of computation are followed in these
condensed consolidated financial statements as were applied in the preparation of HT’s consolidated
financial statements for the year ended 31 December 2011.
Dividends
Management Board and Supervisory Board of the Company proposed a dividend distribution for
2011 in amount of HRK 1,813 million (22.14 HRK per share).
On 27 February 2012 advance dividend payment in amount of HRK 906.5 millions was paid to the
shareholders (HRK 11.07 per share). The remaining amount of HRK 906.5 (HRK 11,7 per share) will
be paid to the shareholders on 21 May 2012.
Segment information
In contrast to previous reporting period, business reporting format is determined to be Residential,
Business and Network and Support Function segments as the Group’s risks and rates of return are
affected predominantly by differences in the market and customers. The segments are organised and
managed separately according to the nature of the customers and markets that the services
rendered, with each segment representing a strategic business unit that offers different products and
services.
The Residential Segment includes marketing, sales and customer services, focused on providing
mobile, fixed line telecommunications and TV distribution services to residential customers.
The Business Segment includes marketing, sales and customer services, focused on providing
mobile and fixed line telecommunications and systems integration services to corporate customers,
small- and medium-sized businesses and the public sector. The Business Segment is also
responsible for the wholesale business in both fixed and mobile services.
The Network and Support Functions performs cross-segment management and support functions,
and includes the Technology, Procurement, Accounting, Treasury, Legal and other central functions.
The Network and Support Functions is included in segment information as a voluntary disclosure
since it does meet the criteria for an operating segment.
33
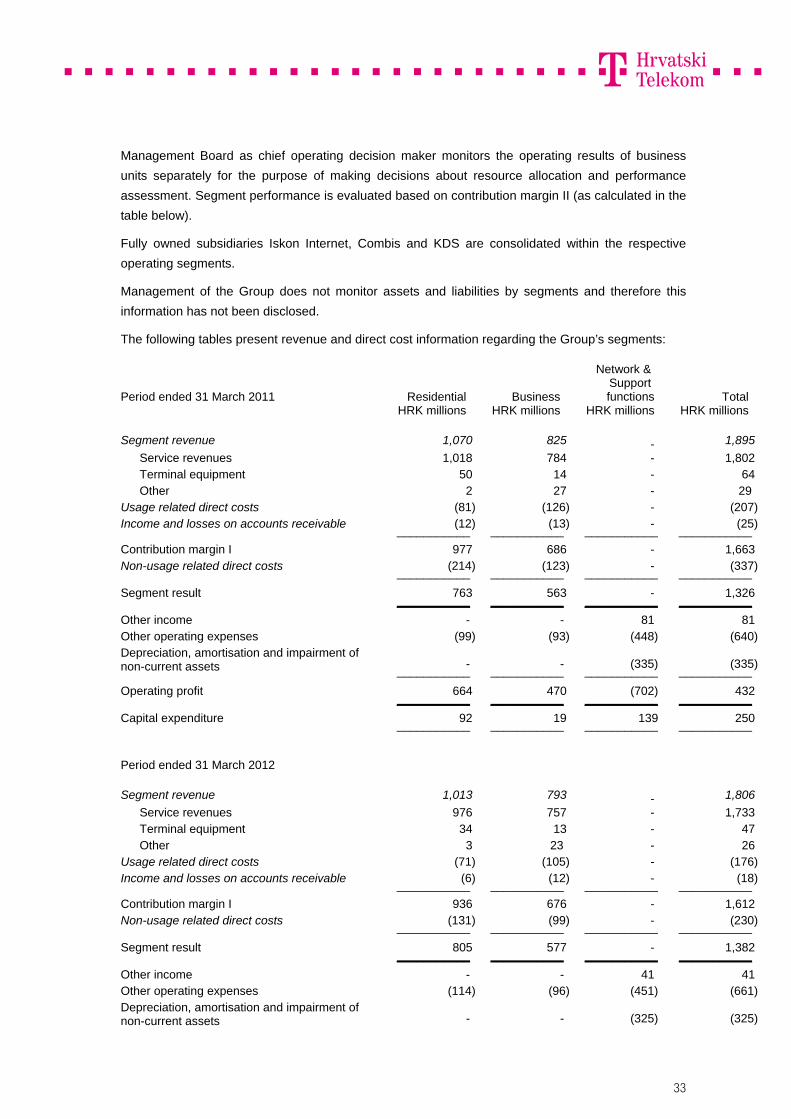
Management Board as chief operating decision maker monitors the operating results of business
units separately for the purpose of making decisions about resource allocation and performance
assessment. Segment performance is evaluated based on contribution margin II (as calculated in the
table below).
Fully owned subsidiaries Iskon Internet, Combis and KDS are consolidated within the respective
operating segments.
Management of the Group does not monitor assets and liabilities by segments and therefore this
information has not been disclosed.
The following tables present revenue and direct cost information regarding the Group’s segments:
Period ended 31 March 2011 Residential Business
Network & Support functions Total
HRK millions HRK millions HRK millions HRK millions
Segment revenue 1,070 825 - 1,895
Service revenues 1,018 784 - 1,802 Terminal equipment 50 14 - 64 Other 2 27 - 29
Usage related direct costs (81) (126) - (207)Income and losses on accounts receivable (12) (13) - (25) ___________ ___________ ___________ ___________
Contribution margin I 977 686 - 1,663 Non-usage related direct costs (214) (123) - (337) ___________ ___________ ___________ ___________
Segment result 763 563 - 1,326 ___________ ___________ ___________ ___________
Other income - - 81 81 Other operating expenses (99) (93) (448) (640)Depreciation, amortisation and impairment of non-current assets - - (335) (335) ___________ ___________ ___________ ___________
Operating profit 664 470 (702) 432 ___________ ___________ ___________ ___________
Capital expenditure 92 19 139 250 ___________ ___________ ___________ ___________
Period ended 31 March 2012
Segment revenue 1,013 793 - 1,806
Service revenues 976 757 - 1,733 Terminal equipment 34 13 - 47 Other 3 23 - 26
Usage related direct costs (71) (105) - (176)Income and losses on accounts receivable (6) (12) - (18) ___________ ___________ ___________ ___________
Contribution margin I 936 676 - 1,612 Non-usage related direct costs (131) (99) - (230) ___________ ___________ ___________ ___________
Segment result 805 577 - 1,382 ___________ ___________ ___________ ___________
Other income - - 41 41 Other operating expenses (114) (96) (451) (661)Depreciation, amortisation and impairment of non-current assets - - (325) (325)
34
___________ ___________ ___________ ___________
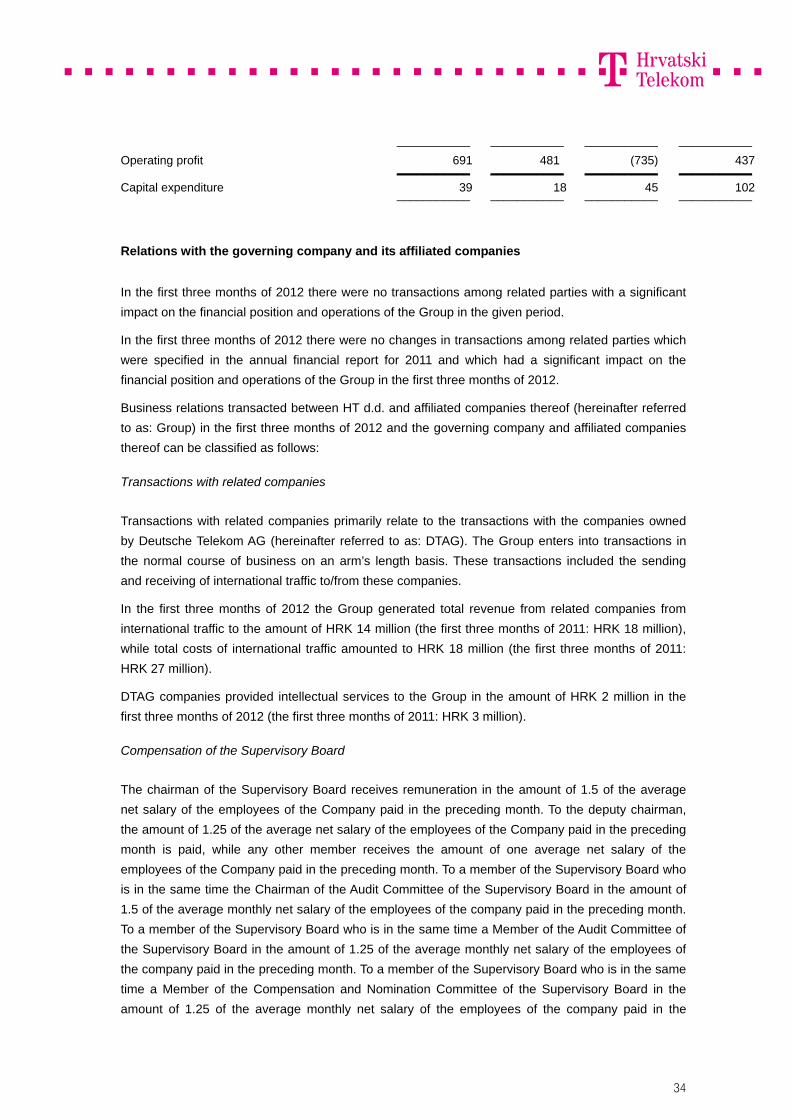
Operating profit 691 481 (735) 437 ___________ ___________ ___________ ___________
Capital expenditure 39 18 45 102 ___________ ___________ ___________ ___________
Relations with the governing company and its affiliated companies
In the first three months of 2012 there were no transactions among related parties with a significant
impact on the financial position and operations of the Group in the given period.
In the first three months of 2012 there were no changes in transactions among related parties which
were specified in the annual financial report for 2011 and which had a significant impact on the
financial position and operations of the Group in the first three months of 2012.
Business relations transacted between HT d.d. and affiliated companies thereof (hereinafter referred
to as: Group) in the first three months of 2012 and the governing company and affiliated companies
thereof can be classified as follows:
Transactions with related companies
Transactions with related companies primarily relate to the transactions with the companies owned
by Deutsche Telekom AG (hereinafter referred to as: DTAG). The Group enters into transactions in
the normal course of business on an arm’s length basis. These transactions included the sending
and receiving of international traffic to/from these companies.
In the first three months of 2012 the Group generated total revenue from related companies from
international traffic to the amount of HRK 14 million (the first three months of 2011: HRK 18 million),
while total costs of international traffic amounted to HRK 18 million (the first three months of 2011:
HRK 27 million).
DTAG companies provided intellectual services to the Group in the amount of HRK 2 million in the
first three months of 2012 (the first three months of 2011: HRK 3 million).
Compensation of the Supervisory Board
The chairman of the Supervisory Board receives remuneration in the amount of 1.5 of the average
net salary of the employees of the Company paid in the preceding month. To the deputy chairman,
the amount of 1.25 of the average net salary of the employees of the Company paid in the preceding
month is paid, while any other member receives the amount of one average net salary of the
employees of the Company paid in the preceding month. To a member of the Supervisory Board who
is in the same time the Chairman of the Audit Committee of the Supervisory Board in the amount of
1.5 of the average monthly net salary of the employees of the company paid in the preceding month.
To a member of the Supervisory Board who is in the same time a Member of the Audit Committee of
the Supervisory Board in the amount of 1.25 of the average monthly net salary of the employees of
the company paid in the preceding month. To a member of the Supervisory Board who is in the same
time a Member of the Compensation and Nomination Committee of the Supervisory Board in the
amount of 1.25 of the average monthly net salary of the employees of the company paid in the
35
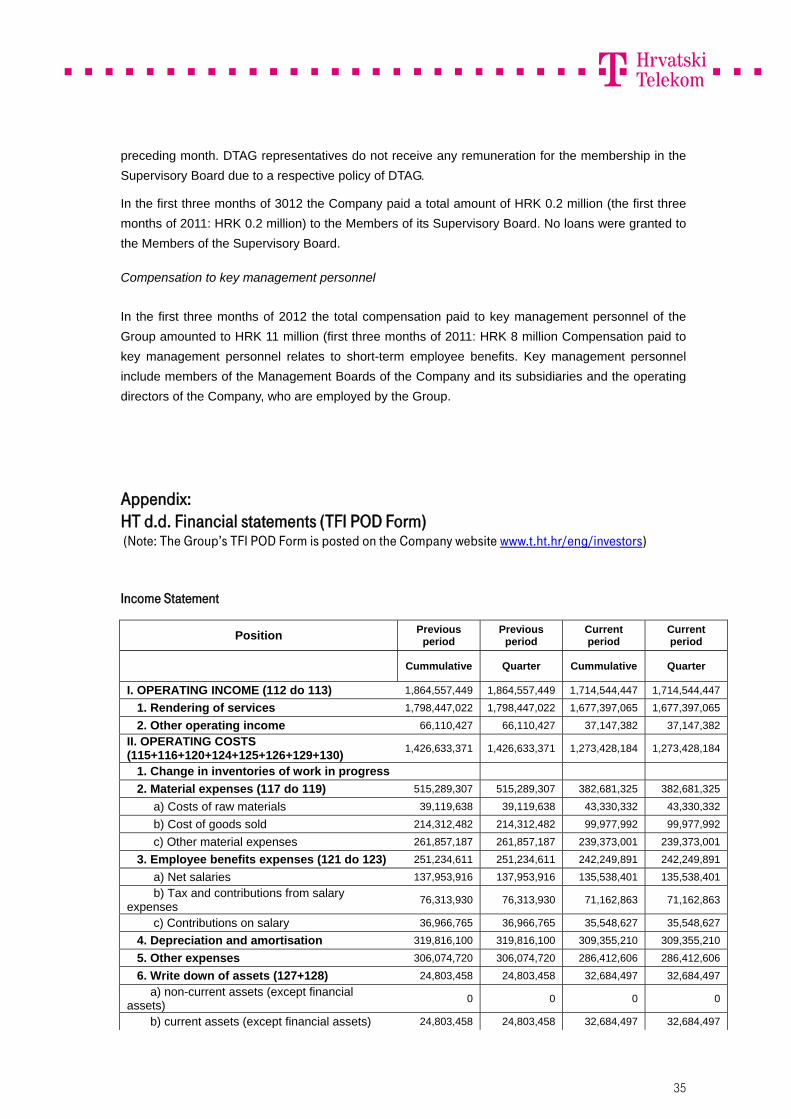
preceding month. DTAG representatives do not receive any remuneration for the membership in the
Supervisory Board due to a respective policy of DTAG.
In the first three months of 3012 the Company paid a total amount of HRK 0.2 million (the first three
months of 2011: HRK 0.2 million) to the Members of its Supervisory Board. No loans were granted to
the Members of the Supervisory Board.
Compensation to key management personnel
In the first three months of 2012 the total compensation paid to key management personnel of the
Group amounted to HRK 11 million (first three months of 2011: HRK 8 million Compensation paid to
key management personnel relates to short-term employee benefits. Key management personnel
include members of the Management Boards of the Company and its subsidiaries and the operating
directors of the Company, who are employed by the Group.
Appendix: HT d.d. Financial statements (TFI POD Form) (Note: The Group’s TFI POD Form is posted on the Company website www.t.ht.hr/eng/investors)
Income Statement
Position Previous period
Previous period
Current period
Current period
Cummulative Quarter Cummulative Quarter
I. OPERATING INCOME (112 do 113) 1,864,557,449 1,864,557,449 1,714,544,447 1,714,544,447
1. Rendering of services 1,798,447,022 1,798,447,022 1,677,397,065 1,677,397,065
2. Other operating income 66,110,427 66,110,427 37,147,382 37,147,382
II. OPERATING COSTS (115+116+120+124+125+126+129+130)
1,426,633,371 1,426,633,371 1,273,428,184 1,273,428,184
1. Change in inventories of work in progress
2. Material expenses (117 do 119) 515,289,307 515,289,307 382,681,325 382,681,325
a) Costs of raw materials 39,119,638 39,119,638 43,330,332 43,330,332
b) Cost of goods sold 214,312,482 214,312,482 99,977,992 99,977,992
c) Other material expenses 261,857,187 261,857,187 239,373,001 239,373,001
3. Employee benefits expenses (121 do 123) 251,234,611 251,234,611 242,249,891 242,249,891
a) Net salaries 137,953,916 137,953,916 135,538,401 135,538,401
b) Tax and contributions from salary expenses
76,313,930 76,313,930 71,162,863 71,162,863
c) Contributions on salary 36,966,765 36,966,765 35,548,627 35,548,627
4. Depreciation and amortisation 319,816,100 319,816,100 309,355,210 309,355,210
5. Other expenses 306,074,720 306,074,720 286,412,606 286,412,606
6. Write down of assets (127+128) 24,803,458 24,803,458 32,684,497 32,684,497
a) non-current assets (except financial assets)
0 0 0 0
b) current assets (except financial assets) 24,803,458 24,803,458 32,684,497 32,684,497
36
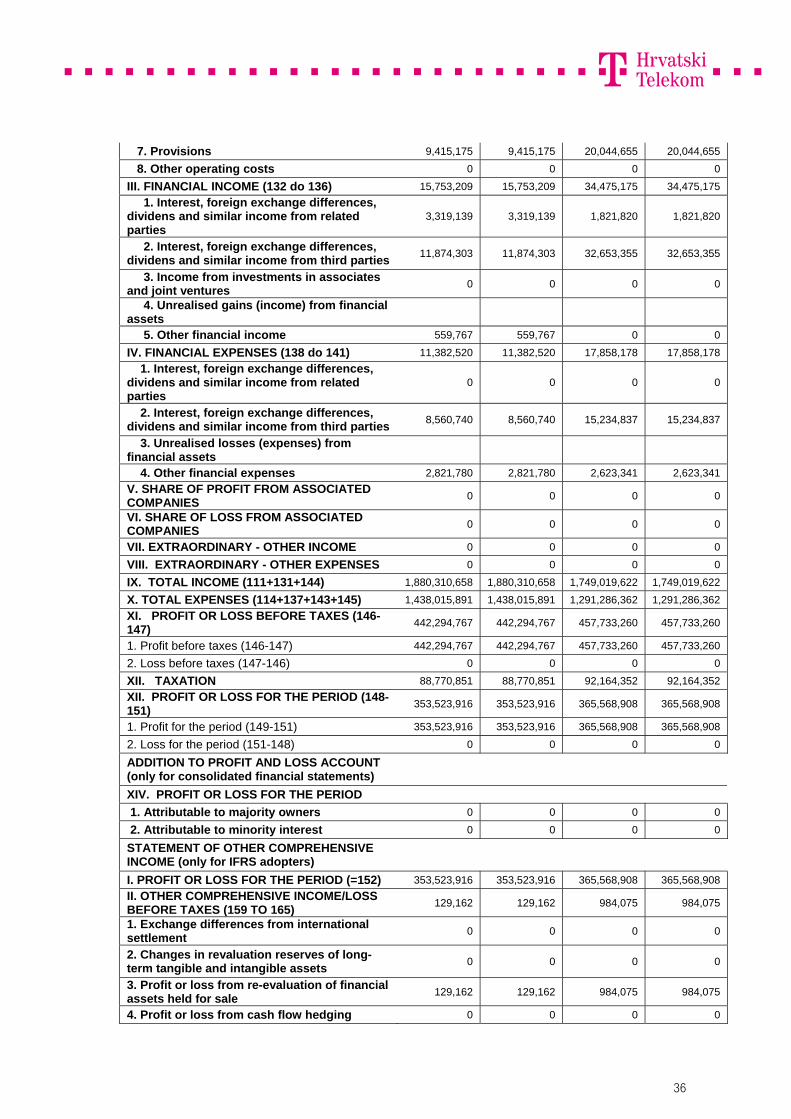
7. Provisions 9,415,175 9,415,175 20,044,655 20,044,655
8. Other operating costs 0 0 0 0
III. FINANCIAL INCOME (132 do 136) 15,753,209 15,753,209 34,475,175 34,475,175
1. Interest, foreign exchange differences, dividens and similar income from related parties
3,319,139 3,319,139 1,821,820 1,821,820
2. Interest, foreign exchange differences, dividens and similar income from third parties
11,874,303 11,874,303 32,653,355 32,653,355
3. Income from investments in associates and joint ventures
0 0 0 0
4. Unrealised gains (income) from financial assets
5. Other financial income 559,767 559,767 0 0
IV. FINANCIAL EXPENSES (138 do 141) 11,382,520 11,382,520 17,858,178 17,858,178
1. Interest, foreign exchange differences, dividens and similar income from related parties
0 0 0 0
2. Interest, foreign exchange differences, dividens and similar income from third parties
8,560,740 8,560,740 15,234,837 15,234,837
3. Unrealised losses (expenses) from financial assets
4. Other financial expenses 2,821,780 2,821,780 2,623,341 2,623,341
V. SHARE OF PROFIT FROM ASSOCIATED COMPANIES
0 0 0 0
VI. SHARE OF LOSS FROM ASSOCIATED COMPANIES
0 0 0 0
VII. EXTRAORDINARY - OTHER INCOME 0 0 0 0
VIII. EXTRAORDINARY - OTHER EXPENSES 0 0 0 0
IX. TOTAL INCOME (111+131+144) 1,880,310,658 1,880,310,658 1,749,019,622 1,749,019,622
X. TOTAL EXPENSES (114+137+143+145) 1,438,015,891 1,438,015,891 1,291,286,362 1,291,286,362
XI. PROFIT OR LOSS BEFORE TAXES (146-147)
442,294,767 442,294,767 457,733,260 457,733,260
1. Profit before taxes (146-147) 442,294,767 442,294,767 457,733,260 457,733,260
2. Loss before taxes (147-146) 0 0 0 0
XII. TAXATION 88,770,851 88,770,851 92,164,352 92,164,352
XII. PROFIT OR LOSS FOR THE PERIOD (148-151)
353,523,916 353,523,916 365,568,908 365,568,908
1. Profit for the period (149-151) 353,523,916 353,523,916 365,568,908 365,568,908
2. Loss for the period (151-148) 0 0 0 0
ADDITION TO PROFIT AND LOSS ACCOUNT (only for consolidated financial statements)
XIV. PROFIT OR LOSS FOR THE PERIOD 1. Attributable to majority owners 0 0 0 0
2. Attributable to minority interest 0 0 0 0
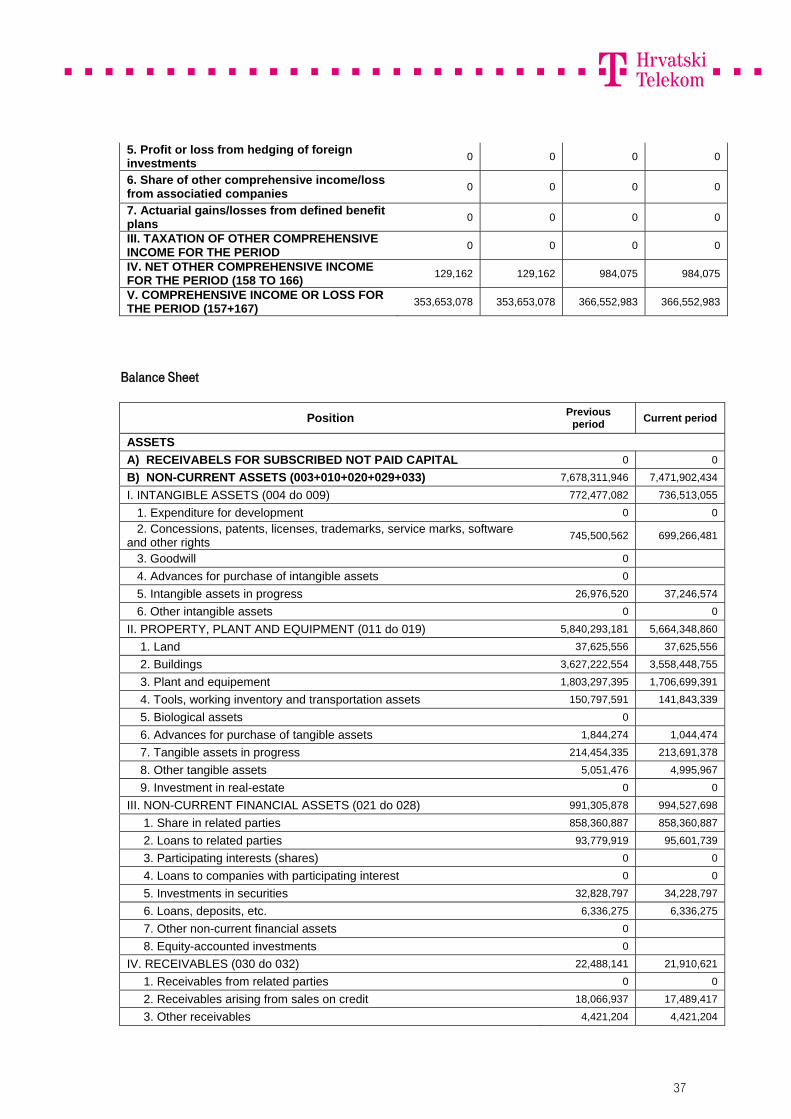
STATEMENT OF OTHER COMPREHENSIVE INCOME (only for IFRS adopters)
I. PROFIT OR LOSS FOR THE PERIOD (=152) 353,523,916 353,523,916 365,568,908 365,568,908
II. OTHER COMPREHENSIVE INCOME/LOSS BEFORE TAXES (159 TO 165)
129,162 129,162 984,075 984,075
1. Exchange differences from international settlement
0 0 0 0
2. Changes in revaluation reserves of long-term tangible and intangible assets
0 0 0 0
3. Profit or loss from re-evaluation of financial assets held for sale
129,162 129,162 984,075 984,075
4. Profit or loss from cash flow hedging 0 0 0 0
37
5. Profit or loss from hedging of foreign investments
0 0 0 0
6. Share of other comprehensive income/loss from associatied companies
0 0 0 0
7. Actuarial gains/losses from defined benefit plans
0 0 0 0
III. TAXATION OF OTHER COMPREHENSIVE INCOME FOR THE PERIOD
0 0 0 0
IV. NET OTHER COMPREHENSIVE INCOME FOR THE PERIOD (158 TO 166)
129,162 129,162 984,075 984,075
V. COMPREHENSIVE INCOME OR LOSS FOR THE PERIOD (157+167)
353,653,078 353,653,078 366,552,983 366,552,983
Balance Sheet
Position Previous period
Current period
ASSETS A) RECEIVABELS FOR SUBSCRIBED NOT PAID CAPITAL 0 0
B) NON-CURRENT ASSETS (003+010+020+029+033) 7,678,311,946 7,471,902,434
I. INTANGIBLE ASSETS (004 do 009) 772,477,082 736,513,055
1. Expenditure for development 0 0
2. Concessions, patents, licenses, trademarks, service marks, software and other rights
745,500,562 699,266,481
3. Goodwill 0
4. Advances for purchase of intangible assets 0
5. Intangible assets in progress 26,976,520 37,246,574
6. Other intangible assets 0 0
II. PROPERTY, PLANT AND EQUIPMENT (011 do 019) 5,840,293,181 5,664,348,860
1. Land 37,625,556 37,625,556
2. Buildings 3,627,222,554 3,558,448,755
3. Plant and equipement 1,803,297,395 1,706,699,391
4. Tools, working inventory and transportation assets 150,797,591 141,843,339
5. Biological assets 0
6. Advances for purchase of tangible assets 1,844,274 1,044,474
7. Tangible assets in progress 214,454,335 213,691,378
8. Other tangible assets 5,051,476 4,995,967
9. Investment in real-estate 0 0
III. NON-CURRENT FINANCIAL ASSETS (021 do 028) 991,305,878 994,527,698
1. Share in related parties 858,360,887 858,360,887
2. Loans to related parties 93,779,919 95,601,739
3. Participating interests (shares) 0 0
4. Loans to companies with participating interest 0 0
5. Investments in securities 32,828,797 34,228,797
6. Loans, deposits, etc. 6,336,275 6,336,275
7. Other non-current financial assets 0
8. Equity-accounted investments 0
IV. RECEIVABLES (030 do 032) 22,488,141 21,910,621
1. Receivables from related parties 0 0
2. Receivables arising from sales on credit 18,066,937 17,489,417
3. Other receivables 4,421,204 4,421,204
38
V. DEFERRED TAX ASSET 51,747,664 54,602,200
C) CURRENT ASSETS (035+043+050+058) 5,325,732,075 4,866,669,726
I. INVENTORIES (036 do 042) 154,128,220 136,314,672
1. Raw materials and supplies 82,614,413 68,802,764
2. Production in progress 0 0
3. Finished products 0 0
4. Merchandise 71,460,832 67,462,217
5. Advances for inventories 52,975 49,691
6. Long term assets held for sale 0 0
7. Biological assets 0 0
II. RECEIVABLES (044 do 049) 1,165,669,717 1,170,510,736
1. Receivables from related parties 21,867,473 35,331,122
2. Receivables from end-customers 1,072,611,311 1,079,700,282
3. Receivables from participating parties 0 0
4. Receivables from employees and members of the company 0 0
5. Receivables from government and other institutions 3,325,289 3,773,374
6. Other receivables 67,865,644 51,705,958
III. CURRENT FINANCIAL ASSETS (051 do 057) 341,306,626 1,035,466,458
1. Share in related parties 0 0
2. Loans to related parties 0 0
3. Participating interests (shares) 0 0
4. Loans to companies with participating interest 0 0
5. Investments in securities 341,306,626 503,466,458
6. Loans, deposits, etc. 0 532,000,000
7. Other financial assets 0 0
IV. CASH AND CASH EQUIVALENTS 3,664,627,512 2,524,377,860
D) PREPAYMENTS AND ACCRUED INCOME 109,025,584 118,031,771
E) TOTAL ASSETS (001+002+034+059) 13,113,069,605 12,456,603,931
F) OFF BALANCE SHEET ITEMS
EQUITY AND LIABILITIES A) ISSUED CAPITAL AND RESERVES (063+064+065+071+072+075+078)
11,162,721,598 10,622,768,500
I. SUBSCRIBED SHARE CAPITAL 8,188,853,500 8,188,853,500
II. CAPITAL RESERVES 0 0
III.RESERVES FROM PROFIT (066+067-068+069+070) 409,442,675 409,442,675
1. Legal reserves 409,442,675 409,442,675
2. Reserve for own shares 0 0
3. Treasury shares and shares (deductible items) 0 0
4. Statutory reserves 0 0
5. Other reserves 0 0
IV. REVALUATION RESERVES -3,457,141 -2,473,066
V. RETAINED EARNINGS OR LOSS CARRIED FORWARD (073-074) 754,587,377 1,661,376,482
1. Retained earnings 754,587,377 1,661,376,482
2. Loss carried forward 0 0
VI. NET PROFIT OR LOSS FOR THE PERIOD (076-077) 1,813,295,187 365,568,909
1. Net profit for the period 1,813,295,187 365,568,909
2. Net loss for the period 0 0
VII. MINORITY INTEREST 0 0
B) PROVISIONS (080 do 082) 440,098,767 429,063,343
1. Provisions for pensions, severance pay and similar libabilities 326,315,177 305,883,625
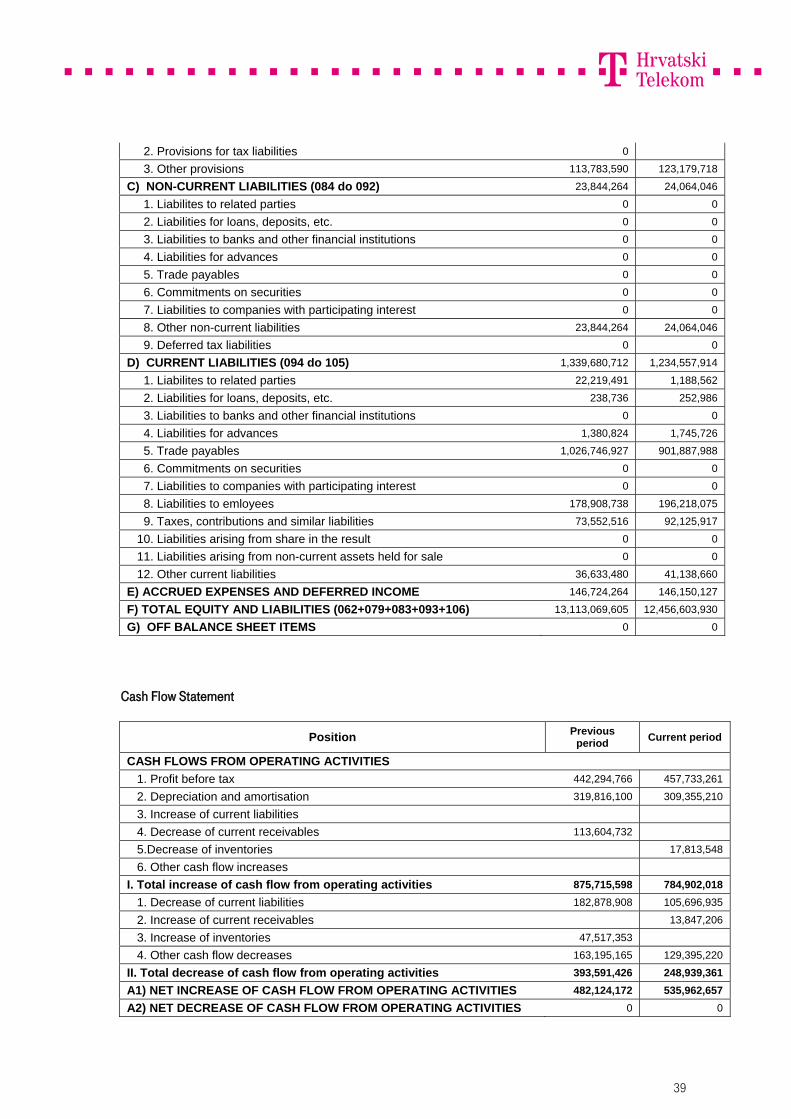
39
2. Provisions for tax liabilities 0
3. Other provisions 113,783,590 123,179,718
C) NON-CURRENT LIABILITIES (084 do 092) 23,844,264 24,064,046
1. Liabilites to related parties 0 0
2. Liabilities for loans, deposits, etc. 0 0
3. Liabilities to banks and other financial institutions 0 0
4. Liabilities for advances 0 0
5. Trade payables 0 0
6. Commitments on securities 0 0
7. Liabilities to companies with participating interest 0 0
8. Other non-current liabilities 23,844,264 24,064,046
9. Deferred tax liabilities 0 0
D) CURRENT LIABILITIES (094 do 105) 1,339,680,712 1,234,557,914
1. Liabilites to related parties 22,219,491 1,188,562
2. Liabilities for loans, deposits, etc. 238,736 252,986
3. Liabilities to banks and other financial institutions 0 0
4. Liabilities for advances 1,380,824 1,745,726
5. Trade payables 1,026,746,927 901,887,988
6. Commitments on securities 0 0
7. Liabilities to companies with participating interest 0 0
8. Liabilities to emloyees 178,908,738 196,218,075
9. Taxes, contributions and similar liabilities 73,552,516 92,125,917
10. Liabilities arising from share in the result 0 0
11. Liabilities arising from non-current assets held for sale 0 0
12. Other current liabilities 36,633,480 41,138,660
E) ACCRUED EXPENSES AND DEFERRED INCOME 146,724,264 146,150,127
F) TOTAL EQUITY AND LIABILITIES (062+079+083+093+106) 13,113,069,605 12,456,603,930
G) OFF BALANCE SHEET ITEMS 0 0
Cash Flow Statement
Position Previous period
Current period
CASH FLOWS FROM OPERATING ACTIVITIES 1. Profit before tax 442,294,766 457,733,261
2. Depreciation and amortisation 319,816,100 309,355,210
3. Increase of current liabilities
4. Decrease of current receivables 113,604,732
5.Decrease of inventories 17,813,548
6. Other cash flow increases
I. Total increase of cash flow from operating activities 875,715,598 784,902,018
1. Decrease of current liabilities 182,878,908 105,696,935
2. Increase of current receivables 13,847,206
3. Increase of inventories 47,517,353
4. Other cash flow decreases 163,195,165 129,395,220
II. Total decrease of cash flow from operating activities 393,591,426 248,939,361
A1) NET INCREASE OF CASH FLOW FROM OPERATING ACTIVITIES 482,124,172 535,962,657
A2) NET DECREASE OF CASH FLOW FROM OPERATING ACTIVITIES 0 0
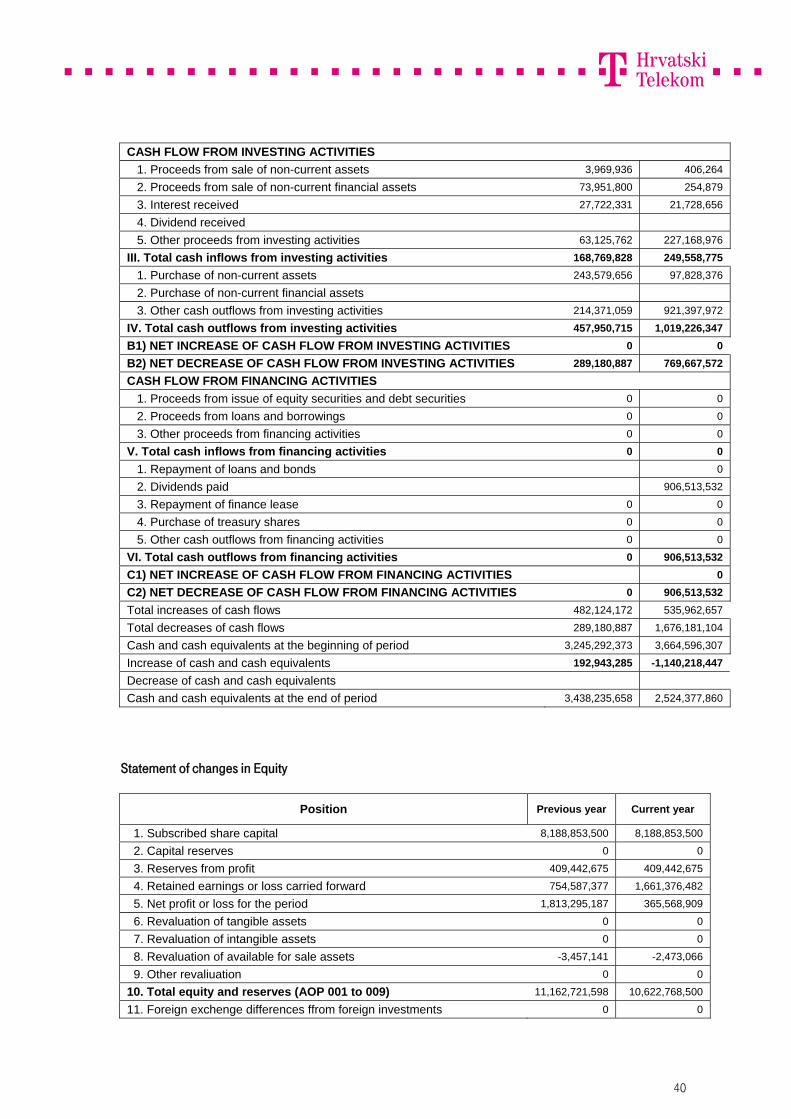
40
CASH FLOW FROM INVESTING ACTIVITIES 1. Proceeds from sale of non-current assets 3,969,936 406,264
2. Proceeds from sale of non-current financial assets 73,951,800 254,879
3. Interest received 27,722,331 21,728,656
4. Dividend received
5. Other proceeds from investing activities 63,125,762 227,168,976
III. Total cash inflows from investing activities 168,769,828 249,558,775
1. Purchase of non-current assets 243,579,656 97,828,376
2. Purchase of non-current financial assets
3. Other cash outflows from investing activities 214,371,059 921,397,972
IV. Total cash outflows from investing activities 457,950,715 1,019,226,347
B1) NET INCREASE OF CASH FLOW FROM INVESTING ACTIVITIES 0 0
B2) NET DECREASE OF CASH FLOW FROM INVESTING ACTIVITIES 289,180,887 769,667,572
CASH FLOW FROM FINANCING ACTIVITIES 1. Proceeds from issue of equity securities and debt securities 0 0
2. Proceeds from loans and borrowings 0 0
3. Other proceeds from financing activities 0 0
V. Total cash inflows from financing activities 0 0
1. Repayment of loans and bonds 0
2. Dividends paid 906,513,532
3. Repayment of finance lease 0 0
4. Purchase of treasury shares 0 0
5. Other cash outflows from financing activities 0 0
VI. Total cash outflows from financing activities 0 906,513,532
C1) NET INCREASE OF CASH FLOW FROM FINANCING ACTIVITIES 0
C2) NET DECREASE OF CASH FLOW FROM FINANCING ACTIVITIES 0 906,513,532
Total increases of cash flows 482,124,172 535,962,657
Total decreases of cash flows 289,180,887 1,676,181,104
Cash and cash equivalents at the beginning of period 3,245,292,373 3,664,596,307
Increase of cash and cash equivalents 192,943,285 -1,140,218,447
Decrease of cash and cash equivalents
Cash and cash equivalents at the end of period 3,438,235,658 2,524,377,860
Statement of changes in Equity
Position Previous year Current year
1. Subscribed share capital 8,188,853,500 8,188,853,500
2. Capital reserves 0 0
3. Reserves from profit 409,442,675 409,442,675
4. Retained earnings or loss carried forward 754,587,377 1,661,376,482
5. Net profit or loss for the period 1,813,295,187 365,568,909
6. Revaluation of tangible assets 0 0
7. Revaluation of intangible assets 0 0
8. Revaluation of available for sale assets -3,457,141 -2,473,066
9. Other revaliuation 0 0
10. Total equity and reserves (AOP 001 to 009) 11,162,721,598 10,622,768,500
11. Foreign exchenge differences ffrom foreign investments 0 0
41
12. Current and deferred taxes 0 0
13. Cash flow hedge 0 0
14. Change of accounting policies 0 0
15. Correction of significant mistakes of prior period 0 0
16. Other changes 0 0
17.Total increase or decrease of equity (AOP 011 to 016) 0 0
Notes to the condensed financial statements For period ended 31 March 2012
Basis of preparation
The condensed financial statements of 31 March 2012 and for the nine months then ended, have
been prepared using accounting policies consistent with International Financial Reporting Standards.
Significant Accounting Policies
The financial statements have been prepared under the historical cost convention, except for
investments available-for-sale stated at fair value.
The same accounting policies, presentation and methods of computation are followed in these
condensed financial statements as were applied in the preparation of the Company’s financial
statements for the year ended 31 December 2011.
Dividends
Management Board and Supervisory Board of the Company proposed a dividend distribution for
2011 in amount of HRK 1,813 million (22.14 HRK per share).
On 27 February 2012 advance dividend payment in amount of HRK 906.5 millions was paid to the
shareholders (HRK 11.07 per share). The remaining amount of HRK 906.5 (HRK 11,7 per share) will
be paid to the shareholders on 21 May 2012.
Segment information
Business reporting format is determined to be Residential, Business and Network and Support
Function segments as the Company’s risks and rates of return are affected predominantly by
differences in the market and customers. The segments are organised and managed separately
according to the nature of the customers and markets that the services rendered, with each segment
representing a strategic business unit that offers different products and services.
The Residential Segment includes marketing, sales and customer services, focused on providing
mobile, fixed line telecommunications and TV distribution services to residential customers.
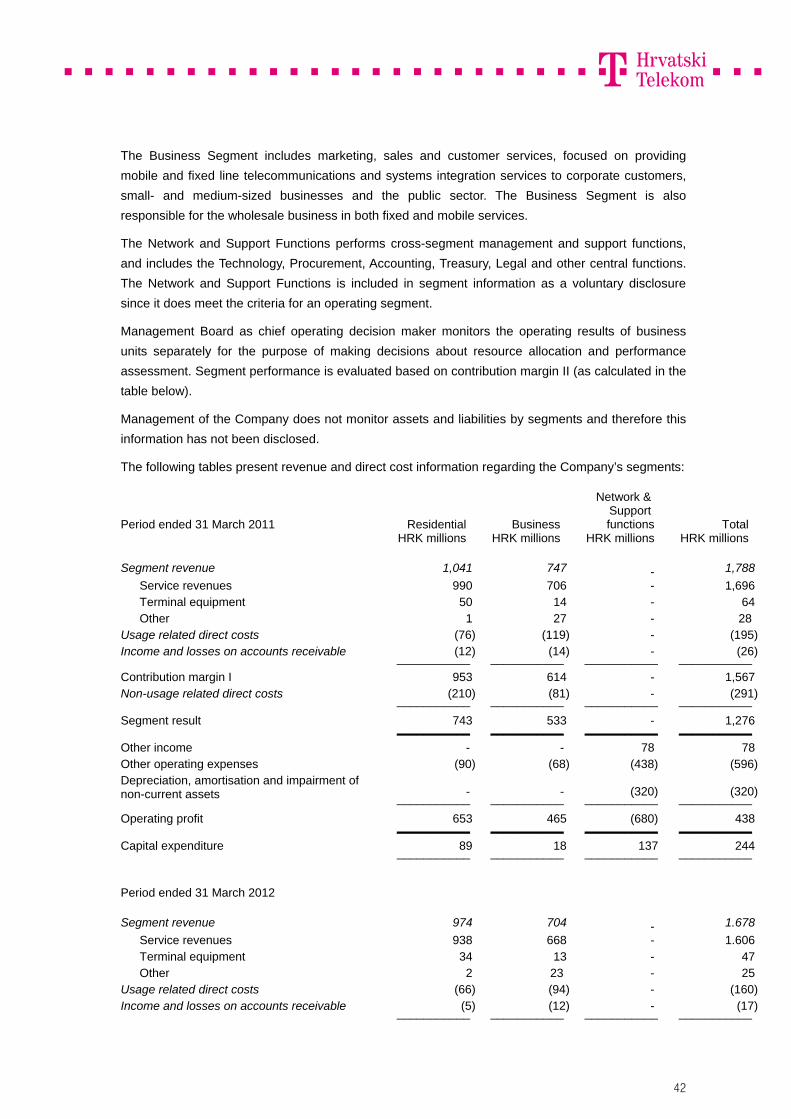
42
The Business Segment includes marketing, sales and customer services, focused on providing
mobile and fixed line telecommunications and systems integration services to corporate customers,
small- and medium-sized businesses and the public sector. The Business Segment is also
responsible for the wholesale business in both fixed and mobile services.
The Network and Support Functions performs cross-segment management and support functions,
and includes the Technology, Procurement, Accounting, Treasury, Legal and other central functions.
The Network and Support Functions is included in segment information as a voluntary disclosure
since it does meet the criteria for an operating segment.
Management Board as chief operating decision maker monitors the operating results of business
units separately for the purpose of making decisions about resource allocation and performance
assessment. Segment performance is evaluated based on contribution margin II (as calculated in the
table below).
Management of the Company does not monitor assets and liabilities by segments and therefore this
information has not been disclosed.
The following tables present revenue and direct cost information regarding the Company’s segments:
Period ended 31 March 2011 Residential Business
Network & Support functions Total
HRK millions HRK millions HRK millions HRK millions
Segment revenue 1,041 747 - 1,788
Service revenues 990 706 - 1,696 Terminal equipment 50 14 - 64 Other 1 27 - 28
Usage related direct costs (76) (119) - (195)Income and losses on accounts receivable (12) (14) - (26) ___________ ___________ ___________ ___________
Contribution margin I 953 614 - 1,567 Non-usage related direct costs (210) (81) - (291) ___________ ___________ ___________ ___________
Segment result 743 533 - 1,276 ___________ ___________ ___________ ___________
Other income - - 78 78 Other operating expenses (90) (68) (438) (596)Depreciation, amortisation and impairment of non-current assets - - (320) (320) ___________ ___________ ___________ ___________
Operating profit 653 465 (680) 438 ___________ ___________ ___________ ___________
Capital expenditure 89 18 137 244 ___________ ___________ ___________ ___________
Period ended 31 March 2012
Segment revenue 974 704 - 1.678
Service revenues 938 668 - 1.606 Terminal equipment 34 13 - 47 Other 2 23 - 25
Usage related direct costs (66) (94) - (160)Income and losses on accounts receivable (5) (12) - (17) ___________ ___________ ___________ ___________
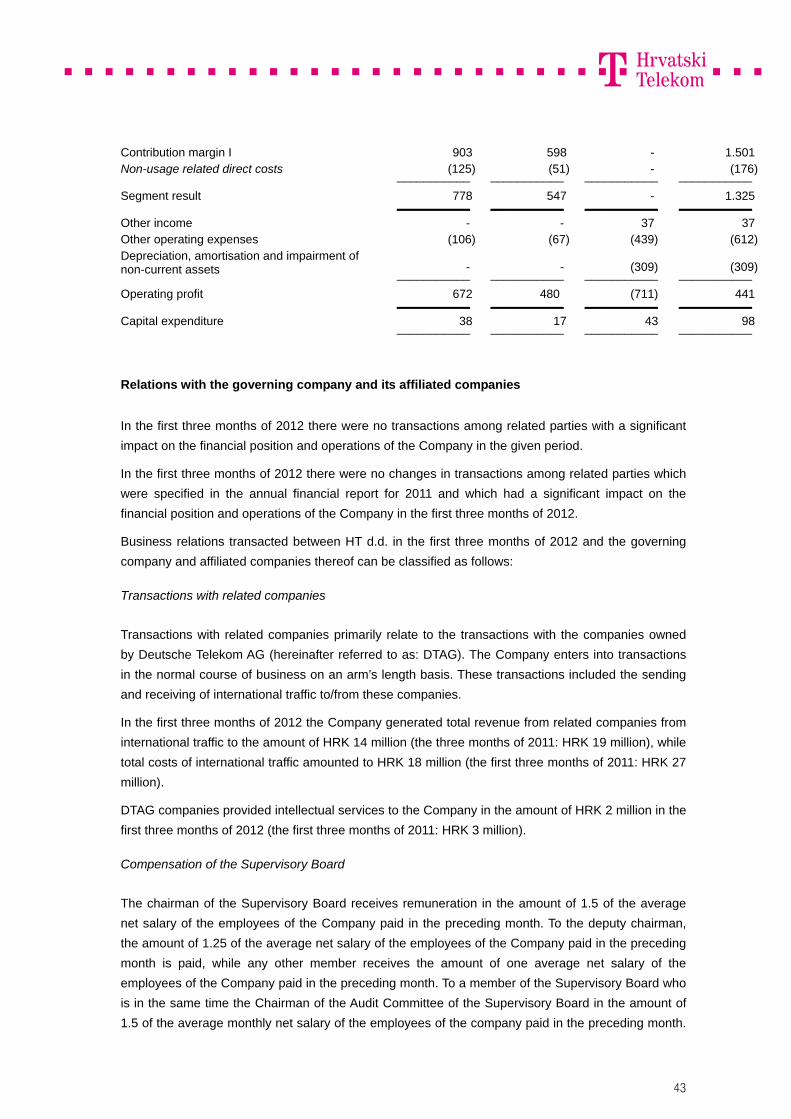
43
Contribution margin I 903 598 - 1.501 Non-usage related direct costs (125) (51) - (176) ___________ ___________ ___________ ___________
Segment result 778 547 - 1.325 ___________ ___________ ___________ ___________
Other income - - 37 37 Other operating expenses (106) (67) (439) (612)Depreciation, amortisation and impairment of non-current assets - - (309) (309) ___________ ___________ ___________ ___________
Operating profit 672 480 (711) 441 ___________ ___________ ___________ ___________
Capital expenditure 38 17 43 98 ___________ ___________ ___________ ___________
Relations with the governing company and its affiliated companies
In the first three months of 2012 there were no transactions among related parties with a significant
impact on the financial position and operations of the Company in the given period.
In the first three months of 2012 there were no changes in transactions among related parties which
were specified in the annual financial report for 2011 and which had a significant impact on the
financial position and operations of the Company in the first three months of 2012.
Business relations transacted between HT d.d. in the first three months of 2012 and the governing
company and affiliated companies thereof can be classified as follows:
Transactions with related companies
Transactions with related companies primarily relate to the transactions with the companies owned
by Deutsche Telekom AG (hereinafter referred to as: DTAG). The Company enters into transactions
in the normal course of business on an arm’s length basis. These transactions included the sending
and receiving of international traffic to/from these companies.
In the first three months of 2012 the Company generated total revenue from related companies from
international traffic to the amount of HRK 14 million (the three months of 2011: HRK 19 million), while
total costs of international traffic amounted to HRK 18 million (the first three months of 2011: HRK 27
million).
DTAG companies provided intellectual services to the Company in the amount of HRK 2 million in the
first three months of 2012 (the first three months of 2011: HRK 3 million).
Compensation of the Supervisory Board
The chairman of the Supervisory Board receives remuneration in the amount of 1.5 of the average
net salary of the employees of the Company paid in the preceding month. To the deputy chairman,
the amount of 1.25 of the average net salary of the employees of the Company paid in the preceding
month is paid, while any other member receives the amount of one average net salary of the
employees of the Company paid in the preceding month. To a member of the Supervisory Board who
is in the same time the Chairman of the Audit Committee of the Supervisory Board in the amount of
1.5 of the average monthly net salary of the employees of the company paid in the preceding month.
44
To a member of the Supervisory Board who is in the same time a Member of the Audit Committee of
the Supervisory Board in the amount of 1.25 of the average monthly net salary of the employees of
the company paid in the preceding month. To a member of the Supervisory Board who is in the same
time a Member of the Compensation and Nomination Committee of the Supervisory Board in the
amount of 1.25 of the average monthly net salary of the employees of the company paid in the
preceding month. DTAG representatives do not receive any remuneration for the membership in the
Supervisory Board due to a respective policy of DTAG.
In the first three months of 2012, the Company paid a total amount of HRK 0.2 million (the first three
months of 2011: HRK 0.2 million) to the Members of its Supervisory Board. No loans were granted to
the Members of the Supervisory Board.
Compensation to key management personnel
In the first three months of 2012 the total compensation paid to key management personnel of the
Company amounted to HRK 8.5 million (first three months of 2011: HRK 7.4 million Compensation
paid to key management personnel relates to short-term employee benefits. Key management
personnel include members of the Management Boards of the Company and the operating directors
of the Company, who are employed by the Company.

45
Statement of the Management Board of Hrvatski Telekom d.d. To the best of our knowledge, unaudited financial statements of the company Hrvatski Telekom d.d. (hereinafter: “Company”) and unaudited consolidated financial statements of the Company and affiliated companies thereof (hereinafter: "Group"), which are prepared in accordance with International Financial Reporting Standards (IFRS), give a true and fair view of assets and obligations, profit and loss, financial position, and operations of both the Company and the Group. The management report for the first quarter 2012 contains a true presentation of development and results of operations and position of the Group, with description of significant risks and uncertainties for the Group as a whole. Mr. Ivica Mudrinić, President of the Management Board (CEO) Mr. Dino Ivan Dogan, Ph. D., Member of the Management Board and Chief Financial Officer Mr. Johan Busé, Member of the Management Board and Chief Operating Officer Residential Ms. Irena Jolić Šimović, Member of the Management Board and Chief Operating Officer Business Mr. Božidar Poldrugač, Member of the Management Board and Chief Technical Officer and Chief Information Officer Ms. Branka Skaramuča, Member of the Management Board and Chief Human Resources Officer Zagreb, 27 April 2012 Presentation of information Unless the context otherwise requires, references in this publication to ‘‘T-HT Group’’ or ‘‘the Group’’ or "T-HT" are to the Company Hrvatski Telekom d.d., together with its subsidiaries. References to ‘‘HT’’ or the ‘‘Company’’ are to the Company Hrvatski Telekom d.d. Following the merger of T-Mobile d.o.o. with Hrvatski Telekom (HT d.d.), effective 1 January 2010, the Group is now organized into two business units: Business and Residential. Therefore, references to “Business” are to business operations performed within the Company’s Business Segment. References to ‘‘Residential’ are to business operations performed within the Company’s Residential Segment. References to ‘‘Iskon’’ are to the Company’s wholly-owned subsidiary, Iskon Internet d.d. References to ‘‘Combis’’ are to the Company’s wholly-owned subsidiary, Combis d.o.o. References to ‘‘KDS” are to the Company’s wholly-owned subsidiary, KDS d.o.o. References in this publication to ‘‘Agency’’ are to the Croatian National Regulatory Authority, the Agency for Post and Electronic Communications.

46
Disclaimer This release contains certain forward-looking statements with respect to the financial condition, results of operations and business of the Group. These forward-looking statements represent the Company's expectations or beliefs concerning future events and involve known and unknown risks and uncertainties that could cause actual results, performance or events to differ materially from those expressed or implied in such statements. Additional information concerning important factors that could cause actual results to differ materially is available in the Group's reports which may be found at www.t.ht.hr