zaldivar technical report - barrick.q4cdn.com · barrick gold corporation technical report on the...
TRANSCRIPT

BARRICK GOLD CORPORATION
TECHNICAL REPORT ON THEZALDÍVAR MINE, REGION II, CHILE
NI 43-101 Report
Qualified Persons:Luke Evans, P.Eng.Richard J. Lambert, P.E.
March 16, 2012
ROSCOE POSTLE ASSOCIATES INC.

Report Control Form Document Title Technical Report on the Zaldívar Mine, Region II, Chile
Client Name & Address
Barrick Gold Corporation Brookfield Place, TD Canada Trust Tower Suite 3700, 161 Bay Street, P.O. Box 212 Toronto, Ontario M5J 2S1
Document Reference
Project #1683
Status & Issue No.
Final Version
Rev 0
Issue Date March 16, 2012 Lead Author Luke Evans, P.Eng.
Richard J. Lambert, P.E.
(Signed) (Signed)
Peer Reviewer Deborah A. McCombe,
P.Geo.
(Signed)
Project Manager Approval Luke Evans, P.Eng.
(Signed)
Project Director Approval Graham G. Clow, P.Eng.
(Signed)
Report Distribution Name No. of Copies Client RPA Filing 1 (project box)
Roscoe Postle Associates Inc.
55 University Avenue, Suite 501 Toronto, Ontario M5J 2H7
Canada Tel: +1 416 947 0907
Fax: +1 416 947 0395 [email protected]

www.rpacan.com
Barrick Gold Corporation – Zaldívar Mine, Project #1683
Technical Report NI 43-101 – March 16, 2012
Rev. 0 Page i
TABLE OF CONTENTS PAGE
1 SUMMARY ................................................................................................................ 1-1 Executive Summary ................................................................................................ 1-1 Technical Summary ................................................................................................ 1-5
2 INTRODUCTION ....................................................................................................... 2-1
3 RELIANCE ON OTHER EXPERTS ........................................................................... 3-1
4 PROPERTY DESCRIPTION AND LOCATION .......................................................... 4-1
5 ACCESSIBILITY, CLIMATE, LOCAL RESOURCES, INFRASTRUCTURE AND PHYSIOGRAPHY ........................................................................................................ 5-1
6 HISTORY .................................................................................................................. 6-1 Exploration and Ownership History ......................................................................... 6-1 Production History .................................................................................................. 6-1
7 GEOLOGICAL SETTING AND MINERALIZATION ................................................... 7-1 Regional Geology ................................................................................................... 7-1 Local and Property Geology ................................................................................... 7-3 Alteration ................................................................................................................ 7-5 Mineralization ......................................................................................................... 7-6
8 DEPOSIT TYPES ...................................................................................................... 8-1
9 EXPLORATION ......................................................................................................... 9-1 Exploration Potential ............................................................................................... 9-1
10 DRILLING .............................................................................................................. 10-1
11 SAMPLE PREPARATION, ANALYSES AND SECURITY ..................................... 11-1 Sampling Method and Approach ........................................................................... 11-1 Sample Preparation, Analyses and Security ......................................................... 11-1
12 DATA VERIFICATION ........................................................................................... 12-1
13 MINERAL PROCESSING AND METALLURGICAL TESTING ............................... 13-1 Metallurgical Testing ............................................................................................. 13-1
14 MINERAL RESOURCE ESTIMATE ....................................................................... 14-1 Summary .............................................................................................................. 14-1 Geological Models ................................................................................................ 14-2 Geological Domains ............................................................................................. 14-7 Density Data ......................................................................................................... 14-8 Cut-Off Grades ..................................................................................................... 14-8 Capping of High Grade Values ............................................................................. 14-8 Composites .......................................................................................................... 14-9 Contact Plot Analysis .......................................................................................... 14-12 Variography ........................................................................................................ 14-15

www.rpacan.com
Barrick Gold Corporation – Zaldívar Mine, Project #1683
Technical Report NI 43-101 – March 16, 2012
Rev. 0 Page ii
Resource Estimation Methodology ..................................................................... 14-17 Resource Estimate Validation ............................................................................. 14-20 Resource Classification ...................................................................................... 14-21
15 MINERAL RESERVE ESTIMATE .......................................................................... 15-1
16 MINING METHODS .............................................................................................. 16-1 Production Schedule ............................................................................................ 16-7 Waste Rock .......................................................................................................... 16-8 Mine Equipment ................................................................................................... 16-8 Mine Infrastucture ................................................................................................. 16-9
17 RECOVERY METHODS ....................................................................................... 17-1 Ore Processing ..................................................................................................... 17-1 Dynamic Pad Leach Process ................................................................................ 17-2 ROM Leach Pad ................................................................................................... 17-2 SX/EW Copper Recovery Circuit .......................................................................... 17-2 Flotation Concentration Process ........................................................................... 17-2 Copper Recovery.................................................................................................. 17-4 Copper Recovery Algorithms at Zaldívar .............................................................. 17-4 2011 Recovery Model ........................................................................................... 17-8
18 PROJECT INFRASTRUCTURE ............................................................................ 18-1
19 MARKET STUDIES AND CONTRACTS................................................................ 19-1 Markets ................................................................................................................ 19-1 Contracts .............................................................................................................. 19-1
20 ENVIRONMENTAL STUDIES, PERMITTING, AND SOCIAL OR COMMUNITY IMPACT ..................................................................................................................... 20-1
Environmental Studies .......................................................................................... 20-1 Project Permitting ................................................................................................. 20-1 Social or Community Requirements...................................................................... 20-2 Mine Closure Requirements ................................................................................. 20-2
21 CAPITAL AND OPERATING COSTS .................................................................... 21-1 Capital Costs ........................................................................................................ 21-1 Operating Costs ................................................................................................... 21-2 Manpower ............................................................................................................ 21-3
22 ECONOMIC ANALYSIS ........................................................................................ 22-1
23 ADJACENT PROPERTIES ................................................................................... 23-1
24 OTHER RELEVANT DATA AND INFORMATION ................................................. 24-1
25 INTERPRETATION AND CONCLUSIONS ............................................................ 25-1
26 RECOMMENDATIONS ......................................................................................... 26-1
27 REFERENCES ...................................................................................................... 27-1
28 DATE AND SIGNATURE PAGE ............................................................................ 28-1
29 CERTIFICATE OF QUALIFIED PERSON ............................................................. 29-1

www.rpacan.com
Barrick Gold Corporation – Zaldívar Mine, Project #1683
Technical Report NI 43-101 – March 16, 2012
Rev. 0 Page iii
LIST OF TABLES PAGE
Table 1-1 Mineral Resources – December 31, 2011 ................................................... 1-1 Table 1-2 Mineral Reserves – December 31, 2011 ..................................................... 1-2 Table 4-1 Exploitation Concessions ........................................................................... 4-1 Table 6-1 Zaldívar Production – 2007-2011................................................................ 6-3 Table 10-1 Drilling Summary .................................................................................... 10-2 Table 11-1 QC Insertion Rates ................................................................................. 11-2 Table 14-1 Mineral Resources – December 31, 2011 ............................................... 14-1 Table 14-2 Geological Estimation UGE Codes and Descriptions .............................. 14-7 Table 14-3 Tonnage Factors .................................................................................... 14-8 Table 14-4 TCU Capping Levels .............................................................................. 14-9 Table 14-5 ASCu Capping Levels ............................................................................ 14-9 Table 14-6 TCU Composite Statistics By Geological Domain (UGE) ...................... 14-11 Table 14-7 %TCu Variogram Parameters ............................................................... 14-15 Table 14-8 %TCu Estimation Search Ellipse Parameters ....................................... 14-19 Table 15-1 Mineral Reserves – December 31, 2011 ................................................. 15-1 Table 16-1 Mine Design Parameters ........................................................................ 16-4 Table 16-2 Mine Production Schedule ...................................................................... 16-7 Table 16-3 Mine Equipment Fleet ............................................................................. 16-9 Table 17-1 Metallurgical Model Algorithms ............................................................... 17-8 Table 21-1 Capital Costs .......................................................................................... 21-1 Table 21-2 Mine Operating Costs ............................................................................. 21-2 Table 21-3 Unit Process Operating Costs ................................................................ 21-2 Table 21-4 G&A Costs ............................................................................................. 21-3 Table 21-5 Manpower .............................................................................................. 21-3
LIST OF FIGURES PAGE
Figure 4-1 Location Map............................................................................................. 4-3 Figure 4-2 Zaldívar Exploitation Boundary .................................................................. 4-4 Figure 4-3 Mining Concession Boundary and Surface Rights ..................................... 4-5 Figure 7-1 Regional Geology ...................................................................................... 7-2 Figure 7-2 Property Geology ...................................................................................... 7-4 Figure 7-3 Mineralization Section ............................................................................... 7-8 Figure 10-1 Drill Plan ................................................................................................ 10-4 Figure 14-1 Lithology Zones ..................................................................................... 14-4 Figure 14-2 Alteration Zones .................................................................................... 14-5 Figure 14-3 Mineralization Zones ............................................................................. 14-6 Figure 14-4 Frequency Distribution of TCu Composites Versus Raw Sample Data 14-10 Figure 14-5 Boxplot of TCu Composites for Each UGE .......................................... 14-11 Figure 14-6 Contact Plot Analysis of TCu for Leached and Oxide Domains ........... 14-13 Figure 14-7 Contact Plot Analysis of ASCu for Leached and Oxide Domains ......... 14-13 Figure 14-8 Semi-Soft and Semi-Hard Boundary Weights ...................................... 14-14 Figure 14-9 TCu Correlogram Models for UGE 3.................................................... 14-16

www.rpacan.com
Barrick Gold Corporation – Zaldívar Mine, Project #1683
Technical Report NI 43-101 – March 16, 2012
Rev. 0 Page iv
Figure 14-10 TCu Correlogram Models for UGE 7 .................................................. 14-17 Figure 14-11 TCu Blocks and Assays - Section 22,000N ....................................... 14-20 Figure 14-12 Swath Plots ....................................................................................... 14-21 Figure 14-13 TCu Correlogram for UGE 7 .............................................................. 14-23 Figure 16-1 Zaldívar Mine Phases ............................................................................ 16-2 Figure 16-2 Ultimate Pit Design ................................................................................ 16-5 Figure 16-3 Pit Slope Design Sectors ....................................................................... 16-6 Figure 17-1 Process Flow Sheet .............................................................................. 17-3 Figure 17-2 ASCu Recovery vs. ASCu Head Grade ................................................. 17-5 Figure 17-3 SCu Recovery vs. SCu Head Grade ..................................................... 17-6 Figure 17-4 Metallurgical Recovery Model Curves ................................................... 17-9 Figure 18-1 Site Infrastructure .................................................................................. 18-3

www.rpacan.com
Barrick Gold Corporation – Zaldívar Mine, Project #1683
Technical Report NI 43-101 – March 16, 2012
Rev. 0 Page 1-1
1 SUMMARY EXECUTIVE SUMMARY Roscoe Postle Associates Inc. (RPA) was retained by Barrick Gold Corporation (Barrick)
to prepare an independent Technical Report on the Zaldívar copper operation (the
Project), located in northern Chile. The purpose of this report is to support public
disclosure of Mineral Resource and Mineral Reserve estimates at the Project as of
December 31, 2011. This Technical Report conforms to National Instrument 43-101 (NI
43-101) Standards of Disclosure for Mineral Projects. RPA visited the Zaldívar Mine on
October 24 to 27, 2011.
The Zaldívar Mine is managed and operated by Compañía Minera Zaldívar Ltda. (CMZ),
which is 100% owned by Barrick. Zaldívar is a large scale open pit operation utilizing a
traditional truck and shovel fleet. Mining is carried out from one open pit at a rate of 83
million tonnes per annum (Mtpa), consisting of 22 Mtpa of crushed ore, 15 Mtpa of dump
leach ore, and 46 Mtpa of waste. The ultimate pit will measure approximately 2.8 km
east to west, 2.6 km north to south, and have an average depth of approximately 630 m.
A total of 578 million tonnes grading 0.52% Cu representing 6.6 billion pounds of
contained copper and 3.8 billion pounds of recoverable copper is projected to be
produced between 2012 and 2028.
Table 1-1 summarizes open pit Mineral Resources exclusive of Mineral Reserves as of
December 31, 2011.
TABLE 1-1 MINERAL RESOURCES – DECEMBER 31, 2011 Barrick Gold Corporation – Zaldívar Mine
Category Tonnage (Mt)
Grade (% Cu)
Contained Metal (Mlb Cu)
Measured 71.3 0.432 679.5 Indicated 53.5 0.462 545.5 Total Measured and Indicated 124.8 0.445 1,225.0
Inferred 37 0.54 439 Notes:
1. CIM definitions were followed for Mineral Resources. 2. Mineral Resources are estimated based on a profit model using a copper price of US$3.25 per
pound and a CLP/US$ exchange rate of 500. 3. Mineral Resources are exclusive of Mineral Reserves. 4. Numbers may not add due to rounding.

www.rpacan.com
Barrick Gold Corporation – Zaldívar Mine, Project #1683
Technical Report NI 43-101 – March 16, 2012
Rev. 0 Page 1-2
Table 1-2 summarizes the Zaldívar end of year 2011 (EOY2011) Mineral Reserve
estimate.
TABLE 1-2 MINERAL RESERVES – DECEMBER 31, 2011 Barrick Gold Corporation – Zaldívar Mine
Category Tonnage
(Mt) Cu (%) Contained Metal
(Mlb Cu). Proven 386.3 0.528 4,496.5 Probable 191.7 0.498 2,105.5 Proven & Probable 578.0 0.518 6,602.0
Notes:
1. CIM definitions were followed for Mineral Reserves. 2. Mineral Reserves are estimated at a variable cut-off grade. 3. Mineral Reserves are estimated using an average long-term copper price of US$2.75
per pound and a CLP/US$ exchange rate of 500. 4. Numbers may not add due to rounding.
CONCLUSIONS RPA offers the following conclusions:
GEOLOGY AND MINERAL RESOURCE ESTIMATION
• The EOY2011 Measured and Indicated Mineral Resource is 125 million tonnes at a total copper grade of 0.445% containing 1.225 billion pounds of copper. The Mineral Resources are exclusive of Mineral Reserves.
• The EOY2011 Inferred Mineral Resource is 37 million tonnes at a total copper grade of 0.54% containing 439 million pounds of copper.
• Mineral Resource estimates have been prepared utilizing acceptable estimation methodologies. The classification of Measured, Indicated, and Inferred Resources, stated in Table 1-1, meet the requirements of NI 43-101 and CIM Definition Standards for Mineral Resources and Mineral Reserves dated November 27, 2010 (CIM definitions).
• The methods and procedures utilized by CMZ at the Zaldívar Mine to gather geological, geotechnical, assaying, density, and other information are reasonable and meet generally accepted industry standards. Standard operating protocols are well documented and updated on a regular basis for most of the common tasks. CMZ carries out regular comparisons with blasthole data, previous models, and production reconciliation results to calibrate and improve the resource modelling procedures.
• The current drill hole database is reasonable for supporting a resource model for use in Mineral Resource and Mineral Reserve estimation.

www.rpacan.com
Barrick Gold Corporation – Zaldívar Mine, Project #1683
Technical Report NI 43-101 – March 16, 2012
Rev. 0 Page 1-3
• CMZ has conducted the exploration and development sampling and analysis programs using standard practices, providing generally reasonable results. The resulting data can effectively be used for the estimation of Mineral Resources and Mineral Reserves.
• Overall, RPA is of the opinion that CMZ has done very high quality work that exceeds industry practice.
MINING AND MINERAL RESERVES
• The EOY2011 Proven and Probable Mineral Reserves are 578 million tonnes at a total copper grade of 0.518% containing 6.602 billion pounds of copper.
• The Mineral Reserve estimates have been prepared utilizing acceptable
estimation methodologies and the classification of Proven and Probable Reserves, stated in Table 1-2, conform to CIM definitions.
• The operating data provided by CMZ and the supporting documents were
prepared using standard industry practices and provide reasonable results and conclusions.
• Standard operating protocols are well documented and updated on a regular
basis for most of the common tasks.
• Recovery and cost estimates are based upon operating data and engineering to support a Mineral Reserve statement. Economic analysis using these estimates generates a positive cash flow, which supports a statement of Mineral Reserves.
• The current Zaldívar Life of Mine (LOM) plan provides reasonable results and, in RPA’s opinion, meets the requirements for statement of Mineral Reserves. In addition to the Mineral Reserves in the LOM plan, there are Mineral Resources and potential sulphide resources that represent opportunities for the future.
PROCESSING • The process includes heap leaching with copper recovery in a solvent
extraction/electrowinning (SX/EW) process in the form of copper cathode.
• RPA has reviewed the recovery model and finds the development of the recovery formulas and the reconciliation to historic data to be reasonable. The metallurgical testwork, which supports the models, is also reasonable and adequate.
• In 2012, a revision will be made to the recovery model. The revised recovery model will account for the current operational parameters and results.
ENVIRONMENTAL CONSIDERATIONS
• The Project has approximately 140 active permits. All permits are in good standing and there is an extensive environmental monitoring program to ensure compliance with the requirements of these permits.

www.rpacan.com
Barrick Gold Corporation – Zaldívar Mine, Project #1683
Technical Report NI 43-101 – March 16, 2012
Rev. 0 Page 1-4
RECOMMENDATIONS The Zaldívar LOM plan provides reasonable results and, in RPA’s opinion, meets the
requirements for statement of Mineral Reserves. This Technical Report is based on the
LOM plan. In addition to the LOM plan, there are additional resources and potential
resources that should be given further consideration in the future. Below is a list of
recommendations to consider:
MINING
• The LOM plan is robust and Barrick should proceed to implement the plan as presented.
• There is a known primary sulphide resource below the current Proven plus Probable oxide and secondary sulphide reserves. Additional work to drill these resources and develop a Feasibility Study for the primary sulphide should also proceed.
ENVIRONMENTAL CONSIDERATIONS
• Evaluation of permit requirements, developing baseline studies, and starting a new Environmental Impact Assessment (EIA) for the sulphide project should proceed in unison with the primary sulphide feasibility study.
ECONOMIC ANALYSIS RPA has performed an economic analysis of the Zaldívar Mine using the estimates
presented in this report and confirms that the outcome is a positive cash flow that
supports the statement of Mineral Reserves.

www.rpacan.com
Barrick Gold Corporation – Zaldívar Mine, Project #1683
Technical Report NI 43-101 – March 16, 2012
Rev. 0 Page 1-5
TECHNICAL SUMMARY
PROPERTY DESCRIPTION AND LOCATION Zaldívar is located in the Andean Precordillera in Region II of northern Chile,
approximately 1,400 km north of Santiago and 196 km southeast of the city of
Antofagasta, a deepwater port with bulk loading and unloading facilities. Zaldívar is
connected to Antofagasta by a paved highway as well as the Antofagasta Salta narrow-
gauge railway. Antofagasta is served by national airlines, with several flights daily
providing a link to Santiago and other major centres. The mine is located at an altitude
of 3,200 m.
LAND TENURE The Zaldívar mineral rights boundary is defined by ten overlapping exploitation
concessions that have a combined area of approximately 1,295 ha. The mine is
managed and operated by CMZ, which is 100% owned by Barrick through its acquisition
of Placer on March 3, 2006. There are no royalties payable. Zaldívar is surrounded by
concessions owned by Minera Escondida Limitada (MEL). CMZ has a number of
easement or surface rights agreements with MEL. MEL has authorized CMZ to build
infrastructure such as heap leach pads, the SX/EW plant, tailings and other facilities
within the area covered by the MEL concessions.
EXISTING INFRASTRUCTURE The Project infrastructure and services have been designed to support an operation of
65,000 tpd of ore to dynamic heap leach processing and a nominal 240,000 tpd of total
material mined.
The existing infrastructure includes:
• Mine camp facilities sufficient for the current Zaldívar workforce of 863 people
and the 1,146 contractors and consultants.
• A private two-lane paved road, shared by three major mines, Zaldívar, Escondida, and El Peñón, that leads to the Zaldívar camp and offices.
• Mine and heap leach facilities and an SX/EW plant located at the mine site.
• On-site facilities, including safety/security/first aid/emergency response building,
assay laboratory, plant guard house, dining facilities, and offices.

www.rpacan.com
Barrick Gold Corporation – Zaldívar Mine, Project #1683
Technical Report NI 43-101 – March 16, 2012
Rev. 0 Page 1-6
• Related mine services facilities (truckshop, truck wash facility, warehouse, fuel storage and distribution facilities, reagent storage and distribution facilities) and other services facilities to support operations.
• Process water supplied from groundwater at Negrillar, 130 km east of Zaldívar.
• Rail service that transports sulphuric acid to the mine and copper cathode to the
port of Antofagasta.
• A dual-circuit, 220 kV, 230 km long transmission line.
HISTORY The Zaldívar deposit was discovered in 1979 and exploration drilling was carried out in
1981-1984. In 1989, the mining rights were sold to Sociedad Minera La Cascada
Limitada, which in November 1989 transferred them to Outokumpu under a sales
contract with Outokumpu Resources (Services) Limited. In December 1992, Outokumpu
announced the formation of a 50/50 joint venture with Placer, at which time a joint
venture company, CMZ, was formed.
In November 1995, commercial production started. The capital cost of the Project was
at approximately $600 million. In December 1999, Placer acquired Outokumpu’s 50%
interest in CMZ. In March 2006, Barrick acquired Placer and became owner of the
Project.
GEOLOGY AND MINERALIZATION The Zaldívar porphyry copper deposit is situated on the western margin of the Atacama
Plateau in northern Chile. The deposit is part of a large Tertiary porphyry copper system
that also includes the Escondida porphyry copper deposit. This porphyry complex
occurs within the West Fissure structural system, a major regional feature that has
controlled the emplacement of some of the largest porphyry copper deposits in northern
Chile. The West Fissure system extends for approximately 1,000 km and separates
Paleozoic rocks to the east from Mesozoic and Paleocene rocks to the west.
The Zaldívar deposit occurs at the intersection of three major sets of faults striking north-
south, northwest-southeast, and northeast-southwest. This structural setting has
controlled the emplacement of the intrusives and hypogene mineralization as well as
leaching and secondary enrichment.

www.rpacan.com
Barrick Gold Corporation – Zaldívar Mine, Project #1683
Technical Report NI 43-101 – March 16, 2012
Rev. 0 Page 1-7
There are three main lithologic units at Zaldívar: the Zaldívar porphyry, the andesite unit,
and the Llamo porphyry.
Most of the copper at Zaldívar occurs in a blanket of oxide and secondary sulphide
mineralization that overlies deeper primary sulphide mineralization. The oxide
mineralization mostly occurs in the andesite unit, whereas the secondary sulphide
mineralization generally occurs in the Zaldívar porphyry. The most economically
important mineralization types are secondary sulphide (chalcocite) and oxide
(brochantite and chrysocolla). CMZ is currently investigating the economic potential of
the primary sulphide mineralization, which consists of pyrite, chalcopyrite, bornite, and
molybdenite.
EXPLORATION POTENTIAL Zaldívar is a mature operation with a relatively small mining concession area. The major
exploration programs took place prior to the completion of the feasibility study in 1993. A
major drilling campaign was completed in 2000 to define the limits of the deposit within
the mining concessions. That campaign marked the end of exploration activity targeting
oxide mineralization at Zaldívar. More recently, deep drilling campaigns have targeted
the underlying sulphide mineralization, Zaldívar Deeps Sulphide Cu-Mo-Au-Ag Project.
CMZ built a new block model for this primary sulphide mineralization as part of the 2010
mid-year update. There appears to be sufficient drill holes and technical studies
completed to demonstrate that the mineralization meets the requirement for “reasonable
prospects for economic extraction”.
MINERAL RESOURCES The EOY 2011 open pit Mineral Resources exclusive of Mineral Reserves as stated in
Table 1-1 include a Measured and Indicated Mineral Resource of 124.8 million tonnes
grading 0.445% Cu containing 1.255 billion pounds of copper and an Inferred Mineral
Resource of 37 million tonnes grading 0.54% Cu containing 439 million pounds of
copper. The resource model was prepared by Barrick Senior Resource Geologist
Cristian Monroy under the supervision of Barrick Superintendent of Resource and
Reserve Modelling Benjamin Sanfurgo.

www.rpacan.com
Barrick Gold Corporation – Zaldívar Mine, Project #1683
Technical Report NI 43-101 – March 16, 2012
Rev. 0 Page 1-8
RPA reviewed the resource assumptions, input parameters, geological interpretation,
and block modelling procedures and is of the opinion that the Mineral Resource estimate
is appropriate for the style of mineralization and that the resource model is reasonable
and acceptable to support the EOY2011 Mineral Resource and Mineral Reserve
estimates.
RPA is not aware of any environmental, permitting, legal, title, taxation, socio-economic,
marketing, political, or other issues that could materially affect the Mineral Resource and
Mineral Reserve estimates.
MINERAL RESERVES RPA reviewed the reported resources, production schedules, and cash flow analysis to
determine if the resources meet the CIM definitions to be classified as reserves. Based
on this review, it is RPA’s assessment that the Measured and Indicated Mineral
Resource within the final pit design at Zaldívar can be classified as Proven and Probable
Mineral Reserves.
The open pit reserves are estimated to be 578 million tonnes at 0.518% Cu, containing
6.602 billion pounds of copper and are classified as Proven and Probable Reserves as
presented in Table 1-2.
MINING METHOD The Zaldívar Mine is a traditional open pit truck/shovel operation. The open pit has
seven phases remaining. The ultimate pit will measure approximately 2.8 km east to
west, 2.6 km north to south, and have a maximum depth of approximately 630 m. Waste
and ore are mined on 15 m benches.
The current mine life is from 2012 to 2028. Mine production is 83 Mtpa over the first
eleven years and then decreasing thereafter. This includes a nominal 46 Mtpa of waste
and is based only on mining and processing oxide and secondary sulphide ores.
Metallurgical investigations are underway to evaluate further leaching of primary
sulphide material and/or primary sulphide milling and flotation.

www.rpacan.com
Barrick Gold Corporation – Zaldívar Mine, Project #1683
Technical Report NI 43-101 – March 16, 2012
Rev. 0 Page 1-9
There are three primary waste rock facilities, a heap leach facility, and a small tailings
storage facility that handles tailings from the small flotation plant that processes fines
from the primary heap leach crushing plant.
MINERAL PROCESSING Processing is based on two heap leaching streams, one crushed and one ROM.
Separation of the ore types is done by the mine department based on blasthole sample
analysis. Primary processing is based on heap leaching a crushed material (80%
passing 13 mm) utilizing a dynamic (on-off) heap leach facility. Additionally, marginal
ores are processed through dump leaching at a ROM material size on a static pad.
Pregnant solution from both leach pads is pumped to the SX/EW plant for metal
extraction and production as copper cathodes. From the crushing circuit, 3% of the ore
tonnage for the dynamic heap leach processing ends up in fines which are deposited in
a sediment pond as a result of the washing system incorporated in the tertiary crushing
system. These sediments are periodically processed through a small flotation plant and
a copper concentrate is produced for sale.
The dynamic heap leach facility is based on a nominal 65,000 tpd operation (22 Mtpa).
The ROM dump leach facility is based on the dynamic heap leach capacity and ore
availability in the mine, and will average a nominal 15 Mtpa over the remaining mine life.
ENVIRONMENTAL, PERMITTING AND SOCIAL CONSIDERATIONS The present operation of the Zaldívar Mine was approved in its original form called the
“Zaldívar Project” in 1993 by the Comisión Regional del Medio Ambiente de la II Región
de Antofagasta (COREMA). The project had, as its principal installation, an operating
open pit mine, primary, secondary and tertiary crushing plants, a concentrating plant for
fines, waste dumps, and tailings and a production line for copper cathodes that consists
of a dynamic leach facility, ROM leach facility for low grade, and an SX/EW plant.
In 2009, an updated EIA was developed to optimize the mining processes and maintain
production levels. The EIA was approved by COREMA in February 2010. On December
9, 2010, CMZ obtained its operational permits from the Servicio Nacional de Geología y
Minería (SERNAGEOMIN) and expects to obtain other associated sectoral permits in
due course.

www.rpacan.com
Barrick Gold Corporation – Zaldívar Mine, Project #1683
Technical Report NI 43-101 – March 16, 2012
Rev. 0 Page 1-10
The Zaldívar Mine has approximately 140 active permits. All permits are in good
standing. The mine runs an extensive environmental monitoring program to ensure
compliance with the requirements of these permits. For the major environmental issues
identified, management plans have been developed that include rehabilitation, site
decommissioning, and closure.
Zaldívar operates under Barrick’s sustainability policy, which commits the operation to a
corporate standard of environmental stewardship. This involves protecting human
health, reducing the impact of mining on the ecosystem, and returning the site to a state
compatible with a healthy environment. Zaldívar operates in an environmentally
responsible manner with limited adverse impacts on the environment. Programs are in
place that continuously monitor the process and surrounding areas and employ leak
detection wells to detect any potential problems.
Mine closure plans are reviewed and analyzed annually. Current cost estimates for
closure are $36.2 million.
CAPITAL AND OPERATING COST ESTIMATES Remaining capital costs at Zaldívar are all primarily sustaining capital, which includes
mine equipment replacement. Total remaining capital costs are a nominal $440 million.
Mine prestripping capital of $193 million has been treated as an operating cost for the
purposes of this Technical Report. Engineering studies for a primary sulphide flotation
and process plant expansion are also included in the sustaining capital.
The Zaldívar Mine has been in production since November 1995. Operating costs are
tracked and well understood. Mine operating costs are a nominal $1.47 per tonne of
material mined or $3.12 per tonne of ore mined. Process operating costs are $7.35 per
tonne ore processed and include the dynamic pad or heap leach and the dump leach,
the crushing plant, acid, and all reagents. General and administrative costs (G&A) are
$1.25 per tonne ore processed and include all management salaries, camp operating
costs, and environmental, health and safety.
Zaldívar Mine site manpower is a nominal 2,000 people. Direct Zaldívar employees are
only 863 with 1,146 contractors and consultants as of November 2011.

www.rpacan.com
Barrick Gold Corporation – Zaldívar Mine, Project #1683
Technical Report NI 43-101 – March 16, 2012
Rev. 0 Page 2-1
2 INTRODUCTION Roscoe Postle Associates Inc. (RPA) was retained by Barrick Gold Corporation (Barrick)
to prepare an independent Technical Report on the Zaldívar copper operation (the
Project), located in northern Chile. The purpose of this report is to support public
disclosure of Mineral Resource and Mineral Reserve estimates at the Project as of
December 31, 2011. This Technical Report conforms to NI 43-101 Standards of
Disclosure for Mineral Projects.
Barrick is a Canadian publicly traded mining company with a large portfolio of operating
mines and projects across five continents. Zaldívar is located in the Andean
Precordillera in Region II of northern Chile, approximately 1,400 km north of Santiago
and 196 km southeast of the city of Antofagasta.
The Zaldívar mining operation is managed and operated by Compañía Minera Zaldívar
(CMZ), which is 100% owned by Barrick through its acquisition of Placer Dome Inc.
(Placer) on March 3, 2006. There are no royalties payable. Zaldívar is surrounded by
concessions owned by Minera Escondida Limitada (MEL). MEL has authorized CMZ to
build infrastructure such as heap leach pads, the solution extraction/electrowinning
(SX/EW) plant, and tailings facilities within the area covered by its mining concessions.
MEL has begun mining the high walls that straddle the property boundary and
stockpiling CMZ ore for CMZ.
Zaldívar is a large scale operation utilizing a traditional truck and shovel fleet. Mining is
carried out from one open pit at a rate of 83 million tonnes per annum (Mtpa), consisting
of 22 Mtpa of crushed ore, 15 Mtpa of dump leach ore, and 46 Mtpa of waste. The
ultimate pit will measure approximately 2.8 km east to west, 2.6 km north to south, and
have an average depth of approximately 630 m. A total of 578 million tonnes grading
0.52% Cu representing 6.6 billion pounds of contained copper and 3.8 billion pounds of
recoverable copper is projected to be produced between 2012 and 2028.

www.rpacan.com
Barrick Gold Corporation – Zaldívar Mine, Project #1683
Technical Report NI 43-101 – March 16, 2012
Rev. 0 Page 2-2
SOURCES OF INFORMATION RPA Principal Geological Engineer Luke Evans, M.Sc., P.Eng., and RPA Principal
Mining Engineer Richard J. Lambert, MBA., P.E., visited the property from October 24 to
27, 2011.
Discussions were held with the following Barrick personnel:
• Leonardo González – General Manager of Operations • Eduardo Jofré – Technical Services Superintendent • Roberto Alfaro – Regional Superintendent of Long Range Mine Planning • Guillermo Albornoz – Chief Geotechnical Engineer • Eduardo Riveros - Chief Engineer • Mauricio Rubio – Chief Geologist • Norman Colón – Chief Metallurgist • Ramón Guajardo – Environmental Superintendent • Cristian Monroy – Senior Resource Geologist • Benjamin Sanfurgo - Superintendent of Resource and Reserve Modelling • Susy Solis –Geologist • Romina Ganga – Ore Control Geologist • Carolina Vera – Ore Control Geologist • Victor Diaz- Mine Laboratory Manager • Walter Hevia – Sample Preparation Shift Supervisor • Jorge Vega – Land Manager • Gregorio Olivares - Controller • Carolina Vasquez – Accountant (Capital costs) • Moises Bautista – Accountant (Operating costs)
The Zaldívar operation has been the subject of resource/reserve technical audits as
follows:
• March 2009, Mineral Reserve and Resource Audit, Scott Wilson Roscoe Postle Associates Inc. (Scott Wilson RPA, a predecessor company to RPA).
• February 2007, Reserve Procedure Audit, Scott Wilson RPA.
• December 2006, Level 2 Resource and Reserve Audit, Placer Dome Inc.
• December 31, 2004, NI 43-101 Technical Report, AMEC Americas Limited (AMEC).
• November 2004, Resource and Reserve Audit, Placer Dome Inc.
Mr. Evans is responsible for the overall preparation of this report. Mr. Evans reviewed
the geology, sampling, assaying, and resource estimate work and is responsible for
Items 1 to 12 and 14. Mr. Lambert reviewed the metallurgy, mining, reserve estimate,

www.rpacan.com
Barrick Gold Corporation – Zaldívar Mine, Project #1683
Technical Report NI 43-101 – March 16, 2012
Rev. 0 Page 2-3
environment, and economics and is responsible for Items 13, and 15 to 26. RPA would
like to acknowledge the excellent cooperation in the transmittal of data by Barrick
personnel.
The documentation reviewed, and other sources of information, are listed at the end of
this report in Section 27 References.
www.rpacan.com
Barrick Gold Corporation – Zaldívar Mine, Project #1683
Technical Report NI 43-101 – March 16, 2012
Rev. 0 Page 2-4
LIST OF ABBREVIATIONS Units of measurement used in this report conform to the metric system. All currency in
this report is US dollars (US$) unless otherwise noted.
µ micron km2 square kilometre °C degree Celsius kPa kilopascal °F degree Fahrenheit kVA kilovolt-amperes µg microgram kW kilowatt A ampere kWh kilowatt-hour a annum L litre bbl barrels L/s litres per second Btu British thermal units m metre C$ Canadian dollars M mega (million) cal calorie m2 square metre cfm cubic feet per minute m3 cubic metre cm centimetre min minute cm2 square centimetre MASL metres above sea level d day mm millimetre dia. diameter mph miles per hour dmt dry metric tonne MVA megavolt-amperes dwt dead-weight ton MW megawatt ft foot MWh megawatt-hour ft/s foot per second m3/h cubic metres per hour ft2 square foot opt, oz/st ounce per short ton ft3 cubic foot oz Troy ounce (31.1035g) g gram ppm part per million G giga (billion) psia pound per square inch absolute Gal Imperial gallon psig pound per square inch gauge g/L gram per litre RL relative elevation g/t gram per tonne s second gpm Imperial gallons per minute st short ton gr/ft3 grain per cubic foot stpa short ton per year gr/m3 grain per cubic metre stpd short ton per day hr hour t metric tonne ha hectare tpa metric tonne per year hp horsepower tpd metric tonne per day in inch US$ United States dollar in2 square inch USg United States gallon J joule USgpm US gallon per minute k kilo (thousand) V volt kcal kilocalorie W watt kg kilogram wmt wet metric tonne km kilometre yd3 cubic yard km/h kilometre per hour yr year

www.rpacan.com
Barrick Gold Corporation – Zaldívar Mine, Project #1683
Technical Report NI 43-101 – March 16, 2012
Rev. 0 Page 3-1
3 RELIANCE ON OTHER EXPERTS This report has been prepared by Roscoe Postle Associates Inc. (RPA) for Barrick Gold
Corporation (Barrick). The information, conclusions, opinions, and estimates contained
herein are based on:
• Information available to RPA at the time of preparation of this report, • Assumptions, conditions, and qualifications as set forth in this report, and • Data, reports, and other information supplied by Barrick and other third party
sources.
For the purpose of this report, RPA has relied on ownership information provided by
Barrick. RPA has not researched property title or mineral rights for the Zaldívar property
and expresses no opinion as to the ownership status of the property.
RPA has relied on Barrick for guidance on applicable taxes, royalties, and other
government levies or interests, applicable to revenue or income from Zaldívar.
Except for the purposes legislated under provincial securities laws, any use of this report
by any third party is at that party’s sole risk.

www.rpacan.com
Barrick Gold Corporation – Zaldívar Mine, Project #1683
Technical Report NI 43-101 – March 16, 2012
Rev. 0 Page 4-1
4 PROPERTY DESCRIPTION AND LOCATION LOCATION Zaldívar is located in the Andean Precordillera in Region II of northern Chile,
approximately 1,400 km north of Santiago and 196 km southeast of the city of
Antofagasta (Figures 4-1 and 4-2). Zaldívar is connected to Antofagasta by a paved
highway as well as the Antofagasta Salta narrow-gauge railway. Antofagasta is a
deepwater port with bulk loading and unloading facilities. The city is served by national
airlines, with several flights daily providing a link to Santiago and other major centres.
The mine is located at an altitude of 3,200 m.
LAND TENURE Under Chilean regulations, the exploitation or mining concessions can be held
indefinitely as long as the annual fees are paid to keep the permits in good standing.
The exploitation concessions give the right to extract the ore and to sell the final
products into the open market.
The Zaldívar mineral rights boundary is defined by combining ten overlapping
exploitation concessions that have a total area of approximately 1,295 ha. The
individual exploitation concessions are listed in Table 4-1 and the final official property
boundary is shown in Figure 4-2.
TABLE 4-1 EXPLOITATION CONCESSIONS Barrick Gold Corporation – Zaldívar Mine
Name Registration # Area (ha)*
Zaldívar 262/509 02201-1168-7 1,240 Ana 1/180 02201-2489-4 180 Antonia 1/191 02201-2493-2 191 Andrea 1/216 02201-2492-4 216 Aurora 1/201 02201-2491-6 201 Amanda 1/220 02201-2490-8 220 Angela 1/127 02201-2488-6 127 Berta 1/76 02201-2494-0 76 Rey 1/133 02201-2563-7 262 Reina 1/115 02201-2564-5 172
* Areas have considerable overlap, so total area is 1,295 ha.

www.rpacan.com
Barrick Gold Corporation – Zaldívar Mine, Project #1683
Technical Report NI 43-101 – March 16, 2012
Rev. 0 Page 4-2
The Zaldívar mining operation is managed and operated by Compañía Minera Zaldívar
(CMZ), which is 100% owned by Barrick through its acquisition of Placer Dome Inc.
(Placer) on March 3, 2006. There are no royalties payable. Zaldívar is surrounded by
concessions owned by Minera Escondida Limitada (MEL). CMZ has a number of
easement or surface rights agreements with MEL. MEL has authorized CMZ to build
infrastructure such as heap leach pads, the SX/EW plant, tailings and other facilities
within the area covered by the MEL concessions. The current areas covered by surface
rights agreements are shown in Figure 4-3, which also shows the locations of the mine,
surface infrastructure, and mining concessions for the Zaldívar operations. MEL has
begun mining the high walls that straddle the property boundary.

ZALDÍVAR
N
Source: Barrick Gold Corp., 2009.March 2012
Zaldívar Mine
Location Map
Barrick Gold Corporation
Region II (Antofagasta),Northern Chile
Figure 4-1
4-3
www.rpacan.com

493,000 494,000 495,000
7,3
25,0
00
7,3
26,0
00
7,3
24,0
00
7,3
22,0
00
7,3
23,0
00
7,3
21,0
00
7,3
20,0
00
7,3
25,0
00
7,3
26,0
00
7,3
24,0
00
7,3
22,0
00
7,3
23,0
00
7,3
21,0
00
7,3
20,0
00
495,000490,000 491,000 492,000 493,000 494,000
490,000 491,000 492,000
Zaldívar Exploitation
Boundary
0 500
Metres
1000 1500 2000
N
Source: Barrick Gold Corp., 2011.March 2012
Zaldívar Mine
Exploitation Boundary
Barrick Gold Corporation
Region II, Northern Chile
Figure 4-2
4-4
www.rpacan.com

N
Source: Barrick Gold Corp., 2011.
Mining Concession
Surface Rights
Boundary
March 2012
Mining Concession Boundaryand Surface Rights
Zaldívar Mine
Barrick Gold Corporation
Region II, Northern Chile
Figure 4-3
4-5
www.rpacan.com

www.rpacan.com
Barrick Gold Corporation – Zaldívar Mine, Project #1683
Technical Report NI 43-101 – March 16, 2012
Rev. 0 Page 5-1
5 ACCESSIBILITY, CLIMATE, LOCAL RESOURCES, INFRASTRUCTURE AND PHYSIOGRAPHY ACCESSIBILITY Antofagasta is the Capital of Region II and is home to most employees at Zaldívar.
Antofagasta has a population of 360,000 people (2009 census). There is daily
commercial air service to Antofagasta from Santiago. There is a dirt airstrip at the
Zaldívar mine site.
Access to the site is via a paved road from Antofagasta, following Highway 28 for 15 km
to the southwest to the intersection with Route 5 (Pan-American Highway). From the
intersection with Route 5, there is a private two-lane paved road that is shared by three
major mines, Zaldívar, Escondida, and El Peñón, which heads to the east. It is 137 km
to the Zaldívar turnoff. From the turnoff, it is seven kilometres to the Zaldívar camp and
another eight kilometres to the Zaldívar mine offices. The total distance from
Antofagasta is 170 km. Most consumables are transported along this route by truck.
The site is also serviced by rail with Ferrocarril Antofagasta - Bolivia (FCAB) transporting
sulphuric acid to the mine and copper cathode to the port of Antofagasta.
CLIMATE Zaldívar has an arid high desert climate. The mine lies 3,200 m above sea level.
Temperatures range from -7°C in July to 22°C in January, with an average temperature
of 10°C. Precipitation typically falls in the summer months, with 2 mm to 6 mm per
annum. There is little precipitation and water from the area does not reach the sea.
Vegetation is almost absent and is restricted to areas with water accumulation,
temporary runoff, or underground phreatic surfaces. Typical vegetation mostly consists
of small flowering plants and cacti, such as oxalis hypsophila, cistanthe salsoloides,
adesmia atacamensis, and sisymbrium philippianum.

www.rpacan.com
Barrick Gold Corporation – Zaldívar Mine, Project #1683
Technical Report NI 43-101 – March 16, 2012
Rev. 0 Page 5-2
LOCAL RESOURCES The workforce consists of 835 employees. In addition, there are approximately 1,150
contractors. Camp facilities are provided on site for both company personnel and
contractor personnel. Personnel generally work on a four day rotation and are
transported to and from site by company bus or light vehicles.
INFRASTRUCTURE WATER Process water is supplied from groundwater at Negrillar, 130 km east of Zaldívar. The
water is drawn from six production wells and pumped to the freshwater pond near the
tertiary crushing facility at the plant site. Current use is approximately 220 L/s.
POWER Zaldívar consumes a nominal 72 MWh to 76 MWh. The power supplier is AES Gener.
The power transmission is part of Sistema Interconectado del Norte Grande (SING), the
regional electrical grid for Northern Chile. A dual-circuit, 220 kV, 230 km long
transmission line was constructed with MEL between the Zaldívar and Escondida Norte
plant sites and the SING substation at El Crucero.
PHYSIOGRAPHY Rugged mountains with incised steep-sided valleys characterize the Zaldívar Project
area. Elevations in the region vary from approximately 1,500 m to 3,500 m, and the
alpine climate is cold, dry, and windy. Vegetation is sparse. Rock outcrops and colluvial
soils predominate in the valley walls with colluvium, alluvium, and moraine till exposed
on the valley floors. The overburden is approximately 20 m to 50 m thick in the northern
part of the property and up to 100 m thick to the south.

www.rpacan.com
Barrick Gold Corporation – Zaldívar Mine, Project #1683
Technical Report NI 43-101 – March 16, 2012
Rev. 0 Page 6-1
6 HISTORY EXPLORATION AND OWNERSHIP HISTORY The exploration and ownership history is summarized below:
1979 The initial declaration or statement of discovery (manifestación minera) was presented to the First Civil Court of Antofagasta by Mr. Pedro Buttazzoni Alvarez.
1981 Mr. Buttazzoni, through his company Sociedad Contractual Minera Varillas
(SCMV), formed the company Sociedad Legal Minera Zaldívar 262 de Zaldívar. Shareholders in this new company were SCMV (88.33%) and Minera Utah de Chile Inc. and Getty Mining (Chile) Inc. (with a joint interest of 11.67%).
1981-1984 Exploration drilling was done in the area by Minera Utah de Chile Inc. 1989 As a result of various transactions during the previous eight years, SCMV held
51% and MEL the remaining 49%. In March 1989, the mining rights were sold to Sociedad Minera La Cascada Limitada (SMCL-Pudahuel). A sales contract was executed between SMCL-Pudahuel and Outokumpu Resources (Services) Limited. The mining claims were then transferred to Minera Outokumpu Chile Limitada (Outokumpu) in November.
1992 Outokumpu announced the formation of a 50/50 joint venture with Placer in
December, at which time a joint venture company, CMZ, was formed. 1995 Commercial production started in November. The capital cost of the project was
within budget at approximately $600 million. 1999 Placer acquired Outokumpu’s 50% interest in CMZ, effective December 13,
1999. 2006 Barrick acquired Placer on March 3, 2006.
PRODUCTION HISTORY Since commencement of commercial operations in 1995, the following significant
changes have been made:
1996 The feed system to the secondary crushers was improved in September 1996 by the addition of a feed bin with belt feeders controlling the material flow to each crusher.
1997 A pre-screening plant was installed in July 1997 to allow -12 mm material (approximately 40% of the heap leach ore) to bypass tertiary crushing. In January 1998 these screens were converted from the original wet design to dry operation.

www.rpacan.com
Barrick Gold Corporation – Zaldívar Mine, Project #1683
Technical Report NI 43-101 – March 16, 2012
Rev. 0 Page 6-2
The installation has not only alleviated problems in the tertiary crusher, but has also proven advantageous to leach performance by bypassing fine material directly to the heap leach pad.
1998 In January 1998 a flotation plant was put into operation to recover copper from the tertiary crusher circuit slimes.
1998 In May 1998, two-pass leaching was introduced by installing an intermediate PLS pond in the heap leach circuit. This has improved leach recovery by substantially increasing the wash rate and the PLS grade.
1999 In April 1999 the heap leach operation was converted to an on/off (dynamic) pad. 2000 In July 2000, a fifth tertiary crusher line was installed, enabling part of the wet
flush crusher circulating load to be treated in open circuit by two MP500 crushers.
2001 In March 2001, the first PLS from dump leaching was introduced to the SX circuit.
The open pit fleet has been progressively upgraded and expanded as plant feed
requirements have increased. The current open pit fleet has the capacity to move
approximately 240,000 tpd of material.
The electrowinning plant has been modified to produce 150,000 tonnes (330.7 Mlb) of
copper cathode per year, 20% over the original design capacity of 125,000 tonnes.
Table 6-1 shows the production from the Zaldívar Mine since 2007.

www.rpacan.com
Barrick Gold Corporation – Zaldívar Mine, Project #1683
Technical Report NI 43-101 – March 16, 2012
Rev. 0 Page 6-3
TABLE 6-1 ZALDÍVAR PRODUCTION – 2007-2011 Barrick Gold Corporation – Zaldívar Mine
Item 2007 2008 2009 2010 2011 (Jan-Oct)
Mine to Heap Leach (t) 16,144,945 15,141,101 15,708,166 14,506,756 12,782,070 TCu (%) 0.822 0.778 0.722 0.697 0.646 ASCu (%) 0.602 0.576 0.456 0.427 0.402 Mine to Stockpile (t) 7,839,300 9,940,350 16,542,135 13,087,447 4,852,549 TCu (%) 0.563 0.538 0.520 0.534 0.634 ASCu (%) 0.325 0.335 0.256 0.260 0.354 Mine to Dump Leach (t) 14,037,870 19,253,647 21,772,868 8,413,425 9,718,600 TCu (%) 0.348 0.364 0.404 0.386 0.349 ASCu (%) 0.177 0.183 0.165 0.173 0.176 Waste (t) 32,553,025 29,953,500 13,183,650 21,604,314 26150141 Total Mine (t) 70,575,140 74,288,598 67,206,819 57,611,942 53,503,360
Stockpile to Heap Leach (t) 3,169,034 4,027,521 5,436,157 6,560,624 4,736,268 TCu (%) 0.782 0.827 0.724 0.740 0.595 ASCu (%) 0.536 0.511 0.466 0.469 0.364 Stockpile to Dump Leach (t) - - - 11,116,781 8,299,575 TCu (%) - - - 0.510 0.392 ASCu (%) - - - 0.459 0.190 Total Stockpile (t) 3,169,034 4,027,521 5,436,157 17,677,405 13,035,843 Total Mine and Stockpile (t) 73,744,174 78,316,119 72,642,976 75,289,347 66,539,203
Total to Heap Leach (t) 19,313,979 19,168,622 21,144,323 21,067,380 17,518,337 TCu (%) 0.816 0.789 0.723 0.710 0.632 ASCu (%) 0.591 0.562 0.458 0.440 0.391 Total to Dump Leach (t) 14,037,870 19,253,647 21,772,868 19,530,206 18,018,175 TCu (%) 0.348 0.364 0.404 0.456 0.369 ASCu (%) 0.177 0.183 0.165 0.336 0.183

www.rpacan.com
Barrick Gold Corporation – Zaldívar Mine, Project #1683
Technical Report NI 43-101 – March 16, 2012
Rev. 0 Page 7-1
7 GEOLOGICAL SETTING AND MINERALIZATION REGIONAL GEOLOGY The Zaldívar porphyry copper deposit is situated on the western margin of the Atacama
Plateau in northern Chile. The deposit is part of a large Tertiary porphyry copper system
that includes the Escondida porphyry copper deposit. This porphyry complex occurs
within the West Fissure structural system, a major regional feature that has controlled
the emplacement of some of the largest porphyry copper deposits in northern Chile
(Figure 7-1). The West Fissure system extends for approximately 1,000 km and
separates Paleozoic rocks to the east from Mesozoic and Paleocene rocks to the west.
The Zaldívar porphyry system lies at the intersection of the West Fissure and a series of
northwest and northeast striking faults.
Supracrustal rocks in the region range in age from Paleozoic to the Quaternary.
Rhyolitic and andesitic flow units of the Upper Paleozoic La Tabla Formation and the
Upper Triassic Agua Dulce Formation are exposed in the east. The southwestern
portion of the area is overlain by marine sedimentary rocks assigned to the Upper
Triassic–Lower Jurassic Profeta Formation and Cretaceous continental units of the
Santa Ana Formation. Andesite volcanic and volcaniclastic units occupy the north and
central parts of the area. These belong to the Upper Cretaceous–Eocene age Augusta
Victoria Formation. Two periods of intrusive activity occurred in the region. Dioritic and
monzonitic intrusives were emplaced during the Upper Cretaceous–Eocene age, and
dioritic to rhyolitic porphyries occurred during Eocene–Oligocene times. Oligocene–
Miocene age unconsolidated gravels, alluvium, and colluvium cover the older rock units.

WEST FISSURE
METALLOGENICBELT
WEST FISSURE
METALLOGENICBELT
N
Source: Noble et al., 1999.March 2012
Regional Geology
Zaldívar Mine
Barrick Gold Corporation
Region II, Northern Chile
Figure 7-1
7-2
www.rpacan.com

www.rpacan.com
Barrick Gold Corporation – Zaldívar Mine, Project #1683
Technical Report NI 43-101 – March 16, 2012
Rev. 0 Page 7-3
LOCAL AND PROPERTY GEOLOGY The Zaldívar porphyry is located at the intersection of the north-south striking faults of
the Domeyko Fault system with the northeast and northwest striking faults. The deposit
is generally centred on a northeast striking granodiorite porphyry body that intrudes
andesites and rhyolites, and cuts across the north-south striking Portezuelo Fault.
There are three main lithologic units at Zaldívar: the Zaldívar porphyry, the andesite unit,
and the Llamo porphyry (Figure 7-2). At approximately 290 million years old (Richards
et al., 1999), the Zaldívar porphyry is the oldest unit and occupies most of the area east
of the Portezuelo Fault. This rock unit typically consists of grey rhyolitic feldspar-quartz
porphyry. Phenocrysts are mainly quartz, K-feldspar, and plagioclase. The quartzo-
feldspathic groundmass is variably obliterated by sericite due to prevalent phyllic
(quartz–sericite) alteration.
The andesite unit correlates with the August Victoria Formation, which has been dated
between 66.6 and 41.2 million years (Marinovic et al., 1995) and it is the dominant
lithology west of the Portezuelo Fault. Rocks are greenish grey to dark grey and display
a fine-grained porphyritic texture with an aphanitic groundmass. The Llamo porphyry is
the most recent intrusive event in the area and is dated at approximately 37.4 million
years old (Richards et al., 1999). The porphyry trends roughly northeast-southwest
across the deposit, outcropping on either side of the Portezuelo Fault where it intrudes
both the andesite unit and the Zaldívar porphyry. It occurs as irregularly shaped dikes to
small stock-like bodies 50 m to 200 m wide. This rock unit, a feldspar-biotite-quartz
porphyry, is typically light greyish green and fine grained.
Several hydrothermal and tectonic breccias bodies closely associated with major
structures, such as the Portezuelo Fault, have been recognized in the mine area. Much
of the lower slopes and valley floors in the area are covered with thick Quaternary
alluvial/colluvial deposits. These deposits are locally derived and generally consist of
dry, loose to dense, well-graded silt, sand, and gravel. Pockets of aeolian silt and fine
sand also occur in the area.

Gravel
Latellamo Porphyry
Hydrothermal Breccias
Llamo Porphyry
Andesite
Zaldivar “Porphyry”
Fault N
0 250
Metres
500 750 1000
March 2012 Source: Barrick Gold Corp., 2011.
Property Geology
Zaldívar Mine
Barrick Gold Corporation
Region II, Northern Chile
Figure 7-2
7-4
www.rpacan.com

www.rpacan.com
Barrick Gold Corporation – Zaldívar Mine, Project #1683
Technical Report NI 43-101 – March 16, 2012
Rev. 0 Page 7-5
The Zaldívar deposit occurs at the intersection of three major sets of faults striking north-
south, northwest-southeast, and northeast-southwest. This structural setting has
controlled the emplacement of the intrusives and hypogene mineralization as well as
leaching and secondary enrichment.
The most prominent structures strike north-south and northwest-southeast and dip
moderately to steeply northeast to southwest. Breccia zones one metre to five metres
wide are commonly associated with the north-south fault set. These faults mimic the
regional structures. The north-south set parallels the West Fissure structural trend,
which is approximately 10 km wide and consists of an arrangement of steeply dipping,
north-south trending structures. The northwest-southeast set parallels a regionally
continuous, secondary structural trend. Both fault sets appear to be pre-intrusive and
presumably control the emplacement of subsequent intrusions. It is also at the
intersection of these faults that copper mineralization is best developed. A second set of
faults strike northeast-southwest with steep dips to the northwest and southeast. This
set is weakly to moderately developed, however, it is closely associated with the Zaldívar
deposit and may have controlled the emplacement of the Llamo porphyry.
ALTERATION The alteration developed in the Zaldívar Porphyry correspond to an early potassic
alteration event, represented by secondary K-feldspar, which affect the Llamo Porphyry
and the Paleozoic rocks below the 3,050 m elevation, and by secondary biotite, which
widely affects the andesitic rocks.
This alteration is overprinted by low temperature quartz-sericite hydrothermal alteration
with two stages of development. An early wide spread stage of sericite-chlorite
alteration followed by the principal stage with more penetrative quartz-sericite-pyrite
alteration focused in the mid part of the deposit and with a clear association with the
Llamo Porphyry intrusions. Strong sericite alteration is present as discontinuous bodies
in the core of the quartz-sericitic alteration zones and typically destroys primary rock
textures. Propylitic alteration with chlorite as the main mineral effects the andesitic rocks
and the late Llamo Porphyry.

www.rpacan.com
Barrick Gold Corporation – Zaldívar Mine, Project #1683
Technical Report NI 43-101 – March 16, 2012
Rev. 0 Page 7-6
The final stage of the system is represented by very restricted advanced argillic
alteration. Finally, as result of the leaching and oxidation of the rock column of the
deposit, the supergene argillic alteration is developed, affecting all the lithological types
with variable intensity, but being typically stronger in the andesitic rocks.
MINERALIZATION The mineralization has an elongated shape trending northeast-southwest. This is the
result of the overprinted hypogene and supergene processes, where the latter with its
leaching and enrichment process, gave the deposit a characteristic vertical profile with a
superior leached zone, an oxide copper zone, and a secondary sulfide zone located
between the oxide and the basal primary sulfide zone.
The leached zone is present as a continuous horizon in the upper part of the deposit,
with local depths of up to 300 m. The typical mineralogy of this zone includes
hydroxides and iron sulfates (hematite-goethite-jarosite) with copper phosphate
(turquoise).
The oxide zone extends more or less continuously from the Portezuelo Fault and
surrounding areas towards the southwest, covering an area of approximately 2 km by
1.5 km and with an average thickness of approximately 90 m. The oxide zone is incised
locally by leached areas related to faults of the northwest-southeast structural system.
The mineralogy varies according to lithology and dominant alteration. For example,
brochantite-antlerite is found in the rhyolitic rocks and chrysocolla, “black copper”, and
copper phosphate are found in the andesitic rocks with chlorite-biotite alteration.
The secondary sulfides cover an area of approximately 2.5 km by 1.5 km, with a variable
thickness from a few metres in the southwest extremity up to over 300 m in the northeast
extremity. Mineralogy in this area is represented by pyrite, chalcocite, covellite,
chalcopyrite and minor sphalerite and molybdenite. Chalcocite is the dominant
secondary sulfide mineral (over 80%). Covellite is the main sulfide mineral present in
the transition zone to the underlying primary sulfides. Alunite dating indicates an age for
the secondary enrichment process of approximately 18 My to 14.7 My (Monroy 2010).

www.rpacan.com
Barrick Gold Corporation – Zaldívar Mine, Project #1683
Technical Report NI 43-101 – March 16, 2012
Rev. 0 Page 7-7
The primary sulphide zone follows the Llamo Porphyry trends and over 70% of the
mineralization occurs in veinlets. The primary sulfide body has a bornite-rich core with
minor chalcopyrite that is located in the Llamo Porphyry and in the late magmatic
breccias. The bornite-rich core is enveloped by a chalcopyrite-pyrite zone which in turn
is surrounded by a pyritic halo. The primary mineralization age is 37.2 My (Morales
2010).

LEGEND
LEACHED ZONE
OXIDE ZONE
SECONDARY SULPHIDE ENRICHMENT
MIXED ZONE
PRIMARY ZONE
Eo-Mio
THE HYPOGENE MINERALIZATION IS CLOSELY RELATED TO THE LLAMO PORPHYRY AND THE ENRICHMENTZONE OCCUR IN ALL ROCK UNITS PRESENT.
THE ENRICHMENT ZONE SHOWS A NE-SW ELONGATION WITH THE SULFIDE ZONE OPEN TO NORTHEAST.
500 m2500 2700 m.s.nm
3500 m.s.nm
A
A`
2700 m.s.nm
3500 m.s.nm
0 500
Metres
250
March 2012 Source: CMZ Geology Powerpoint Presentation, 2008.
Mineralization Section
Zaldívar Mine
Barrick Gold Corporation
Region II, Northern Chile
Figure 7-3
7-8
ww
w.rp
acan
.co
m

www.rpacan.com
Barrick Gold Corporation – Zaldívar Mine, Project #1683
Technical Report NI 43-101 – March 16, 2012
Rev. 0 Page 8-1
8 DEPOSIT TYPES Zaldívar is a porphyry copper deposit and together with the nearby Escondida and
Chimbarazo deposits form part of the Eocene-Oligocene porphyry belt of Northern Chile.
They are located at the intersections of the north-south regional faults belonging to the
Domeyko Fault System with northwest and northeast fault systems.
The hypogene mineralogy of the deposit begins in the late magmatic stage where early
veinlets of biotite and/or magnetite with bornite or minor chalcopyrite were developed.
These are followed by “A” veinlets comprising quartz, K-feldspar, anhydrite, bornite,
chalcopyrite, and primary chalcocite veinlets. These veinlets occur in strong potassic
alteration characterized by biotite and secondary K-feldspar. In the transition from the
late magmatic stage to early hydrothermal stage, a third generation of “B” veinlets is
developed with quartz and minor K-feldspar and abundant chalcopyrite and/or
molybdenite. For the principal hydrothermal event of quartz-sericite alteration two
stages are recognized. The “C” veinlets, characterized by quartz with chalcopyrite,
molybdenite, or chalcopyrite-pyrite with sericite-chlorite haloes, develop during the early
stage. The main stage is represented by “D” veinlets with or without quartz, abundant
pyrite, minor chalcopyrite and sphalerite and with quartz- sericite-pyrite alteration haloes.
Later, during the Miocene, the supergene processes associated with the uplift, erosion,
oxidation and leaching of the deposit in a desert environment resulted in the leached
horizon, immediately underlain by the oxide copper horizon, which is underlain by the
secondary sulfide horizon, which all sits on top of the primary sulfide zone.

www.rpacan.com
Barrick Gold Corporation – Zaldívar Mine, Project #1683
Technical Report NI 43-101 – March 16, 2012
Rev. 0 Page 9-1
9 EXPLORATION Zaldívar is a mature operation with a relatively small mining concession area. The major
exploration programs took place prior to the completion of the feasibility study in 1993. A
major drilling campaign was completed in 2000 to define the limits of the deposit within
the mining concessions. More recently, deep drilling campaigns have targeted the
underlying sulphide mineralization. CMZ drills approximately 15,000 m of infill reverse
circulation drill holes each year.
EXPLORATION POTENTIAL CMZ has been evaluating the economic potential of the primary copper mineralization for
a number of years. RPA first reviewed the Zaldívar Deeps Sulphide Cu-Mo-Au-Ag
Project in January 2009 (Scott Wilson RPA, 2009) after Barrick completed an internal
scoping study in December 2008 (Croal and Tsafaras, 2008). A new scoping study by
Barrick is almost complete.
CMZ built a new block model for this primary sulphide mineralization as part of the 2010
mid-year update. There appears to be sufficient drill holes and technical studies
completed to demonstrate that the Zaldívar Deep Sulphide Cu-Mo-Au-Ag Project
mineralization meets the requirement for “reasonable prospects for economic extraction”.

www.rpacan.com
Barrick Gold Corporation – Zaldívar Mine, Project #1683
Technical Report NI 43-101 – March 16, 2012
Rev. 0 Page 10-1
10 DRILLING The resource model is based on 1,735 drill holes totalling 460,199 m that were drilled up
to April 12, 2011 (Table 10-1). Approximately 60% of the drilling was by reverse
circulation (RC) and the balance was diamond drill holes (DDH). Some 57 DDHs
totalling 11,470 m were drilled from an underground bulk sample drift, which is now
partly visible in the east wall.
Essentially all of the samples have total copper (TCu) grades, approximately 85% of the
samples have acid soluble copper (ASCu) grades, and 43% of the samples have
cyanide soluble copper (CNCu) grades. Approximately 21% of the samples have
molybdenum (Mo), gold (Au), and silver (Ag) grades and these are mostly present in the
primary sulphide mineralization.
Most of the resource definition drilling was completed in 1999 and 2000. Most holes
were drilled vertically. When inclined, the drilled orientations were generally north-south,
east-west, northeast-southwest, or northwest-southeast. Dip angles ranged from -40° to
-90°, except for the east-west oriented holes where dip angles ranged from 0° to -90°.
The drill holes were mostly spaced approximately 100 m apart for the feasibility study
and are now mostly spaced approximately 50 m apart. The mine plans to drill
approximately 15,000 m annually to ensure that three years of production are always
supported by approximately 50 m spaced holes.
All drill collars were surveyed by mine survey staff and located relative to the mine grid.
Drill holes were downhole surveyed using mostly a Sperry Sun instrument at an average
interval of 30 m and more recently gyroscopic downhole surveys have been done by
Wellfield Services Ltda. (WS) and Perfochile Ltda. personnel. WS has also scanned
holes for detailed structural analyses using a process called “Televisor Acustico de
Pozos” and this procedure also generates a second set of downhole survey readings
that can be used to confirm the accuracy of the gyroscopic data.

www.rpacan.com
Barrick Gold Corporation – Zaldívar Mine, Project #1683
Technical Report NI 43-101 – March 16, 2012
Rev. 0 Page 10-2
TABLE 10-1 DRILLING SUMMARY Barrick Gold Corporation – Zaldívar Mine
No. RC DDH Total
Description Year Holes (m) (m) (m) 1. Exploration Holes Utah 1981-1989 60 10,986.0 9,090.0 20,076.0 Cascada 1989 41 15,873.0
15,873.0
Outokumpu 1990-1992 308 32,814.0 42,479.0 75,293.0 Outokumpu /Placer Dome 1992 12 952.0 1,805.0 2,757.000 Placer Dome 1992-1993 80 8,910.0 5,736.0 14,646.0 Total Exploration Holes
501 69,535.0 59,110.0 128,645.0
2. Condemnation Holes Zaldívar/Escondida 1993-1993 35 4,624.0 4,624.0 Zaldívar 1995 5 1,556.0 1,556.0 Total Condemnation Holes 40 6,180.0 6,180 3.-CMZ Holes (Secondary Exploration/Production) Minera Zaldívar 1994-1998 243 37,777.0 4,463.0 42,240.0 Geotechnical Drilling 1998 9 2,224.7 2,224.7 Zaldívar Total Life Drilling 1999 151 21,690.0 6,485.7 28,175.7 Zaldívar Total Life Drilling 2000 247 41,558.0 20,045.0 61,603.0 Infill Drilling 2001 31 2,942.0 2,942.0 Infill Drilling 2003 22 2,600.0 2,600.0 Geotechnical Drilling 2003 9 1,920.0 1,920.0 Infill Drilling 2005 24 4,613.0 4,613.0 Infill Drilling 2006 24 5,756.0 5,756.0 Geotechnical Drilling 2006 15 4,595.7 4,595.7 Primary Drilling 2006 15 3,684.0 3,684.0 Primary Drilling 2006 3 1,401.7 1,401.7 Infill Drilling 2007 67 15,151.0 15,151.0 Primary Drilling 2007 2 600.0 600.0 Primary Drilling 2007 59 42,995.7 42,995.7 Geotechnical Drilling 2007 10 2,658.2 2,658.2 Geotechnical Drilling 2008 24 14,936.9 14,936.9 Hydrogeological 2008 6 3,615.0 3,615.0 Hydrogeological 2008 2 440.0 440.0 Infill Drilling 2008 70 17,172.0 17,172.0 Primary Drilling 2008 41 22,621.4 22,621.4 Primary Drilling (Metallurgical) 2008 2 612.9 612.9 Hydrogeological 2009 15 3,213.0 3,213.0 Infill Drilling 2009 37 11,000.0 11,000.0 Infill Drilling 2010 75 22,258.0 22,258.0 Hydrogeological 2010 13 2,954.0 2,954.0 Infill Drilling 2010 54 12,184.0 12,184.0 Infill Drilling 2011 13 3,530.0 3,530.0 Total
1,283 209,122.0 128,575.7 337,697.7
Grand Total (December 2011) 1,824 284,837.0 187,685.7 472,522.7

www.rpacan.com
Barrick Gold Corporation – Zaldívar Mine, Project #1683
Technical Report NI 43-101 – March 16, 2012
Rev. 0 Page 10-3
The holes have been logged properly and more recently (2007/2008) the mine has
started logging directly into hand-held computers using PC Explorer software for the RC
holes and GVMapper for the DDHs. The data captured includes lithology, type and
degree of alteration, style and mineralogy of oxide and sulphide mineralization, structural
observations, and style and frequency of fractures and veins. The blasthole chips are
also logged.
A significant amount of core was relogged to update and standardize the lithology,
alteration, and mineralization codes in the earlier drill holes. It is RPA’s opinion that the
CMZ drilling and logging procedures are of high quality and they exceed standard
industry practices. The drill hole locations are shown in Figure 10-1.

Property Boundary
Portozuelo Fault
Block Model Limit
Block Model Limit
Drill Holes
23,000 N
95,0
00 E
21,000 N
22,000 N
92,0
00 E
94,0
00 E
93,0
00 E
95,0
00 E
92,0
00 E
94,0
00 E
93,0
00 E
23,000 N
21,000 N
22,000 N
0 200 1000
Metres
400 600 800
N
March 2012
Zaldívar Mine
Drill Plan
Barrick Gold Corporation
Region II, Northern Chile
Figure 10-1
10-4
www.rpacan.com

www.rpacan.com
Barrick Gold Corporation – Zaldívar Mine, Project #1683
Technical Report NI 43-101 – March 16, 2012
Rev. 0 Page 11-1
11 SAMPLE PREPARATION, ANALYSES AND SECURITY SAMPLING METHOD AND APPROACH Core is sampled on one and two metre intervals and RC material is sampled on two
metre intervals. Core samples are split, with half being submitted for analyses and the
remaining half preserved and stored at a secure facility on site. Holes are commonly
sampled in their entirety. The samples are tagged and transported by the geological
staff to the respective assay laboratory.
The blasthole samples are taken with a 10 cm diameter by 0.7 m long tube from six
locations from the piles around each hole. The blasthole samples are approximately 20
kg to 25 kg. The drills have skirts to help prevent loss of fines during strong winds.
RPA is of the opinion that the core, RC, and blasthole sampling procedures at Zaldívar
are reasonable.
SAMPLE PREPARATION, ANALYSES AND SECURITY In the early phases of drilling (prior to pre-production), outside assay laboratories such
as Geoanalitica Ltda. (Geoanalitica), CIMM, and CESMEC were routinely used. Since
the commissioning of the mine site assay laboratory in 1994, all drill samples have been
prepared on site. CMZ has a large, well-organized, clean, ISO 17025 certified mine
laboratory.
In 1996 and 2000, Francis Pitard developed sampling and preparation procedures for
RC and blasthole samples. At least 20 kg of material is dried, crushed to 100% passing
10 mesh, passed through a rotary splitter, and approximately 250 g is pulverized to 90%
passing 170 mesh. All samples are weighed and the weights are monitored by the
geology department. Regular sieve tests are carried out and the CMZ mine lab pulps
regularly achieve better than 95% passing 170 mesh.
CMZ has provided Geoanalitica with the CMZ analytical protocols for sequential copper
analyses. The samples are analyzed for total copper (TCu), acid soluble copper (ASCu),

www.rpacan.com
Barrick Gold Corporation – Zaldívar Mine, Project #1683
Technical Report NI 43-101 – March 16, 2012
Rev. 0 Page 11-2
and cyanide soluble copper (CNCu) at the Geoanalitica laboratory in Coquimbo, Chile.
The detection limit is 0.01% for TCu, ASCu, and CNCu.
The drill core, field duplicates, and reject material is stored for one year at a very well
organized and secure location on site. The 250 g pulps are placed in small plastic
screw-top containers and stored forever in 45 gal drums.
RPA is of the opinion that the sample preparation, analytical protocols, and security
measures are very good and exceed industry standard practice.
QUALITY ASSURANCE AND QUALITY CONTROL CMZ has very good quality control (QC) and quality assurance (QA) procedures that
include the regular insertion of in-house standards, blanks, field duplicates, reject
duplicates, and pulp replicates. In addition, pulps are sent to external laboratories on a
regular basis.
Geoanalitica is the primary laboratory for the DDH and RC samples and the CMZ
laboratory is the primary laboratory for the blasthole samples. The CMZ laboratory is the
secondary laboratory for the external DDH and RC pulp replicates and Geoanalitica is
the secondary laboratory for the external blasthole pulp replicates. In March 2007, CMZ
implemented the Barrick QA/QC procedures and they are well documented in Morales
(2009).
The approximate insertion rates for blasthole, RC, and DDH samples are essentially the
same and are summarized in Table 11-1.
TABLE 11-1 QC INSERTION RATES Barrick Gold Corporation – Zaldívar Mine
Description Approximate Insertion Rate
Standards 5% Blanks 2% Pulp Replicates 2% Reject duplicates 2% Field Duplicates 2% Sieve Tests 5% External pulp replicates (more blanks and standards sent as well)
5%

www.rpacan.com
Barrick Gold Corporation – Zaldívar Mine, Project #1683
Technical Report NI 43-101 – March 16, 2012
Rev. 0 Page 11-3
The actual insertion rates vary slightly by year and sample type. For example, the 2010
exploration drilling program insertion rates for standards (8%), blanks (4%), and external
checks (6%) exceeded those in Table 11-1.
Barrick personnel use a number of control charts and graphs to closely monitor the
QA/QC results and re-analyses are periodically requested. The insertion rates and
results are well-documented and reveal no significant biases or precision problems.
RPA is of the opinion that the QA/QC procedures are very good and exceed standard
industry practice. Reduction in the QC insertion rates, particularly for the blasthole
samples, might be warranted.
www.rpacan.com
Barrick Gold Corporation – Zaldívar Mine, Project #1683
Technical Report NI 43-101 – March 16, 2012
Rev. 0 Page 12-1
12 DATA VERIFICATION The blasthole and exploration drill hole data have been stored in acQuire™ databases
since 2000 and 2005, respectively. Most interaction with the database is through the
acQuire™ front-end “Geoscientific Information Management System” (GIMS), which
facilitates data entry and export, validation, QA/QC, and reporting. A geological
database administrator based at the mine site is responsible for maintaining the data
integrity and structure and ensuring back-ups and stored procedures are run correctly.
The Zaldívar exploration database is regularly validated by mine staff using validation
routines in acQuire™ and other mining software. Mine personnel also visually check the
drill hole data on-screen on a regular basis. Zaldívar has a well-established routine of
extensively checking and validating data through all stages of data collection and data
import.
CMZ has formal signed data verification reports supporting data verification work
completed on exploration drill hole data generated from 2007 to 2011 (Solis, 2011,
Monroy, 2008 to 2010, Perez, 2008, and Morales, 2008). In general, approximately 10%
of the assays, 100% of the collar coordinates, and 10% of the downhole survey data are
checked annually and prior to each resource model update.
The amount of actual historical database verification work that was completed prior to
2007 is not well documented. In 2004 and 2006, PDI carried out Level 2 audits and
identified no problems with the exploration drill hole database (Placer 2004 and 2006).
In 2004, AMEC reviewed the data verification process and results and concluded that
the assay and survey data was sufficiently free of error to be adequate for resource
estimation (AMEC, 2004).
The ultimate validation of the reliability of the exploration drill hole database is provided
by the very good reconciliation between the resource model and production.
RPA used a number of data validation queries in Access and Vulcan and did some
visual checks and found essentially no database validation problems, which is
remarkable considering the database size. RPA is of the opinion that the drill hole
database is valid and acceptable for resource estimation.
www.rpacan.com
Barrick Gold Corporation – Zaldívar Mine, Project #1683
Technical Report NI 43-101 – March 16, 2012
Rev. 0 Page 13-1
13 MINERAL PROCESSING AND METALLURGICAL TESTING METALLURGICAL TESTING Actual process copper recoveries are determined based on head grade samples to the
crushed ore leaching process against tailings grade values for the spent ore determined
from drill sampling of the ore prior to rehandling to the dump and reconciled with copper
recovered to leach solutions and ultimately to cathode production. Leach solutions and
volumes are sampled on a continuous basis from the various sources of pregnant
solution (dynamic pad, ROM pad, and permanent secondary leach pad).
Metallurgical testing by CMZ and the University of Utah has demonstrated that the
highest grade minerals have lower recoveries. With total copper above 1.3%, copper
recovery drops by approximately 8% to 16%. This is due to the higher grade ores
having a larger percentage of encapsulated copper. Recovery is discussed further in
Section 17.

www.rpacan.com
Barrick Gold Corporation – Zaldívar Mine, Project #1683
Technical Report NI 43-101 – March 16, 2012
Rev. 0 Page 14-1
14 MINERAL RESOURCE ESTIMATE SUMMARY Table 14-1 summarizes open pit Mineral Resources exclusive of Mineral Reserves as of
December 31, 2011, based on a $3.25/lb copper price. The 2011 year-end Measured
and Indicated Mineral Resources total 124.8 million tonnes averaging 0.445% TCu and
contain 1.22 billion pounds of copper. In addition, the 2011 year-end Inferred Mineral
Resources total 37 million tonnes averaging 0.54% TCu and contain 0.44 billion pounds
of copper. The resource model was prepared by Barrick Senior Resource Geologist
Cristian Monroy under the supervision of Barrick Superintendent of Resource and
Reserve Modelling Benjamin Sanfurgo.
TABLE 14-1 MINERAL RESOURCES – DECEMBER 31, 2011 Barrick Gold Corporation – Zaldívar Mine
Category Tonnage
(Mt) Grade (% Cu)
Contained Metal (Mlb Cu)
Measured 71.3 0.432 679.5 Indicated 53.5 0.462 545.5 Total Measured and Indicated 124.8 0.445 1,225.0 Inferred 37 0.54 439
Notes:
1. CIM definitions were followed for Mineral Resources. 2. Mineral Resources are estimated based on a profit model using a copper price of US$3.25 per
pound and a CLP/USD exchange rate of 500. 3. Mineral Resources are exclusive of Mineral Reserves. 4. Numbers may not add due to rounding.
RPA reviewed the resource assumptions, input parameters, geological interpretation,
and block modelling procedures and is of the opinion that the Mineral Resource estimate
is appropriate for the style of mineralization and that the resource model is reasonable
and acceptable to support the 2011 year end Mineral Resource and Mineral Reserve
(MRMR) estimates.
RPA is not aware of any environmental, permitting, legal, title, taxation, socio-economic,
marketing, political, or other issues that could materially affect the MRMR estimates.

www.rpacan.com
Barrick Gold Corporation – Zaldívar Mine, Project #1683
Technical Report NI 43-101 – March 16, 2012
Rev. 0 Page 14-2
GEOLOGICAL MODELS The CMZ geology department has developed a very good understanding of the Zaldívar
geology. Geological models were constructed to provide geologic control for grade
estimation and to provide parameters for mine planning. Geology models for lithology,
alteration, and mineralization were built using Leapfrog™ software. The main faults
have also been modelled. Interpretations were made by mine geology personnel on 25
m and 50 m cross sections looking 045°. Lines and control points based on the
exploration drill holes, blastholes, and pit mapping were used in Leapfrog to create 3D
geological wireframes. The geological wireframes were reviewed by mine personnel and
minor revisions were made locally.
Wireframes were built for the main lithology, alteration, and mineralization zones listed
below and they were used to assign codes to the block model.
Lithology Codes 1 = Andesite (AND) 2 = Hydrothermal Breccia (BXX) 3 = Late Llamo Porphyry (LPT) 4 = Llamo Porphyry (LPY) 5 = Zaldívar Porphyry (ZPY) 6 = Magmatic Breccia (BXP) 7 = Granite (GGB) 8 = Gravel (SCG) 9 = Deep Andesite (ANDP)
Alteration Codes
1 = Argillic (ARG) 2 = Biotitic (BIO) 3 = Chloritic (CLO) 4 = Potassic (POT) 5 = Quartz-Sericite (QSE) 6 = Sericitic (SER) 7 = Silicic (SIL) 8 = Gravel (SCG)
Mineralization Codes
1 = Oxide (OX) 2 = Leached (LIX) 3 = Secondary Sulphide (SEE) 4 = Secondary-Primary Mixed Sulphide (MSP) 5 = Primary Sulphide (PRI) 8 = Gravel (SGG)
www.rpacan.com
Barrick Gold Corporation – Zaldívar Mine, Project #1683
Technical Report NI 43-101 – March 16, 2012
Rev. 0 Page 14-3
The lithology, alteration, and mineralization models are shown in Figures 14-1 to 14-3,
respectively.
The mineralization interpretation is based on a number of ASCu/TCu and
(ASCu+CNCu)/TCu thresholds such as:
Leached: TCu <0.25% and ASCu/TCu > 0.35
Oxide: TCu >0.25% and ASCu/TCu > 0.35
Sulphide: ASCu/TCu < 0.35
Secondary Sulphide: (ASCu+CNCu)/TCu > 0.5
Mixed Sulphide: (ASCu+CNCu)/TCu > 0.5 and <0.35
Primary Sulphide: (ASCu+CNCu)/TCu <0.35

LATE LLAMO PORPHYRY
HYDROTHERMAL BRECCIA
ANDESITE
ZALDIVAR PORPHYRY
MAGMATIC BRECCIA
LLAMO PORPHYRY
GRANITE
GRAVEL
DEEP ANDESITE
Source: Barrick Gold Corp., 2010.March 2012
Zaldívar Mine
Lithology Zones
Barrick Gold Corporation
Region II, Northern Chile
Figure 14-1
14-4
www.rpacan.com

SILICIC
SERICITIC
QUARTZ-SERICITE
BIOTITICCHLORITIC
ARGILLIC
POTASSIC
Source: Barrick Gold Corp., 2010.March 2012
Zaldívar Mine
Alteration Zones
Barrick Gold Corporation
Region II, Northern Chile
Figure 14-2
14-5
www.rpacan.com

SECONDARY SULPHIDE SECONDARY-PRIMARY MIXED SULPHIDE
PRIMARY SULPHIDE
LEACHED OXIDE
Source: Barrick Gold Corp., 2010.March 2012
Zaldívar Mine
Mineralization Zones
Barrick Gold Corporation
Region II, Northern Chile
Figure 14-3
14-6
www.rpacan.com

www.rpacan.com
Barrick Gold Corporation – Zaldívar Mine, Project #1683
Technical Report NI 43-101 – March 16, 2012
Rev. 0 Page 14-7
GEOLOGICAL DOMAINS CMZ has defined 13 geological estimation domains (UGE). The alteration has been
grouped into the more intense central alteration (QSE+POT) and weaker peripheral
alteration (Arg-Bio-Clo-Si).
UGE1 and UGE2 represent barren gravel and barren post-mineralization late Llamo
porphyry intrusions, respectively. UGE3 and UGE4 are the oxide mineralization split up
by alteration intensity. Leached Domains UGE5 and UGE6 are subeconomic domains
that were interpolated separately because the leached zone around the Zaldívar
porphyry to the east averages only 0.06% TCu compared to the rocks to the west, which
average 0.15% TCu. UGE7 to UGE9 are related to the secondary sulphide
mineralization. UGE10 represents the mixed sulphide mineralization and UGE11 to
UGE13 are used for the primary sulphide model. UGE2, UGE12, and UGE13 are
volumetrically insignificant.
The estimation domains are summarized in Table 14-2. RPA has reviewed the
geological reasoning and descriptive statistics for each UGE and is of the opinion that
these geological domains are reasonable and acceptable.
TABLE 14-2 GEOLOGICAL ESTIMATION UGE CODES AND DESCRIPTIONS
Barrick Gold Corporation – Zaldívar Mine
UGE Type Description
1 Gravel SCG 2 Late Llamo Porphyry LPT 3 Oxide (BIO + POT + SER)(AND-BXX-LPY ) + AND(ARG) + BXP 4 Oxide (QSE + SIL + CLO)(AND-BXX-LPY-ZPY) + ARG(BXX-LPY-ZPY) 5 Leached AND + LPY + BXX + BXP 6 Leached ZPY 7 Secondary Sulphide (QSE + ARG)(BXX-LPY-ZPY) + SIL(BXX-LPY)
+ LPY(CLO-POT) + BXX(BIO-CLO-POT)
8 Secondary Sulphide AND(QSE-SIL-CLO) + BXX(SER) + ZPY(CLO-POT-SIL) 9 Secondary Sulphide BIO(AND-LPY-ZPY-BXP) + POT(AND-ZPY-BXP) + (ARG-SER) 10 Mixed Sulphide MSP 11 Primary Sulphide AND + ZPY + LPY + GGB + BXX 12 Primary Sulphide BXP 13 Primary Sulphide ANDP

www.rpacan.com
Barrick Gold Corporation – Zaldívar Mine, Project #1683
Technical Report NI 43-101 – March 16, 2012
Rev. 0 Page 14-8
DENSITY DATA CMZ has compiled the density data by the main lithological units (Table 14-3). Most of
the density tests are done on core samples using a paraffin immersion density approach.
The results for over 2,000 density tests are available. CMZ has also estimated a
separate set of tonnage factors for the primary sulphide rock types. RPA is of the
opinion that the tonnage factors are reasonable and acceptable.
TABLE 14-3 TONNAGE FACTORS Barrick Gold Corporation – Zaldívar Mine
Rock Type Main Model
(t/m³) Gravel Overburden (SCG) 2.101 Argillite (ARG) 2.451 Andesite (AND) 2.562 Breccias (BXX) 2.520 Llamo Porphyry (LPY) 2.490 Zaldívar Porphyry (ZPY) 2.523
CUT-OFF GRADES Due to the complex processing strategy in use at Zaldívar where operating costs vary by
process stream as well as ore types, multiple cut-off grade values are used. Separate
resource and reserve cut-off grades, based on the resource and reserve copper prices,
are used to report the resources and reserves. The cut-off grade is based on process
cost, ore type, and recovery. All blocks that fail to meet the cut-off grade are classified
as waste.
CAPPING OF HIGH GRADE VALUES CMZ capped high TCu, ASCu, and CNCu assays prior to compositing based on
examining log probability plots of the assays for the main types of mineralization, and
inside the primary sulphide for each type of lithology. In general, the TCu assays are
relatively insensitive to capping and the ASCu assays are moderately sensitive to
capping. The decrease in metal due to capping is generally less than a few percent
(Tables 14-4 and 14-5).

www.rpacan.com
Barrick Gold Corporation – Zaldívar Mine, Project #1683
Technical Report NI 43-101 – March 16, 2012
Rev. 0 Page 14-9
TABLE 14-4 TCU CAPPING LEVELS Barrick Gold Corporation – Zaldívar Mine
From Monroy, 2011
TABLE 14-5 ASCU CAPPING LEVELS Barrick Gold Corporation – Zaldívar Mine
From Monroy, 2011
CMZ also applied restricted search radii of 30 m to 45 m to passes 2 to 4 for oxide
(UGE3 and 4) and secondary sulphide (UGE7 and 8) composites with grades above 3%
TCu. In addition, a restricted search with 30 m radii was applied to passes 1 to 4 for the
composites with ASCu grades above 1.5% in UGE3 and 3.0% in UGE4.
RPA concurs with the capping levels and restricted search conditions selected by CMZ.
The production reconciliation results confirm that they are reasonable.
COMPOSITES Drill hole sample data were composited into five metre lengths starting at the drill hole
collars. Remnant composites shorter than three metres were discarded. Figure 14-4
shows the frequency distribution of the total copper grades in the five metre composites
versus the raw sample data.

www.rpacan.com
Barrick Gold Corporation – Zaldívar Mine, Project #1683
Technical Report NI 43-101 – March 16, 2012
Rev. 0 Page 14-10
FIGURE 14-4 FREQUENCY DISTRIBUTION OF TCU COMPOSITES VERSUS RAW SAMPLE DATA
From Monroy, 2011
The composites with at least three metre lengths, which represent 99.5% of the whole
sample data, were used for the estimate. A small number of composites with lengths
less than three metres that were excluded are remnants located at mineralization
contacts and hole bottoms.
The composite statistics for each UGE are summarized in Table 14-6 and shown as
boxplots in Figure 14-5. The relative abundance of composites in each domain is also
summarized in Table 14-6. For example, 22% of the composites occur in oxide
mineralization (UGE3 and UGE4) and 16.7% of the composites are in secondary
sulphide mineralization (UGE7 to 9).

www.rpacan.com
Barrick Gold Corporation – Zaldívar Mine, Project #1683
Technical Report NI 43-101 – March 16, 2012
Rev. 0 Page 14-11
TABLE 14-6 TCU COMPOSITE STATISTICS BY GEOLOGICAL DOMAIN (UGE) Barrick Gold Corporation – Zaldívar Mine
Total Copper Grade (%)
Domain Code Metres %
Metres Mean Std Dev Min 1Q Median 3Q Max CV All zones 435,414
0.412 0.662 0.003 0.110 0.244 0.442 19.350 1.61
UGE1 1 24,630 5.7% 0.070 0.140 0.003 0.020 0.030 0.068 4.861 2.00 UGE2 2 907 0.2% 0.093 0.158 0.005 0.010 0.024 0.092 1.034 1.70 UGE3 3 34,638 8.0% 0.520 0.493 0.016 0.278 0.387 0.594 13.706 0.95 UGE4 4 60,974 14.0% 0.731 0.881 0.010 0.280 0.464 0.838 12.308 1.21 UGE5 5 70,237 16.1% 0.195 0.211 0.005 0.074 0.163 0.250 5.826 1.08 UGE6 6 32,530 7.5% 0.067 0.176 0.005 0.016 0.028 0.054 3.728 2.60 UGE7 7 34,244 7.9% 1.248 1.335 0.006 0.428 0.898 1.565 18.702 1.07 UGE8 8 29,435 6.8% 0.601 0.736 0.005 0.252 0.425 0.714 19.350 1.23 UGE9 9 8,712 2.0% 0.423 0.345 0.022 0.254 0.336 0.465 6.216 0.82 UGE10 10 19,950 4.6% 0.362 0.268 0.016 0.210 0.298 0.426 3.372 0.74 UGE11 11 113,030 26.0% 0.239 0.205 0.004 0.126 0.206 0.306 13.986 0.86 UGE12 12 992 0.2% 0.529 0.485 0.082 0.256 0.424 0.622 3.712 0.92 UGE13 13 624 0.1% 0.105 0.084 0.006 0.046 0.074 0.142 0.442 0.80
From Monroy, 2011
FIGURE 14-5 BOXPLOT OF TCU COMPOSITES FOR EACH UGE
From Monroy, 2011

www.rpacan.com
Barrick Gold Corporation – Zaldívar Mine, Project #1683
Technical Report NI 43-101 – March 16, 2012
Rev. 0 Page 14-12
CONTACT PLOT ANALYSIS Contact plots were generated for TCu, ASCu, and CNCu values to explore the
relationship between the grade variable when moving from one geological domain (UGE)
to another. The results showed that they were mostly hard boundaries.
The contact plots are constructed with Vulcan software. Vulcan searches for data with a
given code (UGE) and then for data with another specified code (UGE) and groups the
grades according to the distance between the two points. This allows for a graphical
representation of the grade trends away from a “contact.” If average grades are
reasonably similar near a boundary and then diverge as distance from the contact
increases, then the particular boundary should probably not be used as a grade
constraint (“soft”). If the averages are distinctly different across a boundary, then the
boundary may be important in constraining the grade estimation (“hard”). Examples of
contact plots are shown in Figures 14-6 and 14-7.
Hard boundaries were used for the box and first pass searches. For all UGEs except
leached, weighted boundaries using 0.1 and 0.3 values in the composite length fields
were used to simulate semi-hard and semi-soft contacts, respectively. These semi-hard
and semi-soft boundaries were used for passes 2 to 5 and are shown in Figure 14-8.
This weighted semi-soft approach was developed by Barrick to help reduce the
estimated ASCu grades. The 0.1 and 0.3 values were selected after repeated
comparisons with production reconciliation data. RPA concurs with this innovative
approach.

UGE 5,6 UGE 3,4TCU Contact Analysis
2500
3000
0.8
0.9
1.0
1000
1500
2000
0.4
0.5
0.6
0.7
0
500
0.0
0.1
0.2
0.3
TC
UG
rades
(%)
-250 -200 -150 -100 -50 0 50 100 150 200 250
Distance (m)
Series1
Samples
UGE 5,6 UGE 3,4AsCu Contact Analysis
0.5
0.6
0.3
0.4
0.0
0.1
0.2AsC
uG
rades
(%)
2500
3000
1000
1500
2000
0
500
-250 -200 -150 -100 -50 0 50 100 150 200 250
Distance (m)
Series1
Samples
Figure 14-6: Contact Plot Analysis of TCU for Leached and Oxide Domains
March 2012
Zaldívar Mine
Contact Plot Analysis
Barrick Gold Corporation
Region II, Northern Chile
Figure 14-7: Contact Plot Analysis of AsCu for Leached and Oxide Domains
14-13
www.rpacan.com

UGE - TCU 1 2 3 4 5 6 7 8 9 101 0 0
2 0 0
3 0 0
4 0 0 0.3
5 0 0 0.1 0.1
6 0 0 0.1 0.1 0.1
7 0 0 0.1 0.1 0.1 0.1
8 0 0 0.1 0.1 0.1 0.1 0.1
9 0 0 0.1 0.1 0.1 0.1 0.1 0.3
10 0 0 0.1 0.1 0.3 0.3 0.1 0.1 0.3
11 0 0 0.1 0.1 0.3 0.3 0.1 0.1 0.1 0.1
12 0 0 0.1 0.1 0.3 0.3 0.1 0.1 0.1 0.1
13 0 0 0.1 0.1 0.3 0.3 0.1 0.1 0.1 0.1
UGE - ASCU 1 2 3 4 5 6 7 8 9 101 0 0
2 0 0
3 0 0
4 0 0 0.3
5 0 0 0.1 0.1
6 0 0 0.1 0.1 0.1
7 0 0 0.1 0.1 0.1 0.1
8 0 0 0.1 0.1 0.1 0.1 0.3
9 0 0 0.1 0.1 0.3 0.3 0.1 0.3
10 0 0 0.1 0.1 0.1 0.1 0.1 0.1 0.1
11 0 0 0.1 0.1 0.1 0.1 0.1 0.1 0.1 0.3
12 0 0 0.1 0.1 0.1 0.1 0.1 0.1 0.1 0.3
13 0 0 0.1 0.1 0.1 0.1 0.1 0.1 0.1 0.3
March 2012
Semi-Soft and Semi-HardBoundary Weights
Zaldívar Mine
Barrick Gold Corporation
Region II, Northern Chile
Figure 14-8
14-1
4
ww
w.rp
acan
.co
m

www.rpacan.com
Barrick Gold Corporation – Zaldívar Mine, Project #1683
Technical Report NI 43-101 – March 16, 2012
Rev. 0 Page 14-15
VARIOGRAPHY CMZ built a number of downhole, directional, and omni-directional correlograms using
the composites for each geological domain. Triple nested spherical models were
developed for each domain and the results are summarized in Table 14-7.
TABLE 14-7 %TCU VARIOGRAM PARAMETERS Barrick Gold Corporation – Zaldívar Mine
From Monroy, 2011
Estimation id
UGE Var.
Nugget Model Type
Sill Differential
Major Axis
Semi-Major Axis
(Minor Axis
Sill Differential
Major Axis
Semi-Major Axis
Minor Axis
Sill Differenti
al
Major Axis
Semi-Major Axis
Minor Axis
uge030 3 0.12 SPHERICAL 0.5 35 23 30 0.3 100 80 100 0.08 485 400 240uge031 3 0.12 SPHERICAL 0.5 35 23 30 0.3 100 80 100 0.08 485 400 240uge032 3 0.12 SPHERICAL 0.5 35 23 30 0.3 100 80 100 0.08 485 400 240uge033 3 0.12 SPHERICAL 0.5 35 23 30 0.3 100 80 100 0.08 485 400 240uge034 3 0.12 SPHERICAL 0.5 35 23 30 0.3 100 80 100 0.08 485 400 240uge040 4 0.22 SPHERICAL 0.31 15 10 15 0.27 55 60 90 0.2 500 400 125uge041 4 0.22 SPHERICAL 0.31 15 10 15 0.27 55 60 90 0.2 500 400 125uge042 4 0.22 SPHERICAL 0.31 15 10 15 0.27 55 60 90 0.2 500 400 125uge043 4 0.22 SPHERICAL 0.31 15 10 15 0.27 55 60 90 0.2 500 400 125uge044 4 0.22 SPHERICAL 0.31 15 10 15 0.27 55 60 90 0.2 500 400 125uge050 5 0.137 SPHERICAL 0.538 50 50 62 0.015 90 180 220 0.31 600 450 500uge051 5 0.137 SPHERICAL 0.538 50 50 62 0.015 90 180 220 0.31 600 450 500uge052 5 0.137 SPHERICAL 0.538 50 50 62 0.015 90 180 220 0.31 600 450 500uge053 5 0.137 SPHERICAL 0.538 50 50 62 0.015 90 180 220 0.31 600 450 500uge054 5 0.137 SPHERICAL 0.538 50 50 62 0.015 90 180 220 0.31 600 450 500uge060 6 0.2 SPHERICAL 0.593 35 55 55 0.135 110 160 100 0.072 1400 300 230uge061 6 0.2 SPHERICAL 0.593 35 55 55 0.135 110 160 100 0.072 1400 300 230uge062 6 0.2 SPHERICAL 0.593 35 55 55 0.135 110 160 100 0.072 1400 300 230uge063 6 0.2 SPHERICAL 0.593 35 55 55 0.135 110 160 100 0.072 1400 300 230uge064 6 0.2 SPHERICAL 0.593 35 55 55 0.135 110 160 100 0.072 1400 300 230uge070 7 0.12 SPHERICAL 0.48 20 25 35 0.4 125 135 125 0.01 600 450 276uge071 7 0.12 SPHERICAL 0.48 20 25 35 0.4 125 135 125 0.01 600 450 276uge072 7 0.12 SPHERICAL 0.48 20 25 35 0.4 125 135 125 0.01 600 450 276uge073 7 0.12 SPHERICAL 0.48 20 25 35 0.4 125 135 125 0.01 600 450 276uge074 7 0.12 SPHERICAL 0.48 20 25 35 0.4 125 135 125 0.01 600 450 276uge080 8 0.15 SPHERICAL 0.4 31 50 35 0.33 80 90 55 0.12 620 250 80uge081 8 0.15 SPHERICAL 0.4 31 50 35 0.33 80 90 55 0.12 620 250 80uge082 8 0.15 SPHERICAL 0.4 31 50 35 0.33 80 90 55 0.12 620 250 80uge083 8 0.15 SPHERICAL 0.4 31 50 35 0.33 80 90 55 0.12 620 250 80uge084 8 0.15 SPHERICAL 0.4 31 50 35 0.33 80 90 55 0.12 620 250 80uge090 9 0.16 SPHERICAL 0.15 40 120 40 0.6 130 250 100 0.09 180 400 120uge091 9 0.16 SPHERICAL 0.15 40 120 40 0.6 130 250 100 0.09 180 400 120uge092 9 0.16 SPHERICAL 0.15 40 120 40 0.6 130 250 100 0.09 180 400 120uge093 9 0.16 SPHERICAL 0.15 40 120 40 0.6 130 250 100 0.09 180 400 120uge094 9 0.16 SPHERICAL 0.15 40 120 40 0.6 130 250 100 0.09 180 400 120uge100 10 0.138 SPHERICAL 0.35 32 25 40 0.348 70 75 110 0.164 180 160 350uge101 10 0.138 SPHERICAL 0.35 32 25 40 0.348 70 75 110 0.164 180 160 350uge102 10 0.138 SPHERICAL 0.35 32 25 40 0.348 70 75 110 0.164 180 160 350uge103 10 0.138 SPHERICAL 0.35 32 25 40 0.348 70 75 110 0.164 180 160 350uge104 10 0.138 SPHERICAL 0.35 32 25 40 0.348 70 75 110 0.164 180 160 350
Structure 1 Structure 2 Structure 3

www.rpacan.com
Barrick Gold Corporation – Zaldívar Mine, Project #1683
Technical Report NI 43-101 – March 16, 2012
Rev. 0 Page 14-16
The variography results were discussed with the CMZ geology personnel while at the
site. The nugget effect was determined from downhole variograms. It was
approximately 12% to 22% for the oxide domains (UGE3 and 4) and 12% to 16% for the
secondary sulphide domains (UGE7 to 9).
The directional variograms gave the ranges of continuity of the grades. The ranges are
very long due to a slow rise from approximately 90% to 100% of the sill. Some
examples of the modelled correlograms for the oxide and secondary sulphide
composites are provided in Figures 14-9 and 14-10. RPA’s opinion is that the CMZ
geostatistical analysis is reasonable and acceptable.
FIGURE 14-9 TCU CORRELOGRAM MODELS FOR UGE 3
From Monroy, 2011

www.rpacan.com
Barrick Gold Corporation – Zaldívar Mine, Project #1683
Technical Report NI 43-101 – March 16, 2012
Rev. 0 Page 14-17
FIGURE 14-10 TCU CORRELOGRAM MODELS FOR UGE 7
From Monroy, 2011
RESOURCE ESTIMATION METHODOLOGY The step by step resource estimation methodology is well described in Monroy (2011).
The Vulcan C shell file (zald0511-1.csh) provides an excellent record of all the steps
done in Vulcan to build the resource block model.
The Zaldívar mineral resource model extends from 91,030 m to 95,050 m East, 21,050
m to 23,500 m North, and 2,750 m to 3,710 m in elevation. The 5 m high by 15 m by 15
m block model is populated with the lithology, alteration, and mineralization codes and a
separate script is run to assign the geological domain codes.
The capped assays were composited into five metre lengths. Remnant composites
shorter than three metres were discarded. Composites for TCu, ASCu, and CNCu were
created. The composite lithology, alteration, mineralization, and geological domain
codes are back-flagged from the block model.
CMZ used multiple pass ordinary kriging (OK) to interpolate TCu and ASCu grades for
all domains except UGE 1 and 2. The OK parameters were developed from directional

www.rpacan.com
Barrick Gold Corporation – Zaldívar Mine, Project #1683
Technical Report NI 43-101 – March 16, 2012
Rev. 0 Page 14-18
variograms for each UGE. The search ellipsoids are generally sub-horizontal pancakes
oriented at 040° to 050° with a small plunge (0° to 7°) to the northeast. The search radii
vary for each UGE. The longest radii are 500 m by 500 m by 400 m for UGE5 (leached)
and the shortest pass radii are 40 m by 30 m by 35 m for UGE3 (oxide). UGE1 and 2
are barren domains and the blocks are directly assigned zero grades.
There are typically five OK passes used for each domain in addition to the general box
pass, which is always run first and is based on 7.5 m by 7.5 m by 2.5 m radii and a
minimum of one sample and a maximum of three samples from a drill hole.
The first passes use a minimum of four composites and a maximum of eighteen
composites, with a maximum of three composites per hole. The first pass radii are the
distance defined by 80% of the omni-directional sill. The second and third passes use a
minimum of four composites and a maximum of eighteen composites with a maximum of
three composites per hole. They also use an octant based search with a minimum of two
samples per octant and a maximum of three samples per octant, and a minimum of two
octants with samples. The second pass radii are the distance defined by 90% of the
omni-directional sill. The third pass radii are longer than the second pass radii. The
fourth and fifth passes are the same as the second and third passes except that the
minimum number of composites is reduced to two so that only one hole is needed. The
multi-pass interpolation parameters are summarized in Table14-8.

www.rpacan.com
Barrick Gold Corporation – Zaldívar Mine, Project #1683
Technical Report NI 43-101 – March 16, 2012
Rev. 0 Page 14-19
TABLE 14-8 %TCU ESTIMATION SEARCH ELLIPSE PARAMETERS Barrick Gold Corporation – Zaldívar Mine
The five metre high blocks were introduced in 2007 to better preserve the mineralization
interpretation contacts. The 5 m high blocks are reblocked into the final resource model,
which has 15 m high blocks. The reblocked grades are assigned based on volume
weighting the original block grades and the geology and other codes are assigned based
on majority rules. Over time and by using production reconciliation data, CMZ has
developed a sophisticated multi-pass interpolation process that works well. RPA is of
Estimation id UGE Estimation TypeBearing
(Z)Plunge
(Y)Dip(X)
Major Axis Semi-Major Axis Minor AxisMin
Samples per Est
Max Samples per Est
Use Octant Based Search
Max Samples
per Octant
Min Octants
With Samples
Min Samples
per Octant
MaximunSample perDrill Hole
box ID 2 0 0 0 7.5 7.5 2.5 1 99 3uge011 1 ID 2 50 0 0 65 65 40 2 3 1uge012 1 ID 2 50 0 0 130 130 65 2 3 1uge013 1 ID 2 50 0 0 520 520 65 2 3 1uge030 3 OK 40 7 0 40 30 35 4 18 3uge031 3 OK 40 7 0 70 55 65 4 18 1 3 2 2 3uge032 3 OK 40 7 0 180 120 120 4 18 1 3 2 2 3uge033 3 OK 40 7 0 70 55 65 2 18 3uge034 3 OK 40 7 0 180 120 120 2 18 3uge040 4 OK 50 7 0 40 40 40 4 18 3uge041 4 OK 50 7 0 100 80 60 4 18 1 3 2 2 3uge042 4 OK 50 7 0 400 320 120 4 18 1 3 2 2 3uge043 4 OK 50 7 0 100 80 60 2 18 3uge044 4 OK 50 7 0 400 320 120 2 18 3uge050 5 OK 50 7 0 150 110 120 4 18 3uge051 5 OK 50 7 0 290 220 250 4 18 1 3 2 2 3uge052 5 OK 50 7 0 500 400 400 4 18 1 3 2 2 3uge053 5 OK 50 7 0 290 220 250 2 18 3uge054 5 OK 50 7 0 500 400 400 2 18 3uge060 6 OK 50 7 0 30 40 40 4 18 3uge061 6 OK 50 7 0 65 80 65 4 18 1 3 2 2 3uge062 6 OK 50 7 0 500 250 230 4 18 1 3 2 2 3uge063 6 OK 50 7 0 65 80 65 2 18 3uge064 6 OK 50 7 0 500 250 230 2 18 3uge070 7 OK 40 7 0 40 45 45 4 18 3uge071 7 OK 40 7 0 75 80 75 4 18 1 3 2 2 3uge072 7 OK 40 7 0 120 140 120 4 18 1 3 2 2 3uge073 7 OK 40 7 0 75 80 75 2 18 3uge074 7 OK 40 7 0 120 140 120 2 18 3uge080 8 OK 40 7 0 40 45 25 4 18 1 3 2 2 3uge081 8 OK 40 7 0 90 75 35 4 18 1 3 2 2 3uge082 8 OK 40 7 0 300 230 80 4 18 3uge083 8 OK 40 7 0 90 75 35 2 18 3uge084 8 OK 40 7 0 300 230 80 2 18 3uge090 9 OK 40 7 0 70 130 55 4 18 3uge091 9 OK 40 7 0 90 180 70 4 18 1 3 2 2 3uge092 9 OK 40 7 0 150 300 100 4 18 1 3 2 2 3uge093 9 OK 40 7 0 90 180 70 2 18 3uge094 9 OK 40 7 0 150 300 100 2 18 3uge100 10 OK 40 7 0 40 40 65 4 18 3uge101 10 OK 40 7 0 60 60 100 4 18 1 3 2 2 3uge102 10 OK 40 7 0 180 160 300 4 18 1 3 2 2 3uge103 10 OK 40 7 0 60 60 100 2 18 3uge104 10 OK 40 7 0 180 160 300 2 18 3

www.rpacan.com
Barrick Gold Corporation – Zaldívar Mine, Project #1683
Technical Report NI 43-101 – March 16, 2012
Rev. 0 Page 14-20
the opinion that the CMZ resource estimation methodology is reasonable and
acceptable.
RESOURCE ESTIMATE VALIDATION CMZ has validated the resource block model using six separate validation procedures.
The results are provided in Monroy (2011) and the reconciliation and swath plot results
are included below.
1. Visual inspection of block and composite values on sections and plans
2. Reconciliation with the ore control model
3. Tonnage-grade curve comparisons with blasthole data
4. Ordinary kriging versus nearest neighbor (NN) swath plots
5. Comparison between 2010 and 2011 estimates
CMZ and RPA visually compared the composite and block grades on plans and sections
and found that they correlate very well spatially (Figure 14-11).
FIGURE 14-11 TCu BLOCKS AND ASSAYS - SECTION 22,000N
The official reconciliation data for 2011 indicates that the resource model underestimates
the tonnage by 5%, estimates essentially the same total copper and acid soluble grades,
and underestimates the contained copper by 5% compared to the ore control model
(Table 14-9)

www.rpacan.com
Barrick Gold Corporation – Zaldívar Mine, Project #1683
Technical Report NI 43-101 – March 16, 2012
Rev. 0 Page 14-21
TABLE 14-9 2011 RECONCILIATION RESULTS Barrick Gold Corporation – Zaldívar Mine
Month Grade Control 2011 Resource Model
Tonnes TCu (%)
K-TCu (Lbs)
ASCu (%)
K-ASCu (Lbs)
Tonnes TCu (%)
K-TCu (Lbs)
ASCu (%)
K-ASCu (Lb)
Jan 2,407,557 0.645 34,235 0.320 16,985 2,380,630 0.617 32,367 0.308 16,178
Feb 2,840,299 0.557 34,902 0.268 16,792 2,522,104 0.559 31,088 0.289 16,092
Mar 3,177,559 0.522 36,572 0.256 17,954 2,835,984 0.567 35,471 0.294 18,364
Apr 3,185,183 0.520 36,528 0.268 18,830 2,764,089 0.532 32,427 0.258 15,720
May 2,953,598 0.450 29,286 0.292 18,997 2,320,660 0.515 26,348 0.363 18,572
Jun 2,251,120 0.415 20,591 0.252 12,506 1,906,706 0.473 19,883 0.289 12,148
Jul 2,057,023 0.548 24,848 0.378 17,122 2,152,624 0.504 23,906 0.342 16,234
Aug 1,901,062 0.525 22,011 0.354 14,816 2,313,399 0.493 25,130 0.339 17,280
Sep 2,947,332 0.575 37,345 0.395 25,674 3,412,730 0.475 35,743 0.311 23,436
Total 23,720,733 0.528 276,317 0.305 159,677 22,608,926 0.526 262,364 0.309 154,023
The NN and OK swath plots are very similar (Figure 14-12).
FIGURE 14-12 SWATH PLOTS
From Monroy, 2011
RESOURCE CLASSIFICATION The classification criteria are based on distances from composites to block centroids and
the number of holes. The distances have been customized for each geological domain
based on omni-directional correlogram ranges at 80% and 90% of the sills. The

www.rpacan.com
Barrick Gold Corporation – Zaldívar Mine, Project #1683
Technical Report NI 43-101 – March 16, 2012
Rev. 0 Page 14-22
classification system is complex and could be simplified in the future. Figure 14-13
shows the omni-directional correlogram.
Measured Mineral Resources:
• Supported by composites from one hole during the 7.5 m by 7.5 m box search pass done first to all geological domains.
• Supported by composites from two holes situated within 45 m of a block centroid during the first pass with search radii set at 80% of the omni-directional sill for each geological domain.
• Supported by composites from two holes situated within 20 m of a block
centroid during the second and third passes.
Indicated Mineral Resources:
• Supported by composites from two holes situated within 45 m for UGE 3, 6, 7, 8, and 10, and 50 m for UGE 4, 5, and 9, of a block centroid.
• Supported by composites from two holes situated within distances greater than 45 m and less than the search radii used during the first pass for UGE 5, 9, and 10.
Inferred Mineral Resources:
• Supported by composites from two holes situated within the distance defined by 90% of the omni-directional sill for each geological domain (75 m for UGE 3, 6, 7, 8, and 10, and 120 m for UGE 4, 5, and 9).
• Supported by composites from one hole situated within the distance defined by 80% of the omni-directional sill for each geological domain (45 m or 50 m depending on domain).

www.rpacan.com
Barrick Gold Corporation – Zaldívar Mine, Project #1683
Technical Report NI 43-101 – March 16, 2012
Rev. 0 Page 14-23
FIGURE 14-13 TCU CORRELOGRAM FOR UGE 7
CMZ also developed a classification clean-up script that helps convert the category of
isolated blocks to that of the surrounding blocks. The script represents another
innovative approach. In RPA’s opinion, the classification results are reasonable and
acceptable.

www.rpacan.com
Barrick Gold Corporation – Zaldívar Mine, Project #1683
Technical Report NI 43-101 – March 16, 2012
Rev. 0 Page 15-1
15 MINERAL RESERVE ESTIMATE The resource estimates discussed in Section 14 were prepared using standard industry
methods and appear to provide an acceptable representation of the deposit. RPA
reviewed the reported resources, production schedules, and cash flow analysis to
determine if the resources meet the CIM Definition Standards for Mineral Resources and
Mineral Reserves, to be classified as reserves. Based on this review, it is RPA’s
assessment that the Measured and Indicated Mineral Resource within the final pit design
at Zaldívar can be classified as Proven and Probable Mineral Reserves.
The open pit reserves are estimated to be 578 million tonnes at 0.518% Cu, containing
6,602 million pounds of copper and are classified as Proven and Probable Reserves as
presented in Table 15-1.
TABLE 15-1 MINERAL RESERVES – DECEMBER 31, 2011 Barrick Gold Corporation – Zaldívar Mine
Category Process Tonnage
(Mt) Cu (%)
Contained Metal
(Mlb Cu).
Proven Heap Leach 245.0 0.616 3,328.0 Dump Leach 75.4 0.263 436.8
Stockpile 65.8 0.504 731.6
Proven Subtotal 386.3 0.528 4,496.5 Probable Heap Leach 151.6 0.558 1,865.1 Dump Leach 40.1 0.272 240.4 Probable Subtotal 191.7 0.498 2,105.5 Proven & Probable Total 578.0 0.518 6,602.0
Notes:
1. CIM definitions were followed for Mineral Reserves. 2. Mineral Reserves are estimated at a variable cut-off grade based on process cost, recovery and
profit. 3. Mineral Reserves are estimated using an average long-term copper price of US$2.75 per pound
and a CLP/USD exchange rate of 500. 4. Numbers may not add due to rounding.

www.rpacan.com
Barrick Gold Corporation – Zaldívar Mine, Project #1683
Technical Report NI 43-101 – March 16, 2012
Rev. 0 Page 16-1
16 MINING METHODS The Zaldívar Mine is a traditional open pit truck/shovel operation. The open pit has
seven phases remaining (10b, 10c, 9a, 9b, 9c, 6, and 11). The ultimate pit will measure
approximately 2.8 km east to west, 2.6 km north to south, and have a maximum depth of
approximately 630 m. The phases and relationship to Escondida Norte are shown in
Figure 16-1. There are three primary waste rock facilities (WRF): the Main WRF, located
to the northwest, the North WRF, located to the northeast and adjacent to the Escondida
Norte concession boundary, and the South WRF, located to the southeast and also
adjacent to the Escondida Norte concession boundary. The heap leach facilities are
located to the north of the open pit on a separate parcel of land with agreement from
MEL (Figure 18-1). There is a small tailings storage facility (TSF) located to the north
that handles tailings from the small flotation plant that processes fines from the primary
heap leach crushing plant.
Processing is based on two heap leaching streams, one crushed and one ROM.
Separation of the ore types is done by the mine department based on blasthole sample
analysis. Primary processing is based on heap leaching a crushed material (80%
passing 13 mm) utilizing a dynamic (on-off) heap leach facility. This facility utilizes a
RAHCO Stacker for the placement of ore on the pad and a bucket wheel system for the
unloading of the spent ore for transport by a conveyor to a spent ore storage facility.
Additionally, marginal ores are processed through dump leaching at a ROM material size
on a static pad. Pregnant solution from both leach pads is pumped to the SX/EW plant
for metal extraction and production as copper cathodes. From the crushing circuit, 3% of
the ore tonnage for the dynamic heap leach processing ends up in fines which are
deposited in a sediment pond as a result of the washing system incorporated in the
tertiary crushing system. These sediments are periodically processed through a small
flotation plant and a copper concentrate is produced for sale.
The dynamic heap leach facility is based on a nominal 65,000 tpd operation (22 Mtpa).
The ROM dump leach facility is based on the dynamic heap leach capacity and ore
availability in the mine, and will average a nominal 15 Mtpa over the remaining mine life.

Escondida Norte
Source: Barrick Gold Corp., 2011.March 2012
Zaldívar Mine
Mine Phases
Barrick Gold Corporation
Region II, Northern Chile
Figure 16-1
16-2
www.rpacan.com

www.rpacan.com
Barrick Gold Corporation – Zaldívar Mine, Project #1683
Technical Report NI 43-101 – March 16, 2012
Rev. 0 Page 16-3
Mine production is 83 Mtpa including a nominal 46 Mtpa of waste. The current mine life
is from 2012 to 2028, and the Mineral Reserves from Section 15 of this report are only
based on mining and processing oxide and secondary sulphide ores. Metallurgical
investigations are underway to evaluate further leaching of primary sulphide material
and/or primary sulphide milling and flotation.
MINE DESIGN The Life of Mine (LOM) is based on mining the remaining seven phases over a nominal
17-year mine life from 2012 to 2028. Mining will be with conventional open-pit mining
equipment at a nominal 83 million tonnes per year over the first eleven years and then
decreasing thereafter. Waste and ore are mined on 15 m benches.
The mine operations are typical truck/shovel open-pit operations. The current mining
fleet is based on a fleet of thirty 218-tonne haul trucks increasing to thirty-four trucks by
2014. Loading operations are conducted using three 47 m3 electric shovels, and one 25
m3 wheel loader. RPA believes the mining equipment fleet is appropriate.
Mine models are developed using Maptek’s Vulcan® software with the Lerchs-
Grossmann (LG) pit optimization algorithm. The operational phase designs are
completed using the same mine planning software. This software packages is well
recognized and is commonly used for open-pit mine planning and design. Cut-off
grades are based on ore type, process recovery, and acid consumption. Both a heap
leach and dump leach cut-off grade are applied by rock type.
The pit optimization is based on a copper price of $2.75 lb per pound and produces a
single pit at a breakeven revenue factor for the last block mined. The optimized pit shell
was smoothed for operability and ramps were added for the ultimate pit design
(MY2011). The ultimate pit design had fewer ore tonnes (-4.7%) with a larger waste
tonnage (+30.2%) after smoothing. These design changes allowed for ore losses under
the primary crusher and isolated ore blocks, and allowed for smoother and flatter slopes
for a safer pit design (CMZ, 2002). RPA believes the mine designs are appropriate.
Currently the ultimate pit crosses the east boundary of the Zaldívar property and falls on
the Escondida Norte property. A layback agreement is currently in place with MEL where
waste removal can be done, and if any ore grade material is intersected on the MEL side

www.rpacan.com
Barrick Gold Corporation – Zaldívar Mine, Project #1683
Technical Report NI 43-101 – March 16, 2012
Rev. 0 Page 16-4
of the property boundary, this would be stockpiled for MEL to process. Likewise, MEL
can remove waste and stockpile ore grade material on the Zaldívar side of the property.
RPA has not seen this agreement but believes that, as both parties have long-term plans
to mine waste across the property boundary to access ore near the boundary, the
agreement is in good standing.
Figure 16-2 shows the ultimate pit outline. The pit design is based on 15 m benches.
Mine design parameters are presented in Table 16-1. Slopes vary based on location.
Figure 16-3 shows the design sectors used for the final pit slope criteria discussed later
in this section.
TABLE 16-1 MINE DESIGN PARAMETERS
Barrick Gold Corporation – Zaldívar Mine
Haul Road Width 30 m Haul Road Grade 10% Mining Bench Height 15 m Minimum Mining Width 135 m Interramp Slope Angles (vary by sector) 42°-52° Slope Face Angles 75°
RPA reviewed the pit designs and is of the opinion that they follow good engineering
practice. All phases are designed with sufficient operating width. All haul roads are
designed at a 10% maximum grade. There is sufficient room between phases to allow
for operating room, and roads and ramps have been delineated.

23000 N
20000 N
21000 N
22000 N
23000 N
20000 N
21000 N
22000 N
92000 E 94000 E93000 E91000 E 95000 E
92000 E 94000 E93000 E91000 E 95000 E
0 250
Metres
500 750 1000
N
Source: Barrick Gold Corp., 2011.March 2012
Zaldívar Mine
Ultimate Pit Design
Barrick Gold Corporation
Region II, Northern Chile
Figure 16-2
16-5
www.rpacan.com
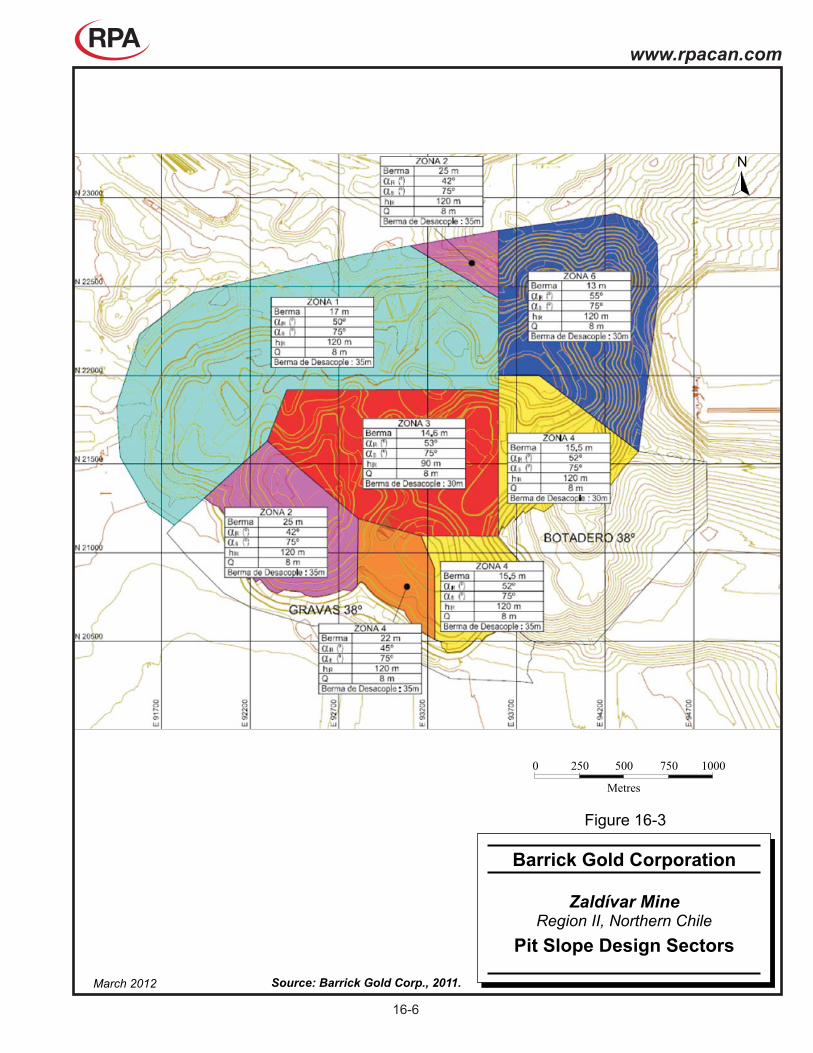
0 250
Metres
500 750 1000
N
Source: Barrick Gold Corp., 2011.March 2012
Zaldívar Mine
Pit Slope Design Sectors
Barrick Gold Corporation
Region II, Northern Chile
Figure 16-3
16-6
www.rpacan.com

www.rpacan.com
Barrick Gold Corporation – Zaldívar Mine, Project #1683
Technical Report NI 43-101 – March 16, 2012
Rev. 0 Page 16-7
GROUND CONDITIONS / SLOPE STABILITY The geotechnical analysis to develop slope design parameters for Zaldívar was
completed by A. Karzulovic & Asoc. Ltda. (AKL) in 2009. AKL has evaluated the pit
slope design for the ultimate pit using new geologic, geotechnical, and structural
information presented from recent mining of phases 5 and 8. A geotechnical
assessment is carried out by AKL for each designed phase before starting its
development.
The recommended interramp slope angles (IRAs) range from 42o to 55° with double (30
m high) benches in most areas of the proposed open pit. A maximum interramp slope
height of 120 m is also implemented to provide stress de-coupling and operational
flexibility to remediate interramp instabilities should they occur. Where no ramps are
present, equivalent step-outs are placed in the design at nominally 120 m vertical
intervals. A nominal ramp/step-out width of 30 m has been used for this retention berm.
When incorporating the recommended interramp slope angles, Zaldívar had further
reduced the slope angles in Zones 3 and 6 from 53° and 55°, respectively, to 52°.
The final pit slope will achieve heights of 630 m. RPA is of the opinion that the work that
has been completed by AKL was of an appropriate scope and the pit design is based on
reasonable engineering analysis and assumptions.
PRODUCTION SCHEDULE A mine production schedule was developed from the mine design. Production is based
on moving a nominal 85 Mtpa through 2024 with production decreasing thereafter, with
completion of mining in 2028. Table 16-2 shows the mine production schedule.
TABLE 16-2 MINE PRODUCTION SCHEDULE Barrick Gold Corporation – Zaldívar Mine
Heap Leach Dump Leach Waste Total Strip
Year kTonnes Cu (%) kTonnes Cu (%) kTonnes kTonnes Ratio 2012 22,064 0.658 19,000 0.359 42,167 83,231 1.03 2013 22,184 0.699 19,000 0.405 41,041 82,225 1.00 2014 22,004 0.555 19,000 0.384 45,890 86,894 1.12 2015 22,201 0.526 19,000 0.309 45,277 86,477 1.10 2016 22,262 0.604 19,000 0.291 46,364 87,626 1.12

www.rpacan.com
Barrick Gold Corporation – Zaldívar Mine, Project #1683
Technical Report NI 43-101 – March 16, 2012
Rev. 0 Page 16-8
Heap Leach Dump Leach Waste Total Strip
Year kTonnes Cu (%) kTonnes Cu (%) kTonnes kTonnes Ratio 2017 22,176 0.692 13,121 0.326 54,519 89,816 1.54 2018 22,004 0.565 15,018 0.304 49,175 86,197 1.33 2019 22,176 0.597 13,194 0.309 52,637 88,008 1.49 2020 22,237 0.581 7,282 0.298 64,291 93,811 2.18 2021 22,176 0.796 8,812 0.285 52,116 83,104 1.68 2022 22,004 0.776 10,058 0.290 50,468 82,530 1.57 2023 22,176 0.807 7,768 0.337 47,784 77,728 1.60 2024 22,237 0.693 15,138 0.259 40,103 77,478 1.07 2025 22,176 0.509 18,676 0.269 13,931 54,783 0.34 2026 22,004 0.591 5,757 0.286 7,827 35,588 0.28 2027 22,176 0.644 0 0.000 790 22,966 0.04 2028 18,493 0.459 0 0.000 0 18,493 0.00 2029 0 0.000 0 0.000 0 0 N/A
Total 372,748 0.634 209,825 0.319 654,380 1,236,953 1.12
WASTE ROCK Waste rock from the open pit goes to one of the three WRFs, with the largest being the
Main WRF in the northwest part of the property. The top of the Main WRF will be
approximately 450 m high from toe to crest at completion and the North WRF will be
approximately 200 m high. There is sufficient capacity in the waste dump areas to
handle the proposed production volumes.
A comprehensive WRF geotechnical report was prepared by AKL in 2001.
MINE EQUIPMENT The Zaldívar Mine is a typical truck/shovel operation. Mine mobile equipment production
rates were reviewed with availability and utilization to see if mining production rates and
costs are appropriate. RPA is of the opinion that the equipment productivity for the truck
and shovel fleet are appropriate. The current mine equipment fleet is listed in Table 16-
3.

www.rpacan.com
Barrick Gold Corporation – Zaldívar Mine, Project #1683
Technical Report NI 43-101 – March 16, 2012
Rev. 0 Page 16-9
TABLE 16-3 MINE EQUIPMENT FLEET Barrick Gold Corporation – Zaldívar Mine
Equipment Manufacturer Current
2011 Truck - 830E - DC Komatsu 17 Truck - 793B Caterpillar 3 Truck - MT4400 Terex 6 Truck - 830E - AC Komatsu 4 Wheel Loader - L1800 LeTourneau 1 Electric Shovel - 4100 P&H 3 Motor Grader - 16H Caterpillar 2 Track Dozer - D10R Caterpillar 1 Track Dozer - D375A Komatsu 4 Wheel Dozer - WD900 Caterpillar 1 Wheel Dozer - WD600 Komatsu 1 Electric Drill - D90K Driltech 2 Diesel Drill - D75KS Driltech 1 Water Truck - 777D Caterpillar 1 Water Truck - 4900 Western Star 2
MANPOWER The Zaldívar Mine operates on a 24-hour schedule, 365 days per year schedule. The
mine operations and maintenance department work two 12-hour shifts, 7 days per week
on a 7 days on, 7 days off schedule.
Mining operating manpower is based on four operators for each operating position.
Mining manpower for operations, maintenance, and technical services starts at 251
people in 2012 and increases to 263 people in 2014. RPA considers the manpower
estimates to be reasonable.
MINE INFRASTUCTURE The Zaldívar Mine has all the necessary infrastructure for a large mine operation. Mining
related infrastructure includes a truck shop, truck wash facility, warehouse, fuel storage
and distribution facility, and electrical power distribution and substations to support
construction and mine operations.

www.rpacan.com
Barrick Gold Corporation – Zaldívar Mine, Project #1683
Technical Report NI 43-101 – March 16, 2012
Rev. 0 Page 17-1
17 RECOVERY METHODS ORE PROCESSING Ore is processed primarily through a heap leaching system utilizing sulphuric acid
leaching solutions with copper recovery in a solvent extraction/electrowinning (SX/EW)
process in the form of copper cathode. There are multiple stages and/or routes of heap
leaching used at Zaldívar to treat various ore streams depending upon material
characteristics. The primary leaching system involves crushing and leaching on a
dynamic pad with a nominal leaching time of 360 days available for treatment. This
process treats the bulk of the ore materials from the mine. The spent ore recovered from
the crushed ore leach pad after leaching has been terminated is moved to a permanent
dump where the material is subjected to further secondary leaching. Low grade ore
materials are also leached on a permanent run-of-mine (ROM) or dump leach pad.
Finally, high grade fines from the tertiary crushing circuit, approximately 3% of total
material crushed, are treated through a milling and flotation concentrator to produce a
copper concentrate as a final product.
Processing is based on two heap leaching streams, one crushed and one ROM.
Primary processing is based on heap leaching a crushed material (80% passing 13 mm)
utilizing a dynamic (on-off) heap leach facility. Additionally, marginal ores are processed
through dump leaching at a ROM material size on a static pad. Pregnant solution from
both leach pads is pumped to the SX/EW plant for metal extraction and production as
copper cathodes. From the crushing circuit, 3% of the ore tonnage for the dynamic heap
leach processing ends up in fines which are deposited in a sediment pond as a result of
the washing system incorporated in the tertiary crushing system. These sediments are
periodically processed through a small flotation plant and a copper concentrate is
produced for sale.
The dynamic heap leach facility is based on a nominal 65,000 tpd operation (22 Mtpa).
The ROM dump leach facility is based on the dynamic heap leach capacity and ore
availability in the mine and will average a nominal 15 Mtpa over the remaining mine life.

www.rpacan.com
Barrick Gold Corporation – Zaldívar Mine, Project #1683
Technical Report NI 43-101 – March 16, 2012
Rev. 0 Page 17-2
DYNAMIC PAD LEACH PROCESS ROM ore is primary crushed to 50 mm and secondary crushed to 35 mm at a rate of
65,000 tpd. Product from the secondary crushers is transported via overland conveyor
to a covered stockpile with a capacity of 10,000 tonnes. Reclaim from the stockpile is
tertiary crushed to 13 mm and screened, producing leach pad feed and a small fraction
(3%) that is thickened for feed to flotation (see below for flotation process).
The finely crushed leach feed is placed in 10 m lifts with a RAHCO Stacker on the pad.
A bucket-wheel excavator removes the spent ore after leaching for rehandling to the
Ripios Alto Ley (RAL) or permanent secondary leach dump. The residence time on the
dynamic pad is approximately 360 days. Acid leach solution is applied to the surface of
the ore, with pregnant solutions collected at the base of the pad.
ROM LEACH PAD The ROM dump leach processes low grade material directly from the mine. The material
is not crushed and is placed on the ROM pad directly from haulage trucks. As with the
dynamic pad, acid leach solution is applied to the surface of the ore, with pregnant
solutions collected at the base of the pad.
SX/EW COPPER RECOVERY CIRCUIT The pregnant solutions from both the heap and dump leach are directed to the SX/EW
process. The plant includes four trains of low-head mixer-settler units, each followed by
a two-series extraction stage – a wash stage and a strip stage. Cathodes are bundled in
3,000 kg lots for shipment by rail to the port of Antofagasta.
FLOTATION CONCENTRATION PROCESS The thickened fines slurry is treated in the 1,850 tpd flotation plant. The final
concentrate, containing approximately 35% Cu, is thickened, filtered, and shipped by
truck to Xstrata’s La Negra smelter near Antofagasta. The tailings from the flotation
plant are transported by gravity through a four kilometre pipeline to a disposal site in the
northeast corner of the property. A process flowsheet is presented in Figure 17-1.

218 Tonne Truck
Rock Breaker
Apron Feeder ACID PLANTCapacity 500 tonne live Nº of Equip: 1
Equipment Potential: 600 HP
Capacity: 65,000 tpd SX-EW
Pantleg Chute
Primary Crusher Compartment POOR RAFFINATE POOL
Nordberg 54”x75” Electromagnet Top Size: 54mm
Conveyor CT-1 Conveyor CT-105 Conveyor CT-5 Secondary Crusher RICH RAFFINATE POOL
Design Capacity
of Conveyors 3,000 TPH Conveyor CT-4
Conveyor CT-3 Nº of Equip: 2 TRANS 32/34
Screen H013 12x24 Screen H014 Nordberg MP 1000 Stock Pile Dome
Bottom Size: 37mm P80: 37mm Capacity 65,000 tpd
2 Silos
Conveyor CT-106 2 Pre-screens 150 Tonnes c/u
Type Banana Nordberg 10”x24”.
Conveyor CT-7 Conveyor CT-6/8
Conveyors CT-14A & 15A NEGRILLAR
4 Feeders Mass Flow 3,000 tph 130 Kms
Conveyors- 14B & 15B
Conveyor CT-42
Silo Conveyors CT- 16, 17, 18 & 19
4 WaterFlush-800 Tertiary Crushers
Conveyors CT- 40 & 41 Fresh Water 70,000 m³
Fresh Water and Fire Water Reserve
1,400 m³
33mm
4 Allis Vibrating Screens
2 Crushers HP-500 >12mm
Capacity 350 tph <33mm
Conveyors CT- 20, 21, 22 & 23
Conveyor CT-43 Industrial Recirculation
-12mm 18,000 m³
Conveyor CT-26
CRUSHERS I & II
FIFTH LINE
PRE-SCREENS
PROCESSWATER
POTABLEWATER
WATERDEMINER-ALIZED
REVERSE OSMOSIS PLANT
SX
SX Camp Process
Conveyor CT-27
Cyclones I
Conveyor CT-32
Conveyor CT-34 Cyclones II Concentrate Thickener
Conveyor CT-35 Fines Thickener
Tailings Thickener
Ceramic Filters
Conveyor Rahco CT-201,202
Fines Flotation
4 Fines Screens 13 Flotation Cells
Pump Tailings
Pump
Concentrate 30%Cu ANTOFAGASTA SHIPMENT
Pump
Bucket Wheel Reclaimer Industrial Recirculation
Pump
Conveyor CT-135 ( discard EP 1 m³/Hr)
OD EEC 2.250 ³m/Hr
1.050 m³/H E2 OSC E1 Washing Stripping 2 Columns A/B 92 Cells
1.050 m³/Hr OC OD 66 Anodes
Dynamic Pile 650m x 2,100 m Bay A 65 Cathodes
Dump Leach TRAIN ARAFFINATE ER Cathode
SECONDARY LEACH PILE Semi Raffinate OCL 360 m³/Hr Removal A/B
1,400 m³/Hr
Bay B
TRAIN B360 m³/Hr 4 ELECTROLITE FILTERS A/B AVERAGE PRODUCTION
TERTIARY CRUSHER
FLOTATION OF FINES TEMPORARILY OUT OF SERVICE
Conveyor CT-30
Emergency Stockpile
PLS 1,400 m³/Hr
TK 791 m³36-63-004
SUB STATION
CRUCERO 213 Km
SUB STATION CIA.
ZALDIVAR
Wash Water
make up water
Feed Pump
42SOH
360 m /Hr 4 ELECTROLITE FILTERS A/B AVERAGE PRODUCTION
System of Pumps 400 tpd1352-1353-1354
2 Columns C/D Bay C
Rich Raffinate TRAIN C Cathode
CapacityApprox 25,000 m³ Removal C/D
Pumps 70 to 75 Intermediate PLS Pond Poor Raffinate
Auxilliary Pond Pumps2001 to 2004 Capacity Approx 108,000 m³ ISA TYPE PROCESS
PLS Pond Capacity Approx 10,000 m³ Pumps 50 to 54 Bay D
CapacityApprox 144,000 m³ Pump 1175 Pool RAL Pump 2162 TRAIN D
CapacityApprox 25,000 m³ 4 ELECTROLITE FILTERS C/D
360 m³/Hr System of Pumps 368 CELLS
EP 360 m³/Hr 1392-1393-1394
SX PLANT EW BAYS
Conveyor CT-136
OD
Conveyor CT-139
OSC
Conveyor CT-140
OCL
Conveyor CT-141
OC
EP
Conveyor CT-138
EEC
ER
EEC
LEACH TAILS DUMP
LEACH TAILS DUMP
TANK FARM
ORGANIC LOADED WASH
ORGANIC LOADING
RICH ELECTROLITE
POOR (LEAN) ELECTROLITE
ELECTROLITE ENTER TO CELL
LEACHING
ER + EP
DETAILSORGANIC DISCHARGE
ORGANIC SEMI LOADING
E1
TK 791 m³36-63-008
FeedPump
Feed Pump
March 2012 Source: Barrick Gold Corporation, 2011.
Process Flow Sheet
Zaldívar Mine
Barrick Gold Corporation
Region II, Northern Chile
Figure 17-1
17-3
ww
w.rp
ac
an
.co
m

www.rpacan.com
Barrick Gold Corporation – Zaldívar Mine, Project #1683
Technical Report NI 43-101 – March 16, 2012
Rev. 0 Page 17-4
COPPER RECOVERY Copper sequential assay data from Zaldívar has been used to calculate and reconcile
leach recoveries. Current laboratory results for copper assays will provide the following
data:
TCu: total copper ASCu: acid soluble copper CNCu: cyanide soluble copper SCu: insoluble or residual copper (TCu- ASCu- CNCu)
All copper mineral species in a heap will leach at different rates and the extent of
reaction depends on leach time and conditions. The amount of leaching for each or
group of species can be represented by the solubility ratios: ASCu/TCu, CNCu/TCu, and
SCu/TCu.
Since the leaching kinetics are different for the different groups of minerals, an overall
recovery for an ore can be correlated by a relation of the type:
TCu recovery = F1* (ASCu/TCu) + F2* (CNCu/TCu)+ F3* (SCu/TCu)
Where: F1: is a function of leach conditions, i.e., particle size, acid consumption, heap height, and leach time. F1 generally will have a value in the range of 90% to 98%; F2: is also a function of the same variables described above, and its value is generally in the range of 70% to 85%; F3: is also a function of the same variables described above, and its value is generally in the range of 30% to 50%.
To obtain the values for F1, F2, and F3 from operational data from heaps, it is possible
to graph the recovery for each species as a function of the solubility ratio.
COPPER RECOVERY ALGORITHMS AT ZALDÍVAR Zaldívar has been using copper recovery algorithms for reserve estimation developed
from the results of Lift #6 in 2006.

www.rpacan.com
Barrick Gold Corporation – Zaldívar Mine, Project #1683
Technical Report NI 43-101 – March 16, 2012
Rev. 0 Page 17-5
Samples from the various panels from Lift #6 were assayed before and after leaching by
auger drilling. These samples were assayed for TCu and ASCu.
The recovery algorithms for ASCu and non-acid soluble (SCu = TCu – ASCu) were
developed estimating the recovery from auger assays and correlating these values with
the corresponding grades.
FOR ACID SOLUBLE COPPER: ASCu Recovery = 100* [ASCu (head) - ASCu (leach residue)]/ASCu (head).
Figure 17-2 below shows a plot of ASCu recovery versus ASCu head grade.
FIGURE 17-2 ASCU RECOVERY VS. ASCU HEAD GRADE
An empirical regression analysis suggested that the data could be adequately
reproduced by the correlation:
ASCu recovery = 98.47- 2.42/ASCu (head)
Recuperacion Cobre Soluble modelo - Real
0
10
20
30
40
50
60
70
80
90
100
0 0,1 0,2 0,3 0,4 0,5 0,6 0,7 0,8 0,9 1 1,1 1,2 1,3 1,4 1,5 1,6 1,7 1,8 1,9 2
ley AsCu, %
Rec
uper
acio
n de
cob
re s
olub
le, %
Modelo Recuperacion Recuperacion Real

www.rpacan.com
Barrick Gold Corporation – Zaldívar Mine, Project #1683
Technical Report NI 43-101 – March 16, 2012
Rev. 0 Page 17-6
FOR NON-ACID SOLUBLE COPPER: SCu Recovery = 100* ([TCu - ASCu] (head) - [TCu -ASCu] (leach residue)/ [TCu - ASCu] (head)
Figure 17-3 below shows a plot of SCu recovery versus SCu head grade.
FIGURE 17-3 SCU RECOVERY VS. SCU HEAD GRADE
This graph suggested there were two populations of data SCu recovery: one for ores
with SCu < 0.6% that was adequately reproduced by the empirical correlation:
SCu < 0.6% SCu recovery = 100* [SCu(head)- 0.118]/SCu(head);
and one for ores with SCu > 0.6% that was adequately reproduced by empirical
correlation:
SCu > 0.6% SCu recovery = 91.06 – 17.93* SCu(head)
For ores with SCu > 0.6%, this correlation is valid for the dynamic pad leaching, but for
reserve estimation purposes, a correlation is used that assumes a longer leaching
period:
Recuperacion Cu Sulfurado Modelo vs Real
0
10
20
30
40
50
60
70
80
90
100
0,0 0,2 0,4 0,6 0,8 1,0 1,2 1,4 1,6 1,8 2,0
Ley Cu Sulf (%)
Recu
pera
cion
(%)
Recuperacion Real Modelo Recuperacion modelo recuperacion Alta ley

www.rpacan.com
Barrick Gold Corporation – Zaldívar Mine, Project #1683
Technical Report NI 43-101 – March 16, 2012
Rev. 0 Page 17-7
SCu recovery = 70*[{SCu(head)-0.118}/SCu(head)+30*[91.06-17.93*SCu(head)]/100
The total copper recovery was then calculated by the following correlation:
TCu= [ASCu recovery* ASCu + SCu recovery* SCu]/TCu
The recovery algorithms adequately represented the data obtained for Lift #6, as
expected, since the equations were forced to fit the data, however, when they were used
to calculate the recoveries from other lifts, the fit was less precise.
The results of this type can be expected because the methodology used does not
recognize that sulphide copper occurs in several different mineralogical species which
do not have the same leaching kinetics. Zaldívar considered an approach to deal with
this topic in the development of a sequential copper assay that consists of:
i. An ore sample is leached first with a 5% sulphuric acid solution at specified conditions;
ii. The leach residue is then leached with a dilute solution of NaCN at pH of 12.
These tests allow each ore sample to have a TCu assay, an ASCu assay, and a CNCu
assay.
The acid leach will mainly attack oxidized copper species, and the cyanide leach will
attack primarily chalcocite and bornite, leaving behind a residual copper mainly as
chalcopyrite and covellite. When a deposit is mainly primary sulphide with a majority of
chalcopyrite, an additional ferric sulphate leach can be done.
These assays provide for an indirect measure of the mineralogy of the ores being
treated. For Zaldívar, both an acid leach as well as a cyanide leach on the residues was
conducted on all samples.
With this information, new algorithms were developed that more closely represented the
future copper recoveries of the plant. The proposed recovery model was compared
against actual Lift #6 data and against the CMZ reserve algorithms.

www.rpacan.com
Barrick Gold Corporation – Zaldívar Mine, Project #1683
Technical Report NI 43-101 – March 16, 2012
Rev. 0 Page 17-8
The values used for the correlation parameters were: F1= 96, F2= 78, F3= 40. It was
thought that these values could be improved by comparing more of the existing data,
and by introducing a grade relationship into the F functions.
TCu recovery = 96* (ASCu/TCu) + 78* (CNCu/TCu) + 40* (SCu/TCu)
The process recovery model discussed above is documented in the report titled
Recovery CMZ dated 2006.
2011 RECOVERY MODEL In general, historical information supports the results of this model; however,
commencing in 2011, a modification to the dynamic heap leach insoluble copper
recovery has been made limiting maximum insoluble copper recovery to 55%. Table 17-
1 presents the metallurgical model algorithms applied to the economic evaluation of
material within the block model.
TABLE 17-1 METALLURGICAL MODEL ALGORITHMS Barrick Gold Corporation – Zaldívar Mine
Met Type Designation Copper Recovery Algorithm
Dynamic Heap Leach Acid Soluble Copper Insoluble Copper (SCu ≤ 0.6%) Insoluble Copper (SCu > 0.6%)
Curec = if (ASCu > 0.024576, 98.47–(2.42/ASCu), 0) Curec = min (if (SCu > 0.118, (SCu-0.118)/SCu)*100, 0), 55) Curec = min (94.24 – (17.93*SCu), 55) A recovery correction factor of 0.788 is applied to Geol_Min codes 7, 8 and 13.
Dump Heap Leach Total Copper
Curec = if(and(CuT >0.214, ASCu≥0.06), 36, 0) Valid for Geol_Min codes 5, 6, 9 and 11
Flotation Plant Acid Soluble Copper Insoluble Copper
Curec = 13% Curec = 70%
Average Metallurgical Recoveries Dynamic Heap Leach Dump Heap Leach Average
Curec = 62.6% on average Curec = 36.0% on average Curec = 59.7% on average
Where, Curec = Copper recovery (%) ASCu = Acid soluble copper grade (%)
SCu = Insoluble copper grade (%) CuT = Acid soluble + Insoluble copper grade (%)
The recovery algorithm curves are depicted in Figure 17-4.

www.rpacan.com
Barrick Gold Corporation – Zaldívar Mine, Project #1683
Technical Report NI 43-101 – March 16, 2012
Rev. 0 Page 17-9
FIGURE 17-4 METALLURGICAL RECOVERY MODEL CURVES
With this change in recovery formulas, it has been observed that the average calculated
recovery for the remaining resources at Zaldívar decreases by approximately 9%. This
is a direct result of the recovery capping of 55% applied to the insoluble copper
component of the dynamic leach pad ore as well as the impact of an approximate 8%
reduction in average grade of the insoluble copper included in the current geological
model as a result of improvements in geological model reconciliation.
In 2012, a revision will be made to the recovery model. The revised recovery model will
account for the current operational parameters and results.
RPA has reviewed the recovery model and finds the development of the recovery
formulas and the reconciliation to historic data to be reasonable. The metallurgical
testwork which supports the models is also reasonable and adequate.

www.rpacan.com
Barrick Gold Corporation – Zaldívar Mine, Project #1683
Technical Report NI 43-101 – March 16, 2012
Rev. 0 Page 18-1
18 PROJECT INFRASTRUCTURE The Project infrastructure and services have been designed to support an operation of
65,000 tpd of ore to dynamic heap leach processing and a nominal 240,000 tpd of total
material mined. Site infrastructure is shown in Figure 18-1.
ACCESS Access to the Zaldívar site is via a paved road from Antofagasta, following Highway 28
for 15 km to the southwest to the intersection with Route 5 (Pan-American Highway).
From the intersection with Route 5, there is a private two-lane paved road that is shared
by three major mines, Zaldívar, Escondida, and El Peñón that heads to the east. It is
137 km to the Zaldívar turnoff. From the turnoff, it is 7 km to the Zaldívar camp and
another 8 km to the Zaldívar Mine offices. Total distance from Antofagasta is a nominal
170 km. Most consumables are transported along this route by truck.
The site is also serviced by rail with Ferrocarril Antofagasta - Bolivia (FCAB) transporting
sulphuric acid to the mine and transporting copper cathode to the port of Antofagasta.
MINE SITE FACILITIES The mine and heap leach facilities are located at the mine site. Also, located here are
the SX/EW plant; on-site facilities (safety/security/first aid/emergency response building,
assay laboratory, plant guard house, dining facilities, and offices); related mine services
facilities (truckshop, truck wash facility, warehouse, fuel storage and distribution facilities,
reagent storage and distribution facilities); and other services facilities to support
operations.
ACCOMMODATIONS Mine camp facilities are located adjacent to the Zaldívar Mine and approximately eight
kilometres from the plant at 3,085 masl. Permanent accommodations are located here.
Contractor accommodations are also provided near the mine office. Accommodations
are sufficient for the current Zaldívar workforce of 863 people and the 1,146 contractors
and consultants.

www.rpacan.com
Barrick Gold Corporation – Zaldívar Mine, Project #1683
Technical Report NI 43-101 – March 16, 2012
Rev. 0 Page 18-2
WATER Process water is supplied from groundwater at Negrillar, 130 km east of Zaldívar. The
water is drawn from six production wells and pumped to the freshwater pond near the
tertiary crushing facility at the plant site. Current use is approximately 220 L/s.
PORT Antofagasta port is one of the main harbour facilities in northern Chile. The port serves
as an important location for incoming merchandise for Bolivia, Argentina, and Paraguay.
It is the property of the State, administered by Empresa Portuaria Antofagasta which
acts as the harbour authority. Cathode from Zaldívar is shipped from the port of
Antofagasta.
ELECTRICAL Zaldívar consumes a nominal 72 MWh to 76 MWh. The power supplier is AES Gener.
The power transmission is part of Sistema Interconectado del Norte Grande (SING), the
regional electrical grid for Northern Chile. A dual-circuit, 220 kV, 230 km long
transmission line was constructed with MEL between the Zaldívar and Escondida Norte
plant sites and the SING substation at El Crucero.

EstanqueEstanque
EstanquesEstanques
3045.003045.00
3040.003040.00
Y FUTBOLITOY FUTBOLITO
CANCHA DE TENISCANCHA DE TENIS
CASINO OPERACIONESCASINO OPERACIONES
OFICIN
A RRHH
OFICIN
A RRHH
GIMNASIOGIMNASIO
MULTICANCHAMULTICANCHA
A1
A2
A3
OP1
OP2
OP3
OP4OP4
B4
B3
B2
B1
C1
C2
C3
C4
D1
D2
D3
D4
A4
493,000 494,000 495,000
7,3
29,0
00
7,3
28,0
00
7,3
27,0
00
496,000
7,3
25,0
00
7,3
26,0
00
7,3
24,0
00
7,3
22,0
00
7,3
23,0
00
7,3
21,0
00
7,3
20,0
00
7,3
29,0
00
7,3
28,0
00
7,3
27,0
00
7,3
25,0
00
7,3
26,0
00
7,3
24,0
00
7,3
22,0
00
7,3
23,0
00
7,3
21,0
00
7,3
20,0
00
495,000 496,000490,000 491,000 492,000 493,000 494,000
7,3
30,0
00
490,000 491,000 492,000
7,3
30,0
00
St_09b
St_10c
St_06
St_10b
St_09a
St_09c
Dump Leach
Heap Leach
SX-EW
Ultimate Pit
Tailings
Camp
Plant Mine Property
Crusher
North Dump
MainWasteDump
Secondary Leach
Industrial Area
Railway
St_11
0 0.5
Kilometres
1.0 1.5 2.0
N
Source: Barrick Gold Corp., 2009.March 2012
Zaldívar Mine
Site Infrastructure
Barrick Gold Corporation
Region II, Northern Chile
Figure 18-1
18-3
www.rpacan.com

www.rpacan.com
Barrick Gold Corporation – Zaldívar Mine, Project #1683
Technical Report NI 43-101 – March 16, 2012
Rev. 0 Page 19-1
19 MARKET STUDIES AND CONTRACTS MARKETS Copper markets are mature global markets with reputable smelters and refiners located
throughout the world. Copper is a principal metal traded on the London Metal Exchange
(LME) and has total price transparency. Prices are quoted on the LME for Copper
Grade A and can be found at www.lme.com. The average copper price for 2011 through
December 31 was $4.05 per pound. Current prices as of December 31, 2011, are $3.43
per pound. The three-year and five-year rolling average prices through the end of
December 2011 are $3.25 and $3.23 per pound, respectively. This technical report uses
a price below the three-year average price for copper of $2.75 per pound for the
economic analysis.
Operations at the Zaldívar Mine are expected to produce an annual average of 228
million pounds of copper over a 17-year mine life.
CONTRACTS Currently, there are no smelting and refining contracts, no forward sales, and no
hedging.

www.rpacan.com
Barrick Gold Corporation – Zaldívar Mine, Project #1683
Technical Report NI 43-101 – March 16, 2012
Rev. 0 Page 20-1
20 ENVIRONMENTAL STUDIES, PERMITTING, AND SOCIAL OR COMMUNITY IMPACT ENVIRONMENTAL STUDIES The present operation of the Zaldívar Mine was approved in its original form called the
“Zaldívar Project” through Resolution Nº 574, in 1993, by the Comisión Regional del
Medio Ambiente de la II Región de Antofagasta (COREMA). The project had as its
principal installation, an operating open-pit mine, primary, secondary and tertiary
crushing plants, a concentrating plant for fines, waste dumps, and tailings and a
production line for copper cathodes that consists of a dynamic leach facility, ROM leach
facility for low grade, and a solution extraction (SX) and electrowinning (EW) plant.
In 2009, an updated Environmental Impact Study (Estudio de Impacto Ambiental, or EIA)
was developed to address “Modifications Works for the Zaldívar Mine”. The purpose of
the EIA was to update the project that Zaldívar executed within the original permit area
approved for the Zaldívar Project in 1993 with the purpose of optimizing the mining
processes and maintaining production levels, and modifications to increase the
production capacity involving some new areas of impact. The EIA was approved by
COREMA in February 2010. On December 9, 2010, CMZ obtained its operational
permits from the Servicio Nacional de Geología y Minería (SERNAGEOMIN) and
expects to obtain other associated sectoral permits in due course.
PROJECT PERMITTING The Zaldívar Mine has approximately 140 active permits. The operations reporting is to
COREMA, with some minor reporting to Corporación Nacional de Medio Ambiente
(CONAMA) and SERNAGEOMIN. Other public agencies include Seremía de Salud,
Servicio Agrícola y Ganadero (SAG) and Dirección General de Agua (DGA). All permits
have been obtained and are in good standing. The mine runs an extensive
environmental monitoring program to ensure compliance with the requirements of these

www.rpacan.com
Barrick Gold Corporation – Zaldívar Mine, Project #1683
Technical Report NI 43-101 – March 16, 2012
Rev. 0 Page 20-2
permits. For the major environmental issues identified, management plans have been
developed that include rehabilitation, site decommissioning, and closure.
SOCIAL OR COMMUNITY REQUIREMENTS Zaldívar operates under Barrick’s sustainability policy, which commits the operation to a
corporate standard of environmental stewardship. This involves protecting human
health, reducing the impact of mining on the ecosystem, and returning the site to a state
compatible with a healthy environment. Zaldívar operates in an environmentally
responsible manner with limited adverse impacts on the environment. Programs are in
place that continuously monitor the process and surrounding areas and employ leak
detection wells to detect any potential problems.
In 2001, Zaldívar instituted an Environmental Policy with a commitment to protect the
workers, respect the existing surroundings, and maintain production of copper
concentrate and cathodes. Zaldívar also committed to discussions with local and
national authorities regarding sustainability issues. In July 2003, Zaldívar was certified
under ISO 14001. This certification commits Zaldívar to maintain an environment that
allows for continuous improvements and environmental performance. In 2010, the
Certificate of Quality Standards was updated to ISO 9001:2008. Currently, all activities
at Zaldívar were in compliance with applicable corporate standards and environmental
regulations.
MINE CLOSURE REQUIREMENTS Mine closure plans are reviewed and analyzed annually. Current cost estimates for
closure are $36.2 million.
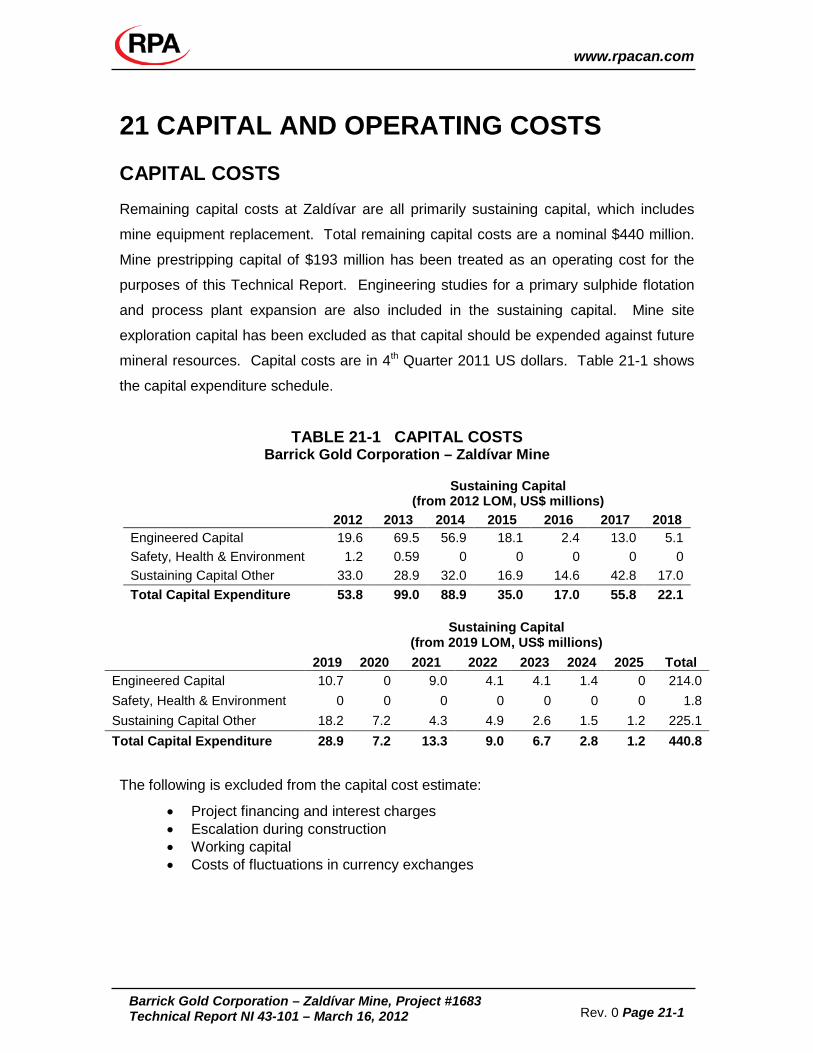
www.rpacan.com
Barrick Gold Corporation – Zaldívar Mine, Project #1683
Technical Report NI 43-101 – March 16, 2012
Rev. 0 Page 21-1
21 CAPITAL AND OPERATING COSTS CAPITAL COSTS Remaining capital costs at Zaldívar are all primarily sustaining capital, which includes
mine equipment replacement. Total remaining capital costs are a nominal $440 million.
Mine prestripping capital of $193 million has been treated as an operating cost for the
purposes of this Technical Report. Engineering studies for a primary sulphide flotation
and process plant expansion are also included in the sustaining capital. Mine site
exploration capital has been excluded as that capital should be expended against future
mineral resources. Capital costs are in 4th Quarter 2011 US dollars. Table 21-1 shows
the capital expenditure schedule.
TABLE 21-1 CAPITAL COSTS Barrick Gold Corporation – Zaldívar Mine
Sustaining Capital
(from 2012 LOM, US$ millions) 2012 2013 2014 2015 2016 2017 2018
Engineered Capital 19.6 69.5 56.9 18.1 2.4 13.0 5.1 Safety, Health & Environment 1.2 0.59 0 0 0 0 0 Sustaining Capital Other 33.0 28.9 32.0 16.9 14.6 42.8 17.0 Total Capital Expenditure 53.8 99.0 88.9 35.0 17.0 55.8 22.1
Sustaining Capital
(from 2019 LOM, US$ millions) 2019 2020 2021 2022 2023 2024 2025 Total
Engineered Capital 10.7 0 9.0 4.1 4.1 1.4 0 214.0 Safety, Health & Environment 0 0 0 0 0 0 0 1.8 Sustaining Capital Other 18.2 7.2 4.3 4.9 2.6 1.5 1.2 225.1 Total Capital Expenditure 28.9 7.2 13.3 9.0 6.7 2.8 1.2 440.8
The following is excluded from the capital cost estimate:
• Project financing and interest charges • Escalation during construction • Working capital • Costs of fluctuations in currency exchanges

www.rpacan.com
Barrick Gold Corporation – Zaldívar Mine, Project #1683
Technical Report NI 43-101 – March 16, 2012
Rev. 0 Page 21-2
OPERATING COSTS Zaldívar Mine has been in production since November 1995. Operating costs are
tracked and well understood. Mine operating costs are a nominal $1.47 per tonne of
material mined or $3.12 per tonne of ore mined. Unit mine operating costs are
presented in Table 21-2.
TABLE 21-2 MINE OPERATING COSTS Barrick Gold Corporation – Zaldívar Mine
Mine Operating Costs US$
Mine Overhead 0.207 Drilling 0.087 Blasting 0.143 Loading 0.198 Hauling 0.687 Support 0.139 Pit Dewatering 0.007 Total 1.468 per tonne mined
3.117 per tonne ore processed
Process operating costs include the dynamic pad or heap leach and the dump leach.
This also includes the entire crushing plant, acid, and all reagents. Process operating
costs are $7.35 per tonne ore processed. Unit process operating costs are presented in
Table 21-3.
TABLE 21-3 UNIT PROCESS OPERATING COSTS Barrick Gold Corporation – Zaldívar Mine
Process Costs US$
Overhead
0.21 Leach Facility 6.24 Maintenance 0.90 Total
7.35
General and administrative costs (G&A) include all management salaries, camp
operating costs, and environmental, health and safety. Administrative costs are $1.25
per tonne ore processed. Unit operating costs are presented in Table 21-4.
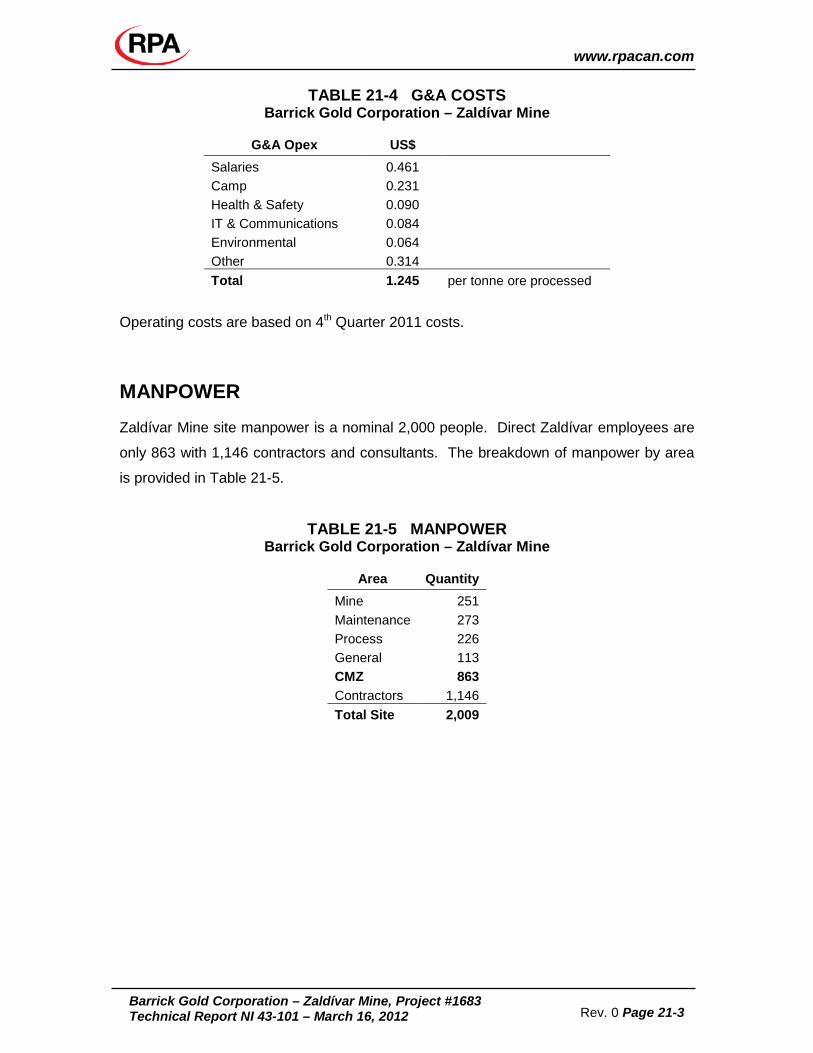
www.rpacan.com
Barrick Gold Corporation – Zaldívar Mine, Project #1683
Technical Report NI 43-101 – March 16, 2012
Rev. 0 Page 21-3
TABLE 21-4 G&A COSTS Barrick Gold Corporation – Zaldívar Mine
G&A Opex US$
Salaries 0.461 Camp 0.231 Health & Safety 0.090 IT & Communications 0.084 Environmental 0.064 Other 0.314 Total 1.245 per tonne ore processed
Operating costs are based on 4th Quarter 2011 costs.
MANPOWER Zaldívar Mine site manpower is a nominal 2,000 people. Direct Zaldívar employees are
only 863 with 1,146 contractors and consultants. The breakdown of manpower by area
is provided in Table 21-5.
TABLE 21-5 MANPOWER Barrick Gold Corporation – Zaldívar Mine
Area Quantity
Mine 251 Maintenance 273 Process 226 General 113 CMZ 863 Contractors 1,146 Total Site 2,009

www.rpacan.com
Barrick Gold Corporation – Zaldívar Mine, Project #1683
Technical Report NI 43-101 – March 16, 2012
Rev. 0 Page 22-1
22 ECONOMIC ANALYSIS Under NI 43-101 rules, producing issuers may exclude the information required for
Section 22 – Economic Analysis, on properties currently in production, unless the
Technical Report includes a material expansion of current production. RPA notes that
Barrick is a producing issuer, the Zaldívar Mine is currently in production, and a material
expansion is not included in the current LOM plans. RPA has performed an economic
analysis of the Zaldívar Mine using the estimates presented in this report and confirms
that the outcome is a positive cash flow that supports the statement of Mineral Reserves.

www.rpacan.com
Barrick Gold Corporation – Zaldívar Mine, Project #1683
Technical Report NI 43-101 – March 16, 2012
Rev. 0 Page 23-1
23 ADJACENT PROPERTIES The Zaldívar mining concessions are surrounded by mining concessions owned by MEL.
MEL is best known as the largest producing copper mine in the world, with 5% to 8% of
the world’s annual copper production coming from the Escondida Mine.
Agreements are in place that allow use of MEL’s land for some of Zaldívar’s process
infrastructure. Layback agreements related to pit wall pushbacks for the Zaldívar and
Escondida Norte pits are also in place.
www.rpacan.com
Barrick Gold Corporation – Zaldívar Mine, Project #1683
Technical Report NI 43-101 – March 16, 2012
Rev. 0 Page 24-1
24 OTHER RELEVANT DATA AND INFORMATION No additional information or explanation is necessary to make this Technical Report
understandable and not misleading.

www.rpacan.com
Barrick Gold Corporation – Zaldívar Mine, Project #1683
Technical Report NI 43-101 – March 16, 2012
Rev. 0 Page 25-1
25 INTERPRETATION AND CONCLUSIONS RPA offers the following conclusions:
GEOLOGY AND MINERAL RESOURCE ESTIMATION
• The EOY2011 Measured and Indicated Mineral Resource is 125 million tonnes at a total copper grade of 0.445% containing 1.225 billion pounds of copper. The Mineral Resources are exclusive of Mineral Reserves.
• The EOY2011 Inferred Mineral Resource is 37 million tonnes at a total copper grade of 0.54% containing 439 million pounds of copper.
• Mineral Resource estimates have been prepared utilizing acceptable estimation methodologies. The classification of Measured, Indicated, and Inferred Resources, stated in Table 14-1, meet the requirements of NI 43-101 and CIM definitions.
• The methods and procedures utilized by CMZ at the Zaldívar Mine to gather geological, geotechnical, assaying, density, and other information are reasonable and meet generally accepted industry standards. Standard operating protocols are well documented and updated on a regular basis for most of the common tasks. CMZ carries out regular comparisons with blasthole data, previous models, and production reconciliation results to calibrate and improve the resource modelling procedures.
• The current drill hole database is reasonable for supporting a resource model for use in Mineral Resource and Mineral Reserve estimation.
• CMZ has conducted the exploration and development sampling and analysis programs using standard practices, providing generally reasonable results. The resulting data can effectively be used for the estimation of Mineral Resources and Mineral Reserves.
• Overall, RPA is of the opinion that CMZ has done very high quality work that exceeds industry practice.
MINING AND MINERAL RESERVES
• The EOY2011 Proven and Probable Mineral Reserves are 578 million tonnes at a total copper grade of 0.518% containing 6.602 billion pounds of copper.
• The Mineral Reserve estimates have been prepared utilizing acceptable
estimation methodologies and the classification of Proven and Probable Reserves, stated in Table 15-1, conform to CIM definitions.
• The operating data provided by CMZ and the supporting documents were
prepared using standard industry practices and provide reasonable results and conclusions.

www.rpacan.com
Barrick Gold Corporation – Zaldívar Mine, Project #1683
Technical Report NI 43-101 – March 16, 2012
Rev. 0 Page 25-2
• Standard operating protocols are well documented and updated on a regular basis for most of the common tasks.
• Recovery and cost estimates are based upon operating data and engineering to support a Mineral Reserve statement. Economic analysis using these estimates generates a positive cash flow, which supports a statement of Mineral Reserves.
• The current Zaldívar LOM plan provides reasonable results and, in RPA’s opinion, meets the requirements for statement of Mineral Reserves. In addition to the Mineral Reserves in the LOM plan, there are Mineral Resources and potential sulphide resources that represent opportunities for the future.
PROCESSING • The process includes heap leaching with copper recovery in an SX/EW process
in the form of copper cathode.
• RPA has reviewed the recovery model and finds the development of the recovery formulas and the reconciliation to historic data to be reasonable. The metallurgical testwork, which supports the models, is also reasonable and adequate.
• In 2012, a revision will be made to the recovery model. The revised recovery model will account for the current operational parameters and results.
ENVIRONMENTAL CONSIDERATIONS
• The Project has approximately 140 active permits. All permits are in good standing and there is an extensive environmental monitoring program to ensure compliance with the requirements of these permits.

www.rpacan.com
Barrick Gold Corporation – Zaldívar Mine, Project #1683
Technical Report NI 43-101 – March 16, 2012
Rev. 0 Page 26-1
26 RECOMMENDATIONS The Zaldívar LOM plan provides reasonable results and, in RPA’s opinion, meets the
requirements for statement of Mineral Reserves. This Technical Report is based on the
LOM plan. In addition to the LOM plan, there are additional resources and potential
resources that should be given further consideration in the future. Below is a list of
recommendations to consider:
MINING
• The LOM plan is robust and Barrick should proceed to implement the plan as presented.
• There is a known primary sulphide resource below the current Proven plus Probable oxide and secondary sulphide reserves. Additional work to drill these resources and develop a Feasibility Study for the primary sulphide should also proceed.
ENVIRONMENTAL CONSIDERATIONS
• Evaluation of permit requirements, developing baseline studies, and starting a new EIA for the sulphide project should proceed in unison with the primary sulphide feasibility study.

www.rpacan.com
Barrick Gold Corporation – Zaldívar Mine, Project #1683
Technical Report NI 43-101 – March 16, 2012
Rev. 0 Page 27-1
27 REFERENCES AMEC Americas Limited, 2004, Zaldívar Project, Chile, NI 43-101 Technical Report,
Prepared for Placer Dome Inc., December 31, 2004, 77 pp. CIM, 2010, CIM Definition Standards - For Mineral Resources and Mineral Reserves,
Prepared by the CIM Standing Committee on Reserve Definitions, Adopted by CIM Council on November 27, 2010.
CMZ Geology Department, 2008, Zaldívar Geology PowerPoint Presentation Dated April
2008, 15 pp. CMZ, 2002: Determinación Máxima Altura Estable Botaderos de Lastre Rajo Zaldívar -
Proyecto Factibilidad 2001, a report by A. Karzulovic & Asoc. Ltda, 22 p. Croal, A. and Tsafaras, M., 2008, Zaldívar Deeps Project: Scoping Study, Internal
Barrick Report Dated December 10, 2008, 15 p. Marinovic, N.; Smoje, I.; Maksaev, V.; Herve, M.; Mpodozis, C., 1995, Hoja Aguas
Blancas, Región de Antofagasta Servicio Nacional de Geología y Minería. Carta Geológica de Chile, N° 70, p. 75.
Monroy, C., 2010, Reporte Validacion Collares Sondajes Infill 2010, Internal Barrick
Memorandum Dated April 21, 2010, 3 p. Monroy, C., 2010, Reporte Validacion de Survey Sondajes Infill 2010, Internal Barrick
Memorandum Dated April 20, 2010, 10 p. Monroy, C., 2009, Validacion Informacion de Survey Sondajes Infill 2008, Internal
Barrick Memorandum Dated September 17, 2009, 5 p. Monroy, C., 2009, Validacion Informacion Collares Sondajes Infill 2008 (Fase 2) and Infill
2009, Internal Barrick Memorandum Dated September 17, 2009, 5 p. Monroy, C., 2008, Validacion Leyes en Carpetas Sondajes RC 2008, Internal Barrick
Memorandum Dated September 17, 2008, 2 p. Monroy, C., 2008, Informe Modelamiento Geologico 2008, 15 p. Monroy, C, and Morales, P., 2008, Conciliacion Reservas y Recursos para el Banco
3125-ET8, October 28, 2008, 8 p. Monroy, C, and Morales, P., 2008, Conciliacion Reservas y Recursos para el Banco
2990-ET5, October 28, 2008, 8 p. Morales, P., 2009, Control de Calidad QA/QC para Muestras Pozo de Tronadura y
Sondaje Tipo RC y DDH, CMZ Report Originally Dated March 2007, 10 p. Morales, P. and Monroy, C., 2009, Informe Trimestral QA/QC Corto Plazo, Julio a
Septiembre 2008, 30 p.

www.rpacan.com
Barrick Gold Corporation – Zaldívar Mine, Project #1683
Technical Report NI 43-101 – March 16, 2012
Rev. 0 Page 27-2
Morales, P., 2008, Validacion Leyes en Carpetas Sondajes Primarios 2007, Internal Barrick Memorandum Dated January 5, 2008, 2 p.
Morales, P., 2007, Procedimiento Muestreo de Pozos de Tronadura, December 2007, 10
p. Monroy, C, and Morales, P., 2008, Conciliacion Anual Movil al 31 de Deciembre del
2008 Mo. Bloques Largo Plazo – Mod. Bloques Corto Plazo – Chancador Primario, December 6, 2008, 8 p.
Richard, J., Noble, S., and Pringle, M., 1999, A Revised Late Eoceno Age for Porphyry
Cu Magmatism in the Escondida Area, Northern Chile. Perez, L., 2008, Validacion Informacion Collares Sondajes Etapa 10, Internal Barrick
Memorandum Dated September 9, 2008, 2 p. Perez, L., 2008, Validacion Coordenadas Definitivas Sondajes Primarios 2008, Internal
Barrick Memorandum Dated September 15, 2008, 2 p. Placer Dome Inc., 2006, Compania Minera Zaldívar Mineral Resource and Mineral
Reserve Audit Level 2 Audit, December 2006, 62 p. Placer Dome Inc., 2004, Compania Minera Zaldívar Mineral Resource and Mineral
Reserve Audit, November 2004, 39 p. Richards, J., Noble, S.; Pringle, M. 1999, A revised Late Eoceno Age for Porphyry Cu
Magmatism in the Escondida Area, Northern Chile. Economic Geology, Vol. 94, N°8, pp. 1231 to 1247.
Sanfurgo, B., 2008, Estimacion de Recursos Zaldívar, Barrick Draft Report Dated
December 2008, 65 p. Scott Wilson RPA, 2009, Report on Audit of Mineral Resources and Mineral Reserves
for the Zaldívar Mine, Chile, Prepared for Barrick Gold Corporation, Dated March 23, 2009, 71 p.
Scott Wilson RPA, 2008, Review of the Zaldívar Deeps Sulphide Cu-Mo-Au-Ag Project,
Memorandum Prepared for Barrick Gold Corporation, Dated January 9, 2008, 2 p. Solis, S., 2011, Reporte Validacion Collares Sondajes Infill 2011, Internal Barrick
Memorandum Dated June 15, 2011, 2 p. Solis, S., 2011, Reporte Validacion de Leyes Sondajes Infill 2011, Internal Barrick
Memorandum Dated July 15, 2011, 1 p. Solis, S., 2011, Reporte Validacion de Survey Sondajes Infill 2011, Internal Barrick
Memorandum Dated June 15, 2011, 14 p.

www.rpacan.com
Barrick Gold Corporation – Zaldívar Mine, Project #1683
Technical Report NI 43-101 – March 16, 2012
Rev. 0 Page 28-1
28 DATE AND SIGNATURE PAGE This report titled “Technical Report on the Zaldívar Mine, Region II, Chile” and dated
March 16, 2012, was prepared and signed by the following authors:
(Signed & Sealed) “Luke Evans” Dated at Toronto, ON March 16, 2012 Luke Evans, M.Sc., P.Eng. Principal Geologist (Signed & Sealed) “Richard J. Lambert” Dated at Lakewood, CO March 16, 2012 Richard J. Lambert, P.E. Principal Mining Engineer

www.rpacan.com
Barrick Gold Corporation – Zaldívar Mine, Project #1683
Technical Report NI 43-101 – March 16, 2012
Rev. 0 Page 29-1
29 CERTIFICATE OF QUALIFIED PERSON LUKE EVANS I, Luke Evans, M.Sc., P.Eng., as an author of this report titled “Technical Report on the Zaldívar Mine, Region II, Chile” prepared for Barrick Gold Corporation, and dated March 16, 2012, do hereby certify that:
1. I am a Consulting Geological Engineer with Roscoe Postle Associates Inc. of Suite 501, 55 University Ave Toronto, ON, M5J 2H7.
2. I am a graduate of University of Toronto, Ontario, Canada, in 1983 with a
Bachelor of Science (Applied) degree in Geological Engineering and Queen’s University, Kingston, Ontario, Canada, in 1986 with a Master of Science degree in Mineral Exploration.
3. I am registered as a Professional Engineer in the Province of Ontario (Reg.#
90345885). I have worked as a professional geological engineer for over 25 years since my graduation. My relevant experience for the purpose of the Technical Report is: • Consulting Geological Engineer specializing in resource and reserve
estimates, audits, technical assistance, and training since 1995. • Review and report as a consultant on numerous exploration and mining
projects around the world for due diligence and regulatory requirements. • Senior Project Geologist in charge of exploration programs at several gold
and base metal mines in Quebec.
4. I have read the definition of "qualified person" set out in National Instrument 43-101 (NI 43-101) and certify that by reason of my education, affiliation with a professional association (as defined in NI 43-101) and past relevant work experience, I fulfill the requirements to be a "qualified person" for the purposes of NI 43-101.
5. I visited the Zaldívar Mine on October 24 to 27, 2011.
6. I am responsible for the preparation of Sections 2 to 5, 7 to 12, 14, and 23 and collaborated with my co-author on Sections 1, 6, 25, 26, and 27 of the Technical Report.
7. I am independent of the Issuer applying the test set out in Section 1.5 of NI 43-101.
8. I visited the Zaldívar Mine on January 6 to 8, 2009 as part of an audit of the 2008 year-end resource and reserve estimates.
9. I have read NI 43-101, and the Technical Report has been prepared in compliance with NI 43-101 and Form 43-101F1.

www.rpacan.com
Barrick Gold Corporation – Zaldívar Mine, Project #1683
Technical Report NI 43-101 – March 16, 2012
Rev. 0 Page 29-2
10. At the effective date of the Technical Report, to the best of my knowledge, information, and belief, the Technical Report contains all scientific and technical information that is required to be disclosed to make the Technical Report not misleading.
Dated this 16th day of March, 2012 (Signed & Sealed) “Luke Evans” Luke Evans, M.Sc., P.Eng.

www.rpacan.com
Barrick Gold Corporation – Zaldívar Mine, Project #1683
Technical Report NI 43-101 – March 16, 2012
Rev. 0 Page 29-3
RICHARD J. LAMBERT I, Richard J. Lambert, P.E., as an author of this report titled “Technical Report on the Zaldívar Mine, Region II, Chile” prepared for Barrick Gold Corporation, and dated March 16, 2012, do hereby certify that:
1. I am Principal Mining Consultant with Roscoe Postle Associates Inc. of Suite 505, 143 Union Boulevard, Lakewood, CO, USA 80227.
2. I am a graduate of Mackay School of Mines, University of Nevada, Reno, U.S.A.,
with a Bachelors of Science degree in Mining Engineering in 1980, and Boise State University, with a Masters of Business Administration degree in 1995.
3. I am a Registered Professional Engineer in the state of Wyoming (#4857), the
state of Idaho (#6069), and the state of Montana (#11475). I am licensed as a Professional Engineer in the Province of Ontario (Reg. #100139998). I have been a member of the Society for Mining, Metallurgy, and Exploration (SME) since 1975, and a Registered Member (#1825610) since May 2006. I have worked as a mining engineer for a total of 31 years since my graduation. My relevant experience for the purpose of the Technical Report is: • Review and report as a consultant on numerous mining projects for due
diligence and regulatory requirements • Mine engineering, mine management, mine operations and mine financial
analyses, involving copper, gold, silver, nickel, cobalt, uranium, oil shale, phosphates, coal and base metals located in the United States, Canada, Zambia, Madagascar, Turkey, Bolivia, Chile, Brazil, Serbia, Australia, Russia and Venezuela.
4. I have read the definition of "qualified person" set out in National Instrument 43-
101 (NI 43-101) and certify that by reason of my education, affiliation with a professional association (as defined in NI 43-101) and past relevant work experience, I fulfill the requirements to be a "qualified person" for the purposes of NI 43-101.
5. I visited the Zaldívar Mine on October 24 to 27, 2011.
6. I am responsible for the preparation of Sections 13 and 15 to 22 and collaborated with my co-author on Sections 1, 6, 25, 26, and 27 of the Technical Report.
7. I am independent of the Issuer applying the test set out in Section 1.5 of NI 43-101.
8. I have had no prior involvement with the property that is the subject of the Technical Report.
9. I have read NI 43-101, and the Technical Report has been prepared in compliance with NI 43-101 and Form 43-101F1.

www.rpacan.com
Barrick Gold Corporation – Zaldívar Mine, Project #1683
Technical Report NI 43-101 – March 16, 2012
Rev. 0 Page 29-4
10. At the effective date of the Technical Report, to the best of my knowledge, information, and belief, the Technical Report contains all scientific and technical information that is required to be disclosed to make the Technical Report not misleading.
Dated this 16th day of March, 2012 (Signed & Sealed) “Richard J. Lambert” Richard J. Lambert, P.E.