zytronic plc annual report and financial statements · pdf fileannual report and financial...
TRANSCRIPT

The world at your fingertips
Zytronic plcAnnual Report and Financial Statements 2015
Zytronic plc Annual R
eport and Financial Statements 2015
Vending
Financial
Industrial

Strategic report
Overview
Zytronic is a leading global manufacturer of touch-based products for public access and industrial applications.
In the workplace
On the street
At leisure
Over 15 years we have developed our patented PCT™ and MPCT™ sensing technologies into a family of product offerings. Operating through a network of channel partners across the globe, our integrated technologies are being used at leisure, on the street and in the workplace.
Unlike the majority of other touch technologies, the active component of Zytronic’s technology is embedded behind the glass front for protection, providing a true safety laminated, pure-glass fronted construction.
Point of saleGaming
Touch tablesFinancial
Digital signage
Industrial

Annual Report and Financial Statements 2015 Zytronic plc 01
Corporate governance Financial statementsStrategic report
Highlights
Strategic reportIFC Overview01 Highlights02 A a glance 04 Chairman’s statement05 Our competitive advantages06 Our strategy and key
performance indicators (“KPIs”)
08 Risk management09 Operational review15 Financial review
Corporate governance17 Board of Directors18 Corporate governance20 Directors’ report22 Remuneration report
Financial statementsGroup accounts25 Independent auditors’ report26 Consolidated statement
of comprehensive income27 Consolidated statement
of changes in equity28 Consolidated balance sheet29 Consolidated cashflow
statement30 Notes to the consolidated
financial statements 50 Five-year summaries
Parent Company accounts 52 Statement of Directors’
responsibilities53 Parent Company balance sheet54 Notes to the Parent Company
financial statements58 Notice of Annual
General Meeting60 Corporate information
Group revenue
£21.3m+13%
11 12 13 14
£20.
5m
£20.
4m
£17.
3m
£18.
9m
£21.
3m
15
Gross profit margin
41.9%+14%
33.7
%
11
36.3
%
12
28.4
%
13
36.6
%
14
41.9
%
15
Profit before tax (“PBT”)
£4.5m+39%
£3.6
m
11
£4.
2m
12
£1.9
m
13
£3.3
m
14
£4.
5m
15
Earnings per share
24.7p+26%
18.3
p
11
22.2
p
12
11.1
p
13
19.6
p
14
24.7
p
15
Dividends
12.0p+20%
7.7p
11
8.5p
12
9.1p
13
10.0
p
14
12.0
p
15
Cash generated from operating activities
£4.9m+17%
11 12 13 14 15
£3.7
m
£3.6
m
£3.3
m £4.
2m £4.
9m
C Group revenue increased by 13% to £21.3m (2014: £18.9m)
C Touch revenue accounted for 81% (2014: 79%) of Group revenue
C Touch sensor units sold increased to 149,000 units (2014: 139,000 units)
C Gross profit margin increased to 41.9% from 36.6% in 2014
C Profit before tax increased by 39% to £4.5m (2014: £3.3m)
C Basic earnings per share of 24.7p (2014: 19.6p) with diluted earnings per share of 24.3p (2014: 19.5p)
C Net cash generated from operating activities of £4.9m (2014: £4.2m)
C Net cash balances increased by £2.0m to £9.8m
C Total dividend for the year increased by 20% to 12.0p (2014: 10.0p)
www.zytronic.co.ukIn-depth view of our technology and applications

Zytronic plc Annual Report and Financial Statements 201502
Strategic report
At a glance
Market updates
Point of saleCustomer name: The Coca-Cola® Company
Location: USA
Industry: Food and beverage
Application: Quick service restaurants
Touch TablesCustomer name: HUMElab
Location: France
Industry: Leisure
Application: Touch table
GamingCustomer name: Shuffle Master
Location: USA
Industry: Gaming
Application: Table game for casinos
AmericasThe Americas exhibited revenue growth of 10% in 2015. The year benefited from a substantial increase in units required for the Coca-Cola® Freestyle™ project.
UKThe UK market grew by 7% in 2015, due to demand for large format MPCT™ sensors for tables.
EMEAThe EMEA region remains Zytronic’s largest exporting region accounting for 45% of total exports.
A world of touchOur integrated touchscreen technologies are being used daily across the globe in a variety of applications for leisure, on the street and in the workplace.
We continue to see increased market penetration and growth in our largest market sectors, and are exploiting the potential for our newer multi-touch and larger format touchscreens in other niche markets which require rugged, toughened glass solutions.
Touch tables
Leisure
Point of sale
Annual Report and Financial Statements 2015 Zytronic plc 03
Corporate governance Financial statementsStrategic report
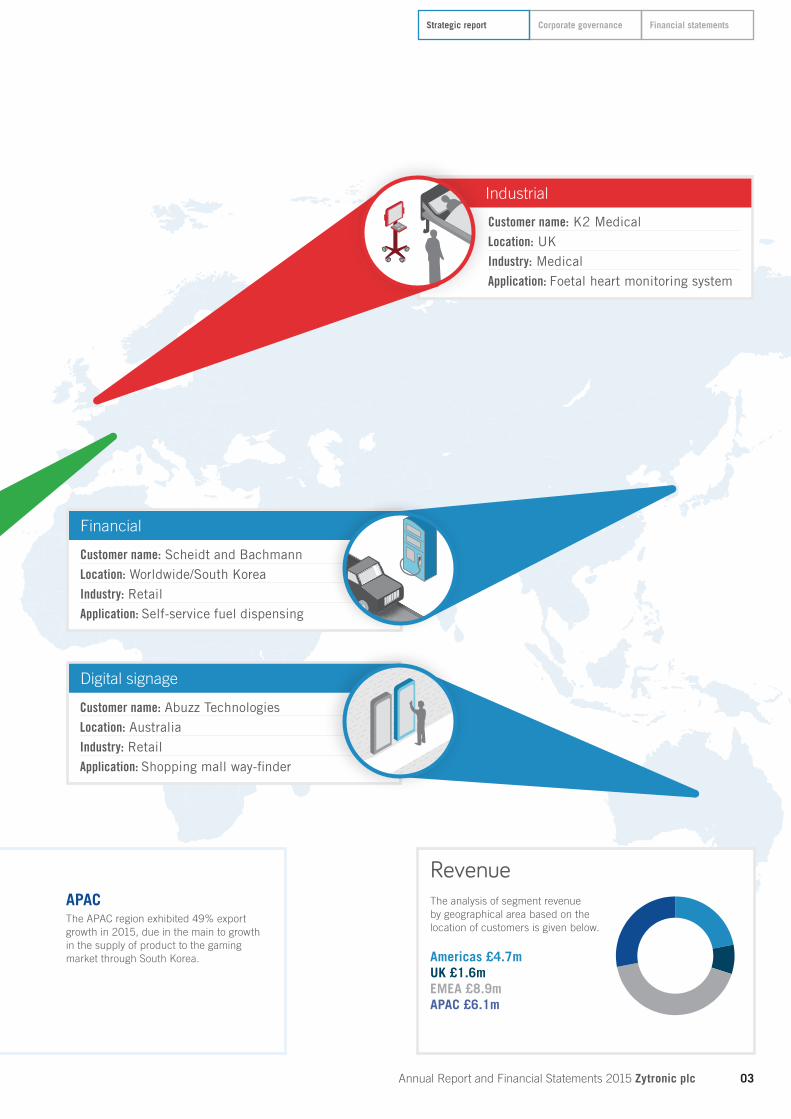
IndustrialCustomer name: K2 Medical
Location: UK
Industry: Medical
Application: Foetal heart monitoring system
FinancialCustomer name: Scheidt and Bachmann
Location: Worldwide/South Korea
Industry: Retail
Application: Self-service fuel dispensing
Digital SignageCustomer name: Abuzz Technologies
Location: Australia
Industry: Retail
Application: Shopping mall way-finder
APACThe APAC region exhibited 49% export growth in 2015, due in the main to growth in the supply of product to the gaming market through South Korea.
RevenueThe analysis of segment revenue by geographical area based on the location of customers is given below.
Americas £4.7mUK £1.6mEMEA £8.9mAPAC £6.1m
Industrial
Financial
Digital signage
22+8+42+28+G

Zytronic plc Annual Report and Financial Statements 201504
Strategic report
Chairman’s statement
Continued growthWe have seen an increase in demand for our proprietary touchscreen products and a continuing improvement in revenues, margins and profits.
Summary C Profit after tax increased by 27% to £3.8m (2014: £3.0m)
C EPS increased by 26% to 24.7p (2014: 19.6p)
C Total dividend for year increased by 20% to 12.0p (2014: 10.0p)
C Touch revenue accounts for 81% of Group revenue (2014: 79%)
C Gross profit margin increased to 41.9% from 36.6%
C Net cash generated from operating activities of £4.9m (2014: £4.2m)
C Net cash balances increased by £2.0m to £9.8m
We are pleased to announce a significantly improved set of results for the year ended 30 September 2015 with performance benefiting from both volume and revenue growth in the supply of our touch sensor products.
ResultsRevenues for the year ended 30 September 2015 increased by 13% to £21.3m (2014: £18.9m); profit before tax increased by 39% to £4.5m (2014: £3.3m); and basic earnings per share increased by 26% to 24.7p (2014: 19.6p).
The significant improvement in performance this year has principally arisen from a 16% revenue growth in our proprietary touch sensor products to £17.3m (2014: £14.9m), which accounted for 81% (2014: 79%) of sales and was one of the main contributors to the improvement in gross profit margin from 36.6% to 41.9%.
As Mark Cambridge, our CEO, describes in his comprehensive Operational review, volumes of our touch sensors supplied in the year grew by 7%, notwithstanding the end of life effects in the first quarter of the year of projects in the telematics and fuel vend markets. In ultra large sensors
greater than 30 inches, a key performance and growth target area for Zytronic, we experienced an approximate 50% increase in volume over the prior year, reflecting the benefit of work done in the further commercialisation of our patented mutual capacitive products and curved sensor solutions. Sales across our key growth sectors of financials, vending and gaming, where the unique capabilities and durability of our products is a prerequisite, all showed growth.
The Group continues to convert a high proportion of its profits into cash with cash generation from operating activities for the year ended 30 September 2015 being £4.9m (2014: £4.2m). We have continued our policy of further research and development, and capital equipment investments, with investment activities for the year totalling £1.3m (2014: £0.5m). Cash generation continues to support our progressive dividend policy with dividends paid during the year of £1.6m (2014: £1.4m).
DividendThe Directors propose a final dividend of 8.87p (2014: 7.16p) payable on 11 March 2016 to shareholders on the Register on 26 February 2016, which increases the total dividend for the year by 20% to 12.01p (2014: 10.01p) at a total cost for the year to 30 September 2015 of £1.8m.
OutlookThe year has started positively with maintained momentum and a continued drive to develop product functionality and expand the global sales footprint. We continue the focus on increasing shareholder value and shall update shareholders on progress and material developments during the course of the coming year.
Tudor Davies BScChairman7 December 2015
“ Revenues for the year ended 30 September 2015 increased by 13% to £21.3m.”
Annual Report and Financial Statements 2015 Zytronic plc 05
Corporate governance Financial statementsStrategic report
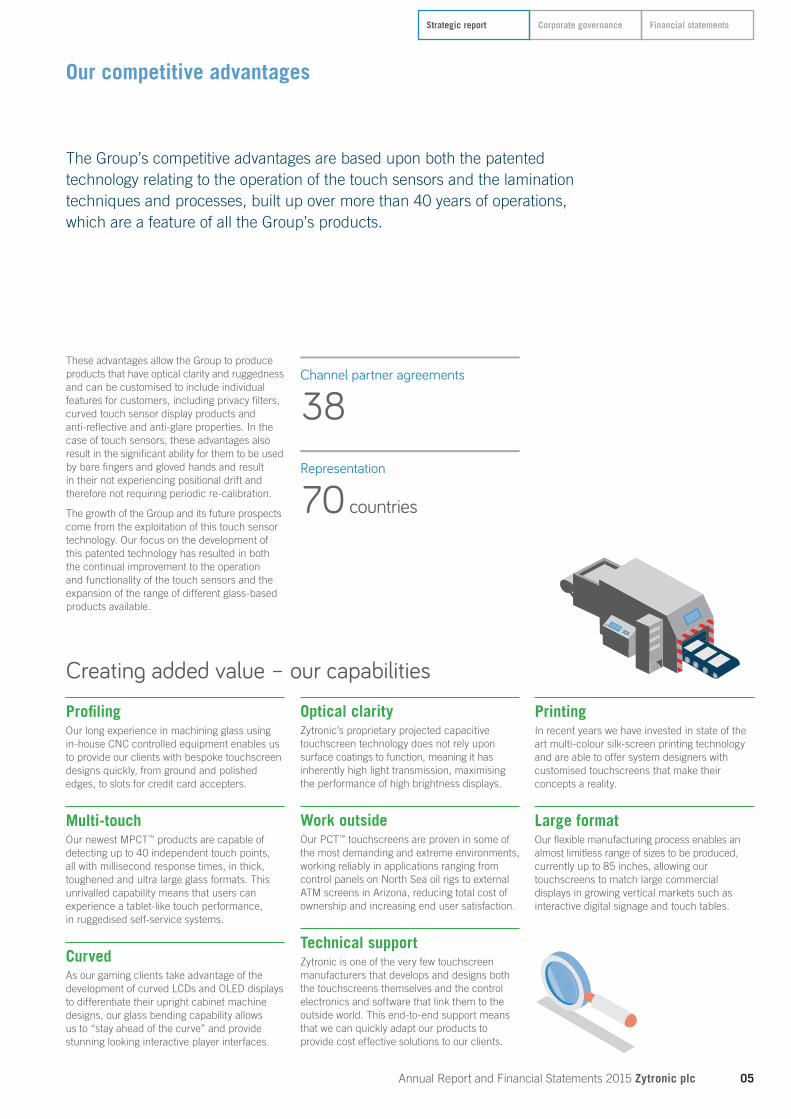
These advantages allow the Group to produce products that have optical clarity and ruggedness and can be customised to include individual features for customers, including privacy filters, curved touch sensor display products and anti-reflective and anti-glare properties. In the case of touch sensors, these advantages also result in the significant ability for them to be used by bare fingers and gloved hands and result in their not experiencing positional drift and therefore not requiring periodic re-calibration.
The growth of the Group and its future prospects come from the exploitation of this touch sensor technology. Our focus on the development of this patented technology has resulted in both the continual improvement to the operation and functionality of the touch sensors and the expansion of the range of different glass-based products available.
Creating added value – our capabilities
The Group’s competitive advantages are based upon both the patented technology relating to the operation of the touch sensors and the lamination techniques and processes, built up over more than 40 years of operations, which are a feature of all the Group’s products.
Representation
70 countries
Channel partner agreements
38
ProfilingOur long experience in machining glass using in-house CNC controlled equipment enables us to provide our clients with bespoke touchscreen designs quickly, from ground and polished edges, to slots for credit card accepters.
Multi-touchOur newest MPCT™ products are capable of detecting up to 40 independent touch points, all with millisecond response times, in thick, toughened and ultra large glass formats. This unrivalled capability means that users can experience a tablet-like touch performance, in ruggedised self-service systems.
CurvedAs our gaming clients take advantage of the development of curved LCDs and OLED displays to differentiate their upright cabinet machine designs, our glass bending capability allows us to “stay ahead of the curve” and provide stunning looking interactive player interfaces.
Optical clarityZytronic’s proprietary projected capacitive touchscreen technology does not rely upon surface coatings to function, meaning it has inherently high light transmission, maximising the performance of high brightness displays.
Work outsideOur PCT™ touchscreens are proven in some of the most demanding and extreme environments, working reliably in applications ranging from control panels on North Sea oil rigs to external ATM screens in Arizona, reducing total cost of ownership and increasing end user satisfaction.
Technical supportZytronic is one of the very few touchscreen manufacturers that develops and designs both the touchscreens themselves and the control electronics and software that link them to the outside world. This end-to-end support means that we can quickly adapt our products to provide cost effective solutions to our clients.
PrintingIn recent years we have invested in state of the art multi-colour silk-screen printing technology and are able to offer system designers with customised touchscreens that make their concepts a reality.
Large formatOur flexible manufacturing process enables an almost limitless range of sizes to be produced, currently up to 85 inches, allowing our touchscreens to match large commercial displays in growing vertical markets such as interactive digital signage and touch tables.
Our competitive advantages

Zytronic plc Annual Report and Financial Statements 201506
Strategic report
Our strategy
Our mission is to increase the profitability of our business by growing revenues from touch sensors through continual improvement and development of our PCT™ and MPCT™ touch technologies.Our aim is to continue to roll out sales channels around the world, while investing in the manufacturing facilities and personnel to enable the Group to meet that sales growth.
InnovateWe identify development projects that will enhance our technology, increase its ease of use and functionality for customers and end users, and listen to existing and potential customers and our markets on future requirements.
GrowWe continue to seek opportunities to expand our sales channels across the world. We have new additions in the USA and China and aim to establish representation in new countries, for example Indonesia, and in the Middle East.
What we did in 2014/2015
C Four of our six MPCT™ GB patent applications were granted with the final two still awaiting further examination.
C We have developed software that is specifically tuned for shape recognition, rather than individual fingers, to be used in retail and advertising markets.
C We commenced the project to develop an MPCT™ Application Specific Integrated Chip (“ASIC”) to reduce the footprint and cost of our multi-touch controllers.
Our priorities for 2015/2016
C Release a new MPCT™ controller designed specifically to work with sensors <20 inches in size.
C Continue to develop the ASIC.
C Commercialise encrypted touch solutions with Cryptera®.
Our priorities for 2015/2016
C Expand the direct sales in North America with further recruitments for Zytronic Inc.
C Develop sales channel partnerships across South East Asia and Central America.
What we did in 2014/2015
C We continued to sell more units in 2015 than in 2014.
C We opened a representative office in Taiwan to increase our sales opportunities in the Greater China region.
C We employed a regional specialist sales consultancy organisation in Japan to further develop this market.
C To further develop our presence in the market for flexible plastic sensors, we appointed a sales consultancy company with specific market and product knowledge.

Corporate governance Financial statementsStrategic report
Annual Report and Financial Statements 2015 Zytronic plc 07
InvestWe review our manufacturing methods regularly to bring through efficiencies in production. We add new plant and equipment each year, as necessary, to add capacity and replace old equipment. We invest in our marketing activities to promote our business on a global level.
Our priorities for 2015/2016
C Exhibit at market specific trade shows such as GITEX, ISE, DSE and G2E Macau.
C Develop a production engineering training apprenticeship scheme.
What we did in 2014/2015
C We expanded and refurbished our original cleanroom to give increased manufacturing capabilities and ensure consistency of our facilities across the business.
C We exhibited at G2E, ISE, DSE and Electronica during the year. Our products were also well exhibited at a number of local trade shows through our regional partners.
C We strengthened our digital PR approach during the year and also changed our trade PR agency to enable better coverage in key markets.
Measuring our performance
Our key performance indicators reflect the business’ financial success throughout the year.Commentary on the actual performance of the Group against each of these KPIs is set out in the Chairman’s statement and the Operational and Financial reviews.
C The current KPIs consist of: setting targets for and monitoring the level and growth of sales; improving the gross profit margin; controlling the level of overheads (administration expenses); and managing cashflow from operating activities.
C In addition, the Directors review a sales pipeline log which the sales team uses to record validated sales opportunities, the key dates in the development of each sales prospect with the customer, volumes and values of the opportunities and expected production commencement dates.
Group revenue
£21.3m+13%
Administration expenses
£4.1m+17%
£3.2
m
11
£3.1
m
12
£2.9
m
13
£3.5
m
14
£4.
1m
15
Gross profit margin
41.9%+14%
Cash generated from operating activities
£4.9m+17%
11 12 13 14
£20.
5m
£20.
4m
£17.
3m
£18.
9m
£21.
3m
15
33.7
%
11
36.3
%
12
28.4
%
13
36.6
%
14
41.9
%
15
11 12 13 14 15
£3.7
m
£3.6
m
£3.3
m £4.
2m £4.
9m

Zytronic plc Annual Report and Financial Statements 201508
Strategic report
Risk managementKey no change decreased risk increased risk
Risk description Mitigation Change
Advances in competing technologiesThe main risk to the Group’s business is that of advances in competing technology, whereby a new, better touch sensor technology is created.
Management is very conscious of this and monitors competitors’ developments and changes within the whole industry. By continually developing and evolving its own technologies, the Group expects to build upon its competitive strengths and thereby keep its technology ahead of its competitors.
Downward price pressures from competing technologiesThis is most prevalent in the lower valued touch sensor sector dominated by resistive, capacitive and surface acoustic wave touchscreens. However, price pressure in those markets does have a knock-on effect on prices throughout the industry: new, better touch sensor technology is created.
Management has successfully met these challenges to date by re-designing and re-engineering the ZYTOUCH® touch sensor in developing the ZYPOS® touch sensor. This enabled the Group to reduce the cost of manufacture and therefore the sales price for subsequent touch sensor designs and has allowed the Group to enter markets that were previously closed to it on price grounds. The Group has subsequently taken the touch sensor manufacturing process changes and applied them to the re-design and manufacture of the optical display filters which it also produces.
Increasing costs of raw material suppliesThere are continual upward pressures on the cost of raw material supplies, many arising from increases in oil prices and energy costs. Raw materials can also be purchased in US Dollars and Euros, whereby movements in exchange rates can affect the pricing.
Management continually reviews the sources and costs of raw material supplies, the design of the Group’s products and the operational processes that are used in the manufacture. Where possible, it has used increases in volume purchases to obtain price reductions, discounts and improved specifications. Foreign exchange contracts are in place to mitigate FX movements.
Managing increases in the overhead baseWith the significant time that may occur between meeting potential customers and receiving first orders, management must ensure that the capacity of its factories is adequate for future growth in sales and the development of the business, while managing the profitability of the Group.
This is not straightforward when the business is developing new products and manufacturing processes and when the visibility and timing of orders from customers is unclear. Management uses a comprehensive sales pipeline model to monitor potential future sales levels and has built in a degree of flexibility to its two main factories, one of which has been further enhanced during the year.
Risks associated with currency movementsA large proportion of the Group’s sales are denominated in US Dollars and Euros, so the Group is subject to risks associated with currency movements. It is the Group’s policy to manage these risks and provide a degree of certainty for cashflows into the UK without taking the risks of speculative positions.
Natural hedging is adopted to manage currency risk, whereby goods and services are sourced from Europe and the USA and the liability arises in the respective currencies. Surplus currency is then protected through the use of forward foreign exchange contracts for a period of twelve to 18 months ahead. This ensures the business knows its position around FX in the current year.
Risks associated with timing of customer projectsOne of the main risks to the business is that of the timing of customer projects, where as a component supplier we are wholly reactive to our customer demands.
The demands of our customers are not something we can control so in order to mitigate this risk we constantly strive to have a diversified customer base with multiple projects over different time periods occurring at any one time. We regularly review a project log to ensure we are capturing up to date information regarding pipeline projects.

Annual Report and Financial Statements 2015 Zytronic plc 09
Corporate governance Financial statementsStrategic report
Operational review
Continued growth
Summary C Total revenue grew by 13% to £21.3m (2014: £18.9m)
C Touch revenue accounts for 81% of Group revenue (2014: 79%)
C Touch sensor units sold increased to 149,000 units (2014: 139,000 units)
C Gross profit margin increased to 41.9% from 36.6% in 2014
C Profit before tax increased by 39% to £4.5m (2014: £3.3m)
The following Operational review provides information on the sales and marketing, research and development and operational activities of the business during fiscal year 2015 and, except where otherwise indicated, draws comparisons with the previous year.
OverviewThe 2015 fiscal year has shown significant improvement in trading over the previous year, continuing the historic trend of second half trading being better than the first.
Total 2015 revenues of £21.3m were stronger than those of 2014 by 13% (2014: £18.9m). Revenues generated by sales of touch products at £17.3m accounted for 81% (2014: 79%) of total revenues and were 16% higher than the prior year (2014: £14.9m). Revenues generated by sales of non-touch products of £4.0m (2014: £4.0m) were unchanged, even though ATM product revenues, as expected, declined by £0.6m to £2.3m from the £2.9m of 2014.
In a similar fashion to that of last year, 2015 has benefited considerably from a higher level and better mix of touch product sales in the year, especially in the second half of 2015 as shipments of a curved 42-inch multi-touch sensor design began. This, together with management actions to maintain and improve cost control and production efficiencies during the year, resulted in a significantly higher gross margin of 41.9% (2014: 36.6%) and a resultant 39% increase in profit before tax to £4.5m (2014: £3.3m).
SalesZytronic continues to be heavily export focused, with £19.7m or 93% (2014: £17.6m, 94%) of revenues attributable to export sales.
The largest area of export growth was attributable to sales to the Asia Pacific (“APAC”) region, which saw an increase in revenue of £2.0m to £6.1m. The region was significantly influenced by a £2.3m increase in South Korean revenues to £2.8m, mostly for supplies into the gaming market.
Mainland China, which is driven in the main by ATM sales, accounted for £1.9m of total APAC revenues (2014: £1.9m). The most significant year-on-year reduction affecting APAC revenues was the end of life of an agricultural telematics project for an Australian customer, which significantly contributed to the £0.3m (50%) reduction in Australian revenues.
The EMEA region (Europe, Middle East and Africa, excluding the UK) remains by far Zytronic’s largest export region at £8.9m or 45% of total exports (2014: £9.2m, 52%). The revenue decrease observed in this region is mainly attributed to the £0.5m reduction in non-touch product revenues in the financial market, across Germany, Hungary and the Netherlands. Other contributing factors were associated with the vending market with a fuel service payment terminal touch project in Benelux which concluded at the start of the second quarter of the year.
The Americas, significantly influenced by sales in the gaming market in 2014, exhibited total revenue growth in 2015 of nearly 10% to £4.7m, which accounts for 24% of total exports (2014: £4.3m, 24%). Gaming in the Americas during 2014 was predominantly driven by direct supply into Las Vegas-based equipment manufacturers for casino cabinet slots, which during the year reduced as some machines approached end of life and new designs were being developed, with a change in the resultant supply chain in 2015 through South Korea. The 2015 period has benefited from the substantial increase in the purchase of units through Canada for the Coca-Cola® Freestyle™ drinks dispensing touch project, which was triggered by an end of life notification for the LCD unit used in the existing design.
Revenues from UK sales grew in 2015 by 28% to £1.6m (2014: £1.2m). The main driver of growth was the work undertaken by Zytronic in providing ultra-large format touch products to an interactive table manufacturer for the retail sector, and in particular a project for a car showroom deployment across a number of European outlets associated with the launch of a new car model.
“ Total 2015 revenues of £21.3m were stronger than those of 2014 by 13% (2014: £18.9m).”

Zytronic plc Annual Report and Financial Statements 201510
Strategic report
Operational review continued
Sales continuedNon-touch product salesThe non-touch product revenues of £4.0m (2014: £4.0m) were higher in the year than management’s forecast. This has been mostly attributable to the £0.4m of revenues generated by the uptake of a curved non-touch display unit into APAC, used in the same design of casino cabinets as the touch sensor provided. In total, non-touch ATM product revenues (display filters (curved and flat), electronic noise filtering laminates, light diffusers and sundries) increased by £0.6m to £1.7m (2014: £1.1m). However, even though non-touch revenues did not in totality decrease against those of 2014 as expected, the revenues from the largest contributor of ATM display filter glasses did decline, contributing £2.3m compared with the £2.9m in 2014.
The following table provides details on the regional export split of non-touch revenues:
2015 2014 Variance
Export regions Value £m % export Value £m % export Value £m %
EMEA 2.1 62 2.3 67 (0.2) (9)APAC 1.1 32 0.9 26 0.2 22Americas 0.2 6 0.3 7 (0.1) (33)
Totals 3.4 100 3.5 100 (0.1) (3)
Touch product salesTouch revenues of £17.3m grew by 16% (£2.4m) over the £14.9m reported for 2014 and accounted for 81% of total revenues (2014: 79%). The total touch revenues comprise £15.0m for sensors (2014: £13.3m) and £2.3m for electronic controllers and componentry (2014: £1.6m).
Touch export revenues in 2015 account for £16.3m or 94% of the £17.3m of total touch revenues, which represents a £2.2m or 15% increase (2014: £14.1m, 95% of £14.9m). The split of regional export revenues is illustrated in the following table:
2015 2014 Variance
Export regions Value £m % export Value £m % export Value £m %
EMEA 6.8 42 6.9 49 (0.1) (1)APAC 5.0 31 3.2 23 1.8 56Americas 4.5 27 4.0 28 0.5 13
Totals 16.3 100 14.1 100 2.2 16
The total volume of sensor units sold increased by 10,000 units to 149,000 units (2014: 139,000). The mix of the volume of sensors sold by the key sensor size ranges is shown in the following table:
2015 2014 Variance
Sensor sizes Units (thousands) % total Units (thousands) % total Units (thousands) %
0–14.9" 42 28 46 33 (4) (9)15.0–29.9" 98 66 87 63 11 1330.0"+ 9 6 6 4 3 50
Totals 149 100 139 100 10 7
Of the 9,000 units sold that were >30 inches in size 6,000 (67%) were of the higher functional performance mutual projected capacitance technology (“MPCT™”) type.
Zytronic plc Annual Report and Financial Statements 201510

Corporate governance Financial statementsStrategic report
Annual Report and Financial Statements 2015 Zytronic plc 11Annual Report and Financial Statements 2015 Zytronic plc 11Annual Report and Financial Statements 2015 Zytronic plc 11
Introducing ZYFILM® Multi-touch
Financial touchscreen trends
Zytronic has extended its offering with the introduction of a rollable and extremely flexible touch film to complement its range of award-winning glass touch sensors. The flexible film, which utilises the Company’s proprietary Multi-touch Projected Capacitive Technology (“MPCT™”), is expected to prove particularly popular in retail and other digital signage applications that require large, eye-catching interactive displays.
The new film gives customers the option of creating their own touchscreen displays by laminating the film onto the rear of a transparent substrate – such as a shop window – and combining it with a projector or LCD. Currently available in sizes up to 85 inches, the polyester touch foils can be deployed in semi-permanent and permanent applications when correctly laminated to a suitable substrate.
Used in conjunction with Zytronic’s ZXY200 and ZXY300 multi-touch controllers, the touch foils are capable of detecting up to 40 simultaneous touch points through glass thicknesses of 10mm. This results in a cost effective interactive solution with class-leading touch performance. The thinner construction of the new ZYFILM® touch foils means that they can be packed in tubes when shipped in small quantities, minimising transportation costs. When mounted on the rear surface of a protective substrate, the projected capacitive sensor is well protected and highly resilient to the rigours of everyday public use.
In recent years there has been an evolution in the financial services sector. The emergence of internet and phone banking has appealed to a new tech savvy generation of users who demand real time updates and fast responses to meet demanding lifestyles; contactless payments and touch sensors are in, buttons and keyboards are undeniably out.
To keep up with demands financial institutions have really stepped up. They are increasingly focusing on improving the customer experience and offering more convenient services. Using digital technologies branches are becoming more like showrooms, where large format touch tables with multi-touch operation, wall-mounted displays using high definition graphics and self-service kiosks are now commonplace. The new Post Office digital concept store is an example of this.
The humble ATM has also evolved to offer greater levels of automation and can be used for not only banking transactions but is now a highly sought after advertising space. This has led to more advanced ATMs, where dual and multi-touch function is increasingly expected, with an almost secondary function of interactive digital signage, all the while still meeting the high demands expected from outdoor, unattended terminals.
The trend for no-fuss digital solutions means we are seeing more and more transactions, particularly in the retail sector where payments are being made through apps and “bolt-ons” to tablets or smartphones. Rather than using traditional cash registers or till operations, transactions are being made and sensitive details transferred quickly on shop floors and temporary Point of Service units. It has always been integral for banking businesses to utilise terminals that can withstand acts of vandalism, impacts and severe weather conditions. The evolution of ATMs now means banking institutions can offer display protection as well as encrypted touch and interactive digital signage, creating secure, functional points of service and payment transactions that customers can rely on.
A rollable, flexible projected capacitive touch film
Cryptera leads the way with CryptoTouch®

Operational review continuedStrategic report
Zytronic plc Annual Report and Financial Statements 201512
Financial The financial market continues to be our largest, accounting for £6.3m (2014: £5.7m) of revenues, and includes application uses such as ATMs, bill payment kiosks and financial point of information (“POI”) kiosks. This market remains the strongest touch market area due to the unique durability, reliability and all-weather capabilities of our touch products and technologies, especially for unattended use and locations. The year started to see the benefit from a new platform launch by one of our major ATM customers, where Zytronic is providing multiple different sized touch sensors used in the same ATM machine. Consequently, this, coupled with a level of growth from existing designs, gave a total volume increase in ATM units.
As observed in 2014, we again experienced a reduction in financial type kiosks, partly countering the increase in the ATM volumes.
Vending Vending maintains its ranking as the second largest touch market area for Zytronic in both revenue and volume, with revenue growth across all constituent applications of 24% to £3.7m (2014: £3.0m). There were two major factors that influenced the overall performance of this market during the year, the first being the positive uplift in the Coca-Cola® project mentioned earlier, where the uplift in the volume of sensors sold was nearly double the units sold in 2014. However, this was countered by a volume and revenue reduction of sales across our fuel vend application area, which in the main had an effect on EMEA sales, as described earlier.
Industrial, gaming and healthcare Sales into the industrial market for human machine interface (“HMI”) control devices and general application kiosks were similar to those of 2014 at £2.0m (2014: £2.0m).
Significant growth in the year has been observed in the gaming market, which showed the highest percentage revenue growth of all Zytronic touch markets at 80%. In revenue terms the growth was £1.5m to £3.4m (2014: £1.9m). Approximately a third of all units supplied in the year were for a new curved 42-inch MPCT™ design, supplied into the market through a South Korean display integrator customer, replacing a flat designed PCT™ model to the same end market.
The healthcare market also exhibited sales growth in both revenue and volume, due in the main to sales to a Singaporean manufacturer of a blood analyser unit. Healthcare revenues increased to £0.4m from £0.3m.
Telematics, signage and home We did experience a decline in revenues from the telematics and signage markets, the former being significantly influenced by the end of life of an agricultural GPS project which declined by £0.5m to £0.1m. Revenues from the signage market also declined by £0.2m (2014: £1.4m), as the mix of larger sized units supplied (>30 inches) decreased, whilst the total volume across all sizes increased by 6%.
The home market, which was solely influenced in 2015 by sales of the Bosch cooktop unit, also saw an increase and was in line with management expectations for the year.
R&DThe research and development team (“R&D”) during the year have continued to concentrate on both product and process improvements.
At the beginning of the year, R&D concluded development and the subsequent production release of an improvement to the existing PCT™ controller, which in 2015 accounted for 96% of touch sensors produced (MPCT™: 4%). This new controller utilises a frequency hopping technique to tune into the least noisy frequency across a range of controlled frequencies for maximum performance.
The team also initiated development of a new MPCT™ controller for sensor sizes of <20 inches. This controller when coupled with a Zytronic MPCT™ sensor design will provide tablet-like performance for the harshest of environments for up to ten individual yet simultaneous touches. The development has the potential to drive performance and functional improvements into the 89% of the units <20 inches in size that Zytronic has produced during 2015. It is anticipated that a production release will occur early in 2016.
In combination with further developments of the MPCT™ controller electronics, R&D has initiated the design and development of a second Zytronic Application Specific Integrated Chip (“ASIC”), which will drive cost savings, performance improvements and PCB size reductions across the MPCT™ family of controllers. As this is a twelve to 18 month project, the above benefits will become realisable from 2017.
During the year, four of the six MPCT™ GB patent applications made in May 2012 were granted, being: GB2502596, GB2502598, GB2502600 and GB2502602. The final two GB applications are still awaiting further examination.
Additional developments have been undertaken to improve material performance aspects of the sensors, being either PCT™ or MPCT™ designs, and include specialist anti-reflective coated materials to improve the optical performance of the touch sensors in high bright outdoor conditions as well as antimicrobial glass to aid in reducing the potential for the transmission of microbes from one user to another through the touch interaction process.
The underlying technology and physical nature of the hardware are two of the four key components that make up a touch solution, the other two being the firmware which resides within the processor on the electronics which translates the technology interaction to an output for the computer system, and the operating system driver, which translates the incoming output from the electronics to an interaction on the system display.
It is in the two latter key components where a considerable amount of the developed Zytronic IP resides, in both PCT™ and MPCT™. R&D’s work on firmware improvements is continuous and ensures end use equipment compatibility, whilst software development is more ad-hoc as the type and requirements of the computer operating system (“OS”), such as Windows, Linux, Android and Mac, are continually being changed and improved upon by their providers.
During the year, the engineers have further improved the ZyConfig Tool, which is Zytronic’s own developed software set-up, monitoring and diagnostic tool for compatibility with the OSs named above, with the aim of driving towards a single tool set which covers under one release, all OS. They have also during the year developed software that is tuned specifically for shape recognition rather than individual finger touches, as that level of functionality has also become a request for some flat surface interactive table applications, especially in retail and advertising markets.
Over the year the engineers have continued the firmware and software development work with Cryptera A/S, the globally renowned Danish encryption device design and manufacturing specialist, on CryptoTouch®, an encrypted touch solution for ATM and unattended transactional self-service payment markets.

Annual Report and Financial Statements 2015 Zytronic plc 13
Corporate governance Financial statementsStrategic report
During the year Zytronic has also partnered with a European Commission consortium group, comprising academic and industrial partners, under the European Horizons 2020 fund to evaluate and develop, over a three-year period, high resolution and small feature-sized inkjet printing techniques for printed electronics. Zytronic’s involvement is to determine the potential for a developed solution as a method for 2D printing of metallic fluids for touch sensors, as a means of complementing its present manufacturing processes.
Strategic initiativesAs a significantly export focused business, Zytronic has continued to evaluate its regional routes to market, looking to adapt and improve upon the flourishing development of the sales channel partnerships that it has around the world.
With the successful establishment in 2014 of the USA entity Zytronic Inc. in Atlanta, Georgia, a wholly owned subsidiary of Zytronic Displays Ltd, to offer on-the-ground and in-region technical support, the Group assessed the need to repeat the process in Asia. After a thorough evaluation, it was agreed that the primary effort across the Greater China Region should initially be focused towards business development and sales opportunity generation rather than technical support.
It was to this end that, in April 2015, Zytronic Displays Ltd opened up a representative office in Taipei, Taiwan, to service sales opportunity generation across Greater China, which includes mainland China, Macau, Hong Kong and Taiwan. To facilitate a quick deployment, Zytronic employed directly the key employee from its regional Taiwan partner, who had worked on its behalf on the Zytronic account for over five years and was therefore very familiar with the products offered.
From June 2015, Zytronic has also employed in Tokyo, Japan, a regional specialist sales consultancy organisation to further develop the Japanese market, through close collaboration with its existing sales channel partner, and to provide services and directly promote the Zytronic Japan entity.
Since inception, Zytronic has been well established as a glass touch sensor producer to the market, but has been aware of the developing need for smaller volumes of larger sized flexible plastic sensors, which can be adhered to in-field glass surfaces in less controlled environments. To continue to explore the market potential for these types of products, Zytronic has appointed a sales consultant with specific market and product knowledge to develop further its presence for this particular product type.
Unfortunately, the initiative in mainland China mentioned in the 2014 report, and referred to as FastTrack China, did not prove as successful as hoped, due to local initiative funding issues in China. This has resulted in FastTrack China drawing to a premature close.
The overall channel partner network has increased by a net one to 38 during 2015, with 14 agreements across the Americas, eleven agreements across APAC, twelve agreements across EMEA and one in the UK. The net change in the year has been attributable to the termination of two representatives in the USA, with their territories being covered either directly or through the extension of an existing representative and the appointment of three new partners, TouchMedia (Singapore), MPU (China) and Cloud Technologies (India). The increase in agreements does not fully represent the changing landscape as the number of active countries now covered has more significantly increased from 60 in 2014 to 70 in 2015 and includes Argentina, Brazil, the UAE, Vietnam, Indonesia, the Philippines, Cambodia, Laos and Myanmar. Some of this coverage has been as a consequence of widening the area of coverage of some of its established partners as well as adding new representatives.
Zytronic is continually evaluating its channel partner network and looking to fortify it with new appointments and territories, whilst also expanding its own direct footprint through planned future sales personnel recruitment for Zytronic Inc.
“ During the year, four of the six MPCT™ GB patent applications made in May 2012 were granted.”

Zytronic plc Annual Report and Financial Statements 201514
Strategic report
Operational review continued
Marketing The Group’s sales efforts during 2015 have continued to be underpinned with a focused marketing endeavour to strengthen its digital PR including YouTube®, LinkedIn® and Twitter® to work more in tandem with its traditional printed PR. During the year, it has evaluated its trade PR processes and recognised that coverage in key markets such as the USA and China was not as responsive as required, and has changed agency to one which has brought a co-ordinated approach to those regions by partnering up with local region-specific agencies to improve the Zytronic trade PR.
During the year, the Group participated at the Electronica Expo in Munich, Germany, the Integrated Systems Europe (“ISE”) exhibition in Amsterdam, the Netherlands, the Digital Signage Expo (“DSE”) as well as the Global Gaming Expo (“G2E”) in the USA. Indirectly, products were also well represented at a number of tradeshows by either customers or suppliers at the ICE Totally Gaming Expo in London and the Society of Information Displays Expo (“SID”) and the Infocomm Expo, both in the USA.
A range of “How To” instructional videos were also compiled during the year and uploaded onto the Zytronic YouTube® channel, https://www.youtube.com/user/ZytronicTouchSensor/videos, as well as new corporate and investor videos to aid in the sales and marketing process.
Opportunities analysisAs a project-based business, Zytronic maintains an active log to monitor all valid touch enquiries raised by the sales channel partners, regional sales managers and business development managers in the normal course of business. Enquiries are separated into the key market sectors and range in size and value depending upon the quantity, sensor size and constraints of the products required.
The activity log is updated as new opportunities are added, and monitored and reviewed on a monthly basis, where, depending upon the level of activity having been undertaken at that point in time in relation to an enquiry and its prospect of success, the status of an enquiry is subsequently moved over time into Projects and Prospects. Projects are defined as those enquiries which have either an immediate likelihood of success, or a longer term high probability of success. It is normal, as time progresses, for Prospects to, therefore, become Projects, or on rare occasions, vice versa.
During the course of the financial year, the log increased through the addition of 314 opportunities. A total of 141 opportunities moved into production and 172 opportunities became inactive, leaving 360 active opportunities at 30 September 2015.
Of the 360 active opportunities, 68 are of Project status and are comprised of: 14 Projects that were in the log and active pre 30 September 2014, 15 Projects that were at Prospect status pre 30 September 2014 and re-rated to Project status during the course of the year and 39 newly added Projects. The 68 Projects are divided into the following market sectors: six in finance, two in gaming, 25 in signage, 14 in vending, 16 in industrial and five in other.
OperationsThe maintenance and improvement of the cost controls and production efficiencies established during 2014 continued into 2015 in the form of tight labour controls to accommodate the inevitable month-on-month variability the Group encounters as a project driven, short visibility and low volume bespoke component manufacturer. At the start of the period, the productive labour complement was 92 people, comprising 89 permanent employees and three on temporary contracts. By the period end, the complement had increased by five, with 83 employees on permanent contracts and 14 on temporary.
As reported in the 2014 review, in early 2015 the Group undertook a review of the touch manufacturing capacity and capability requirements across the three factory facilities. This resulted in a capital project being undertaken over 2015 to remove the oldest section of its original 1989 cleanroom and refurbish its existing 2001 cleanroom to expand into the floor space created. This has increased its total touch sensor manufacturing cleanroom footprint within the business by 25% to 10,000 ft2.
In addition, Zytronic invested during the year in several new 2D direct write electrode printing machines and a further automated laminator, to increase throughput of ultra large, up to 65-inch touch sensors. A new computer-controlled glass profiling machine was also installed to replace an older obsolete machine, allowing Zytronic to improve the finish of the edges of its glass across much larger glass sizes than previous, whilst extending the range of customisations the Group can offer in the supply of its bespoke touch sensors.
To conclude, I would like to take this opportunity on behalf of the Board to thank all Zytronic employees who have contributed to the strong performance of the business during 2015.
Mark Cambridge BSc (Hons), FIoDChief Executive Officer7 December 2015

Annual Report and Financial Statements 2015 Zytronic plc 15
Corporate governance Financial statementsStrategic report
Financial review
Curved products
Standing head and shoulders above the crowdLarge concave touchscreen displays have the ability to absorb the user in an all-encompassing environment, immersing them in the content and enhancing their experience. This was seen in practice at the Global Gaming Expo in Las Vegas in 2014 and 2015 where a number of upright cabinet slot machines were on display. Featuring a dual 42-inch display and curved touchscreen, the unit stands tall amongst a sea of bright and flashing casino games.
Touchscreen technology like never beforeDuring the design process of a display unit, gaming cabinet, vending machine or kiosk, aesthetics are sometimes secondary to usability. However, with Zytronic projected capacitive technology (“PCT™”), incredible functionality and proven performance go hand in hand with near limitless levels of customisation, so design ideas are rarely compromised. Combining cutting edge touch sensing electronics, PCT™ allows for beautifully responsive, accurate and rugged touch sensing.
Multi-touch sensors can boost the density of touch data captured by the screen, significantly increasing touch resolution whilst still maintaining millisecond response times. Supporting up to 40 simultaneous touch points, multi-user designed product experiences are enriched by the capabilities of MPCT™ multi-touch sensors. By creating these surfaces in which multiple users can interact simultaneously, sharing their experiences, new opportunities have arisen for companies using touch displays.
MPCT™ touch sensors support large format displays up to 85 inches and will react to a finger or a conductive stylus but not a carelessly dropped book, or the brush of a sleeve – making them ideal for table applications. As the touch sensors are made from thick toughened glass, the Zytronic enabled tables shrug off the kind of abuse that would see other touch technologies run for the hills.
As industrial design, marketing and technological concepts collide, the outcome is a new innovative digital experience that is equally as beneficial to the vendor as it is to the end users.
Combining outstanding durability and lightning fast multi-touch responsiveness, projective capacitive touch technology is leading the way in the design of innovative interactive products in recent years.
Annual Report and Financial Statements 2015 Zytronic plc 15Annual Report and Financial Statements 2015 Zytronic plc 15
Progressive growth in dividends
Summary C Profit after tax increased by 27% to £3.8m (2014: £3.0m)
C EPS increased by 26% to 24.7p (2014: 19.6p)
C Total dividend for year increased by 20% to 12.0p (2014: 10.0p)
C Working capital increased by £0.3m (2014: £0.1m decrease)
C Net cash generated from operating activities of £4.9m (2014: £4.2m)
C Net cash balances increased by £2.0m to £9.8m
OverviewThe Group performance for the year ended 30 September 2015 exceeded that of 2014, with sales up 13% to £21.3m and gross profit margin significantly improving to 41.9% (2014: 36.6%). This has resulted in an increase in Group EBITDA to £5.6m (2014: £4.3m), trading profit of £4.6m (2014: £3.3m) and profit before tax of £4.5m (2014: £3.3m).
Gross marginGross margin improved to 41.9% (2014: 36.6%) in the year, having been positively impacted by not only the increased volumes of touch sensor products sold but also the mix. Sales of traditional products have also benefited margin through the sale of complementary display offerings to one of the touch customers. Total labour costs remained controlled throughout the year, showing only a slight increase over that of last year in real terms, but as a percentage of sales the costs have reduced.
Increased costs have arisen in commissions whereby more commissionable sales were made throughout 2015 and further channel partners have been engaged, on a retainer basis, to drive sales in growing territories. Factory costs have risen slightly in line with increased sales and continue to be closely monitored.
The Group transacts its operations in three different currencies, being GBP, USD and Euros. Movements in exchange rates can therefore impact its margin. During the year, from a gross margin perspective, the USD moved in the Group’s favour whereas the Euro moved against the Group, compared to the average rates as of the prior year. The net effect in gross margin was an overall benefit of 0.9% from exchange rate movements. This benefit offsets a large portion of the £0.3m loss on exchange in overheads as described below.
Gross profit
£8.9mGroup revenue
£21.3m
Zytronic plc Annual Report and Financial Statements 201516
Strategic report
Financial review continued
Group trading profitGroup trading profit has increased further during the year through the increase in sales and gross margin; however, administration expenses have again continued to rise, due to a number of factors. Staff costs have increased year on year by £0.5m arising mainly from the £0.2m share option charge incurred following the 2014 implementation of the long term incentive plan by the Board. Bonus provisions have also been higher in the year to reward all employees for enhanced Group performance. The introduction of additional headcount in the year in the sales team to target new market opportunities has also impacted on costs. The Group has also incurred a net £0.3m for exchange adjustments following the strengthening of the USD post the contracts being entered into in August 2014, for the financial year 2015. These contracts, at adverse rates, have now fully expired. All other costs have been well controlled in the year.
TaxationThe Group’s taxation charge for the year ended 30 September 2015 of £0.8m represents an effective tax rate of 17%, reflecting the continued utilisation of R&D tax credits and the allowances for the exercising of share options which occurred during the year. The Group is currently seeking clarification from its tax advisers as to its qualifying status under the Patent Box regime and has therefore made no adjustment for this in the year.
Earnings per shareThe issued share capital is 15,322,346 ordinary shares of 1.0p each and the resultant EPS for the year is 24.7p, which represents growth of 26% from that reported last year (2014: 19.6p).
DividendThe Directors recommend the payment of a final dividend of 8.87p per share for the year ended 30 September 2015 (2014: 7.16p). Subject to approval by shareholders, the dividend will be paid on Friday 11 March 2016 to shareholders on the register as at the close of business on Friday 26 February 2016.
Including the interim dividend paid of 3.14p (2014: 2.85p), the total dividend for the year would be 12.01p, which is an increase of 20% over last year. The dividend is covered 2.1 times by underlying earnings.
Capital expenditureThe Group embarked on a significant capital expenditure programme in the year with total investment of £1.0m in property, plant and equipment. £0.4m of this was incurred on the refurbishment of the original cleanroom to increase capacity to meet customer demand and ensure consistency of operations across both production facilities. A new laminating machine was added to increase throughput of ultra large format touch sensors at a cost of £0.3m, with other additions being made to complement the existing and new facilities. £0.4m of capital expenditure was incurred in intangible assets over a variety of development projects, some of which will continue to be added to in the year ahead. Depreciation and amortisation for the year was at similar levels to that reported for 2014 at just over £1.0m and it is likely that this may marginally rise in 2016.
Cash and debtThe Group continues to generate cash, and despite the increased investment in capital expenditure in the year, has recorded an increase in cash and cash equivalents of £2.0m (2014: £2.3m). This has enabled the Group to continue its policy of investing in internal R&D and capital refurbishments and to maintain its progressive dividend policy.
Net cash balances at 30 September 2015 were £9.8m (2014: £7.8m), of which £2.6m was held between instant access and 95 days’ notice interest-bearing deposit accounts with the remainder being managed through a set-off arrangement.
The Group maintains an overdraft facility, which it utilises in US Dollars and Euros, as part of the hedging of its FX exposure. To complement this, the Group also has an FX policy in place whereby it is hedged in both currencies for a minimum period of twelve months ahead up to a maximum period of 18 months ahead to better manage its net GBP inflows. As the timing of the receipts is difficult to accurately forecast, a sensitivity analysis has been applied to determine a portion of the expected net exposure to be hedged with any other surplus currency being managed in the month in which it occurs.
The Group retains a property mortgage with Barclays Bank plc, entered into in 2012, which is repayable at £0.2m per annum for five years, at which time it will either be re-financed or repaid. As of 30 September 2015, the outstanding property mortgage is £1.3m.
At 30 September 2015, the Group had cash balances net of the property-backed mortgage of £8.5m and was therefore not geared.
Claire Smith BA (Hons), ACMA, CGMA, CertICMGroup Finance Director7 December 2015
“ Gross margin improved to 41.9% (2014: 36.6%) in the year, having been positively impacted by not only the increased volumes of touch sensor products sold but also the mix.”

Financial statementsStrategic report
Annual Report and Financial Statements 2015 Zytronic plc 17
Corporate governance
Board of Directors
Tudor Griffith Davies BSc • Non-executive ChairmanTudor has wide industry experience at boardroom level, as Chairman, Chief Executive and Executive and Non-executive Director of several public companies. These have included Hicking Pentecost plc, Stratagem plc, Dowding & Mills plc and Castle Support Services plc. He was formerly a partner in Arthur Young (a predecessor firm of Ernst & Young LLP) specialising in corporate finance and recovery. Tudor is Chairman of the audit committee.
Mark Cambridge BSc (Hons), FIoDChief ExecutiveMark graduated with a BSc (Hons) in Materials Science in 1986 and has a Securities Institute Certificate in Corporate Finance (2003). Joining the Romag Group of companies in 1991, he held the positions of Technical Manager, Quality Manager and Technical and Quality Director, up to the demerger and flotation of Zytronic plc. Since 2000 he has overseen the development, market introduction and sales of the ZYTOUCH® touch sensor product and the market launch of ZYPOS® touch sensors. Mark was Sales and Marketing Director of Zytronic Displays Limited from 2002 until his appointment as its Managing Director in February 2006. On 1 June 2007 Mark was appointed to the Board and promoted to Chief Executive on 21 January 2008.
Claire Smith BA (Hons), ACMA, CGMA, CertICM Group Finance DirectorClaire graduated in 2000 in Business and Finance and attained CIMA accreditation in 2006 and a certificate in International Cash Management in 2011. She held various positions within Procter & Gamble and the NAAFI before joining Zytronic Displays Limited in April 2007 as Group Financial Controller. In 2012, Claire was appointed Finance Director of the operating subsidiary Zytronic Displays Limited and Finance Director of Zytronic plc in January 2014.
David John Buffham • Independent Non-executive DirectorDavid is a Director of Newcastle Building Society, where he chairs the group risk committee and sits on the nominations and remuneration committees. He is a Director of William Leech (Investments) Ltd, where he additionally sits on the investment committee and serves as a trustee of the William Leech Foundation. Until 2010 David worked for the Bank of England. This included spells in banking supervision, risk management and advising overseas central banks on the conduct of monetary policy operations. Most recently, he was the Bank’s regional agent for the North East for nine years.
Sir David Robert Macgowan Chapman, Bt., DL, B Comm • Senior Independent Non-executive DirectorSir David, a former Chairman of the CBI North East, has held a variety of Non-executive roles, including at Northern Rock Plc and at the London Stock Exchange. He is currently Chairman of Virgin Money‘s Pension Scheme and its Independent Governance Committee and is an Advisory Board member of North East Finance in addition to being a Director of several regional venture capital funds. A former First Vice President of Merrill Lynch International Bank and a consultant to UBS Wealth Management, Sir David was a member of the Greenbury Committee on Directors’ remuneration. He is currently Chairman of the remuneration committee.
• Member of audit committee.
Member of remuneration committee.
All of the Directors served throughout the financial year.

Corporate governance
Zytronic plc Annual Report and Financial Statements 201518
Corporate governance
As an AIM-listed company, Zytronic plc is not obliged to comply with the UK Corporate Governance Code published in September 2014 (the “Code”) but instead uses the provisions of the Code as a guide, applying them as the Board considers appropriate to the circumstances of the Company.
The workings of the Board and its committeesThe BoardThroughout the year, Tudor Davies, the Non-executive Chairman, Mark Cambridge, the Chief Executive, Claire Smith, the Group Finance Director, and Sir David Chapman, Bt. and David Buffham, the two Independent Non-executive Directors, were members of the Board.
The Non-executive Directors demonstrate a range of experience and sufficient calibre to bring independent judgement on issues of strategy, performance, resources and standards of conduct, which are vital to the success of the Group.
The Board normally meets at least five times per year. Its direct responsibilities include setting annual budgets, reviewing trading performance, approving significant capital expenditure, ensuring adequate funding, setting and monitoring strategy, examining major acquisition possibilities and reporting to shareholders. Between meetings there is regular informal discussion between the Chairman, the Chief Executive, the Group Finance Director and the individual Non-executive Directors. The Non-executive Directors have a particular responsibility to ensure that the strategies proposed by the Executive Directors are fully considered.
To enable the Board to discharge its duties, all Directors receive appropriate and timely information. Briefing papers are distributed by the Company Secretary to all Directors in advance of Board meetings. The Chairman ensures that the Directors are able to take independent professional advice as required, at the Company’s expense.
The standing committees established by the Board are the remuneration committee and the audit committee, each of which operates within defined terms of reference.
A nominations committee has not been established as the Board is small. The nominations process prior to Board appointments takes into account the views of all existing Board members and some advisers. Any Director appointed to the Board since the last Annual General Meeting is required to seek re-election at the subsequent Annual General Meeting. All Directors are subject to re-election at least once every three years.
The number of meetings of the Board, and the attendance of Directors, is shown on the right.
Remuneration committeeThe remuneration committee is chaired by Sir David Chapman, Bt., the Senior Independent Non-executive Director. The other member is David Buffham, an Independent Non-executive Director. The committee is responsible for making recommendations to the Board, within agreed terms of reference, on the Company’s framework of executive remuneration and its cost, including the remuneration of some subsidiary Directors. The committee determines the contract terms, remuneration and other benefits for each of the Executive Directors, including performance related bonus schemes, pension rights and compensation payments. Further details of the Company’s policies on remuneration, service contracts and compensation payments are given in the Remuneration report. The Chairman’s remuneration is determined by a sub-committee comprising only the Independent Non-executive Directors.
The number of meetings of the committee, and the attendance of members, is shown on the right.
Audit committeeThe audit committee is chaired by Tudor Davies. The other members are Sir David Chapman, Bt., the Senior Independent Non-executive Director, and David Buffham, an Independent Non-executive Director. The Independent Non-executive Directors’ meetings are also attended, by invitation, by the other Directors. The committee normally meets at least twice a year. The committee provides a forum for reporting by the Group’s external auditors.
The audit committee is responsible for reviewing a wide range of matters, including the half-year and annual financial statements before their submission to the Board, and monitoring the
controls which are in force to ensure the integrity of the information reported to the shareholders. The audit committee advises the Board on the appointment of external auditors and on their remuneration both for audit and non-audit work and discusses the nature, scope and results of the audit with the auditors.
The audit committee keeps under review the cost effectiveness of the auditors. It also reviews the extent of the non-audit services provided by the auditors and reviews with them their independence and objectivity. The Chairman of the audit committee reports the outcome of audit committee meetings to the Board and the Board receives minutes of the meetings.
The number of meetings of the committee, and the attendance of members, is shown on the right.
Relations with shareholdersCommunication with shareholders is given high priority. There is regular dialogue with major and/or institutional shareholders, including presentations after the Company’s announcements of the half-year and full-year results in May and December, respectively. Presentations are also made to analysts and journalists at those times to present the Group’s results and report on developments. This assists with the promotion of knowledge of the Group in the investment marketplace and with shareholders. The financial statements include a review of the business and future developments. These financial statements, the presentations and other financial information relating to the Group are also available on the Group’s website, www.zytronicplc.com.
Following the half-year and year-end presentations of results, the Executive Directors report to the Board on the feedback received from journalists, analysts and shareholders. In addition, the Company’s Nomad produces a feedback report from those meetings which is made available to all Directors. The Executive Directors also report to the Board on any meetings with shareholders or institutional investors that may take place at other times of the year.
“ The Non-executive Directors demonstrate a range of experience and sufficient calibre to bring independent judgement on issues of strategy, performance, resources and standards of conduct, which are vital to the success of the Group.”

Financial statementsStrategic report
Annual Report and Financial Statements 2015 Zytronic plc 19
Corporate governance
The Board uses both the annual report and financial statements and the Annual General Meeting to communicate directly with private and institutional investors and welcomes their participation. The Chairman aims to ensure that the Chairmen of the audit and remuneration committees are available at the Annual General Meeting to answer questions. Details of resolutions to be proposed at the Annual General Meeting on Thursday 25 February 2016 can be found in the Notice of Annual General Meeting on pages 58 and 59.
In addition, the Senior Independent Director is available to shareholders if they have any concerns which contact through the normal channels of the Chairman, the Chief Executive or the Group Finance Director has failed to resolve or for which such contact is inappropriate.
Internal controlThe Board is responsible for establishing and maintaining the Group’s system of internal control and for reviewing its effectiveness. The system is designed to manage rather than eliminate the risk of failure to achieve the Group’s strategic objectives and can only provide reasonable and not absolute assurance against material misstatement or loss. As an AIM-listed company, the Company does not need to comply with Code provision C2.1 regarding the Directors giving a summary of the process applied by the Board in reviewing the effectiveness of the system of internal control. Instead, the Directors set out below some of the key aspects of the Group’s internal control procedures.
An ongoing process, in accordance with the guidance of the Turnbull Committee on internal control, has been established for identifying, evaluating and managing the significant risks faced by the Group. The process has been in place for the full year under review and up to the date of approval of the annual report and financial statements. The Board regularly reviews this process as part of its review of such risks within Board meetings. Where any weaknesses are identified, an action plan is prepared to address the issues and is then implemented.
The Board has overall responsibility for the Group and there is a formal schedule of matters specifically reserved for decision by the Board.
Authority to operate the trading subsidiary, Zytronic Displays Limited, is delegated to its Board of Directors and through it, it is run by its management, within limits set by the Board. The appointment of Executives to the most senior positions within the Group requires the approval of the Board.
Each year the Board approves the annual budget. Key risk areas are identified, reviewed and monitored. Performance is monitored against budget, relevant action is taken throughout the year and quarterly rolling forecasts are prepared. The reports reviewed
by the Board include reports on operational as well as financial issues.
Capital and development expenditure is regulated by a budgetary process and authorisation levels. For expenditure beyond specified levels, detailed written proposals have to be submitted to the Board for approval. Reviews are carried out after the purchase is complete. The Board requires management to explain any major deviations from authorised capital proposals and to seek further sanction from the Board.
Due diligence work is carried out if a business is to be acquired.
The Board has reviewed the need for an internal audit function and concluded that this is not currently necessary in view of the small size of the Group and the close supervision by senior management of its day-to-day operations. The Board will continue to keep this under review.
The Group has a whistle-blowing policy and procedures to encourage staff to contact the Chairman if they need to raise matters of concerns other than via the Executive Directors and senior management.
Going concernThe Group’s business activities, together with the factors likely to affect its future development, performance and position are set out in the Strategic report. The financial position of the Group, its cashflows, liquidity position and borrowing facilities are described within the Financial review section of the Strategic report also. In addition, note 20 to the financial statements includes the Group’s objectives and policies of its financial risk management and details of its financial instruments and hedging activities and its exposure to credit risk and liquidity risk.
The Group’s business is well diversified, with relationships with customers and suppliers across different geographic areas and industries. It also has considerable financial resources. As a consequence, the Directors believe that the Group is well placed to manage its business risks successfully.
After making enquiries, the Directors have a reasonable expectation that the Company and the Group have adequate resources to continue in operational existence for the foreseeable future. Accordingly, they continue to adopt the going concern basis in preparing the annual report and financial statements.
Number of meetings and the attendance of Directors
The Board2015 total: 5 meetingsTudor Davies (5)
Mark Cambridge (5)
Claire Smith (5)
David Buffham (5)
Sir David Chapman, Bt. (5)
Remuneration committee2015 total: 1 meetingSir David Chapman, Bt. (1)
David Buffham (1)
Audit committee2015 total: 1 meetingTudor Davies (1)
Sir David Chapman, Bt. (1)
David Buffham (1)

Corporate governance
Zytronic plc Annual Report and Financial Statements 201520
Directors’ report
The Directors present their annual report and financial statements for the year ended 30 September 2015.
Principal activitiesZytronic is the developer and manufacturer of a unique range of internationally award-winning touch sensor products. Zytronic’s products incorporate an embedded array of metallic micro-sensing electrodes which offer significant durability, environmental stability and optical enhancement benefits to designers of system-integrated interactive displays for public access and industrial-type applications.
Likely future developmentOur priorities for 2015/16 are disclosed in the Strategic report on pages 6 and 7.
The Group will continue to identify further opportunities for the development of new product groups and expends a considerable amount on R&D. By continually developing and adapting its technologies the Group has been able to expand the applications of the touch sensors into a widening range of applications and new sectors of business and to promote the Group’s products on a global basis. At present 93% of all products are directly exported from the UK, with a large proportion of UK sales eventually being exported as well.
The Group draws strength from the diverse spread of its worldwide selling operations, particularly given the current uncertain economic conditions affecting different countries. The incorporation of Zytronic Inc. has further strengthened the Group’s presence in the USA and the employment of a Taiwanese national in the APAC region in the year has increased its presence there. Management continues to look for suitable appointees to expand the Group’s presence of value added resellers (“VARs”) worldwide.
Capital managementCapital management is intended to ensure and maintain strong credit ratings and healthy capital ratios in order to support the Group’s business and maximise shareholder value. It includes the monitoring of cash balances,
available bank facilities, cashflows, dividend policy and retained reserves and gearing levels (borrowings net of cash balances divided by shareholders’ equity).
Management ensures that the Group has sufficient facilities to provide the Directors with comfort on the Group’s foreseeable needs and its liquidity position. The Financial review includes a paragraph referring to the continuing strength of cashflows which occurred in the year ended 30 September 2015 and the absence of net gearing.
No changes were made to these objectives, policies or processes during the years ended 30 September 2014 and 2015.
Research and developmentThe Group has again continued with the development of its electronic controllers, software and firmware used in the touch sensors and commenced the project to develop an MPCT™ ASIC to reduce the footprint and cost of its multi-touch controllers.
Zytronic has partnered during the year with a consortium group to evaluate and develop high resolution and small feature-sized inkjet printing techniques for printed electronics. Further details on the Group’s R&D activities are included in the Operational review section of the Strategic report.
Results and dividendsThe consolidated statement of comprehensive income is set out on page 26. The Group profit after taxation amounted to £3.8m (2014: £3.0m). The Directors propose the payment of a final dividend of 8.87p per share (2014: 7.16p). Following the dividend of 3.14p per share paid in July 2015, this will bring the total dividend for the year to 12.01p per share (2014: 10.01p), an increase of 20%.
DirectorsThe Directors of the Company are shown on page 17. All of the Directors were Directors for the whole of the year. The emoluments and interests of the Directors in the shares of the Company are set out in the Remuneration report.
Statement of Directors’ responsibilities in relation to the Group financial statements and annual reportThe Directors are responsible for preparing the annual report and the Group financial statements in accordance with UK law and those International Financial Reporting Standards (“IFRS”) as adopted by the European Union.
Under company law the Directors must not approve the Group financial statements unless they are satisfied that they give a true and fair view of the state of affairs of the Group and of the profit or loss of the Group for that period. In preparing those financial statements the Directors are required to:
C present fairly the financial position, financial performance and cashflows of the Group;
C select suitable accounting policies in accordance with IAS 8 Accounting Policies, Changes in Accounting Estimates and Errors and then apply them consistently;
C present information, including accounting policies, in a manner that provides relevant, reliable, comparable and understandable information;
C make judgements that are reasonable;
C provide additional disclosures when compliance with the specific requirements of IFRS, as adopted in the European Union, is insufficient to enable users to understand the impact of particular transactions, other events and conditions on the Group’s financial position and financial performance; and
C state whether the Group financial statements have been prepared in accordance with IFRS, as adopted by the European Union, subject to any material departures disclosed and explained in the financial statements.
“ Management ensures that the Group has sufficient facilities to provide the Directors with comfort on the Group’s foreseeable needs and its liquidity position.”

Financial statementsStrategic report
Annual Report and Financial Statements 2015 Zytronic plc 21
Corporate governance
The Directors are responsible for keeping adequate accounting records that are sufficient to show and explain the Group’s transactions and disclose with reasonable accuracy at any time the financial position of the Group and enable them to ensure that the Group financial statements comply with the Companies Act 2006. They are also responsible for safeguarding the assets of the Group and hence for taking reasonable steps for the prevention and detection of fraud and other irregularities. The Directors are responsible for the maintenance and integrity of the corporate and financial information included on the Company’s website. Legislation in the UK governing the preparation and dissemination of financial statements may differ from legislation in other jurisdictions.
Disclosure of information to auditorsThe Directors who were members of the Board at the time of approving the Directors’ report are listed on page 17. Having made enquiries of fellow Directors and of the Company’s auditors, each of these Directors confirms that:
C to the best of each Director’s knowledge and belief, there is no information (that is, information needed by the Company’s auditors in connection with preparing their report) of which the Company’s auditors are unaware; and
C each Director has taken all the steps a Director might reasonably be expected to have taken to be aware of relevant audit information and to establish that the Company’s auditors are aware of that information.
Special businessThree special resolutions are to be proposed at the AGM this year. The special resolutions provide for the granting of share allotment and share buy-back authorities which are sought by the Company on an annual basis at the AGM to permit the Company to issue or buy back shares in accordance with terms of the authorities granted to the Company and its Directors, should the need arise.
A resolution will be proposed at the forthcoming Annual General Meeting to renew the existing authority of the Directors, last conferred by a resolution passed at the Annual General Meeting held in 2014, to allot unissued ordinary shares of the Company. The authority (special resolution 1 in the Notice of Annual General Meeting) will extend until the Annual General Meeting held in 2016 and is in respect of one-third of the Company’s issued share capital.
The Directors consider it advisable that they continue to have power to make allotments of ordinary shares of the Company for cash without reference to the statutory pre-emption rights, up
to a maximum of 766,117 ordinary shares, being 5% of the issued ordinary share capital of the Company at 30 September 2015. The authority (special resolution 2 in the Notice of Annual General Meeting) will extend until the Annual General Meeting held in 2016 and also would enable the Directors to implement a rights issue.
In addition, the Directors consider it advisable that the Company has the authority to make market purchases of its own shares up to a maximum of 1,532,235 ordinary shares of the Company, being 10% of the issued ordinary share capital. The authority (special resolution 3 in the Notice of Annual General Meeting) will extend until the Annual General Meeting held in 2016. The power conferred by this authority would only be used after careful consideration by the Directors, having taken into account market conditions prevailing at the time, the investment needs of the Company, its opportunities for expansion and its overall financial position. The authority would only be exercised by the Directors if they considered it to be in the best interests of shareholders generally and if the purchase(s) could be expected to result in an increase in EPS.
AuditorsA resolution to re-appoint Ernst & Young LLP as the Company’s auditors will be put to the shareholders at the forthcoming Annual General Meeting.
On behalf of the Board
Claire Smith BA (Hons), ACMA, CGMA, CertICMCompany Secretary7 December 2015
Registration number3881244
Significant interests in shares
On 13 November 2015, the following had significant interests in the ordinary shares of the Company:
Brown Shipley1,147,062 shares 7.5%
Hargreaves Lansdown1,091,832 shares 7.1%
Cavendish Asset Management901,300 shares 5.9%
AXA FramlingtonInvestment Managers825,000 shares 5.4%
Barclays Stockbrokers761,981 shares 5.0%
Corporate governance
Zytronic plc Annual Report and Financial Statements 201522
Remuneration report
As the Company is AIM listed, the Directors are not required, under Section 420(1) of the Companies Act 2006, to prepare a Directors’ Remuneration report for each financial year of the Company and so Zytronic plc makes the following disclosures voluntarily, which are not intended to, and indeed do not, comply with the requirements of Section 420(1) of the Companies Act 2006.
The remuneration committee is responsible for determining the remuneration and other terms of employment for the Executive Directors of Zytronic plc and some of the Directors in its trading subsidiary, Zytronic Displays Limited. The committee is composed of the Senior Independent Non-executive Director, as its Chairman, and the Independent Non-executive Director. In determining remuneration for the year, the committee has given full consideration to the requirements of the Combined Code.
Remuneration policyThe remuneration of Executive Directors is determined by the committee and the remuneration of Non-executive Directors is approved by the full Board of Directors. The remuneration of the Chairman is determined by the Independent Non-executive Directors.
The key objectives of the committee in determining the remuneration packages of Executive Directors are:
C the recruitment, retention and incentivisation of executive management of the right calibre; and
C the alignment of executive management and shareholder interests.
The remuneration packages of Executive Directors comprise the following elements:
Basic salary and benefitsBasic salaries for Executive Directors are reviewed annually having regard to individual performance and market practice. In most cases benefits provided to Executive Directors comprise the provision of a company car, or appropriate allowance, health insurance and contributions to a Group personal pension scheme. Details of emoluments for the Directors of Zytronic plc are set out on page 23.
Annual bonusIn 2014, the remuneration committee implemented a three-year annual bonus plan linked to corporate performance targets, being the achievement of certain profit before tax (“PBT”) measures.
A maximum bonus of 50% of base salary for both the Chief Executive and the Group Finance Director will be payable if these targets are met.
In the financial year 2015 actual bonus payments of 50% of base salary are payable. The remuneration committee believes that this is a reasonable situation given the financial performance of the Group.
The remuneration committee also retains its right to provide special discretionary bonuses where deemed appropriate.
Long term incentive planThe remuneration committee also agreed, in 2014, a long term cumulative cash bonus incentive scheme, payable in addition to the annual bonus scheme following the finalisation of the fiscal year 2016 annual report and financial statements, providing certain performance measures have been achieved.
A bonus of 60% of base salary will be payable to the Chief Executive and 45% of base salary to the Group Finance Director, on achievement of the performance measures.
Share options and incentive schemesThe Company believes that share ownership by Executive Directors and employees strengthens the link between their personal interests and those of the Company and the shareholders.
The Company has executive share option and incentive schemes, which are designed to promote long term improvement in the performance of the Group, sustained increase in shareholder value and clear linkage between executive reward and the Group’s performance. The share options and incentive schemes of the Directors of Zytronic plc are set out on pages 23 and 24.
It will normally be the case that, on the option holder ceasing employment with the Group, the options will be terminated. In some circumstances, the Board may have discretion to waive this where the past contribution to the business by the option holder justifies it.
Service contractsMark Cambridge and Claire Smith each have a service contract with a notice entitlement of six months.
The committee considers the Directors’ notice entitlements to be appropriate as they are in line with the market and take account of the Directors’ knowledge and experience. There are no special provisions for predetermined compensation in the event of loss of office.
Non-executive DirectorsThe fees of the Non-executive Directors are determined by the full Board within the limits set out in the Memorandum and Articles of Association. The Non-executive Directors are not eligible for bonuses, pension benefits or share options.
Directors’ emolumentsEmoluments of the Directors for the year ended 30 September 2015 are shown in the table on the right.
Pension contributionsDuring the year, the Group made annual pension contributions for Mark Cambridge and Claire Smith, Executive Directors, to a Group personal pension scheme (i.e. a defined contribution scheme). Neither benefits in kind nor bonuses are pensionable.
Details of contributions payable by the Company are:
Director2015
£’0002014
£’000
Mark Cambridge 31 4Claire Smith 36 3
Total* 67 7
* The Directors opted to pay some of their 2014 bonus award into their pension scheme as a Company contribution.
“ The Company has executive share option and incentive schemes, which are designed to promote long term improvement in the performance of the Group.”

Financial statementsStrategic report
Annual Report and Financial Statements 2015 Zytronic plc 23
Corporate governance
Directors’ shareholdingsBeneficial interests of the Directors in the shares of the Company, including those of their immediate families, are shown below:
30 September 2015 30 September 2014
Number % Number %
Tudor Davies 90,909 0.59 90,909 0.60Mark Cambridge 50,791 0.33 50,791 0.33Sir David Chapman, Bt. 40,000 0.26 40,000 0.26David Buffham 18,500 0.12 18,500 0.12Claire Smith 714 — 714 —
There has been no change in Directors’ shareholdings since 30 September 2015.
Directors’ emoluments for the year ended 30 September 2015Total Total
emoluments* emoluments*Salary Fees Benefits Bonuses 2015 2014£’000 £’000 £’000 £’000 £’000 £’000
Non-executive ChairmanTudor Davies — 71 — — 71 65ExecutiveMark Cambridge 120 — 14 60 194 190Claire Smith 85 — 10 42 137 129Non-executiveSir David Chapman, Bt. — 28 — — 28 28David Buffham — 28 — — 28 26
205 127 24 102 458 438
* Excluding pension contributions.
The Directors have opted to pay some of their bonus into their pension scheme.
Directors’ share incentive scheme The remuneration committee agreed, in March 2014, an incentive award scheme for Mark Cambridge, Chief Executive, and Claire Smith, Group Finance Director, to offer them each up to 125,000 shares at a price of 200.0p per share to vest based on specified performance criteria:
C the consolidated PBT, after bonuses payable to certain individuals, of the Group for the accounting period ending 30 September 2016 being in excess of £4.5m; and
C the consolidated PBT, after bonuses payable to certain individuals, of the Group for the three accounting periods ending 30 September 2014, 2015 and 2016 being together at least £10.0m (where a loss in any such period shall be treated as a minus for those three years).
If the performance target set out above is satisfied, option shares will vest on the date on which the consolidated accounts for the Group for the accounting period ending 30 September 2016 are finalised.
The exercise of this option shall be conditional on the option holder entering into an agreement with the Company pursuant to which the option holder shall agree to retain one-third in aggregate of the shares acquired pursuant to the exercise of this option for a period of two years from the date of exercise of the option and to deposit the share certificate in respect of such shares with the Company Secretary for the retention period.

Corporate governance
Zytronic plc Annual Report and Financial Statements 201524
Remuneration report continued
Share price during the yearDuring the year to 30 September 2015, the highest share price was 316.0p and the lowest share price was 232.5p. The market price of the shares at 30 September 2015 was 305.0p.
Directors’ interests in material contractsNo Director was materially interested either at the year end or during the year in any contract of significance to the Group other than their employment or service contract.
Directors’ share optionsGranted Lapsed Exercised
Enterprise 30 September during during during 30 SeptemberManagement 2014 year year year 2015 OptionIncentive Scheme Number Number Number Number Number Exercise dates price
Mark Cambridge 21,750 — — — 21,750 29 March 2014 to 28 March 2021
172.8p
Mark Cambridge 71,787 — — — 71,787 December 2016 to December 2018
200.0p
Claire Smith 5,000 — — — 5,000 28 February 2011 to 27 February 2018
216.5p
Claire Smith 10,000 — — — 10,000 25 January 2015 to 24 January 2022
195.0p
Claire Smith 10,000 — — — 10,000 25 January 2016 to 24 January 2022
195.0p
Claire Smith 10,000 — — — 10,000 25 January 2017 to 24 January 2022
195.0p
Claire Smith 67,800 — — — 67,800 December 2016 to December 2018
200.0p
Granted Lapsed Exercised30 September during during during 30 September
2014 year year year 2015 OptionUnapproved Scheme Number Number Number Number Number Exercise dates price
Mark Cambridge 53,213 — — — 53,213 December 2016 to December 2018
200.0p
Claire Smith 57,200 — — — 57,200 December 2016 to December 2018
200.0p

Corporate governance Financial statementsStrategic report
Annual Report and Financial Statements 2015 Zytronic plc 25
Independent auditors’ reportTo the members of Zytronic plc
We have audited the financial statements of Zytronic plc for the year ended 30 September 2015 which comprise the consolidated statement of comprehensive income, the consolidated statement of changes in equity, the consolidated balance sheet and Parent Company balance sheet, the consolidated cashflow statement and the related notes 1 to 25 for the Group and the related notes 1 to 12 for the Parent Company. The financial reporting framework that has been applied in the preparation of the Group financial statements is applicable law and International Financial Reporting Standards (“IFRS”) as adopted by the European Union. The financial reporting framework that has been applied in the preparation of the Parent Company financial statements is applicable law and United Kingdom Accounting Standards (United Kingdom Generally Accepted Accounting Practice).
This report is made solely to the Company’s members, as a body, in accordance with Chapter 3 of Part 16 of the Companies Act 2006. Our audit work has been undertaken so that we might state to the Company’s members those matters we are required to state to them in an auditors’ report and for no other purpose. To the fullest extent permitted by law, we do not accept or assume responsibility to anyone other than the Company and the Company’s members as a body, for our audit work, for this report, or for the opinions we have formed.
Respective responsibilities of Directors and auditorsAs explained more fully in the Directors’ responsibilities statement set out on pages 20 and 21, the Directors are responsible for the preparation of the financial statements and for being satisfied that they give a true and fair view. Our responsibility is to audit and express an opinion on the financial statements in accordance with applicable law and International Standards on Auditing (UK and Ireland). Those standards require us to comply with the Auditing Practices Board’s Ethical Standards for Auditors.
Scope of the audit of the financial statementsAn audit involves obtaining evidence about the amounts and disclosures in the financial statements sufficient to give reasonable assurance that the financial statements are free from material misstatement, whether caused by fraud or error. This includes an assessment of: whether the accounting policies are appropriate to the Group’s and the Parent Company’s circumstances and have been consistently applied and adequately disclosed; the reasonableness of significant accounting estimates made by the Directors; and the overall presentation of the financial statements. In addition, we read all the financial and non-financial information in the annual report and financial statements to identify material inconsistencies with the audited financial statements and to identify any information that is apparently materially incorrect based on, or materially inconsistent with the knowledge acquired by us in the course of performing the audit. If we become aware of any apparent material misstatements or inconsistencies we consider the implications for our report.
Opinion on financial statementsIn our opinion:
C the financial statements give a true and fair view of the state of the Group’s and of the Parent Company’s affairs as at 30 September 2015 and of the Group’s profit for the year then ended;
C the Group financial statements have been properly prepared in accordance with IFRSs as adopted by the European Union;
C the Parent Company financial statements have been properly prepared in accordance with United Kingdom Generally Accepted Accounting Practice; and
C the financial statements have been prepared in accordance with the requirements of the Companies Act 2006.
Opinion on other matter prescribed by the Companies Act 2006In our opinion the information given in the Strategic report and the Directors’ report for the financial year for which the financial statements are prepared is consistent with the financial statements.
Matters on which we are required to report by exceptionWe have nothing to report in respect of the following matters where the Companies Act 2006 requires us to report to you if, in our opinion:
C adequate accounting records have not been kept by the Parent Company, or returns adequate for our audit have not been received from branches not visited by us; or
C the Parent Company financial statements are not in agreement with the accounting records and returns; or
C certain disclosures of Directors’ remuneration specified by law are not made; or
C we have not received all the information and explanations we require for our audit.
Stuart Watson (Senior Statutory Auditor) for and on behalf of Ernst & Young LLP, Statutory AuditorNewcastle-upon-Tyne7 December 2015
Notes1. The maintenance and integrity of the Zytronic plc website is the responsibility of the Directors; the work carried out by the auditors does not involve consideration of these matters
and, accordingly, the auditors accept no responsibility for any changes that may have occurred to the financial statements since they were initially presented on the website.2. Legislation in the United Kingdom governing the preparation and dissemination of financial statements may differ from legislation in other jurisdictions.

Financial statements
Zytronic plc Annual Report and Financial Statements 201526
Consolidated statement of comprehensive incomeFor the year ended 30 September 2015
2015 2014Notes £’000 £’000
Group revenue 2 21,267 18,886
Cost of sales (12,366) (11,979)
Gross profit 8,901 6,907
Distribution costs (278) (156)
Administration expenses (4,073) (3,488)
Group trading profit 3 4,550 3,263
Finance costs 5(a) (29) (35)
Finance revenue 5(b) 23 33
Profit before tax 4,544 3,261
Tax expense 6 (775) (301)
Profit for the year 3,769 2,960
Earnings per share
Basic 8 24.7p 19.6p
Diluted 8 24.3p 19.5p
All profits are from continuing operations.

Corporate governance Financial statementsStrategic report
Annual Report and Financial Statements 2015 Zytronic plc 27
Consolidated statement of changes in equityFor the year ended 30 September 2015
Calledup share Share Retained
capital premium earnings Total £’000 £’000 £’000 £’000
At 30 September 2013 150 7,003 8,948 16,101
Profit for the year — — 2,960 2,960
Tax recognised directly in equity — — — —
Exercise of share options 2 287 — 289
Share-based payments — — 93 93
Dividends — — (1,390) (1,390)
At 30 September 2014 152 7,290 10,611 18,053
Profit for the year — — 3,769 3,769
Tax recognised directly in equity — — — —
Exercise of share options 1 262 — 263
Share-based payments — — 180 180
Dividends — — (1,574) (1,574)
At 30 September 2015 153 7,552 12,986 20,691
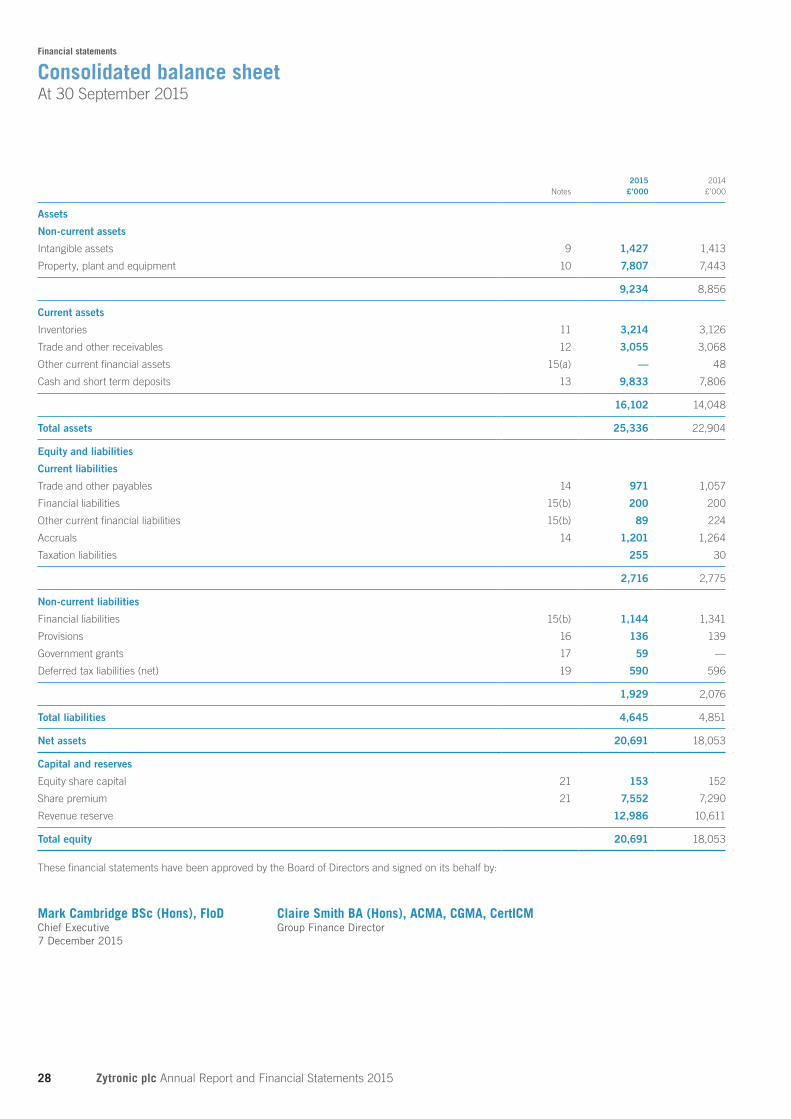
Financial statements
Zytronic plc Annual Report and Financial Statements 201528
Consolidated balance sheetAt 30 September 2015
2015 2014Notes £’000 £’000
Assets
Non-current assets
Intangible assets 9 1,427 1,413
Property, plant and equipment 10 7,807 7,443
9,234 8,856
Current assets
Inventories 11 3,214 3,126
Trade and other receivables 12 3,055 3,068
Other current financial assets 15(a) — 48
Cash and short term deposits 13 9,833 7,806
16,102 14,048
Total assets 25,336 22,904
Equity and liabilities
Current liabilities
Trade and other payables 14 971 1,057
Financial liabilities 15(b) 200 200
Other current financial liabilities 15(b) 89 224
Accruals 14 1,201 1,264
Taxation liabilities 255 30
2,716 2,775
Non-current liabilities
Financial liabilities 15(b) 1,144 1,341
Provisions 16 136 139
Government grants 17 59 —
Deferred tax liabilities (net) 19 590 596
1,929 2,076
Total liabilities 4,645 4,851
Net assets 20,691 18,053
Capital and reserves
Equity share capital 21 153 152
Share premium 21 7,552 7,290
Revenue reserve 12,986 10,611
Total equity 20,691 18,053
These financial statements have been approved by the Board of Directors and signed on its behalf by:
Mark Cambridge BSc (Hons), FIoD Claire Smith BA (Hons), ACMA, CGMA, CertICMChief Executive Group Finance Director7 December 2015

Corporate governance Financial statementsStrategic report
Annual Report and Financial Statements 2015 Zytronic plc 29
Consolidated cashflow statementFor the year ended 30 September 2015
2015 2014Notes £’000 £’000
Operating activities
Profit from continuing operations 4,544 3,261
Net finance costs 6 2
Depreciation and impairment of property, plant and equipment 708 672
Amortisation and impairment of intangible assets 336 362
Loss on sale of fixed assets 54 —
Amortisation of government grant (4) —
Share-based payments 180 93
Fair value movement on foreign exchange forward contracts (87) 176
Working capital adjustments
(Increase)/decrease in inventories (88) 383
Decrease/(increase) in trade and other receivables 13 (638)
(Decrease)/increase in trade and other payables and provisions (249) 370
Cash generated from operations 5,413 4,681
Taxation paid (556) (497)
Net cashflow from operating activities 4,857 4,184
Investing activities
Interest received 23 33
Proceeds from disposal of property, plant and equipment 3 36
Receipt of government grant 63 —
Payments to acquire property, plant and equipment (994) (263)
Payments to acquire intangible assets (388) (322)
Net cashflow from investing activities (1,293) (516)
Financing activities
Interest paid (26) (35)
Dividends paid to equity shareholders of the Parent (1,574) (1,390)
Proceeds from share issues relating to options 263 289
Repayment of borrowings (200) (200)
Net cashflow from financing activities (1,537) (1,336)
Increase in cash and cash equivalents 2,027 2,332
Cash and cash equivalents at the beginning of the year 13 7,806 5,474
Cash and cash equivalents at the year end 13 9,833 7,806

Financial statements
Zytronic plc Annual Report and Financial Statements 201530
Notes to the consolidated financial statementsFor the year ended 30 September 2015
1. Accounting policies(a) Authorisation of financial statements and statement of complianceThe financial statements of Zytronic plc and its subsidiaries (the “Group”) for the year ended 30 September 2015 were authorised for issue by the Board of Directors on 7 December 2015 and the balance sheet was signed on behalf of the Board by Mark Cambridge and Claire Smith. Zytronic plc is a public limited company incorporated, domiciled and registered in England and Wales. The Company’s ordinary shares are traded on AIM. The address of its registered office and principal place of operation are disclosed in the Corporate information section of this report.
The consolidated financial statements have been prepared in accordance with IFRS as adopted for use in the European Union and as applied in accordance with the provisions of the Companies Act 2006. The Directors consider the following accounting policies to be relevant in relation to the Group’s financial statements.
(b) New standards and interpretations not appliedThe International Accounting Standards Board (“IASB”) and the International Financial Reporting Interpretations Committee (“IFRIC”) have issued the following standards, interpretations and amendments with an effective date after the date of these financial statements:
Effective date
Amendments to IAS 16 and IAS 38 Clarification of Acceptable Methods of Depreciation and Amortisation 1 January 2016
Amendments to IAS 27R Equity Method in Separate Financial Statements 1 January 2016
Amendments to IAS 28 and IFRS 10 Sale or Contribution of Assets Between an Investor and its Associate or Joint Venture 1 January 2016
Amendments to IAS 1 Disclosure Initiative 1 January 2016
Amendments to IFRS 10, 12 and IAS 28 Investment Entities: Applying the Consolidation Exemption 1 January 2016
Amendments to IFRS 11 Allowing for Acquisitions of Interests in Joint Operations 1 January 2016
Amendments to IAS 16 and 41 Bearer Plants 1 January 2016
IFRS 15 Revenue from Contracts with Customers 1 January 2018
IFRS 9 Financial Instruments 1 January 2018
Annual improvements to IFRSs 2010–2012 1 February 2015
Annual improvements to IFRSs 2011–2013 1 March 2015
Annual improvements to IFRSs 2012–2014 1 January 2016
We have not yet done sufficient work to identify the impact of these new standards on the financial statements in future years.
(c) New standards adoptedThe following new standards or interpretations are mandatory for the first time for the financial year ended 30 September 2015:
IAS 27 Separate Financial Statements
IAS 28 Investments in Associates and Joint Ventures
IAS 32 Amendment of IAS 32 Offsetting of Financial Assets and Financial Liabilities
IAS 36 Recoverable Amount Disclosures for Non-financial Assets (amendment)
IAS 39 Novation of Derivatives and Continuation of Hedge Accounting (amendment)
IFRS 10 Consolidated Financial Statements
IFRS 11 Joint Arrangements
IFRS 12 Disclosure of Interests in Other Entities
Adoption of these new standards had no material impact on the financial performance of the Group.
(d) Judgements and key sources of estimation uncertaintyThe preparation of the Group’s consolidated financial statements requires the Directors to make judgements, estimates and assumptions that affect the reported amounts of assets, liabilities and disclosures at the date of the financial statements and the reported income and expense during the year. Although these judgements and assumptions are based on the Directors’ best knowledge of the amounts, events or actions, actual results may differ from those estimates.
In the process of applying the Group’s accounting policies, the Directors have made the following judgements concerning the future and other key sources of estimation uncertainty at the statement of financial position date which have the most significant effect on the amounts recognised in the financial statements.

Corporate governance Financial statementsStrategic report
Annual Report and Financial Statements 2015 Zytronic plc 31
1. Accounting policies continued(d) Judgements and key sources of estimation uncertainty continuedShare-based paymentsThe Group measures the cost of equity-settled transactions with employees by reference to the fair value of the equity instruments at the date at which they are granted. Estimating fair value for share-based payment transactions requires determination of the most appropriate valuation model, which is dependent on the terms and conditions of the grant. This estimate also requires determination of the most appropriate inputs to the valuation model, including the expected life of the share option, volatility and dividend yield, and making assumptions about them. The assumptions and models used for estimating fair value for share-based payment transactions are disclosed in note 21.
Fair value measurement of financial instrumentsThe fair values of financial assets and financial liabilities are recorded in the statement of financial position and measured by the financial institutions using valuation techniques based on market practice. Judgements include considerations around foreign exchange spot and forward rates and interest rate curves.
Development costsDevelopment costs are capitalised in accordance with the accounting policy given below. Initial capitalisation of costs is based on management’s judgement that technological and economical feasibility is confirmed, usually when a product development project has reached a defined milestone.
(e) Basis of consolidation and goodwillThe consolidated financial statements comprise the financial statements of Zytronic plc and its subsidiaries as at 30 September each year. They are presented in Sterling and all values are rounded to the nearest thousand pounds (£’000) except where otherwise indicated.
All intra-group balances and transactions, including unrealised profits arising from them, are eliminated.
Business combinations are accounted for using the acquisition method. The cost of an acquisition is measured as the aggregate of the consideration transferred, measured at acquisition date fair value, and the amount of any non-controlling interest in the acquiree. For each business combination, the acquirer measures the non-controlling interest in the acquiree either at fair value or at the proportionate share of the acquiree’s identifiable net assets. Acquisition costs incurred are expensed and included in administrative expenses.
When the Group acquires a business, it assesses the financial assets and liabilities assumed for appropriate classification and designation in accordance with the contractual terms, economic circumstances and pertinent conditions as at the acquisition date.
Any contingent consideration to be transferred by the acquirer will be recognised at fair value at the acquisition date. Subsequent changes to the fair value of the contingent consideration, which is deemed to be an asset or liability, will be recognised in accordance with IAS 39 either in profit or loss or as a change to other comprehensive income. If the contingent consideration is classified as equity, it should not be remeasured until it is finally settled within equity.
Goodwill is initially measured at cost being the excess of the aggregate of the consideration transferred and the amount recognised for non-controlling interest over the net identifiable assets acquired and liabilities assumed. If this consideration is lower than the fair value of the net assets of the subsidiary acquired, the difference is recognised in profit or loss.
After initial recognition, goodwill is measured at cost less any accumulated impairment losses. For the purpose of impairment testing, goodwill acquired in a business combination is, from the acquisition date, allocated to each of the Group’s cash-generating units that are expected to benefit from the combination, irrespective of whether other assets or liabilities of the acquiree are assigned to those units.
(f) Exceptional itemsThe Group presents as exceptional items on the face of the income statement those material items of income and expense which, because of the nature and expected infrequency of the events giving rise to them, merit separate presentation to allow shareholders to better understand the elements of financial performance in the year, so as to facilitate comparison with prior periods and to better assess trends in financial performance.
(g) Foreign currenciesThe consolidated financial statements are presented in Sterling, which is the Company’s functional and presentation currency. Transactions in foreign currencies are initially recorded in the functional currency at the rate ruling at the date of transaction. Monetary assets and liabilities denominated in foreign currencies are retranslated at the functional currency rate of exchange ruling at the balance sheet date. All differences are taken to the income statement. Non-monetary items that are measured in terms of historical cost in a foreign currency are translated using the exchange rates as at the dates of the initial transactions.

Financial statements
Zytronic plc Annual Report and Financial Statements 201532
Notes to the consolidated financial statements continuedFor the year ended 30 September 2015
1. Accounting policies continued(h) Property, plant and equipmentProperty, plant and equipment is stated at cost less accumulated depreciation and impairment charges. Such costs include those directly attributable to making the asset capable of operating as intended and the cost of replacing significant parts of such plant and equipment when that cost is incurred, if the recognition criteria are met. Depreciation is provided on all property, plant and equipment, other than freehold land, at rates calculated to write off the cost, less estimated residual value, of each asset evenly over its expected useful life, as follows:
Freehold land – NilFreehold property – 50 yearsLong leasehold property – 50 yearsPlant and machinery – varying rates between 5% and 25% per annum
Any gain or loss arising on disposal of an asset (calculated as the difference between the net disposal proceeds and the carrying amount of the asset) is included in the income statement in the year the asset is derecognised.
The assets’ residual values, useful lives and methods of depreciation are reviewed at each financial year end and adjusted, if appropriate. The Group assesses at each reporting date whether there is an indication that an asset may be impaired. If any such indication exists the Group makes an estimate of the asset’s recoverable amount. An asset’s recoverable amount is the higher of the asset’s fair value, or the cash-generating unit’s fair value of which it forms part, less costs to sell and its value in use and is determined for an individual asset, unless the asset does not generate cash inflows that are largely independent of those from other assets or groups of assets. Where the carrying amount of an asset exceeds its recoverable amount, the asset is considered impaired and is written down to its recoverable amount. Impairment losses of continuing operations are recognised in the income statement in those expense categories consistent with the function of the impaired asset.
(i) Intangible assetsIntangible assets acquired separately are measured on initial recognition at cost. The cost of intangible assets acquired in a business combination is deemed to be their fair value as at the date of acquisition. Following initial recognition, intangible assets are carried at cost less any accumulated amortisation and any accumulated impairment losses. Other than capitalised development costs, internally generated intangible assets are not capitalised.
Intangible assets are amortised on a straight line basis over their useful economic lives and reviewed for impairment at each financial year end. The amortisation expense on intangible assets is recognised in the income statement in the expense category consistent with the function of the intangible asset. The estimated useful lives are as follows:
Patents – 20 yearsLicences – period of licensing agreements (ten and 17 years)Capitalised development expenditure – four or ten yearsSoftware – four years
Intangible assets with indefinite useful lives, such as goodwill, are tested for impairment annually and are not amortised. The useful life of an intangible asset with an indefinite life is reviewed annually to determine whether indefinite life assessment continues to be supportable.
Patent applicationsThe costs associated with the drafting and filing of patent applications are capitalised as incurred.
Those costs are not amortised until the patent has been granted, after which they will be amortised over its useful economic life of 20 years. If the application fails, the capitalised costs will then be impaired and written off.
(j) Research and development costsResearch expenditure is written off as incurred. An intangible asset arising from development expenditure on an individual project is recognised only when the Group can demonstrate the technical feasibility of completing the intangible asset so that it will be available for use or sale, its intention to complete and its ability to use or sell the asset, how the asset will generate future economic benefits, the availability of resources to complete the asset and the ability to measure reliably the expenditure during the development.
During the period of development, the asset is tested annually for impairment. Following the initial recognition of the development expenditure, the cost model (as defined in IFRS) is applied, requiring the asset to be carried at cost less any accumulated amortisation and accumulated impairment losses. Amortisation of the asset begins when development is complete and the asset is available for use. It is amortised over the period of expected future sales.
(k) InventoriesInventories are valued at the lower of cost and net realisable value. Costs incurred in bringing each product to its present location and condition are accounted for as follows:
Raw materials and consumables – purchase cost on a first-in, first-out basisFinished goods and work in progress – cost of direct materials and labour and a proportion of manufacturing overheads based on normal
operating capacity but excluding borrowing costs
Net realisable value is the estimated selling price in the ordinary course of business, less estimated costs of completion and the estimated costs necessary to make the sale.

Corporate governance Financial statementsStrategic report
Annual Report and Financial Statements 2015 Zytronic plc 33
1. Accounting policies continued(l) Trade and other receivablesTrade receivables are recognised and carried at their original amount less an allowance for any uncollectable amounts. An estimate for doubtful debts is made when collection of the full amount is no longer probable. Bad debts are written off when identified. Trade and other receivables do not carry interest.
(m) Cash and cash equivalents Cash and short term deposits in the balance sheet comprise cash at bank and in hand and short term deposits with an initial maturity of three months or less or for a longer period but with the ability to break the deposit with a similar notice period. Bank overdrafts are shown within financial assets on the balance sheet as the Group has a set-off arrangement in place. For the purpose of the cashflow statement, cash and cash equivalents comprise these balances, net of outstanding bank overdrafts.
(n) Interest-bearing loans and borrowingsAll loans and borrowings are initially recognised at the fair value of the consideration received less directly attributable transaction costs. After initial recognition, interest-bearing loans and borrowings are subsequently measured at amortised cost using the effective interest method.
Gains and losses are recognised in the income statement when the liabilities are derecognised, as well as through the amortisation process.
Borrowing costs directly attributable to the acquisition, construction or production of an asset that necessarily takes a substantial period of time to get ready for its intended use are capitalised as part of the costs of the respective assets. All other borrowing costs are expensed in the period they occur. Borrowing costs consist of interest and other costs that an entity incurs in connection with the borrowing of funds.
(o) Derecognition of financial assets and liabilitiesA financial asset or financial liability is derecognised when the contract that gives rise to it is discharged, sold, cancelled or expires.
Where an existing financial liability is replaced by another from the same lender on substantially different terms, or the terms of an existing liability are substantially modified, such an exchange or modification is treated as a derecognition of the original liability and the recognition of a new liability, and the difference in the respective carrying amounts is recognised in the income statement.
(p) Financial instrumentsFair value measurement of financial instrumentsThe Group measures financial instruments, such as derivatives, at fair value at each balance sheet date. Fair value is the price that would be received to sell an asset, or paid to transfer a liability in an orderly transaction between market participants at the measurement date.
The Group uses valuation techniques that are appropriate in the circumstances and for which sufficient data are available to measure fair value, maximising the use of relevant observable inputs and minimising the use of unobservable inputs.
All assets and liabilities for which fair value is measured or disclosed in the financial statements are categorised within the fair value hierarchy, described as follows, based on the lowest level input that is significant to the fair value measurement as a whole:
Level 1: quoted (unadjusted) market prices in active markets for identical assets or liabilities;
Level 2: valuation techniques for which the lowest level input that is significant to the fair value measurement is directly or indirectly observable; and
Level 3: valuation techniques for which the lowest level input that is significant to the fair value measurement is unobservable.
(q) Pension schemeThe Group operates a group personal pension scheme, which is a defined contribution scheme, for its employees. Contributions are recognised in the income statement as they become payable in accordance with the rules of the scheme.
(r) Share-based payment transactionsEquity-settled transactionsThe cost of equity-settled transactions with employees is measured by reference to the fair value at the date at which they are granted and is recognised as an expense over the vesting period, which ends on the date on which the relevant employees become fully entitled to the award. Fair value is determined using an appropriate pricing model. In valuing equity-settled transactions, no account is taken of any service performance conditions (vesting conditions), other than performance conditions linked to the price of the shares of the Company (market conditions). Any other conditions which are required to be met in order for an employee to become fully entitled to an award are considered to be non-vesting conditions. Like market performance conditions, non-vesting conditions are taken into account in determining the grant date fair value.
No expense is recognised for awards that do not ultimately vest, except for awards where vesting is conditional upon a market vesting condition, which are treated as vesting irrespective of whether or not the market vesting condition or non-vesting condition is satisfied, provided that all other non-market vesting conditions are satisfied.
At each balance sheet date before vesting, the cumulative expense is calculated, representing the extent to which the vesting period has expired and management’s best estimate of the achievement or otherwise of non-market vesting conditions and the number of equity instruments that will ultimately vest or, in the case of an instrument subject to a market vesting condition or a non-vesting condition, be treated as vesting. The movement in cumulative expense since the previous balance sheet date is recognised in the income statement, with a corresponding entry in equity.

Financial statements
Zytronic plc Annual Report and Financial Statements 201534
Notes to the consolidated financial statements continuedFor the year ended 30 September 2015
1. Accounting policies continued(r) Share-based payment transactions continuedEquity-settled transactions continuedWhere the terms of an equity-settled award are modified or a new award is designated as replacing a cancelled or settled award, the cost based on the original award terms continues to be recognised over the original vesting period. In addition, an expense is recognised over the remainder of the new vesting period for the incremental fair value of any modification, based on the difference between the fair value of the original award and the fair value of the modified award, both as measured on the date of the modification. No reduction is recognised if this difference is negative.
Where an equity-settled award is cancelled (including when a non-vesting condition within the control of the entity or employee is not met), it is treated as if it had vested on the date of cancellation and any cost not yet recognised in the income statement for the award is expensed immediately. Any compensation paid up to the fair value of the award at the cancellation or settlement date is deducted from equity, with any excess over fair value being treated as an expense in the income statement.
(s) Employee benefits Certain employees of the Group participate in a long term incentive scheme, whereby they will achieve additional remuneration in the form of a cash bonus and share options on achievement of predetermined performance measures. The bonus payable and options exercisable are considered in conjunction with assumptions over potential leavers and also the likelihood of performance targets being met. Bonuses expected to become payable are attributed to each of the years in which the award is earned.
(t) Revenue recognitionRevenue from the sale of goods is recognised when the significant risks and rewards of ownership of the goods have passed to the buyer. This is when the goods have been dispatched or made available to the customer, an invoice has been raised for them and the Group’s obligations to the customer have been met. There is not usually any significant delay between the occurrence of these three events.
Revenue is measured at the fair value of the consideration received, excluding discounts, rebates and other sales taxes. Appropriate provisions for known returns are deducted from revenue.
(u) Government grants and subsidiesGovernment grants are recognised where there is reasonable assurance that the grant will be received and all attaching conditions will be complied with, normally when a grant claim has been approved by the government authority and the grant monies have been received. The fair value of grants is credited to a deferred income account and released to the income statement over the life of the projects to which they relate.
The interest rate subsidy received, as a discounted upfront cash sum, by the Group under the National Loan Guarantee Subsidy Scheme has been credited to a deferred interest subsidy account and will be released to the income statement over the life of the loan upon which it is based.
(v) Royalty paymentsUnder the terms of its patent licence, Zytronic Displays Limited pays royalties to the patent owner on the value of the touch sensors that it sells. An agreed annual payment is made by monthly instalment under the licence.
In the event that the actual quarterly royalties due from Zytronic Displays Limited exceed the payments on account for that quarter, Zytronic Displays Limited pays the balance to the patent owner.
In the event that the payments on account for that quarter exceed the actual royalties due to that date, the excess payment is treated by Zytronic Displays Limited as a prepayment of royalties that will become due in the future. Similarly, should the annual agreed payment be in excess of the royalties due for the year, the difference is rolled over and deducted from future years’ royalty calculations.
Management reviews its forecasts of future sales to determine whether any impairment has occurred which might affect the carrying value of the prepayment.
From 1 January 2008, and for each subsequent calendar year, the annual payment will increase either by the greater of RPI or to the level of the previous year’s actual royalties.
The royalty licence agreement expired as of April 2015.
(w) Deferred taxDeferred tax is recognised in respect of all temporary differences arising between the tax bases of assets and liabilities and their carrying amounts in the financial statements, with the following exceptions:
C where the temporary difference arises from the initial recognition of goodwill or of an asset or liability in a transaction that is not a business combination that at the time of the transaction affects neither accounting nor taxable profit or loss;
C in respect of taxable temporary differences associated with investments in subsidiaries, associates and joint ventures, where the timing of the reversal of the temporary differences can be controlled and it is probable that the temporary differences will not reverse in the foreseeable future; and
C deferred taxation assets are recognised only to the extent that the Directors consider that it is more likely than not that there will be suitable taxable profits from which the future reversal of the underlying timing differences can be deducted.
Deferred tax is measured on an undiscounted basis at the tax rates that are expected to apply in the periods in which the related asset or liability is settled, based on tax rates and laws enacted or substantively enacted at the balance sheet date.
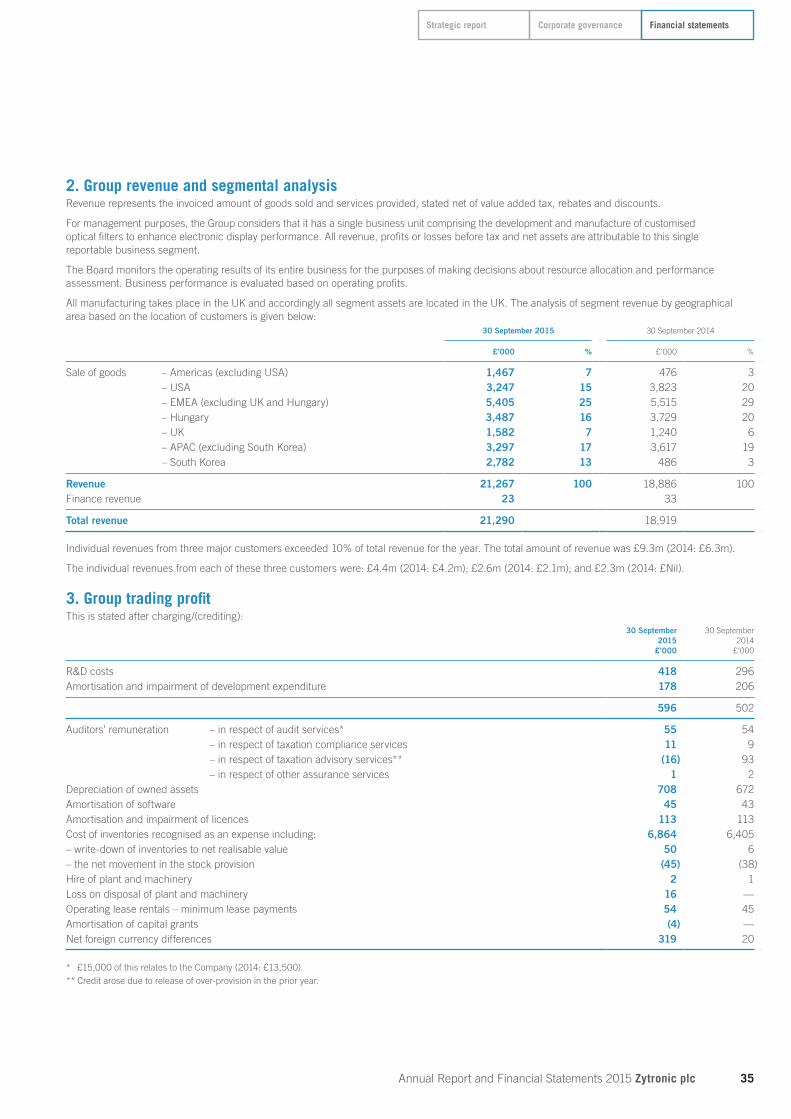
Corporate governance Financial statementsStrategic report
Annual Report and Financial Statements 2015 Zytronic plc 35
2. Group revenue and segmental analysisRevenue represents the invoiced amount of goods sold and services provided, stated net of value added tax, rebates and discounts.
For management purposes, the Group considers that it has a single business unit comprising the development and manufacture of customised optical filters to enhance electronic display performance. All revenue, profits or losses before tax and net assets are attributable to this single reportable business segment.
The Board monitors the operating results of its entire business for the purposes of making decisions about resource allocation and performance assessment. Business performance is evaluated based on operating profits.
All manufacturing takes place in the UK and accordingly all segment assets are located in the UK. The analysis of segment revenue by geographical area based on the location of customers is given below:
30 September 2015 30 September 2014
£’000 % £’000 %
Sale of goods – Americas (excluding USA) 1,467 7 476 3 – USA 3,247 15 3,823 20 – EMEA (excluding UK and Hungary) 5,405 25 5,515 29 – Hungary 3,487 16 3,729 20 – UK 1,582 7 1,240 6 – APAC (excluding South Korea) 3,297 17 3,617 19 – South Korea 2,782 13 486 3
Revenue 21,267 100 18,886 100Finance revenue 23 33
Total revenue 21,290 18,919
Individual revenues from three major customers exceeded 10% of total revenue for the year. The total amount of revenue was £9.3m (2014: £6.3m).
The individual revenues from each of these three customers were: £4.4m (2014: £4.2m); £2.6m (2014: £2.1m); and £2.3m (2014: £Nil).
3. Group trading profitThis is stated after charging/(crediting):
30 September 30 September2015 2014
£’000 £’000
R&D costs 418 296Amortisation and impairment of development expenditure 178 206
596 502
Auditors’ remuneration – in respect of audit services* 55 54 – in respect of taxation compliance services 11 9 – in respect of taxation advisory services** (16) 93 – in respect of other assurance services 1 2Depreciation of owned assets 708 672Amortisation of software 45 43Amortisation and impairment of licences 113 113Cost of inventories recognised as an expense including: 6,864 6,405– write-down of inventories to net realisable value 50 6– the net movement in the stock provision (45) (38)Hire of plant and machinery 2 1Loss on disposal of plant and machinery 16 —Operating lease rentals – minimum lease payments 54 45Amortisation of capital grants (4) —Net foreign currency differences 319 20
* £15,000 of this relates to the Company (2014: £13,500).** Credit arose due to release of over-provision in the prior year.

Financial statements
Zytronic plc Annual Report and Financial Statements 201536
Notes to the consolidated financial statements continuedFor the year ended 30 September 2015
4. Staff costs and Directors’ emoluments30 September 30 September
2015 2014£’000 £’000
Wages and salaries 4,997 4,601Social security costs 411 383Other pension costs 143 96
5,551 5,080
Included in wages and salaries is a total charge for share-based payments of £180,000 (2014: £93,000), all of which arises from transactions accounted for as equity-settled share-based payment transactions.
The total of Directors’ emoluments is £458,000 (2014: £438,000). The aggregate value of contributions paid to money purchase pension schemes includes £64,000 (2014: £7,000) in respect of two Directors (2014: two).
Amounts paid to the highest paid Director are £194,000 (2014: £209,000) plus a contribution paid to the money purchase pension scheme of £30,000 (2014: £4,000).
The average number of employees during the year was made up as follows:30 September 30 September
2015 2014Number Number
Production 131 128Administration and sales 43 41
174 169
The information required by AIM rule Schedule 5 of the Large and Medium Sized Companies and Groups (Accounts and Reports) Regulations 2008 is contained in the Remuneration report under Directors’ emoluments, pension contributions, Directors’ shareholdings and Directors’ share options.
5. Finance costs payable and revenue receivable(a) Finance costs
30 September 30 September2015 2014
Interest payable £’000 £’000
Bank loans and overdrafts 29 35
(b) Finance revenue30 September 30 September
2015 2014Interest receivable £’000 £’000
Bank interest receivable 23 33
6. Taxation30 September 30 September
2015 2014£’000 £’000
Current taxUK corporation tax 750 549Corporation tax over-provided in prior years 31 (218)
Total current tax charge 781 331
Deferred taxEffect of change in tax rates — —Origination and reversal of temporary differences (6) (30)
Total deferred tax credit (6) (30)
Tax charge in the income statement 775 301

Corporate governance Financial statementsStrategic report
Annual Report and Financial Statements 2015 Zytronic plc 37
6. Taxation continuedTax relating to items credited to equity
30 September 30 September2015 2014
£’000 £’000
Deferred tax Tax on share-based payments (28) —
Total deferred tax debit (28) —
Tax charge in the statement of changes in equity (28) —
Reconciliation of the total tax chargeThe effective tax rate of the tax expense in the income statement for the year is 17.1% (2014: 9.2%) compared with the average rate of corporation tax in the UK of 20.5% (2014: 22.0%). The differences are reconciled below:
30 September 30 September2015 2014
£’000 £’000
Accounting profit before tax 4,544 3,261
Accounting profit multiplied by the UK average rate of corporation tax of 20.5% (2014: 22.0%) 932 717Effects of:(Income not chargeable)/expenses not deductible for tax purposes (19) (14)“Gain” on exercise of share options allowable for tax purposesbut not reflected in the income statement (25) (25)Depreciation in respect of non-qualifying items 38 42Enhanced tax reliefs (179) (199)Difference in tax rates (3) (2)Tax over-provided in prior years 31 (218)
Total tax expense reported in the income statement 775 301
Factors that may affect future tax chargesUnder current tax legislation, some of the amortisation of licences will continue to be non-deductible for tax purposes.
The “gain” on the exercise of share options, being the difference between the grant/exercise price and the market value at the time of exercise, is allowable as a tax deduction from profits, although it is not reflected within the income statement. These gains will arise in future years but their timing and amount is uncertain.
There are no tax losses to carry forward at 30 September 2015 (2014: £Nil).
The main rate of tax reduced to 21% from 1 April 2014 and further reduced to 20% from 1 April 2015; this was substantively enacted on 17 July 2013. This rate of 20% has been applied to the deferred tax assets/liabilities arising at the balance sheet date.
The Patent Box regime was introduced with effect from 1 April 2013 and allows companies to apply a lower rate of corporation tax to profits attributable to qualifying patents. This may have relevance for Zytronic insofar as such profits are embedded in the sales price of products incorporating patented components. The Company is in the process of assessing its qualifying status under the regime, and, to the extent that the Company will have relevant profits under the regime, will accordingly consider whether to elect into the regime and make a claim for the additional relief available. The rules effective from 1 April 2013 may be subject to amendment following the recommendations made by the OECD as published on 5 October 2015. The Company will consider further its position in respect of Patent Box in light of any amendments resulting from the OECD recommendations.
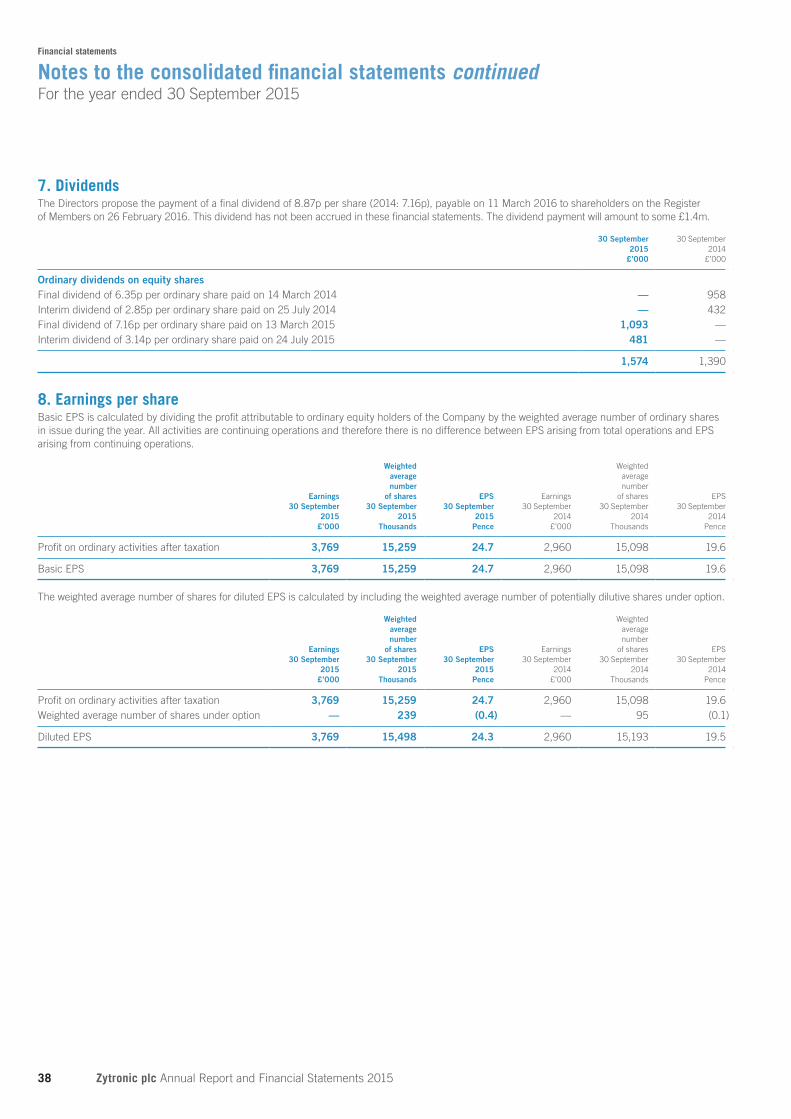
Financial statements
Zytronic plc Annual Report and Financial Statements 201538
Notes to the consolidated financial statements continuedFor the year ended 30 September 2015
7. DividendsThe Directors propose the payment of a final dividend of 8.87p per share (2014: 7.16p), payable on 11 March 2016 to shareholders on the Register of Members on 26 February 2016. This dividend has not been accrued in these financial statements. The dividend payment will amount to some £1.4m.
30 September 30 September2015 2014
£’000 £’000
Ordinary dividends on equity sharesFinal dividend of 6.35p per ordinary share paid on 14 March 2014 — 958Interim dividend of 2.85p per ordinary share paid on 25 July 2014 — 432Final dividend of 7.16p per ordinary share paid on 13 March 2015 1,093 —Interim dividend of 3.14p per ordinary share paid on 24 July 2015 481 —
1,574 1,390
8. Earnings per shareBasic EPS is calculated by dividing the profit attributable to ordinary equity holders of the Company by the weighted average number of ordinary shares in issue during the year. All activities are continuing operations and therefore there is no difference between EPS arising from total operations and EPS arising from continuing operations.
Weighted Weighted average averagenumber number
Earnings of shares EPS Earnings of shares EPS30 September 30 September 30 September 30 September 30 September 30 September
2015 2015 2015 2014 2014 2014£’000 Thousands Pence £’000 Thousands Pence
Profit on ordinary activities after taxation 3,769 15,259 24.7 2,960 15,098 19.6
Basic EPS 3,769 15,259 24.7 2,960 15,098 19.6
The weighted average number of shares for diluted EPS is calculated by including the weighted average number of potentially dilutive shares under option.
Weighted Weighted average averagenumber number
Earnings of shares EPS Earnings of shares EPS30 September 30 September 30 September 30 September 30 September 30 September
2015 2015 2015 2014 2014 2014£’000 Thousands Pence £’000 Thousands Pence
Profit on ordinary activities after taxation 3,769 15,259 24.7 2,960 15,098 19.6Weighted average number of shares under option — 239 (0.4) — 95 (0.1)
Diluted EPS 3,769 15,498 24.3 2,960 15,193 19.5
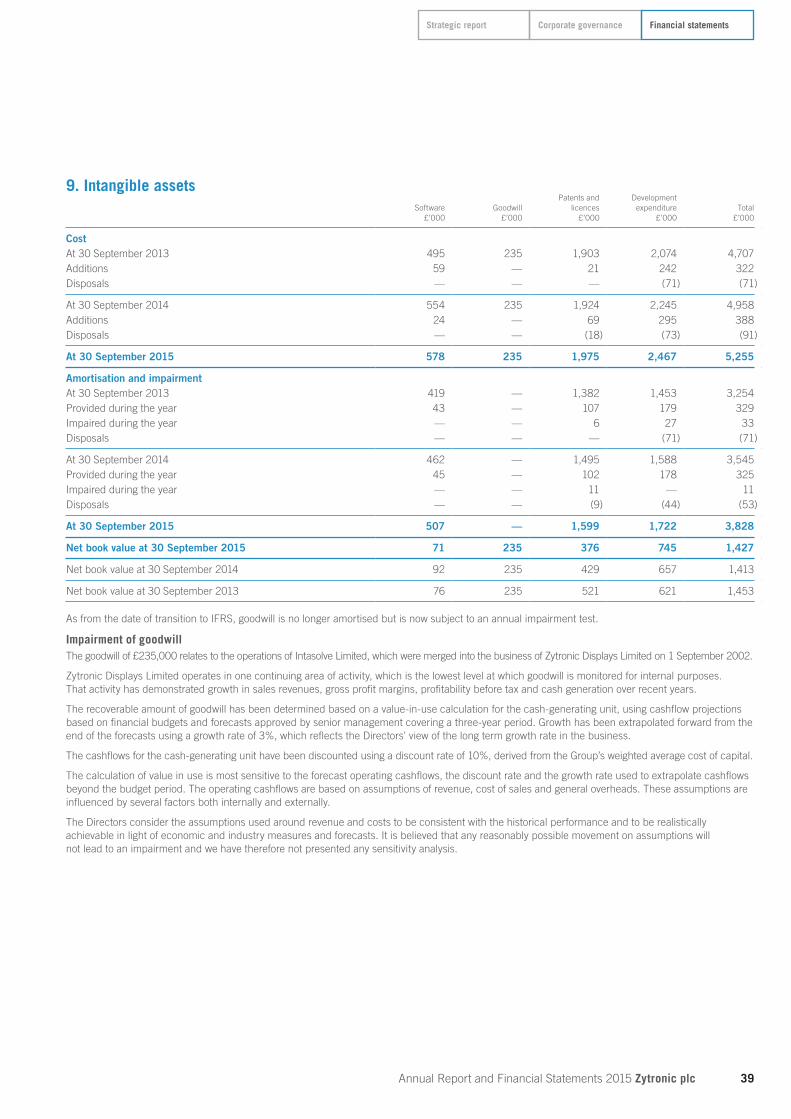
Corporate governance Financial statementsStrategic report
Annual Report and Financial Statements 2015 Zytronic plc 39
9. Intangible assetsPatents and Development
Software Goodwill licences expenditure Total£’000 £’000 £’000 £’000 £’000
CostAt 30 September 2013 495 235 1,903 2,074 4,707Additions 59 — 21 242 322Disposals — — — (71) (71)
At 30 September 2014 554 235 1,924 2,245 4,958Additions 24 — 69 295 388Disposals — — (18) (73) (91)
At 30 September 2015 578 235 1,975 2,467 5,255
Amortisation and impairmentAt 30 September 2013 419 — 1,382 1,453 3,254Provided during the year 43 — 107 179 329Impaired during the year — — 6 27 33Disposals — — — (71) (71)
At 30 September 2014 462 — 1,495 1,588 3,545Provided during the year 45 — 102 178 325Impaired during the year — — 11 — 11Disposals — — (9) (44) (53)
At 30 September 2015 507 — 1,599 1,722 3,828
Net book value at 30 September 2015 71 235 376 745 1,427
Net book value at 30 September 2014 92 235 429 657 1,413
Net book value at 30 September 2013 76 235 521 621 1,453
As from the date of transition to IFRS, goodwill is no longer amortised but is now subject to an annual impairment test.
Impairment of goodwillThe goodwill of £235,000 relates to the operations of Intasolve Limited, which were merged into the business of Zytronic Displays Limited on 1 September 2002.
Zytronic Displays Limited operates in one continuing area of activity, which is the lowest level at which goodwill is monitored for internal purposes. That activity has demonstrated growth in sales revenues, gross profit margins, profitability before tax and cash generation over recent years.
The recoverable amount of goodwill has been determined based on a value-in-use calculation for the cash-generating unit, using cashflow projections based on financial budgets and forecasts approved by senior management covering a three-year period. Growth has been extrapolated forward from the end of the forecasts using a growth rate of 3%, which reflects the Directors’ view of the long term growth rate in the business.
The cashflows for the cash-generating unit have been discounted using a discount rate of 10%, derived from the Group’s weighted average cost of capital.
The calculation of value in use is most sensitive to the forecast operating cashflows, the discount rate and the growth rate used to extrapolate cashflows beyond the budget period. The operating cashflows are based on assumptions of revenue, cost of sales and general overheads. These assumptions are influenced by several factors both internally and externally.
The Directors consider the assumptions used around revenue and costs to be consistent with the historical performance and to be realistically achievable in light of economic and industry measures and forecasts. It is believed that any reasonably possible movement on assumptions will not lead to an impairment and we have therefore not presented any sensitivity analysis.

Financial statements
Zytronic plc Annual Report and Financial Statements 201540
Notes to the consolidated financial statements continuedFor the year ended 30 September 2015
10. Property, plant and equipmentThe amounts carried in the balance sheet comprise:
LongFreehold leasehold Plant and
Land property property machinery Total£’000 £’000 £’000 £’000 £’000
Cost At 30 September 2013 207 3,070 2,413 8,541 14,231Additions — — 11 252 263Disposals — — — (38) (38)
At 30 September 2014 207 3,070 2,424 8,755 14,456Additions — — 1 1,090 1,091Disposals — — — (91) (91)
At 30 September 2015 207 3,070 2,425 9,754 15,456
Depreciation and impairmentAt 30 September 2013 — 339 292 5,712 6,343Provided during the year — 61 80 531 672Disposals — — — (2) (2)
At 30 September 2014 — 400 372 6,241 7,013Provided during the year — 62 80 566 708Disposals — — — (72) (72)
At 30 September 2015 — 462 452 6,735 7,649
Net book value at 30 September 2015 207 2,608 1,973 3,019 7,807
Net book value at 30 September 2014 207 2,670 2,052 2,514 7,443
Net book value at 30 September 2013 207 2,731 2,121 2,829 7,888
11. Inventories30 September 30 September
2015 2014£’000 £’000
Raw materials and consumables 1,984 1,970Work in progress 377 409Finished goods 853 747
3,214 3,126
The difference between purchase price or production cost of stocks and their replacement cost is not material.
12. Trade and other receivablesCurrent assets
30 September 30 September2015 2014
£’000 £’000
Trade receivables 2,773 2,784VAT recoverable 92 123Prepayments 190 161
3,055 3,068

Corporate governance Financial statementsStrategic report
Annual Report and Financial Statements 2015 Zytronic plc 41
12. Trade and other receivables continuedCurrent assets continuedTrade receivables are denominated in the following currencies:
30 September 30 September2015 2014
£’000 £’000
Sterling 807 735US Dollar 1,164 861Euro 802 1,188
2,773 2,784
Out of the carrying amount of trade receivables of £2.8m (2014: £2.8m), £1.8m (2014: £1.5m) is the amount of debts owed by three major customers. Regular reviews are undertaken on these major customers so as to ascertain that there are no going concern issues with them.
Trade receivables are non-interest bearing and are generally on 30 to 60-day terms. They are shown net of a provision for impairment.
As at 30 September 2015, trade receivables at a nominal value of £26,000 (2014: £23,000) were impaired due to poor payment history. Movements in the provision for impairment of trade receivables were as follows:
£’000
At 30 September 2013 35Charge for the year —Utilised (12)
At 30 September 2014 23Charge for the year 3Utilised —
At 30 September 2015 26
At 30 September, the ageing analysis of trade receivables overdue but not impaired was as follows: Past due but not impaired
Neither past due <3 months >3 months Totalnor impaired £’000 £’000 £’000
2015 2,147 625 1 2,773
2014 1,736 1,031 17 2,784
Credit limits are set for each customer, using Dun & Bradstreet credit reports as appropriate, or pro-forma invoices are raised, or cash upfront is received for a new customer where a credit limit is not easily established. Slow payers are chased vigorously, including making use of solicitors in the collection process. The credit quality of trade receivables that are neither past due nor impaired is assessed by reference to external credit ratings where available; otherwise, historical information relating to counterparty default rates is used.
13. Cash and short term deposits30 September 30 September
2015 2014£’000 £’000
Cash at bank and in hand 8,583 6,950Short term deposits 2,578 2,560Bank overdrafts (1,326) (1,704)
9,833 7,806
Cash at bank earns interest at floating rates based on daily bank deposit rates. Short term deposits are made for variable lengths being overnight, three months or one year (with break conditions), depending on the immediate cash requirements of the Group, and earn interest at variable rates.
At 30 September 2015, the Group had available a net £1.0m (total cash less overdrawn accounts) overdraft facility from Barclays Bank plc which will fall for review in November 2016.
The fair value of cash and cash equivalents is £9.8m (2014: £7.8m).

Financial statements
Zytronic plc Annual Report and Financial Statements 201542
Notes to the consolidated financial statements continuedFor the year ended 30 September 2015
14. Trade and other payables30 September 30 September
2015 2014£’000 £’000
Trade payables 870 961Other taxes and social security costs 101 96
971 1,057Accruals 1,201 1,264
2,172 2,321
Terms and conditions of the above financial liabilities:
C trade payables are non-interest bearing and are normally settled on 30-day terms.
15. Financial assets and financial liabilities(a) Financial assetsFinancial assets at fair value through the income statement
30 September 30 September2015 2014
£’000 £’000
Derivatives not designated as hedges Foreign exchange forward contracts — 48
(b) Financial liabilities30 September 30 September
2015 2014Loans £’000 £’000
Bank loan – current 200 200Bank loan – non-current 1,144 1,341Foreign exchange forward contracts 89 224
Total 1,433 1,765
Total current 289 424
Total non-current 1,144 1,341
The foreign exchange forward contract assets and liabilities above are measured at fair value through the income statement as they are not in designated hedge relationships. They are, nevertheless, intended to reduce the level of foreign currency risk for expected sales and purchases.
Property mortgageOn 29 June 2012, Zytronic plc borrowed £2.0m under a ten-year mortgage (to be re-financed after five years) with Barclays Bank plc to re-mortgage the borrowings on its three properties. The funds are repayable in quarterly instalments of £50,000. Interest is payable at 2.35% above three-month LIBOR, offset by a National Loan Guarantee Scheme subsidy. The balance is shown net of issue costs which are being amortised over five years.
(c) Fair valuesThe fair value of the financial assets and liabilities is included at the amount at which the instrument could be exchanged in a current transaction between willing parties, other than in a forced or liquidation sale.
Management asserts that the fair value of cash, trade debtors and trade creditors approximate to their carrying amounts largely due to the short term maturities of these instruments.
The Group uses the following hierarchy for determining and disclosing the fair value of financial instruments by valuation technique:
Level 1: quoted (unadjusted) prices in active markets for identical assets or liabilities;
Level 2: other techniques for which all inputs which have a significant effect on the recorded fair value are observable, either directly or indirectly; and
Level 3: techniques which use inputs which have a significant effect on the recorded fair value that are not based on observable market data.
At 30 September 2015, the Group has used a Level 2 valuation technique to determine the fair value of all forward exchange contracts and loans.

Corporate governance Financial statementsStrategic report
Annual Report and Financial Statements 2015 Zytronic plc 43
15. Financial assets and financial liabilities continuedDerivative financial instrumentsThe Group enters into derivative financial instruments with financial institutions. Derivatives valued using valuation techniques with market observable inputs are foreign exchange forward contracts. The most frequently applied valuation techniques include forward pricing and swap models, using present value calculations prepared by the financial institutions. The models incorporate foreign exchange spot and forward rates, and interest rate curves. These derivatives are valued externally by the financial institutions using both intrinsic value and time value, which is standard market practice.
LoansThe fair value of the Group’s interest-bearing loans are determined by discounting future cashflows using rates currently available for debt on similar terms, credit risk and remaining maturities. The fair value of the loan outstanding at 30 September 2015 is not significantly different to its book value.
16. ProvisionsLong term
Holiday pay incentive plan Total£’000 £’000 £’000
At 1 October 2014 71 68 139Arising during the year — 68 68Released during the year (71) — (71)
At 30 September 2015 — 136 136
Non-current — 136 136
Holiday payThe holiday pay provision related to the estimated exposure to additional costs in relation to inclusion of overtime in holiday payments as a result of rulings on the interpretation of the Working Time Directive. During the year, the Group began to include overtime as part of its holiday payments. This decision and the amount of time lapsed enabled the release of the provision.
Long term incentive planThe provision for the long term incentive scheme relating to the Chief Executive, the Group Finance Director and other management personnel is calculated based on future expectations that the bonus will be payable. Management has assessed the criteria that determine the payout and taken a view that a proportion of the bonus should again be provided for in the year ended 30 September 2015.
The provision included in the table above is expected to be utilised after the announcement of the financial year 2016 results, provided the performance targets have been achieved.
17. Government grants30 September 30 September
2015 2014£’000 £’000
At 1 October — —Received during the year 63 —Released to the income statement (4) —
At 30 September 59 —
Non-current 59 —
Government grants have been received as part of R&D work on a European Commission (“EC”) consortium project.
There are no unfulfilled obligations or contingencies attached to these grants.

Financial statements
Zytronic plc Annual Report and Financial Statements 201544
Notes to the consolidated financial statements continuedFor the year ended 30 September 2015
18. Obligations under leasesMinimum lease payments under non-cancellable operating leases are as follows:
30 September 30 September2015 2014
Group as lessee £’000 £’000
Operating leases which expire:– not later than one year 26 30– later than one year and not later than five years 12 28
38 58
19. Deferred taxation liability/(asset)The deferred tax included in the balance sheet is as follows:
30 September 30 September2015 2014
£’000 £’000
Deferred tax liability Accelerated capital allowances 532 496R&D tax credit 148 128Other 12 14
692 638
Deferred tax assetShare-based payment (100) (40)Pension asset (2) (2)
(102) (42)
Disclosed on the balance sheet 590 596
The deferred tax included in the Group income statement is as follows:30 September 30 September
2015 2014£’000 £’000
Deferred tax in the income statementAccelerated capital allowances 36 (3)R&D tax credits 20 10Share-based payment (60) (39)Other 10 4
6 (28)Effect of change in tax rates — (2)
Deferred income tax expense 6 (30)

Corporate governance Financial statementsStrategic report
Annual Report and Financial Statements 2015 Zytronic plc 45
20. Financial risk management policy and financial instrumentsThe Group’s principal financial instruments comprise one secured bank loan, an overdraft facility and cash. The main purpose of these financial instruments is to raise finance for the Group’s operations. The Group has various other financial instruments, such as trade receivables and trade payables, that arise directly from its operations.
The main risks associated with the Group’s financial assets and liabilities are set out below:
Credit riskThe risk of financial loss due to a counterparty’s failure to honour its obligations arises principally in relation to transactions where the Group provides goods on deferred terms.
Group policies are aimed at minimising such losses and require that deferred terms are granted only to customers who demonstrate an appropriate payment history and/or satisfy creditworthiness procedures. Individual exposures are monitored with customers subject to credit limits to ensure that the Group’s exposure to bad debts is not significant. Goods may be sold on a cash-with-order basis to mitigate credit risk.
Management’s assessment of the maximum credit risk exposure relating to financial assets is represented by the carrying value as at the balance sheet date.
Liquidity riskThe Group aims to mitigate liquidity risk by managing cash generated by its operations. Capital expenditure is approved at Group level.
Flexibility is maintained by retaining surplus cash in readily accessible bank accounts.
The Group has an unsecured net overdraft facility of £1.0m arranged with its principal banker, Barclays Bank plc. This facility extends until November 2016 and is to provide funding for working capital.
In January 2006, the Company acquired a freehold property and in May and June 2009 the Company acquired the freehold of, and a 999-year lease on, its existing two leased factories. To manage liquidity risk, the Company part-funded these acquisitions using two secured property loans, each repayable over ten years. In June 2012 these two loans were repaid and were replaced by a new secured property loan of £2.0m, repayable in 20 quarterly instalments of £50,000, with the balance of £1.0m to be re-financed in 2017.
Maturity profile of financial liabilitiesYear ended 30 September 2015
Ondemand <3 months 3–12 months 1–5 years Total
£’000 £’000 £’000 £’000 £’000
Interest-bearing loans and borrowings — 60 180 1,262 1,502Trade and other payables 1,632 439 — — 2,071Foreign exchange forward contracts – outflows — 1,300 2,155 1,788 5,243
Total 1,632 1,799 2,335 3,050 8,816
Interest-bearing loans and borrowings comprise principal repayments due of £1.5m and contractual interest payments of £0.2m. Interest is calculated based on interest rates prevailing at the balance sheet date.
Year ended 30 September 2014On
demand <3 months 3–12 months 1–5 years Total£’000 £’000 £’000 £’000 £’000
Interest-bearing loans and borrowings — 61 182 1,488 1,731Trade and other payables 1,738 487 — — 2,225Foreign exchange forward contracts – outflows — 1,323 3,970 — 5,293
Total 1,738 1,871 4,152 1,488 9,249
Derivatives comprise both cashflows from derivative financial instruments with negative fair values and cashflows from derivatives with positive fair values for which gross settlement has been agreed. The cash outflows from derivatives for which gross settlement has been agreed are matched in part by cash inflows. These cash inflows are not reported in the maturity analysis above. If these cash inflows were recognised, the cashflows presented would be substantially lower.

Financial statements
Zytronic plc Annual Report and Financial Statements 201546
Notes to the consolidated financial statements continuedFor the year ended 30 September 2015
20. Financial risk management policy and financial instruments continuedForeign exchange risk The Group has a policy in that forward contracts are used to sell surplus US Dollars and Euros, generated from sales less purchases in those currencies. Contracts are in place at 30 September 2015 for a period of up to twelve to 18 months ahead so that the budgeted US Dollar and Euro rates are known. Any additional surplus currency at the end of each month is dealt with at spot rates. Following 30 September 2015, the Group has entered into further forward extra exchange contracts to protect both US Dollars and Euros. The US Dollar is protected at a rate of $1.5370 and $1.5272 for March 2017 and April 2017 respectively. The Euro is protected at a rate of €1.3832 and €1.4059 for October 2016 and November 2016 respectively.
Foreign currency risk is the risk that the fair value of future cashflows of a financial instrument will fluctuate because of changes in foreign exchange rates. The Group’s exposure to the risk of changes in foreign exchange rates relates primarily to the Group’s operating activities (when revenue or expense are denominated in a different currency from the Group’s functional currency).
The Group entered into forward extra exchange contracts and forward vanilla contracts during the year in both US Dollars and Euros. A series of six one-monthly contracts may be triggered for the US Dollar depending on the movement of the US Dollar rate within each month. A protection rate of $1.62 offers the worst case scenario for exchange with the trigger being granted at $1.42. Movements between these two rates offer the best possible outcome and these contracts are in place until March 2016. The forward vanilla contracts are fixed over a series of eleven one-monthly contracts at rates between $1.48 and $1.56, and are in place until February 2017.
A series of three one-monthly contracts may be triggered for the Euro depending on the movement of the Euro rate within each month. A protection rate of €1.28 offers the worst case scenario for exchange with the trigger being granted at €1.21. These contracts are in place until December 2015. The forward vanilla contracts are fixed over a series of nine one-monthly contracts at rates between €1.34 and €1.41, and are in place until September 2016.
The following table demonstrates the sensitivity to a reasonably possible change in the US Dollar and Euro exchange rates, with all other variables held constant, of the Group’s profit before tax (due to changes in the fair value of monetary assets and liabilities).
Effect on profit Effect on profitChange in before tax Change in before tax
US Dollar rate £’000 Euro rate £’000
2015Sterling +5% (11) +5% (2)
-5% 12 -5% 2
2014Sterling +5% 13 +5% (14)
-5% (12) -5% 13
Interest rate riskThe Group has not sought to tie itself into fixed rate debt but has instead accepted a degree of interest rate risk from having only floating rate debt. This is because the Group has positive net cash balances, a relatively low level of borrowings and estimates that an increase of 1% in interest rates would not have a material effect on the Group’s pre-tax profits.
The following table demonstrates the sensitivity to a reasonably possible change in interest rates, with all other variables held constant, of the Group’s profit before tax (through the impact on floating rate borrowings). There is no impact on the Group’s equity.
EffectIncrease/ on profit
decrease in before taxbasis points £’000
2015Sterling +100 (10)
–100 10
2014Sterling +100 (18)
–100 18
The floating rate financial assets comprise cash. The benchmarks for floating rates on both liabilities and assets are LIBOR and the Bank of England base rate.
Capital managementThe Group’s policies on capital management are included in the Directors’ report on page 20.
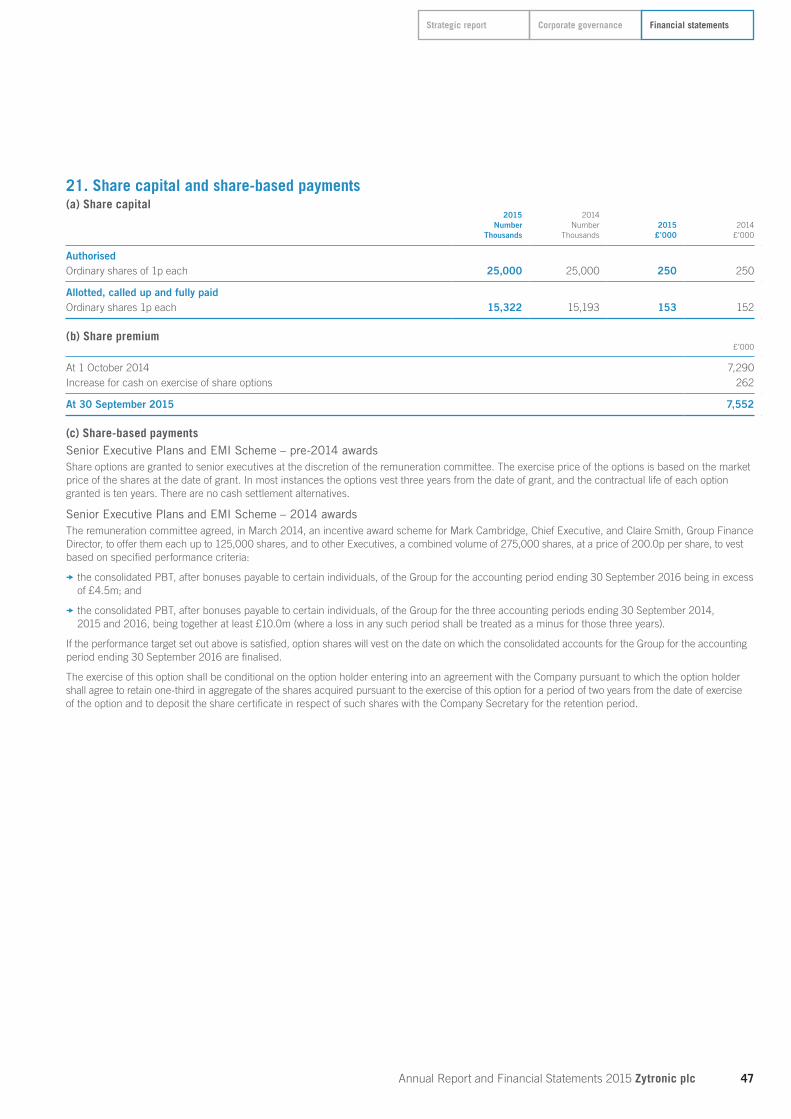
Corporate governance Financial statementsStrategic report
Annual Report and Financial Statements 2015 Zytronic plc 47
21. Share capital and share-based payments(a) Share capital
2015 2014Number Number 2015 2014
Thousands Thousands £’000 £’000
AuthorisedOrdinary shares of 1p each 25,000 25,000 250 250
Allotted, called up and fully paidOrdinary shares 1p each 15,322 15,193 153 152
(b) Share premium£’000
At 1 October 2014 7,290Increase for cash on exercise of share options 262
At 30 September 2015 7,552
(c) Share-based paymentsSenior Executive Plans and EMI Scheme – pre-2014 awardsShare options are granted to senior executives at the discretion of the remuneration committee. The exercise price of the options is based on the market price of the shares at the date of grant. In most instances the options vest three years from the date of grant, and the contractual life of each option granted is ten years. There are no cash settlement alternatives.
Senior Executive Plans and EMI Scheme – 2014 awardsThe remuneration committee agreed, in March 2014, an incentive award scheme for Mark Cambridge, Chief Executive, and Claire Smith, Group Finance Director, to offer them each up to 125,000 shares, and to other Executives, a combined volume of 275,000 shares, at a price of 200.0p per share, to vest based on specified performance criteria:
C the consolidated PBT, after bonuses payable to certain individuals, of the Group for the accounting period ending 30 September 2016 being in excess of £4.5m; and
C the consolidated PBT, after bonuses payable to certain individuals, of the Group for the three accounting periods ending 30 September 2014, 2015 and 2016, being together at least £10.0m (where a loss in any such period shall be treated as a minus for those three years).
If the performance target set out above is satisfied, option shares will vest on the date on which the consolidated accounts for the Group for the accounting period ending 30 September 2016 are finalised.
The exercise of this option shall be conditional on the option holder entering into an agreement with the Company pursuant to which the option holder shall agree to retain one-third in aggregate of the shares acquired pursuant to the exercise of this option for a period of two years from the date of exercise of the option and to deposit the share certificate in respect of such shares with the Company Secretary for the retention period.

Financial statements
Zytronic plc Annual Report and Financial Statements 201548
Notes to the consolidated financial statements continuedFor the year ended 30 September 2015
21. Share capital and share-based payments continued(c) Share-based payments continuedSenior Executive Plans and EMI Scheme – 2014 awards continuedDuring the year the Group had two share option schemes in place: an Unapproved Executive Option Scheme and an Enterprise Management Incentive (“EMI”) Scheme. Under these schemes, options to subscribe for the Company’s shares have been granted as follows:
Granted Exercised Lapsed30 September during during during 30 September
2014 year year year 2015 Exercise OptionNumber Number Number Number Number dates price
Unapproved Executive Option Scheme 20,000 — — — 20,000 29 March 2016 to 172.8p
28 March 2021141,861 — — — 141,861 December 2016 to 200.0p
December 2018EMI Scheme 24,000 — — (24,000) — 11 January 2009 to 274.5p
10 January 2016 15,000 — (10,000) — 5,000 28 February 2011 to 216.5p
27 February 2018 32,500 — (32,500) — — 15 July 2013 to 177.5p
15 July 2020 24,000* — (24,000) — — 6 October 2013 to 176.0p
5 October 2016 31,750 — — — 31,750 29 March 2014 to 172.8p
28 March 202132,000 — (20,000) — 12,000 29 March 2014 to 216.0p
28 March 202182,823 — (32,378) — 50,445 25 January 2015 to 243.5p
24 January 202220,000 — (10,000) — 10,000 25 January 2015 to 195.0p
24 January 202220,000 — — — 20,000 29 March 2015 to 172.8p
28 March 202120,000 — — — 20,000 25 January 2016 to 195.0p
24 January 20227,500 — — — 7,500 25 January 2016 to 243.5p
24 January 202220,000 — — — 20,000 25 January 2017 to 195.0p
24 January 2022383,139 — — — 383,139 December 2016 to 200.0p
December 2018
* These options were issued on 5 October 2010, in “parallel” to options issued in 2006 (exercisable between 11 January 2009 and 10 January 2016 at 274.5p). Each individual is allowed to exercise the appropriate number of shares under either the 2006 grant or the 2010 grant (hence the term “parallel”) but not under both. The exercise of one grant automatically terminates the other grant.
There are no performance conditions attached to any share options awarded prior to the grant of options in 2014.
Income statement expense for year ended 30 September 2015The expense recognised for share-based payments in respect of employee services received during the year to 30 September 2015 is £180,000 (2014: £93,000).

Corporate governance Financial statementsStrategic report
Annual Report and Financial Statements 2015 Zytronic plc 49
21. Share capital and share-based payments continued(c) Share-based payments continuedIncome statement expense for the year ended 30 September 2015 continuedThe following table illustrates the number and weighted average exercise prices (“WAEP”) of, and movements in, share options during the year:
2015 20142015 WAEP 2014 WAEP
Number Pence Number Pence
Outstanding at 30 September 874,573 203.3 525,105 201.0Granted during the year — — 525,000 200.0Lapsed during the year (24,000) 274.5 (14,000) 274.5Exercised during the year (128,878) 204.2 (161,532) 179.0
Outstanding at 30 September 721,695 200.8 874,573 203.3
Exercisable at 30 September 129,195 207.8 159,250 202.4
For the share options outstanding as at 30 September 2015, the weighted average remaining contractual life is 4.0 years (2014: 5.0 years).
There was no grant of options during the year. The range of exercise prices for options outstanding at the end of the year was 172.8p to 243.5p (2014: 172.8p to 274.5p).
The fair value of equity-settled share options granted is estimated as at the date of grant using a model designed by the Quoted Company Alliance (based on a Black-Scholes-Merton model), taking into account the terms and conditions upon which the options were granted. The following table lists the inputs to the model used for the year ended 30 September 2014:
2014
Dividend yield 3.7%Expected share price volatility 46.0%Risk-free interest rate 2.6%Expected life of option (years) 3–7
The expected life of the options is based on historical data and is not necessarily indicative of exercise patterns that may occur. The expected volatility reflects the assumption that the historical volatility is indicative of future trends, which may also not necessarily be the actual outcome.
No other features of options grant were incorporated into the measurement of fair value.
22. Capital commitmentsAmounts contracted for at 30 September 2015 but not provided in the financial statements amounted to £959,000 (2014: £419,000) for the Group.
23. Pension scheme commitmentsContributions for the year ended 30 September 2015 amounted to £143,000 (2014: £96,000) and the outstanding contributions at the balance sheet date were £12,000 (2014: £10,000). The Group is a member of a group personal pension scheme which is a defined contribution scheme. Contributions are charged to the income statement as they become payable in accordance with the rules of the scheme. The increase in contributions for the year arises due to some employees opting to pay part of their bonus into their pension.
24. Related party transactionsThere are no related party transactions required to be disclosed in the financial statements.
The key management personnel are considered to be the Directors of the Group. The following table highlights the remuneration which is recorded in the income statement to the Directors:
2015 2014£’000 £’000
Salaries/fees 405 388Bonuses 116 112Pension contributions 77 8Share-based payments 70 14
668 522
25. GuaranteesZytronic plc has given a guarantee to Barclays Bank plc in connection with the overdraft facility detailed in note 13.

Financial statements
Zytronic plc Annual Report and Financial Statements 201550
Five-year summaries
Consolidated income statementFor the five years ended 30 September 2011 to 2015
2015 2014 2013 2012 2011£’000 £’000 £’000 £’000 £’000
Group revenue 21,267 18,886 17,282 20,424 20,488
Cost of sales (12,366) (11,979) (11,961) (13,008) (13,574)
Exceptional costs — — (413) — —
Gross profit 8,901 6,907 4,908 7,416 6,914
Distribution costs (278) (156) (210) (243) (239)
Administration expenses (4,073) (3,488) (2,858) (3,089) (3,194)
Group trading profit 4,550 3,263 1,840 4,084 3,481
Other operating income — — 94 187 187
Group operating profit 4,550 3,263 1,934 4,271 3,668
Finance costs (29) (35) (39) (91) (112)
Finance revenue 23 33 44 15 1
Profit before tax 4,544 3,261 1,939 4,195 3,557
Tax expense (775) (301) (277) (898) (865)
Profit for the period 3,769 2,960 1,662 3,297 2,692
Earnings per share
Basic 24.7p 19.6p 11.1p 22.2p 18.3p
Diluted 24.3p 19.5p 11.0p 21.9p 18.1p
Adjusted basic 24.7p 19.6p 13.9p 22.2p 18.3p
Adjusted diluted 24.3p 19.5p 13.8p 21.9p 18.1p
Dividends per share 10.3p 9.1p 8.7p 8.2p 7.1p
All profits are from continuing operations.
Dividends are shown in the accounts in the year in which they are paid.

Corporate governance Financial statementsStrategic report
Annual Report and Financial Statements 2015 Zytronic plc 51
Consolidated balance sheetAt 30 September 2011 to 2015
2015 2014 2013 2012 2011£’000 £’000 £’000 £’000 £’000
Assets
Non-current assets
Intangible assets 1,427 1,413 1,453 1,613 1,811
Property, plant and equipment 7,807 7,443 7,888 8,231 8,113
Trade and other receivables — — — 413 296
9,234 8,856 9,341 10,257 10,220
Current assets
Inventories 3,214 3,126 3,509 3,441 2,754
Trade and other receivables 3,055 3,068 2,430 3,090 4,021
Other current financial assets — 48 — — —
Cash and short term deposits 9,833 7,806 5,474 4,217 4,513
16,102 14,048 11,413 10,748 11,288
Total assets 25,336 22,904 20,754 21,005 21,508
Equity and liabilities
Current liabilities
Trade and other payables 971 1,057 1,410 1,299 1,778
Financial liabilities 200 200 200 200 2,266
Other current financial liabilities 89 224 — — —
Accruals 1,201 1,264 688 1,016 1,118
Taxation liabilities 255 30 192 476 502
Government grants — — — 97 192
2,716 2,775 2,490 3,088 5,856
Non-current liabilities
Financial liabilities 1,144 1,341 1,538 1,735 1,722
Provisions 136 139 — — —
Government grants 59 — — — 97
Deferred tax liabilities (net) 590 596 625 602 726
1,929 2,076 2,163 2,337 2,545
Total liabilities 4,645 4,851 4,653 5,425 8,401
Net assets 20,691 18,053 16,101 15,580 13,107
Capital and reserves
Equity share capital 153 152 150 149 147
Share premium 7,552 7,290 7,003 6,862 6,588
Revenue reserve 12,986 10,611 8,948 8,569 6,372
Total equity 20,691 18,053 16,101 15,580 13,107

Financial statements
Zytronic plc Annual Report and Financial Statements 201552
Statement of Directors’ responsibilitiesIn relation to the Parent Company financial statements
The Directors are responsible for preparing the annual report and financial statements in accordance with applicable law and regulations.
Company law requires the Directors to prepare financial statements for each financial year. Under that law the Directors have elected to prepare the financial statements in accordance with United Kingdom Generally Accepted Accounting Practice (United Kingdom Accounting Standards and applicable law). Under company law the Directors must not approve the financial statements unless they are satisfied that they give a true and fair view of the state of affairs of the Company and the profit or loss of the Company for that period. In preparing those financial statements, the Directors are required to:
C select suitable accounting policies and then apply them consistently;
C make judgements and accounting estimates that are reasonable and prudent;
C state whether applicable UK Accounting Standards have been followed, subject to any material departures disclosed and explained in the financial statements; and
C prepare the financial statements on the going concern basis unless it is inappropriate to presume that the Company will continue in business.
The Directors are responsible for keeping adequate accounting records that are sufficient to show and explain the Company’s transactions and disclose with reasonable accuracy at any time the financial position of the Company and to enable them to ensure that the financial statements comply with the Companies Act 2006. They are also responsible for safeguarding the assets of the Company and hence for taking reasonable steps for the prevention and detection of fraud and other irregularities.
The Directors are responsible for the maintenance and integrity of the corporate and financial information included on the Company’s website. Legislation in the UK governing the preparation and dissemination of financial statements may differ from legislation in other jurisdictions.
The Directors confirm that the financial statements comply with the above requirements.

Corporate governance Financial statementsStrategic report
Annual Report and Financial Statements 2015 Zytronic plc 53
Parent Company balance sheetAt 30 September 2015
2015 2014Notes £’000 £’000
Fixed assets
Tangible assets 3 4,626 4,739
Investments 4 10,035 9,855
14,661 14,594
Current assets
Debtors:
– amounts falling due within one year 5 8 6
– amounts falling due after one year 5 320 1,178
Cash at bank and in hand 7,570 5,671
7,898 6,855
Creditors: amounts falling due within one year 6 416 438
Net current assets 7,482 6,417
Total assets less current liabilities 22,143 21,011
Creditors: amounts falling due after more than one year 7 1,144 1,341
Provisions for liabilities and charges
Deferred tax 9 96 102
20,903 19,568
Capital and reserves
Called up share capital 10 153 152
Share premium 11 7,552 7,290
Profit and loss account 11 13,198 12,126
Shareholders’ funds 20,903 19,568
These financial statements have been approved by the Board of Directors on 7 December 2015 and signed on its behalf by:
Mark Cambridge BSc (Hons), FIoD Claire Smith BA (Hons), ACMA, CGMA, CertICMChief Executive Group Finance Director7 December 2015

Financial statements
Zytronic plc Annual Report and Financial Statements 201554
Notes to the Parent Company financial statementsFor the year ended 30 September 2015
1. Accounting policies(a) Basis of preparationThe financial statements of Zytronic plc were approved for issue by the Board of Directors on 4 December 2015. The financial statements are prepared under the historical cost convention and in accordance with applicable accounting standards.
A profit and loss account is not presented for the Company as permitted by Section 408 of the Companies Act 2006 and the Company has taken advantage of the exemptions under FRS 1 not to present a cashflow statement.
The Company has taken advantage of the exemption available to parent companies under FRS 29 Financial Instruments: Disclosures so as not to provide the information otherwise required by the standard, as the Group’s consolidated financial statements, in which the Company is included, provide equivalent disclosures under IFRS 7 Financial Instruments and Disclosure.
(b) Share-based paymentsEquity-settled transactionsThe cost of equity-settled transactions with employees is measured by reference to the fair value at the date at which they are granted and is recognised as an expense over the vesting period, which ends on the date on which the relevant employees become fully entitled to the award. Fair value is determined using an appropriate pricing model. In valuing equity-settled transactions, account is not taken of any service performance conditions (vesting conditions), other than performance conditions linked to the price of the shares of the Company (market conditions). Any other conditions which are required to be met in order for an employee to become fully entitled to an award are considered to be non-vesting conditions. Like market performance conditions, non-vesting conditions are taken into account in determining the grant date fair value.
An expense is not recognised for awards that do not ultimately vest, except for awards where vesting is conditional upon a market vesting condition, which are treated as vesting irrespective of whether or not the market vesting condition or non-vesting condition is satisfied, provided that all other non-market vesting conditions are satisfied.
At each balance sheet date before vesting, the cumulative expense is calculated, representing the extent to which the vesting period has expired and management’s best estimate of the achievement or otherwise of non-market vesting conditions and the number of equity instruments that will ultimately vest or, in the case of an instrument subject to a market vesting condition or a non-vesting condition, be treated as vesting as described above. The movement in cumulative expense since the previous balance sheet date is recognised in the income statement, with a corresponding entry in equity.
Where the terms of an equity-settled award are modified or a new award is designated as replacing a cancelled or settled award, the cost based on the original award terms continues to be recognised over the original vesting period. In addition, an expense is recognised over the remainder of the new vesting period for the incremental fair value of any modification, based on the difference between the fair value of the original award and the fair value of the modified award, both as measured on the date of the modification. A reduction is not recognised if this difference is negative.
Where an equity-settled award is cancelled (including when a non-vesting condition within the control of the entity or employee is not met), it is treated as if it had vested on the date of cancellation, and any cost not yet recognised in the profit and loss account for the award is expensed immediately. Any compensation paid up to the fair value of the award at the cancellation or settlement date is deducted from equity, with any excess over fair value being treated as an expense in the profit and loss account.
The Company records an increase in its investment in subsidiaries with a credit to equity equivalent to the FRS 20 costs in the subsidiary undertakings.
(c) Tangible fixed assetsProperty is stated at cost less accumulated depreciation and accumulated impairment losses. Such cost includes costs directly attributable to making the asset capable of operating as intended. Borrowing costs attributable to assets under construction are recognised as an expense when incurred.
Depreciation is provided on all tangible fixed assets, at rates calculated to write off the costs, less the estimated residual value of each asset evenly over its expected useful life, as follows:
Freehold land – NilFreehold property – 50 yearsLong leasehold property – 50 years
The carrying values of tangible fixed assets are reviewed for impairment when events or changes in circumstances indicate the carrying value may not be recoverable. The expected useful lives of assets are reviewed annually.
(d) InvestmentsFixed asset investments in subsidiaries are shown at cost less provision for impairment.
(e) Deferred taxationThe charge for taxation is based on the profit for the year and takes into account taxation deferred because of timing differences between the treatment of certain items for taxation and accounting purposes.
Deferred tax is recognised in respect of all timing differences that have originated but not reversed at the balance sheet date where transactions or events that result in an obligation to pay more, or a right to pay less, tax in the future have occurred at the balance sheet date, with the exception of deferred tax assets which are recognised only to the extent that the Directors consider that it is more likely than not that there will be suitable taxable profits from which the future reversal of the underlying timing differences can be deducted.
Deferred tax is measured on a non-discounted basis at the tax rates that are expected to apply in the periods in which timing differences reverse, based on tax rates and laws enacted or substantively enacted at the balance sheet date.

Corporate governance Financial statementsStrategic report
Annual Report and Financial Statements 2015 Zytronic plc 55
1. Accounting policies continued(f) Interest-bearing loans and borrowingsAll interest-bearing loans and borrowings are initially recognised at net proceeds, being fair value of the consideration received net of issue costs associated with the borrowings. Finance costs (including issue costs) are taken to the profit and loss account over the term of the debt at a constant rate on the balance sheet carrying amount. The carrying amount is increased by the finance charges amortised and reduced by payments made in respect of the accounting period.
2. Auditors’ remunerationAuditors’ remuneration for the year ended 30 September 2015 was £15,000 (2014: £13,500).
3. Tangible fixed assetsLong
Freehold leaseholdLand property property Total
£’000 £’000 £’000 £’000
Cost At 30 September 2014 and 2015 207 3,070 2,097 5,374
DepreciationAt 30 September 2014 — 401 234 635Provided during the year — 61 52 113
At 30 September 2015 — 462 286 748
Net book value at 30 September 2015 207 2,608 1,811 4,626
Net book value at 30 September 2014 207 2,669 1,863 4,739
4. InvestmentsInvestments in subsidiary companies
2015 2014£’000 £’000
Shares in subsidiary companiesAt beginning of year 9,855 9,766Share options granted to subsidiary employees 180 89
At end of year 10,035 9,855
Details of the investments in which the Company holds 20% or more of the nominal value of any class of share capital are as follows:
Proportion ofvoting rights and Nature of
Name of company Holding shares held business
Zytronic Displays Limited Ordinary shares 100% Manufacture of transparent composites, including touch sensors Zytronic Inc. Ordinary shares 100% Technical sales supportIntasolve Limited Ordinary shares 100% DormantZytronic Glass Products Limited Ordinary shares 100% Dormant
The trading subsidiary is incorporated in England.
Zytronic Inc. is a wholly owned subsidiary of Zytronic Displays Limited.

Financial statements
Zytronic plc Annual Report and Financial Statements 201556
Notes to the Parent Company financial statements continuedFor the year ended 30 September 2015
5. Debtors2015 2014
£’000 £’000
Prepayments and accrued income 8 6
Amounts falling due after more than one year are:2015 2014
£’000 £’000
Amounts owed by Group undertakings 320 1,178
6. Creditors: amounts falling due within one year2015 2014
£’000 £’000
Bank loan (note 8) 200 200Trade creditors 2 1Other creditors and accruals 106 126Other amounts owed to subsidiary undertakings 81 81Corporation tax 27 30
416 438
7. Creditors: amounts falling due after more than one year2015 2014
£’000 £’000
Bank loan (note 8) 1,144 1,341
8. Bank loanOn 29 June 2012, Zytronic plc borrowed £2.0m under a ten-year mortgage (to be re-financed after five years) with Barclays Bank plc to re-mortgage the borrowings on its three properties. The funds are repayable in quarterly instalments of £50,000. Interest is payable at 2.35% above three-month LIBOR, offset by a National Loan Guarantee Scheme subsidy. The balance is shown net of issue costs which are being amortised over five years.
9. Deferred taxation liabilityThe deferred tax included in the balance sheet is as follows:
2015 2014£’000 £’000
Accelerated capital allowances 96 102
At 1 October 102 108Credit in the profit and loss account (6) (6)
At 30 September 96 102
10. Share capital and share-based payments(a) Share capital
2015 2014Number Number 2015 2014
Thousands Thousands £’000 £’000
AuthorisedOrdinary shares of 1p each 25,000 25,000 250 250
Allotted, called up and fully paidOrdinary shares of 1p each 15,322 15,193 153 152
Note 21(c) in the Group financial statements sets out the details of the share option schemes of the Group and the numbers of shares in the Parent Company which are contingently exercisable under them.

Corporate governance Financial statementsStrategic report
Annual Report and Financial Statements 2015 Zytronic plc 57
10. Share capital and share-based payments continued(b) Share-based paymentsNote 21(c) in the Group financial statements identifies the basis of the Senior Executive Plans and the EMI Scheme. It also contains a table that illustrates the number and weighted average exercise prices of, and movements in, share options during the year.
(c) Directors’ share incentive schemeNote 21(c) in the Group financial statements sets out the details of the Share Incentive Award Scheme for Mark Cambridge, Chief Executive, and Claire Smith, Group Finance Director, in shares of the Parent Company.
11. Reconciliation of movements in shareholders’ fundsCalled Profit
up share Share and losscapital premium account Total£’000 £’000 £’000 £’000
At 30 September 2013 150 7,003 11,413 18,566Exercise of share options 2 287 — 289Profit on ordinary activities after taxation — — 2,010 2,010Share-based payments — — 93 93Dividends — — (1,390) (1,390)
At 30 September 2014 152 7,290 12,126 19,568Exercise of share options 1 262 — 263Profit on ordinary activities after taxation — — 2,466 2,466Share-based payments — — 180 180Dividends — — (1,574) (1,574)
At 30 September 2015 153 7,552 13,198 20,903
A profit of £2,466,000 (2014: £2,010,000), before payments of dividends of £1,574,000 (2014: £1,390,000), has been dealt with in the financial statements of the Company, which, under the exemption contained in Section 408 of the Companies Act 2006, has not presented its own profit and loss account.
Included in the Company’s opening and closing profit and loss account reserves is an amount of £8,919,000, which was a dividend received from a subsidiary company in a prior year. This is not included in Group reserves and does not form part of the Company’s distributable reserves.
12. GuaranteesZytronic plc has given guarantees regarding funding advanced to Zytronic Displays Limited by Barclays Bank plc in connection with an overdraft facility detailed in note (a) below.
(a) Borrowing facilitiesThe Group has an unsecured overdraft facility of £1.0m arranged with its principal banker, Barclays Bank plc. This facility extends until November 2016. This facility is to provide funding for working capital.

Financial statements
Zytronic plc Annual Report and Financial Statements 201558
Notice of Annual General Meeting
Notice is hereby given that the Annual General Meeting of the Company will be held at Whiteley Road, Blaydon-on-Tyne, Tyne and Wear NE21 5NJ on Thursday 25 February 2016 at 2.00pm for the following purposes:
Ordinary businessTo consider and, if thought fit, to pass the following resolutions as ordinary resolutions of the Company:
1. To receive the financial statements for the year ended 30 September 2015 and the reports of the Directors and auditors thereon.
2. To pay a final dividend of 8.87p per ordinary share of 1.0p for the year ended 30 September 2015 on Friday 11 March 2016 to members on the Register at the close of business on Friday 26 February 2016.
3. To re-elect Mark Cambridge as a Director.
4. To re-elect Sir David Chapman Bt. as a Director.
5. To re-appoint Ernst & Young LLP as auditors and to authorise the Directors to fix their remuneration.
Special businessTo consider and, if thought fit, to pass the following resolutions as special resolutions of the Company:
1. The Directors of the Company be and are hereby generally and unconditionally authorised (in substitution for any previous authority) for the purposes of Section 551 of the Companies Act 2006 (as amended) (the “Act”) to exercise all the powers of the Company to allot shares in the Company, or to grant rights to subscribe for or to convert any security into shares in the Company (such shares and such rights to subscribe for or to convert any security into shares in the Company being “relevant securities”) on such terms and in such manner as they shall think fit, up to a maximum aggregate nominal amount of £50,530.76 at any time (unless and to the extent previously revoked, varied or renewed by the Company in general meeting) during the period from the date hereof until the conclusion of the Company’s Annual General Meeting held in 2017 provided that the Directors of the Company may make an offer or enter into an agreement which would or might require relevant securities to be allotted, offered or otherwise dealt with or disposed of after the expiry of such authority and the Directors may allot any relevant securities after the expiry of such authority in pursuance of any such offer or agreement as if this authority had not expired.
2. Subject to and conditional upon the passing of special resolution 1 above, the Directors of the Company be given power pursuant to Sections 570 and 573 of the Act to allot equity securities (as defined in Section 560 of the Act) of the Company for cash pursuant to the authority conferred by special resolution 1 above, as if Section 561 of the Act did not apply to any such allotment, such power to expire at the conclusion of the Company’s Annual General Meeting held in 2017 provided that before such expiry the Directors of the Company may make an offer or enter into an agreement which would or might require equity securities to be allotted after the expiry of such power and the Directors may allot equity securities after such expiry under this power in pursuance of any such offer or agreement as if this power had not expired. This power is limited to:
2.1. the allotment of equity securities for cash in connection with a rights issue or other pre-emptive offer to holders of ordinary shares of 1.0p each in the capital of the Company where the equity securities respectively attributable to the interests of such holders are proportionate (as nearly as may be practicable) to the respective numbers of ordinary shares of 1.0p each in the capital of the Company held by them but subject to such exclusions or other arrangements as the Directors may deem necessary or expedient to deal with any fractional entitlements or any legal or practical problems under the laws of, or the requirements of any regulatory body or any recognised stock exchange in, any territory; and
2.2. the allotment (other than pursuant to 2.1 of this special resolution) of equity securities up to a maximum aggregate nominal amount of £7,661.12.
This power applies in relation to any sale of shares which is an allotment of equity securities by virtue of Section 560(3) of the Act as if in the first paragraph of this resolution the words “pursuant to the authority conferred by special resolution 1 above,” were omitted.

Corporate governance Financial statementsStrategic report
Annual Report and Financial Statements 2015 Zytronic plc 59
Special business continued3. That the Company be and is hereby generally and unconditionally authorised pursuant to Section 701 of the Act to make market purchases (within
the meaning of Section 693(4) of the Act) of ordinary shares of 1.0p each in the capital of the Company (for the purposes of this special resolution 3, “Shares”) provided that:
3.1. the maximum number of Shares hereby authorised to be purchased shall be 1,531,235;
3.2. the minimum price which may be paid for a Share shall be 1.0p;
3.3. the maximum price which may be paid for a Share shall be not more than 5% above the average of the middle market quotations for Shares as derived from the London Stock Exchange daily list for securities admitted to the AIM market of the London Stock Exchange for the five business days immediately preceding the date of the purchase of the Share; and
3.4. unless previously renewed, revoked or varied, the authority hereby conferred shall expire at the conclusion of the Company’s Annual General Meeting held in 2017 save that the Company may, prior to such expiry, enter into a contract to purchase Shares which will or may be executed wholly or partly after the expiry of such authority and may purchase Shares pursuant to such contract as if such authority has not expired,
and that all Shares so purchased in pursuance of this authority shall be held as Treasury Shares (as defined by Section 724 of the Act) for future resale for cash, transfer for the purposes of an employees’ share scheme or for cancellation.
By order of the Board
Claire Smith BA (Hons), ACMA, CGMA, CertICMCompany SecretaryZytronic plcWhiteley RoadBlaydon-on-TyneTyne and WearNE21 5NJ7 December 2015
Notes1. Every member entitled to attend and vote at the meeting may appoint a proxy or proxies to attend, speak and vote (whether on a show of hands or on a poll)
at the meeting on their behalf. A proxy need not be a member of the Company. A prepaid form of proxy is enclosed.2. Completed forms of proxy must be returned to the Company’s registrars at the address shown on the form of proxy not later than 2.00pm on Tuesday 23 February 2016
or two working days prior to any adjourned meeting or, in the case of a poll taken more than 48 hours after it is demanded, one working day before the time appointed for the taking of the poll. The sending of a completed form of proxy to the Company’s registrars will not preclude members from attending and voting at the meeting, or any adjournment thereof, in person, should they so wish.
3. The Company, pursuant to Regulation 41 of the Uncertificated Securities Regulations 2001 (as amended), specifies that only those holders of ordinary shares of 1.0p each of the Company registered in the Register of Members of the Company as at:
3.1. as at close of business or 6.00pm on 23 February 2016; or 3.2. if this meeting is adjourned, at close of business two working days prior to the adjourned meeting, shall be entitled to attend and vote at the meeting in respect of the number of ordinary shares of 1.0p each in the capital of the Company registered in their name at that
time. Changes to entries on the Register of Members after 4.00pm on Tuesday 23 February 2016 shall be disregarded in determining the rights of any person to attend or vote at the meeting.
4. Copies of contracts of service between Directors and the Company or any of its subsidiary undertakings will be available for inspection during normal business hours by members at the registered office of the Company on each business day from the date of this notice until the date of the Annual General Meeting, and at the place of the Annual General Meeting for at least 15 minutes prior to, and during, that meeting.

Financial statements
Zytronic plc Annual Report and Financial Statements 201560
Corporate information
Websiteswww.zytronicplc.com
www.zytronic.co.uk
www.zytronic-inc.com
www.zytronic.cn
www.zytronic.jp
SecretaryClaire Smith BA (Hons), ACMA, CGMA, CertICM
E-mail: [email protected]
Registered officeWhiteley RoadBlaydon-on-TyneTyne and WearNE21 5NJ
Tel: 0191 414 5511Fax: 0191 414 0545
Registration number3881244
Stockbrokers and nominated adviserN+1 SingerOne Bartholomew LaneLondonEC2N 2AX
RegistrarsComputershare Investor Services PLCThe Pavilions Bridgwater Road Bristol BS13 8AE
AuditorsErnst & Young LLPCitygate St James’ Boulevard Newcastle-upon-Tyne NE1 4JD
BankersBarclays Bank plc71 Grey Street Newcastle-upon-Tyne NE99 1JP
Santander Corporate BankingBaltic Place South Shore Road Gateshead NE8 3AE
Yorkshire Bank131–135 Northumberland StreetNewcastle-upon-TyneNE1 7AG
Regions Bank2653 Marietta Hwy Canton, GA 30114 USA
SolicitorsWard HadawaySandgate House 102 Quayside Newcastle-upon-Tyne NE1 3DX
Muckle LLPTime Central 32 Gallowgate Newcastle-upon-Tyne NE1 4BF

Design Portfolio is committed to planting trees for every corporate communications project, in association with Trees for Cities.
Keep in touchFind out more about our latest products, business news and touchscreen developments online.
Find us on Facebook/ZytronicDisplaysLtd
Follow us on Twitter@Zytronic
Join us onGoogle+
Visit our investor site atwww.zytronicplc.com
View a range of corporate and product videos on our YouTube channelyoutube.com/ZytronicTouchSensor
Follow us onPinterest/Zytronic
Connect with us onLinkedIn

Zytronic plc Annual R
eport and Financial Statements 2015
Zytronic plcWhiteley Road Blaydon-on-Tyne Tyne and Wear NE21 5NJTel: 0191 414 5511Fax: 0191 414 0545Web: www.zytronicplc.com