1 evacuation planning algorithms professor shashi shekhar dept. of computer science, university of...
Post on 21-Dec-2015
215 views
TRANSCRIPT

1
Evacuation Planning Algorithms
Professor Shashi ShekharDept. of Computer Science, University of Minnesota
Participants: Q. Lu, S. Kim
February 2004
Sponsors: AHPCRC, Army Research Lab.
CTS, MnDOT, Federal Highway Authority
2
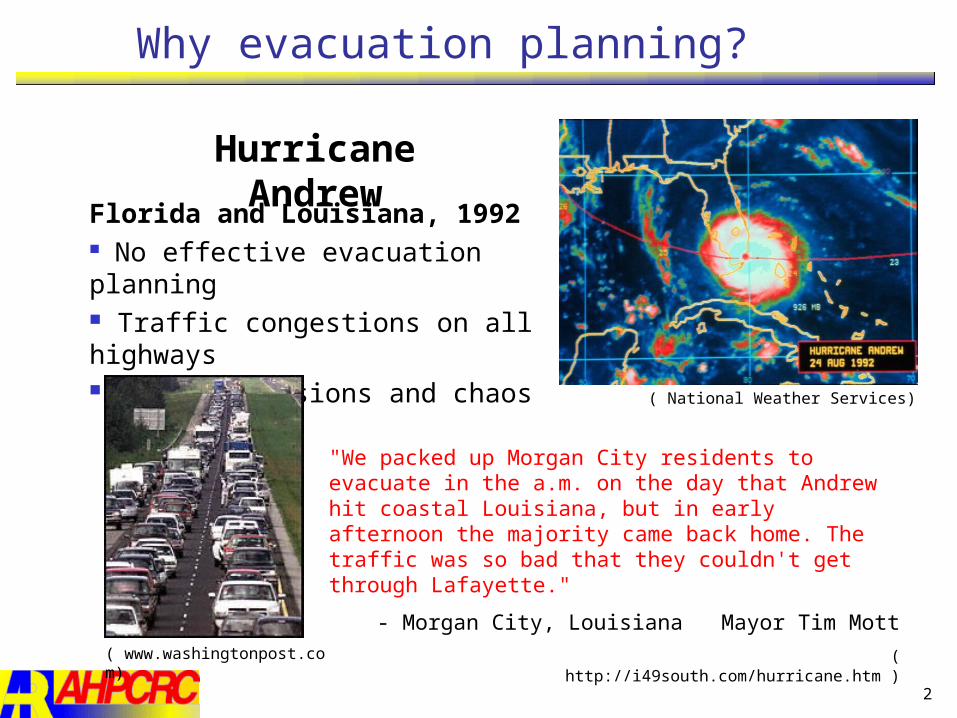
Why evacuation planning?
Florida and Louisiana, 1992 No effective evacuation planning Traffic congestions on all highways Great confusions and chaos
"We packed up Morgan City residents to evacuate in the a.m. on the day that Andrew hit coastal Louisiana, but in early afternoon the majority came back home. The traffic was so bad that they couldn't get through Lafayette."
- Morgan City, Louisiana Mayor Tim Mott
( http://i49south.com/hurricane.htm )
( National Weather Services)
( www.washingtonpost.com)
Hurricane Andrew
3
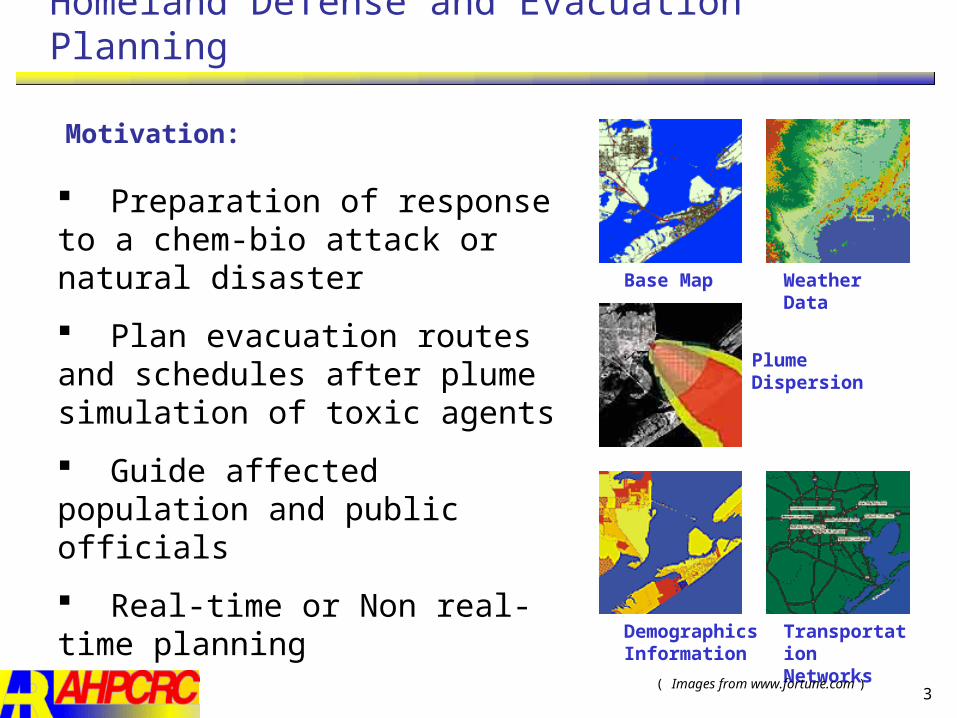
Preparation of response to a chem-bio attack or natural disaster
Plan evacuation routes and schedules after plume simulation of toxic agents
Guide affected population and public officials
Real-time or Non real-time planning
Base Map Weather Data
Plume Dispersion
Demographics Information
Transportation Networks
( Images from www.fortune.com )
Homeland Defense and Evacuation Planning
Motivation:
4
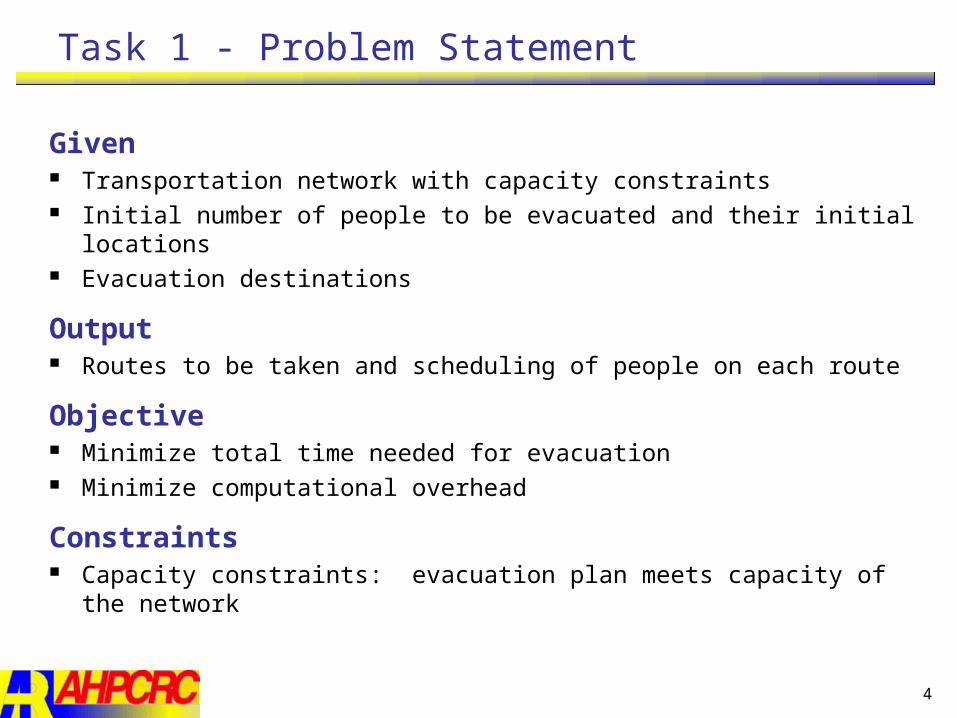
Task 1 - Problem Statement
Given Transportation network with capacity constraints Initial number of people to be evacuated and their initial locations Evacuation destinations
Output Routes to be taken and scheduling of people on each route
Objective Minimize total time needed for evacuation Minimize computational overhead
Constraints Capacity constraints: evacuation plan meets capacity of the network
5
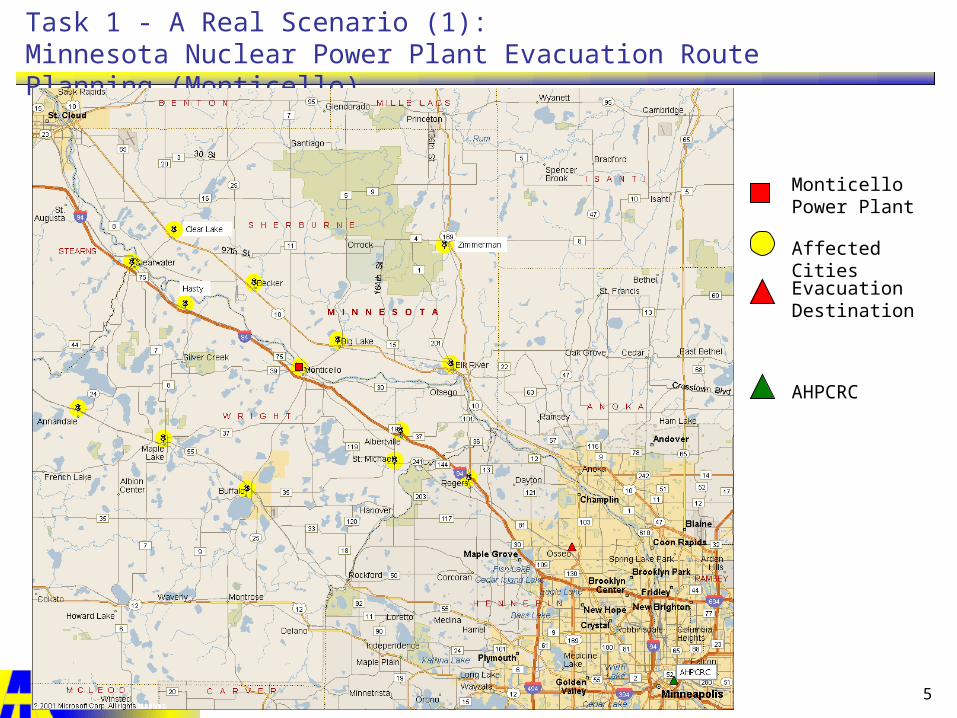
Task 1 - A Real Scenario (1): Minnesota Nuclear Power Plant Evacuation Route Planning (Monticello)
Affected Cities
Monticello Power Plant
Evacuation Destination
AHPCRC

6
Task 1 - A Real Scenario (1): Handcrafted Existing Evacuation Routes
Destination
Monticello Power Plant
7
Task 2 - Related Works
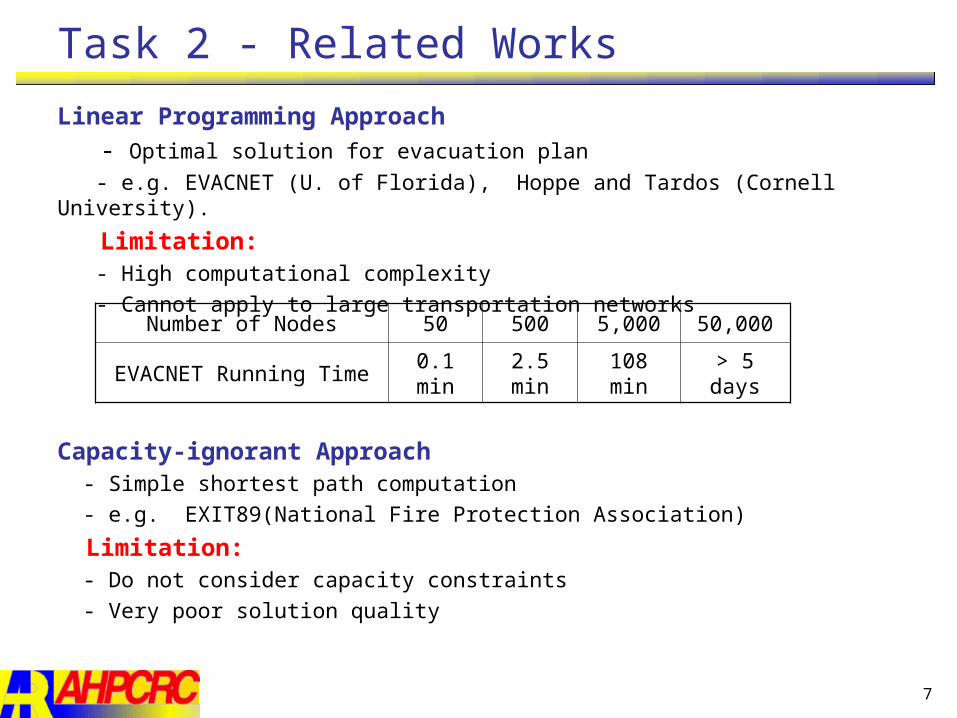
Linear Programming Approach
- Optimal solution for evacuation plan
- e.g. EVACNET (U. of Florida), Hoppe and Tardos (Cornell University).
Limitation: - High computational complexity
- Cannot apply to large transportation networks
Capacity-ignorant Approach - Simple shortest path computation
- e.g. EXIT89(National Fire Protection Association)
Limitation: - Do not consider capacity constraints
- Very poor solution quality
Number of Nodes 50 500 5,000 50,000
EVACNET Running Time 0.1 min 2.5 min 108 min > 5 days
8
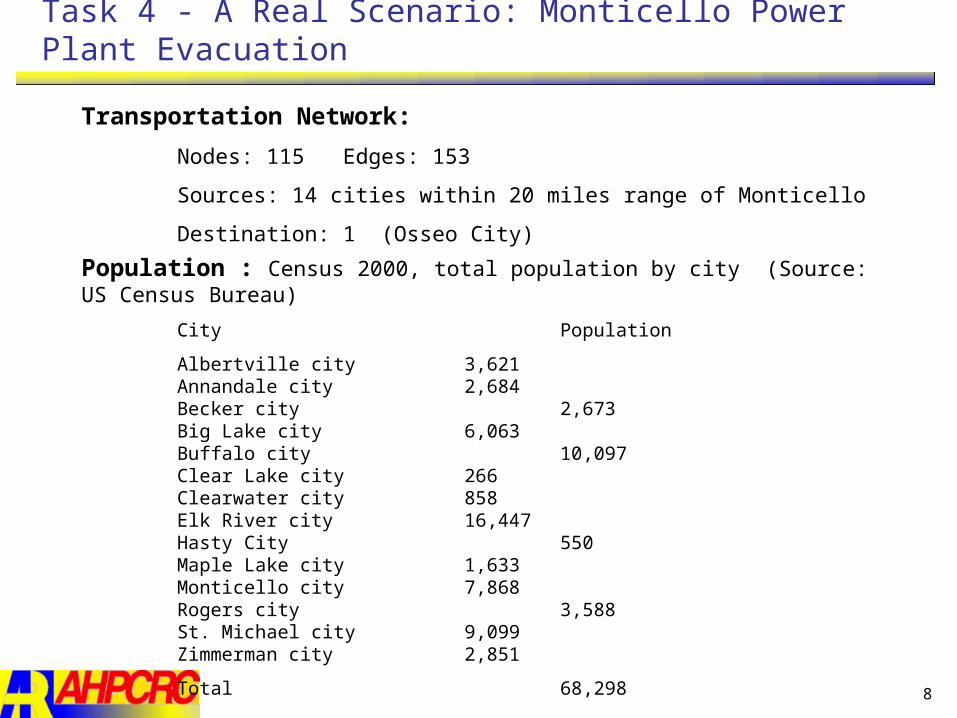
Task 4 - A Real Scenario: Monticello Power Plant Evacuation
Transportation Network:
Nodes: 115 Edges: 153
Sources: 14 cities within 20 miles range of Monticello
Destination: 1 (Osseo City)
Population : Census 2000, total population by city (Source: US Census Bureau)
City Population
Albertville city 3,621Annandale city 2,684Becker city 2,673Big Lake city 6,063Buffalo city 10,097Clear Lake city 266Clearwater city 858Elk River city 16,447Hasty City 550Maple Lake city 1,633Monticello city 7,868Rogers city 3,588St. Michael city 9,099Zimmerman city 2,851
Total 68,298
9
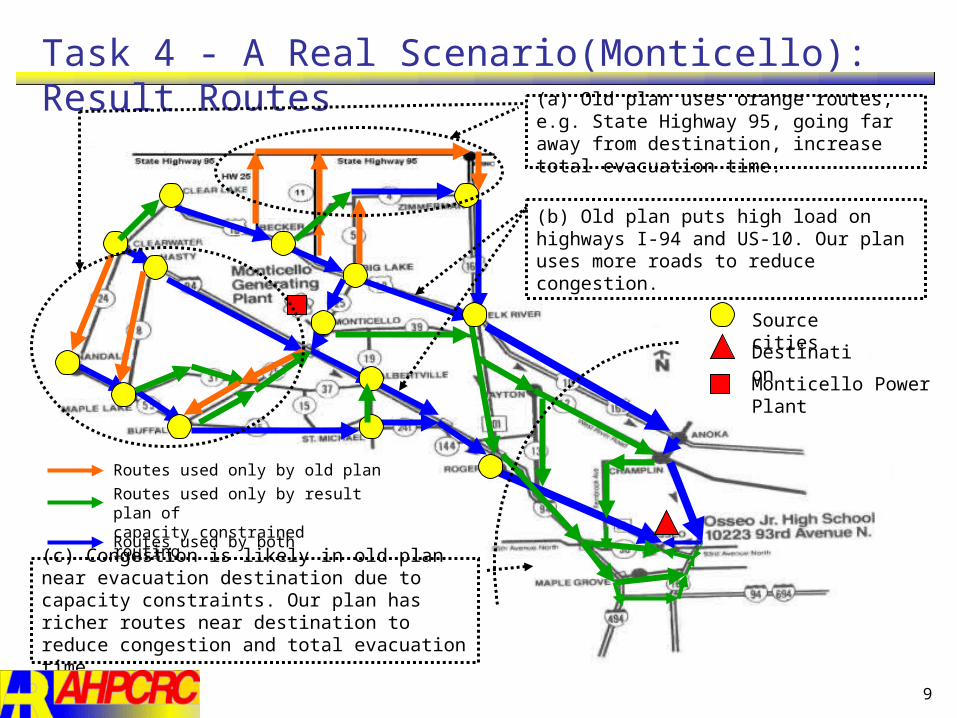
Task 4 - A Real Scenario(Monticello): Result Routes
Source cities
Destination
Monticello Power Plant
Routes used only by old plan
Routes used only by result plan of capacity constrained routing
Routes used by both plans
(c) Congestion is likely in old plan near evacuation destination due to capacity constraints. Our plan has richer routes near destination to reduce congestion and total evacuation time.
(a) Old plan uses orange routes, e.g. State Highway 95, going far away from destination, increase total evacuation time.
(b) Old plan puts high load on highways I-94 and US-10. Our plan uses more roads to reduce congestion.
10
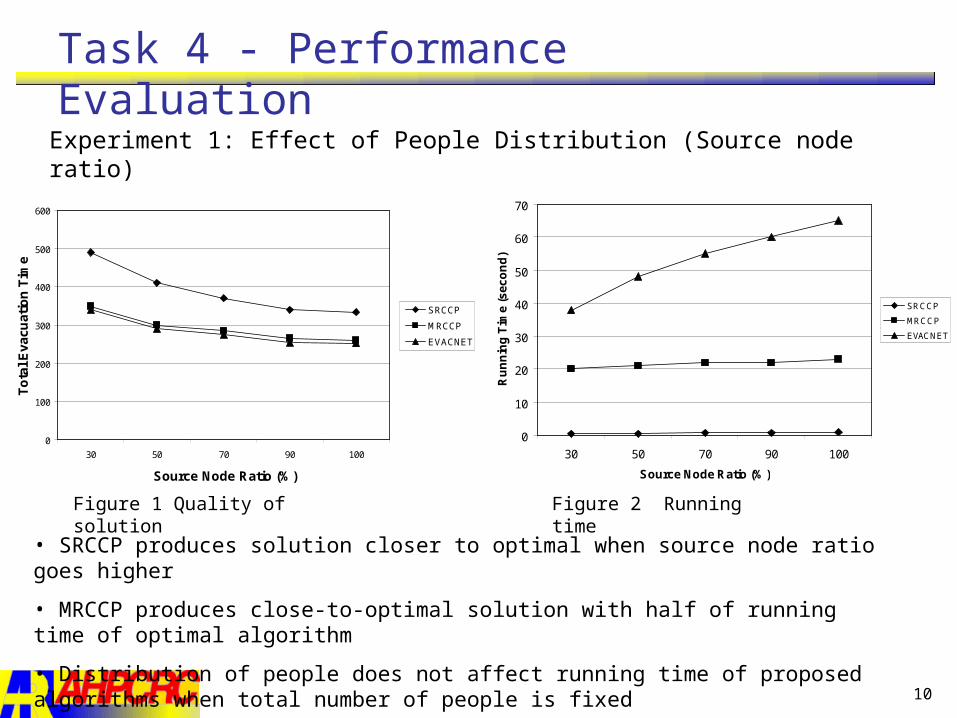
Task 4 - Performance Evaluation
Experiment 1: Effect of People Distribution (Source node ratio)
Results: Source node ratio ranges from 30% to 100% with fixed occupancy ratio at 30%
Figure 1 Quality of solution Figure 2 Running time
• SRCCP produces solution closer to optimal when source node ratio goes higher
• MRCCP produces close-to-optimal solution with half of running time of optimal algorithm
• Distribution of people does not affect running time of proposed algorithms when total number of people is fixed
0
100
200
300
400
500
600
30 50 70 90 100
Source Node Ratio (%)
To
tal E
va
cuat
ion
Tim
e
SRCCP
MRCCP
EVACNET
0
10
20
30
40
50
60
70
30 50 70 90 100
Source Node Ratio (%)
Ru
nn
ing
Tim
e (
se
co
nd
)
SRCCP
MRCCP
EVACNET
11
Conclusions
• Evacuation Planning is critical for homeland defense
• Existing methods can not handle large urban scenarios
• Communities use manually produced evacuation plans
• Our new GIS algorithms
• Can produce evacuation plans for large urban area
• Reduce total time to evacuate!
• Improves current evacuation plans
• Next Steps:
• More scenarios: contra-flow, downtowns e.g. Washington DC
• Dual use – improve traffic flow, e.g. July 4th weekend
• Fault tolerant evacuation plans, e.g. electric power failure
12
Acknowledgements
• Federal Agencies• AHPCRC, Army Research Lab.
• Dr. Raju Namburu• CTS, MnDOT, Federal Highway Authority• National Science Foundation
• Congresspersons and Staff • Rep. Martin Olav Sabo
• Staff persons Marjorie Duske• Rep. James L. Oberstar• Senator Mark Dayton