1. icv kongres controllera srbije 2013, dragan vještica, head of controlling, metro
TRANSCRIPT
METRO Cash & Carry Serbia Member of
ICV Serbia
KPI’s in Retail Industries
Belgrade
May 17th , 2013
METRO Cash & Carry Serbia Member of Page 2
METRO GROUP
Retail vs. Manufacturing
Classification of KPI
Summary
CCC
Monitoring P&L KPI’s
METRO Cash & Carry Serbia Member of Page 3
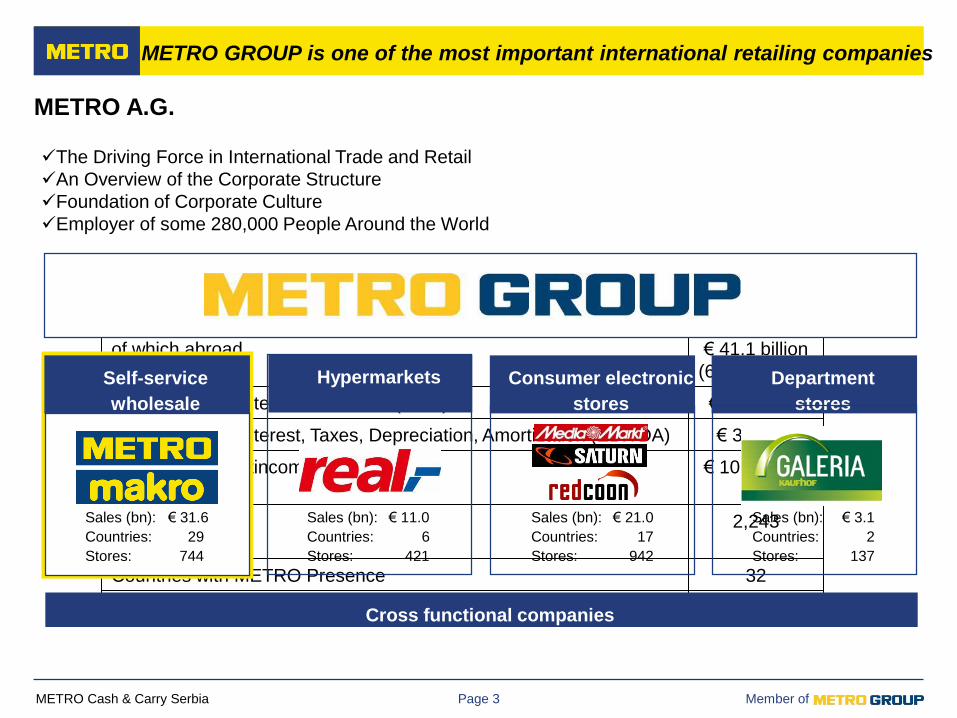
The Driving Force in International Trade and Retail
An Overview of the Corporate Structure
Foundation of Corporate Culture
Employer of some 280,000 People Around the World
METRO A.G.
METRO GROUP is one of the most important international retailing companies
Fiscal Year 2012
Sales € 66.7 billion
of which abroad € 41.1 billion
(61.6 percent)
Earning before Interest and Taxes (EBIT) € 1.4 billion
Earning before Interest, Taxes, Depreciation, Amortization (EBITDA) € 3 billion
Consolidated Netincome € 101 million
Locations 2,243
Countries with METRO Presence 32
Number of Staff on Annual Average Total 282,989
Sales (bn): € 21.0
Countries: 17
Stores: 942
Cross functional companies
Hypermarkets
Sales (bn): € 11.0
Countries: 6
Stores: 421
Self-service
wholesale
Sales (bn): € 31.6
Countries: 29….
Stores: 744
Sales (bn): € 3.1
Countries: 2
Stores: 137
Consumer electronic
stores
Department
stores

METRO Cash & Carry Serbia Member of Page 4
Retail vs. Manufacturing
METRO GROUP
Classification of KPI
Summary
CCC
Monitoring P&L KPI’s
METRO Cash & Carry Serbia Member of
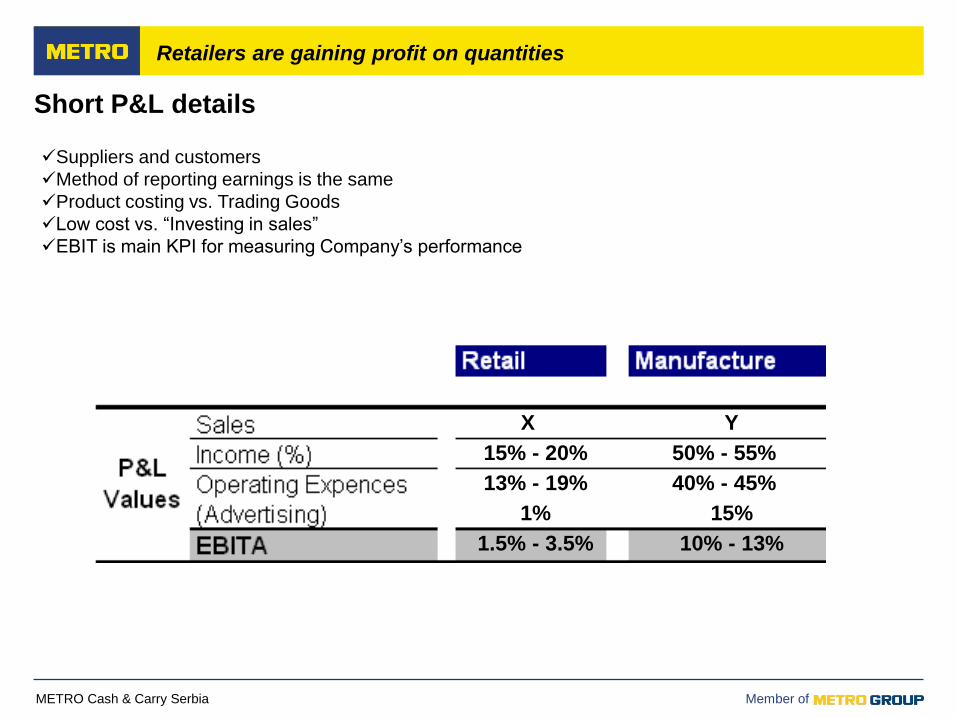
Short P&L details
Retailers are gaining profit on quantities
X Y
15% - 20% 50% - 55%
13% - 19% 40% - 45%
1% 15%
1.5% - 3.5% 10% - 13%
Suppliers and customers
Method of reporting earnings is the same
Product costing vs. Trading Goods
Low cost vs. “Investing in sales”
EBIT is main KPI for measuring Company’s performance
METRO Cash & Carry Serbia Member of Page 6
Classification of KPI
METRO GROUP
Retail vs. Manufacturing
Summary
CCC
Monitoring P&L KPI’s
METRO Cash & Carry Serbia Member of
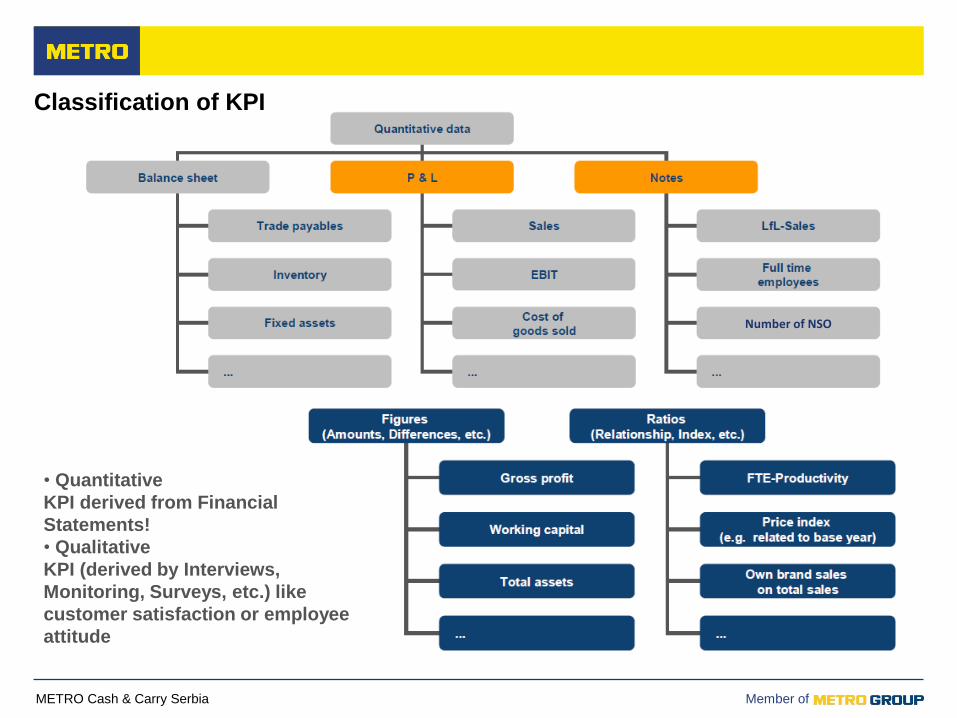
• Quantitative
KPI derived from Financial
Statements!
• Qualitative
KPI (derived by Interviews,
Monitoring, Surveys, etc.) like
customer satisfaction or employee
attitude
Classification of KPI
Number of NSO
METRO Cash & Carry Serbia Member of Page 8
Monitoring P&L KPI’s
METRO GROUP
Retail vs. Manufacturing
Summary
CCC
Classification of KPI
METRO Cash & Carry Serbia Member of
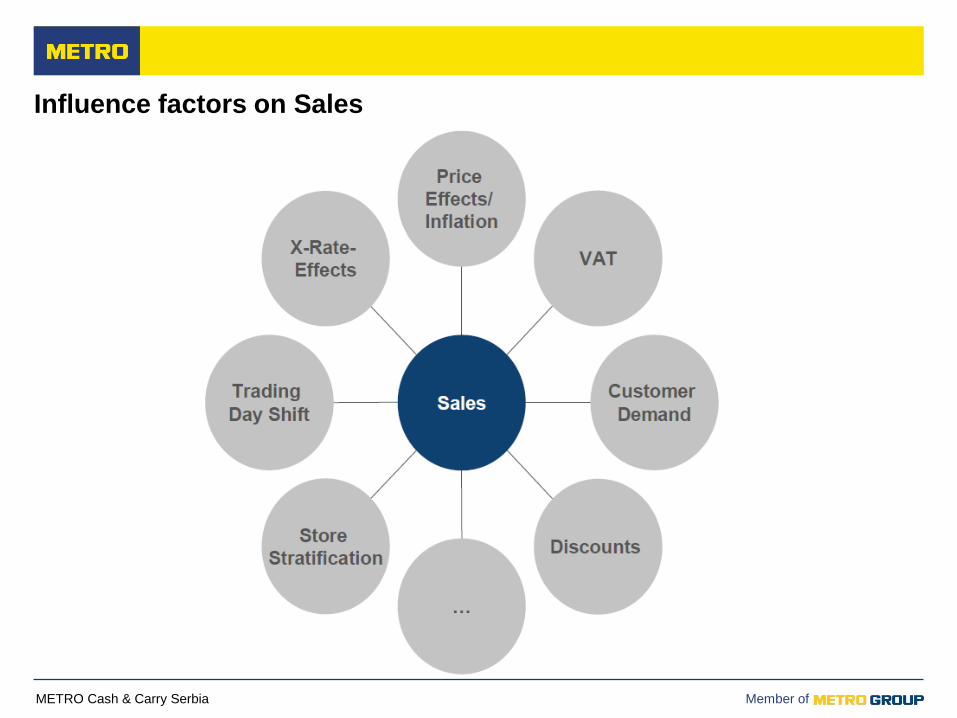
Influence factors on Sales
METRO Cash & Carry Serbia Member of
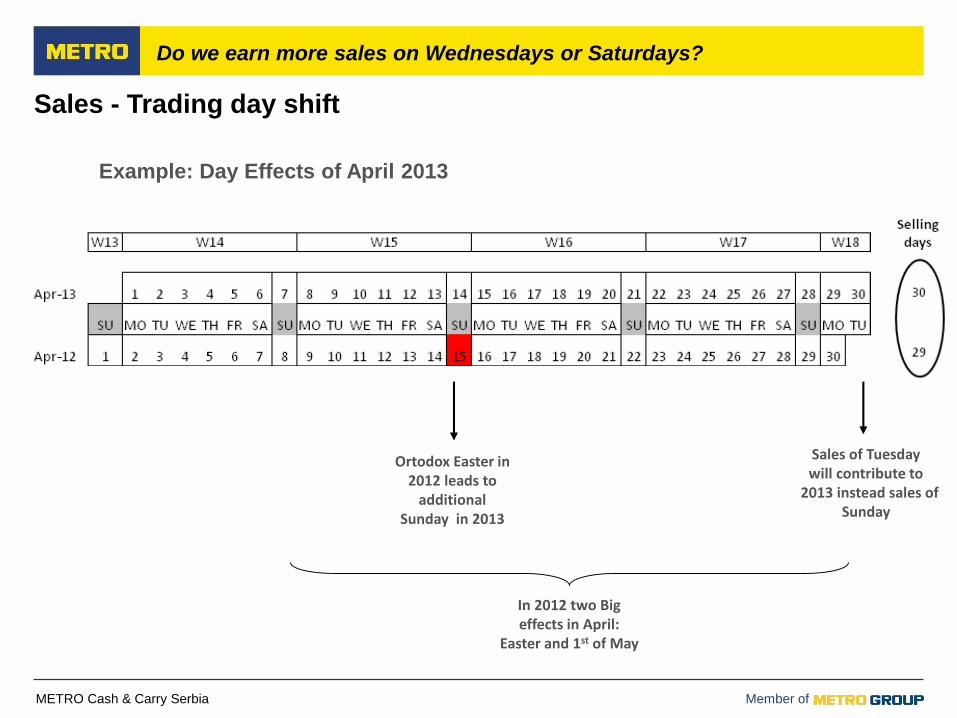
Sales - Trading day shift (I)
Example: Day Effects of April 2013
Sales - Trading day shift
Do we earn more sales on Wednesdays or Saturdays?
Sales of Tuesdaywill contribute to
2013 instead sales of Sunday
Ortodox Easter in 2012 leads to
additional Sunday in 2013
In 2012 two Big effects in April:
Easter and 1st of May
METRO Cash & Carry Serbia Member of
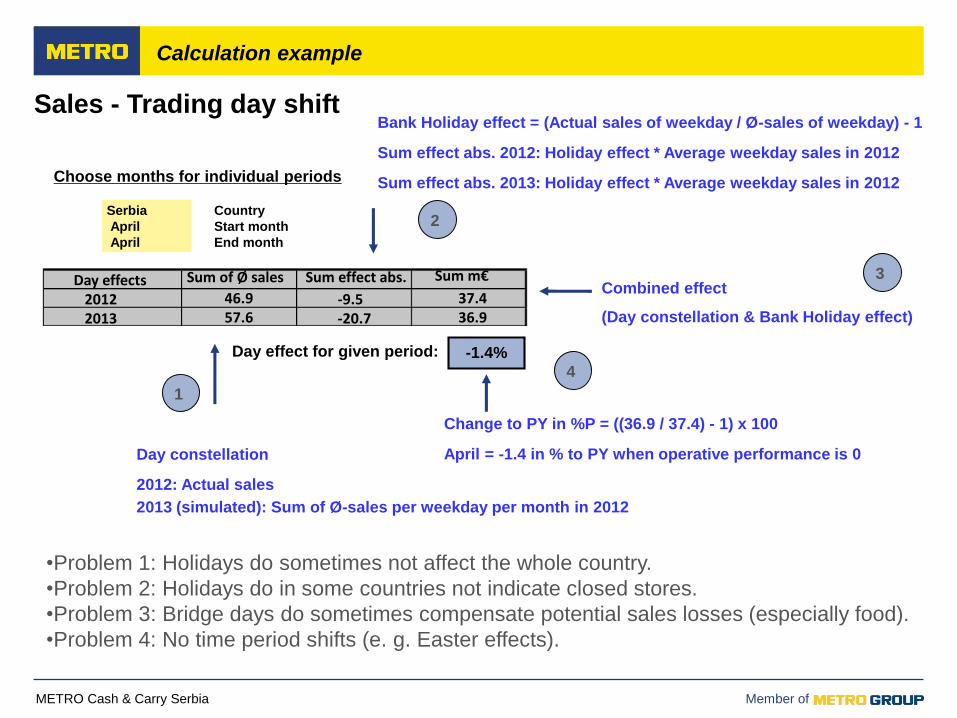
Bank Holiday effect = (Actual sales of weekday / Ø-sales of weekday) - 1
Choose months for individual periods
Serbia
April
April
Country
Start month
End month
Sum effect abs. 2012: Holiday effect * Average weekday sales in 2012
Sum effect abs. 2013: Holiday effect * Average weekday sales in 2012
Combined effect
(Day constellation & Bank Holiday effect)
Day constellation
Change to PY in %P = ((36.9 / 37.4) - 1) x 100
April = -1.4 in % to PY when operative performance is 0
2012: Actual sales
2013 (simulated): Sum of Ø-sales per weekday per month in 2012
•Problem 1: Holidays do sometimes not affect the whole country.
•Problem 2: Holidays do in some countries not indicate closed stores.
•Problem 3: Bridge days do sometimes compensate potential sales losses (especially food).
•Problem 4: No time period shifts (e. g. Easter effects).
Sales - Trading day shift
Calculation example
2
1
3
4
Day effect for given period:
Day effects20122013
Sum of Ø sales Sum effect abs. Sum m€
46.957.6
-9.5-20.7
37.436.9
-1.4%
METRO Cash & Carry Serbia Member of
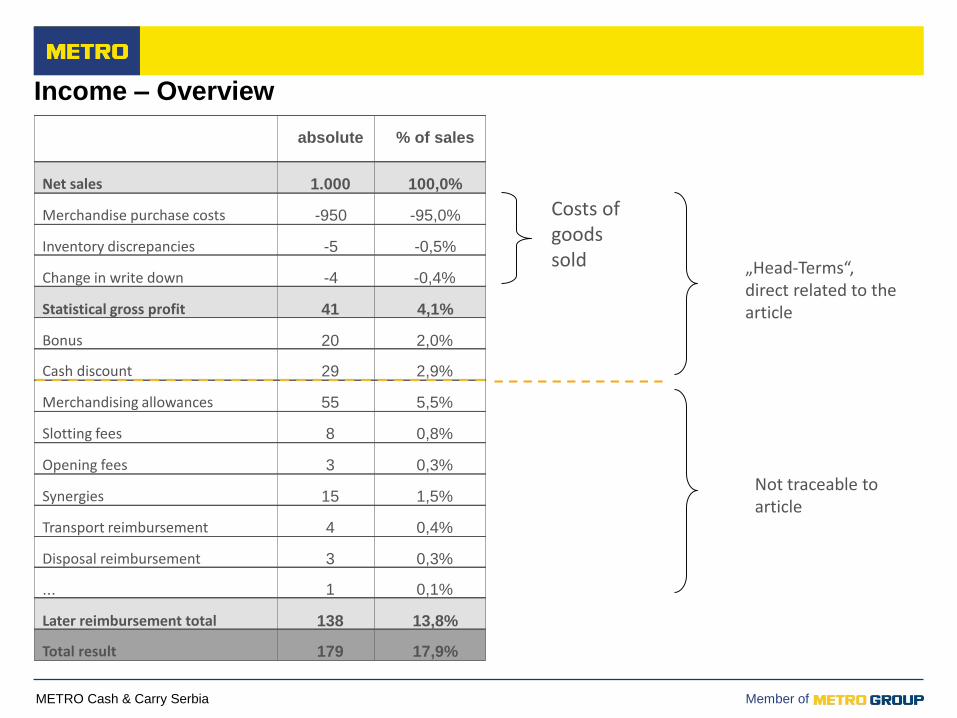
absolute
Net sales
% of sales
100,0%1.000
Merchandise purchase costs -95,0%-950
Inventory discrepancies -0,5%-5
Change in write down -0,4%-4
Statistical gross profit 4,1%41
Bonus
Cash discount
Merchandising allowances
Slotting fees
Opening fees
Synergies
Transport reimbursement
Disposal reimbursement
...
2,0%
2,9%
5,5%
0,8%
0,3%
1,5%
0,4%
0,3%
0,1%
20
29
55
8
3
15
4
3
1
Later reimbursement total 13,8%138
Total result 17,9%179
„Head-Terms“,direct related to thearticle
Not traceable toarticle
Income – Overview
Costs ofgoodssold

METRO Cash & Carry Serbia Member of
Income: t0: 8,8% x 1.000 = 88 €
Marginin % o.s.
t1: 10,2% x 1.300 = 132,6 € : 44,6 €
10,2%
Margin-related variance:Sales-related and margin-
related variance:
(10,2% - 8,8%) x 1.000 = €14
8,8%
t0Sales-related
variance:
t1(10,2% - 8,8%) x
(1.300 -1.000) = 4,2
(1.300 – 1.000)
x 8,8% = €26,4
1.000Sales
1.300
Calculation of income variances
Income Variance
METRO Cash & Carry Serbia Member of
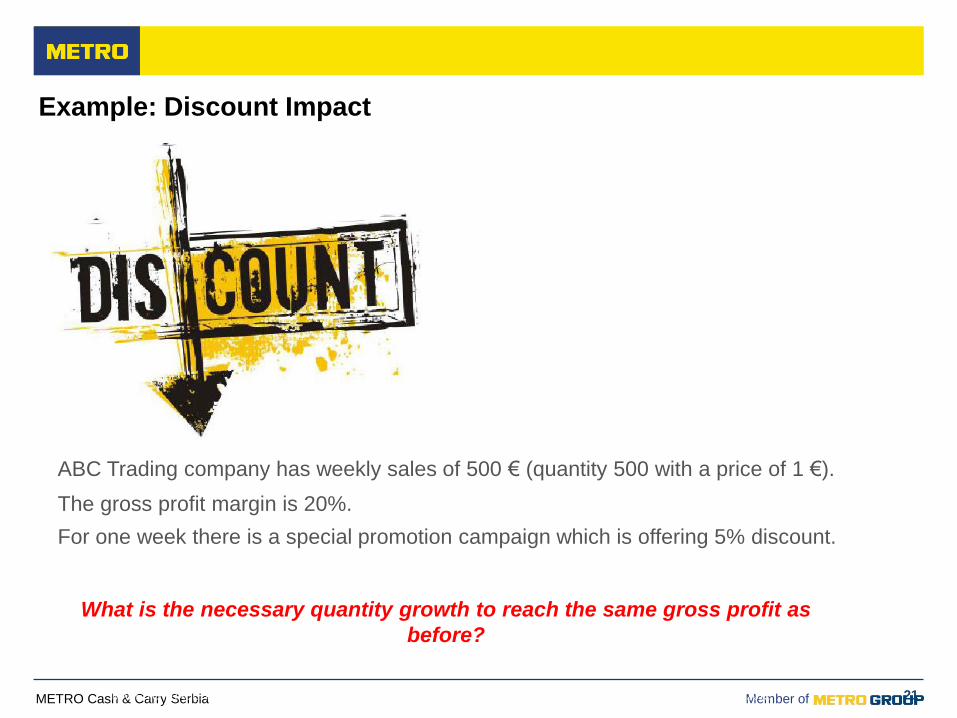
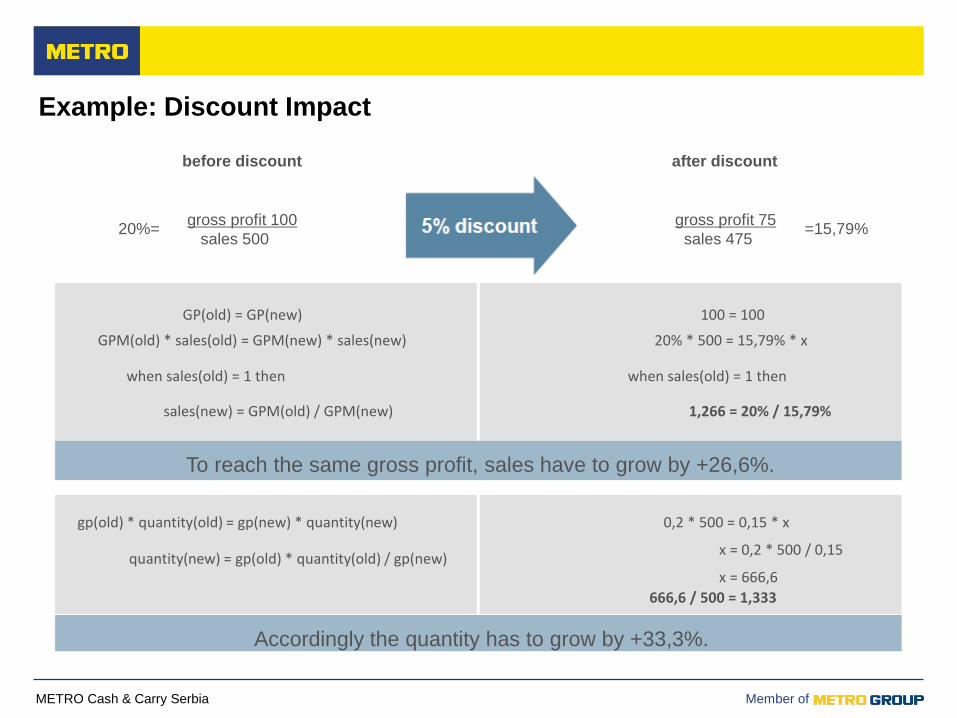
Example: Discount Impact
ABC Trading company has weekly sales of 500 € (quantity 500 with a price of 1 €).
The gross profit margin is 20%.
For one week there is a special promotion campaign which is offering 5% discount.
What is the necessary quantity growth to reach the same gross profit as
before?
MADE TO TRADE. Retail Key Figures. Financial Management Training June 2012 | © METRO AG 2012 21
METRO Cash & Carry Serbia Member of
before discount after discount
20%=gross profit 100
sales 500
gross profit 75
sales 475=15,79%
GP(old) = GP(new) 100 = 100
GPM(old) * sales(old) = GPM(new) * sales(new) 20% * 500 = 15,79% * x
when sales(old) = 1 then when sales(old) = 1 then
sales(new) = GPM(old) / GPM(new) 1,266 = 20% / 15,79%
To reach the same gross profit, sales have to grow by +26,6%.
gp(old) * quantity(old) = gp(new) * quantity(new) 0,2 * 500 = 0,15 * x
quantity(new) = gp(old) * quantity(old) / gp(new)x = 0,2 * 500 / 0,15
x = 666,6
666,6 / 500 = 1,333
Accordingly the quantity has to grow by +33,3%.
Example: Discount Impact
METRO Cash & Carry Serbia Member of
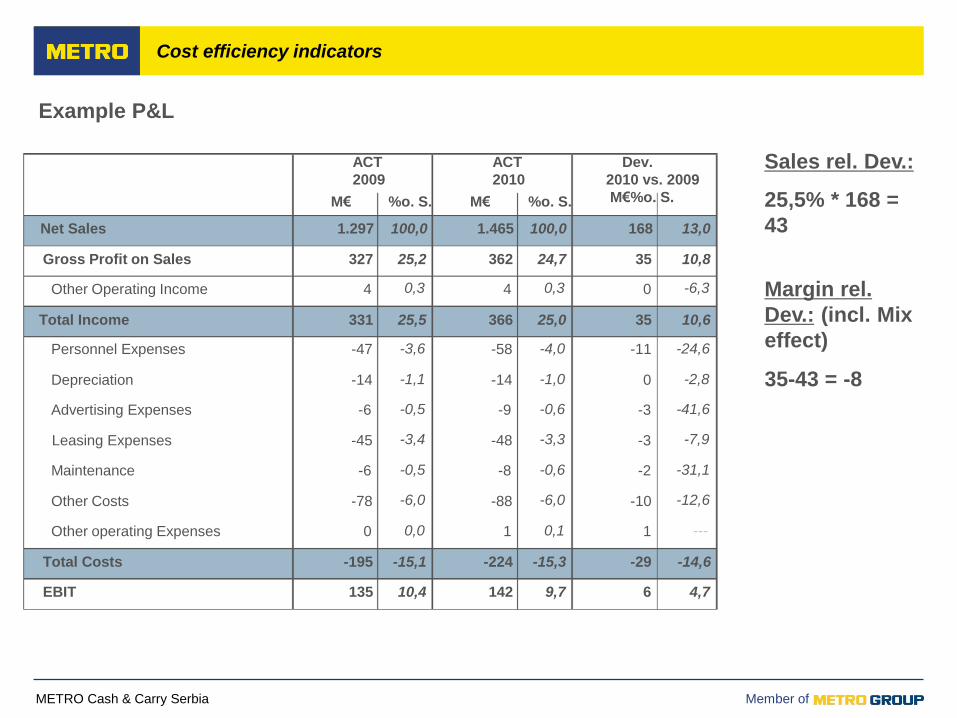
Example P&L
ACT
2009
M€
Net Sales
Gross Profit on Sales
Other Operating Income
Total Income
Personnel Expenses
Depreciation
Advertising Expenses
Leasing Expenses
Maintenance
Other Costs
Other operating Expenses
Total Costs
EBIT
1.297
327
4
331
-47
-14
-6
-45
-6
-78
0
-195
135
%o. S.
100,0
25,2
0,3
25,5
-3,6
-1,1
-0,5
-3,4
-0,5
-6,0
0,0
-15,1
10,4
M€
1.465
362
4
366
-58
-14
-9
-48
-8
-88
1
-224
142
ACT
2010
%o. S.
100,0
24,7
0,3
25,0
-4,0
-1,0
-0,6
-3,3
-0,6
-6,0
0,1
-15,3
9,7
Dev.
2010 vs. 2009
M€%o. S.
168
35
0
35
-11
0
-3
-3
-2
-10
1
-29
6
13,0
10,8
-6,3
10,6
-24,6
-2,8
-41,6
-7,9
-31,1
-12,6
---
-14,6
4,7
Sales rel. Dev.:
25,5% * 168 =
43
Margin rel.
Dev.: (incl. Mix
effect)
35-43 = -8
Cost efficiency indicators
METRO Cash & Carry Serbia Member of
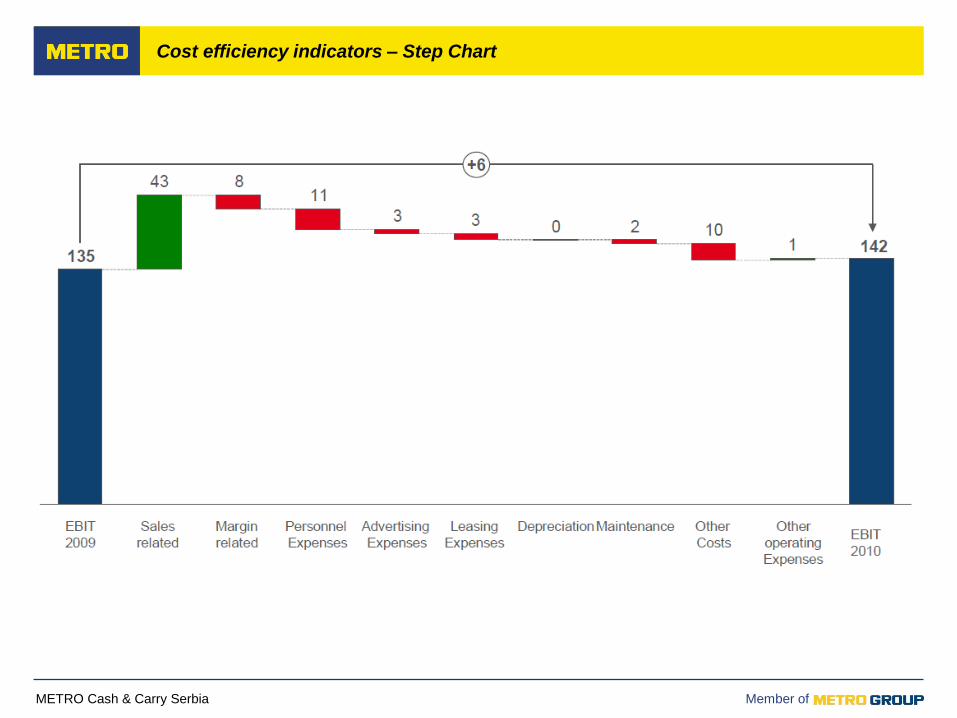
Cost efficiency indicators – Step Chart

METRO Cash & Carry Serbia Member of Page 18
Summary
METRO GROUP
Retail vs. Manufacturing
Monitoring P&L KPI’s
CCC
Classification of KPI
METRO Cash & Carry Serbia Member of
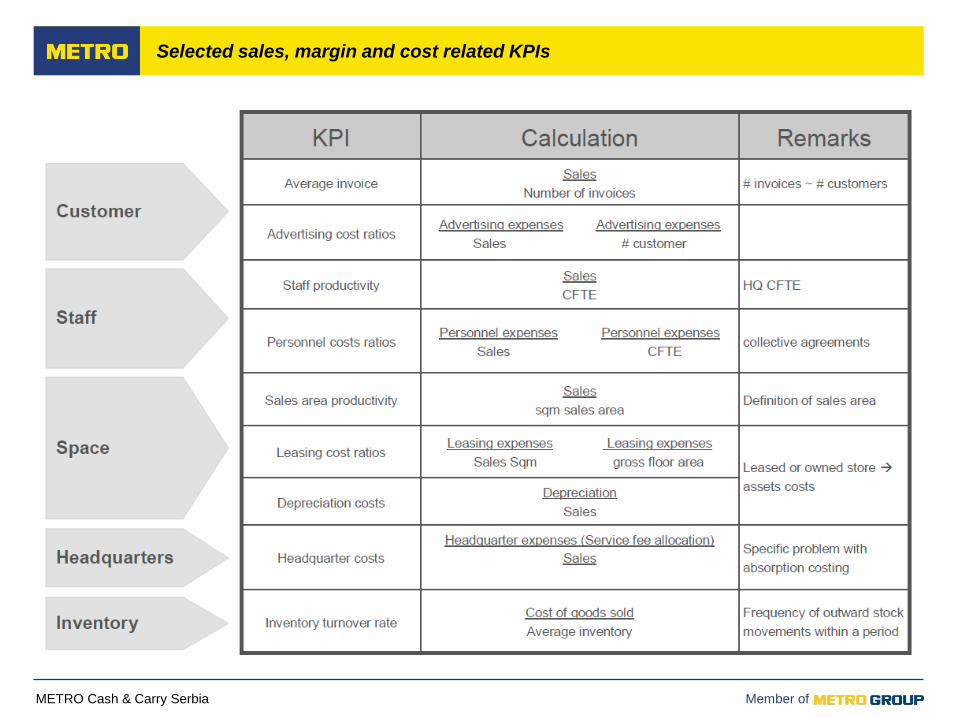
Selected sales, margin and cost related KPIs
METRO Cash & Carry Serbia Member of Page 20
CCC
METRO GROUP
Retail vs. Manufacturing
Monitoring P&L KPI’s
Summary
Classification of KPI
METRO Cash & Carry Serbia Member of
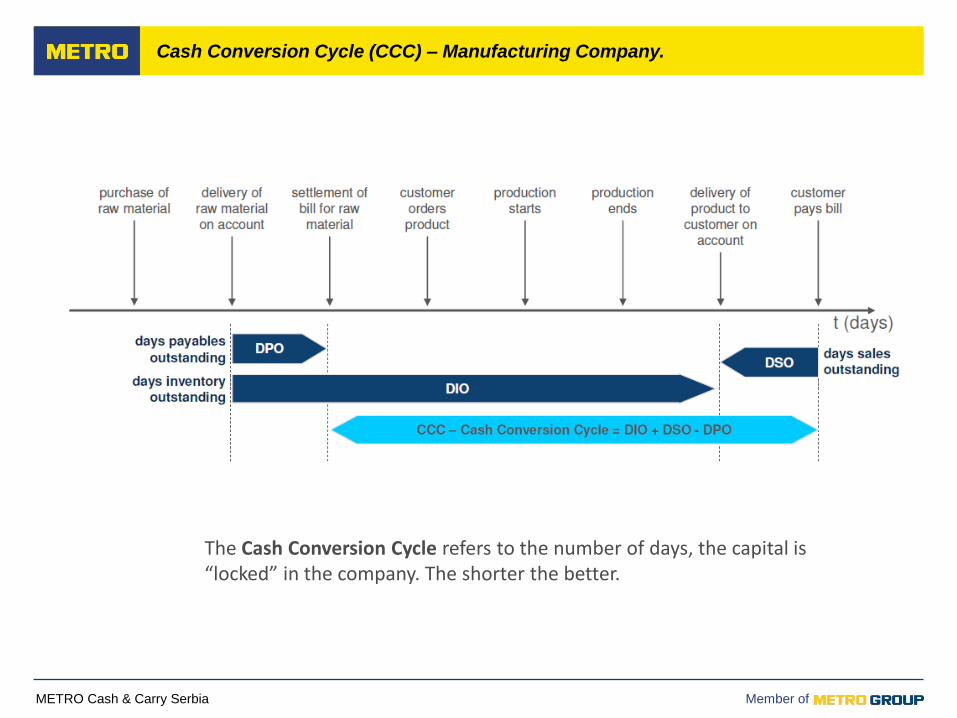
Cash Conversion Cycle (CCC) – Manufacturing Company.
The Cash Conversion Cycle refers to the number of days, the capital is“locked” in the company. The shorter the better.
Cash Conversion Cycle (CCC) – Manufacturing Company.
METRO Cash & Carry Serbia Member of
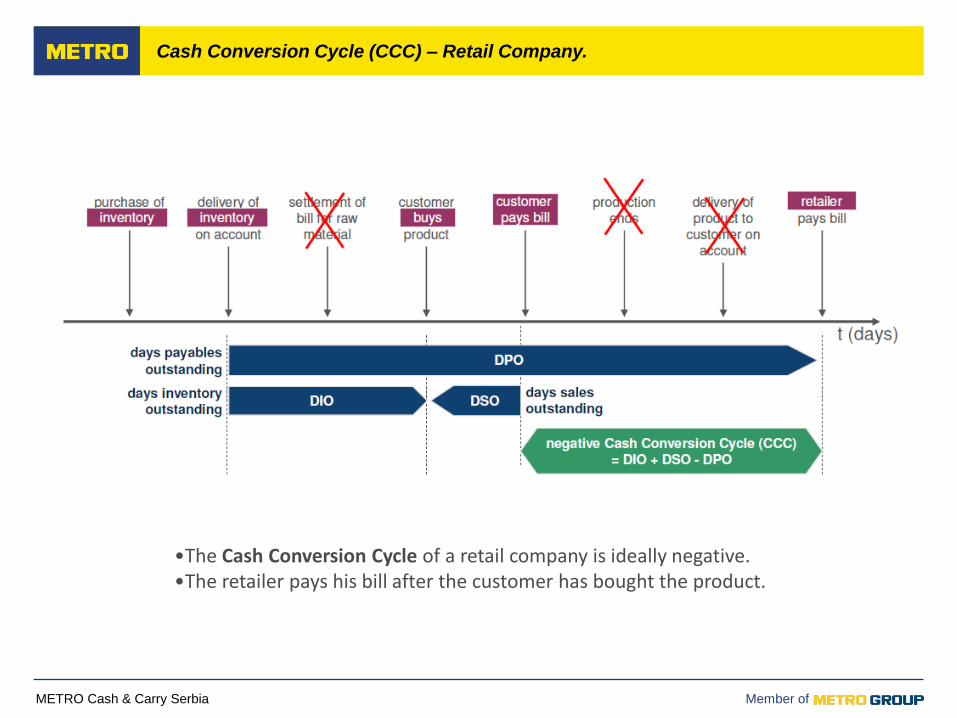
Cash Conversion Cycle (CCC) – Retail Company.
negative Cash Conversion Cycle (CCC)
= DIO + DSO - DPO
•The Cash Conversion Cycle of a retail company is ideally negative.•The retailer pays his bill after the customer has bought the product.
Cash Conversion Cycle (CCC) – Retail Company.