1. introduction - oecd.org - oecd · · 2017-04-251. introduction regional disparities ... in a...
TRANSCRIPT

REGIONAL DEVELOPMENT STRATEGIES IN BRAZIL1
GUSTAVO MAIA GOMES2
1. IntroductionRegional disparities die hard. As far as the Northeast, Brazil’s poorest region, is
concerned, GDP per capita in 1999 was 46,6 per cent of the country’s corresponding figure– almost exactly as it had been four decades before, in 1960. The latter is no arbitrarypicking. (Recall that Sudene, the regional development institution, was created inDecember, 1959.) Truly, some improvement (and some deterioration) have happened insub-periods between 1960 and the present. But fluctuations are fluctuations, and in the verylong run, the lack of change in relative positions is striking. The more so because reducingthe economic gap of the Northeastern region vis-à-vis the rest of the country has been fordecades a persistent goal of the Brazilian state.
To be sure, there has been change in the territorial allocation of production, aspreviously economically non-existent regions began to show up in the statistics.Correspondingly, in the seventies, frontier states such as Mato Grosso and Goiás, haveexperienced strong growth. The same, if more recently, has happened to Rondônia andTocantins. Part of this has been a consequence of government initiatives, in the form ofinfrastructure construction, the granting of tax holidays and incentives for privateinvestment, and investment initiatives of the state enterprises. At the state level,convergence of per capita GDPs do appear in the statistics, especially from 1947 to themid-1980s.
At the regional level, especially from the late 1960s on, the empty space of the Center-West has emerged as a dynamic agricultural region; also, after a long-lasting stagnation, theNorthern states of Amazonas (thanks to the Manaus industrial pole), Pará (mostly iron oremining, some cattle breeding, legal and illegal tree-cutting and wood products), and others(e.g. Rondônia, an agricultural frontier) have grown in the years 1968/1980 at rates wellabove the national average. But these were new fellows, unpopulated lands, going fromnothing to little. A big lap, OK, and yet in a sense an easy one. Would someone bet thatthey will keep growing so fast, from now on? I doubt. Meanwhile, the old Northeasterneconomy expanded, also helped by the visible hand of government, but just at about thesame speed as the whole country. Thus, for all the region’s dynamism, relative stagnationensued.
1 Paper written to the OECD and Ceará State Government “International Conference on RegionalDevelopment and Foreign Direct Investment”, to be held in Fortaleza, Dec 12-13, 2002.2 Ph. D. in Economics (University of Illinois at Urbana-Champaign, 1985); Director of Regional andUrban Studies of IPEA (Institute of Applied Economic Research, Ministry of Planning, Brazil);Professor at the Economics Department of the Federal University of Pernambuco, Recife, Brazil.

Social conditions have not been static, either. Historical records of education, health,and sanitation witness great improvement in all regions. But, here too, it is less clearwhether relative distances between the Northeast and the rest of the country have changedmuch. Probably, they haven’t. As for the Center-West and the North, progress there was,not enough to dismiss the old rule, however: the richer the place, the better its socialstanding.
This paper has six sections. Following the Introduction, section 2 deals with regionaleconomic and social disparities in Brazil, in a long-term perspective. For the description ofthe present state and the historical evolution of such disparities, I have used IPEA’sdatabase on Municipal GDPs and IBGE’s 1947/99 series of state-level Gross DomesticProducts (GDPs).3 As for the social indicators, IBGE’s PNADs (National HouseholdSurveys) were the main source.
Section 3 (Regional Development Instruments and Institutions) is concerned withdescribing the instruments and institutions for regional development in Brazil. Theinstitutions include the classical ones, such as former Sudene and Sudam (now Adene andADA), regional development banks (BN, Banco do Nordeste, and BASA, Banco daAmazônia), DNOCS, SUFRAMA, and the like, but also institutions such as Banco doBrasil, Caixa Econômica Federal, and BNDES, usually forgotten in analyses of regionalpolicy and development. Instruments range from fiscal incentives (FINOR, now FDN, andso on) to the regular credit advanced e.g. by the National Development Bank (BNDES).4
Clusters and local competitive advantage in the broader regional development contextis the subject of section 4. A new theme, both in Brazil and elsewhere, there is still not agood deal of empirical evidence on clusters. As a conscious public policy, clustering is toonew to be assessed, especially as a regional development policy or strategy. Admittedly, notevery cluster is as important as any other. Accordingly, in this section, particular emphasiswill be given to the most promising clusters in the less developed regions.
Section 5 has to do with the regional development strategy of the incoming Lula daSilva government. On this, some basic ideas can be drawn from the PT electoral program.Although it is too early to say that the government-to-be will carry out its promises, generalcomments on the most likely regional development policy of the new government are inorder. Section 6 puts together the concluding remarks.
3 IBGE stands for Instituto Brasileiro de Geografia e Estatística (Brazilian Institute of Geography andStatistics), a government institution.4 Sudene (now Adene) is the Superintendence (Agency) for the Development of Northeast, Sudam (nowADA) is the Superintence (now Agency) for the Development of the Amazon Region; (BN) is Bank ofNortheast; BASA is Bank of the Amazon Region; DNOCS is the National Department for Anti-DroughtWorks; BNDES is the National Economic and Social Development Bank; Suframa is theSuperintendency for the Manaus Free Trade Zone; BB is Bank of Brazil; CEF is the Federal SavingsBank (Caixa Econômica Federal).

2. Regional Economic and Social Disparities in BrazilSocial and economic disparities among Brazilian municipalities, states, and regions
have always been and remain strong. In this section, the empirics of regional imbalances isset forward. Some interpretation is also in order.
2.1 Income Disparities: Growth, Convergence, Divergence
Map 1 displays GDP per capita of Brazilian Municipalities in 1999. Take a pen anddraw a line starting from the southern border of Acre, going on to the southern borders ofAmazonas, Pará, Tocantins, and Bahia. In so doing, you went from Brazil’s extreme Westto the Atlantic Ocean (Eastern border for most of the states). Now you have two halves of acountry: the North and the South. Your North, of course, includes the Northeast; yourSouth, the Center-West and the Southeast. Now, look again at the map: the upper portion islight (lowest municipal GDPs per capita); the bottom one is dark (highest municipal GDPsper capita). Translation: the North is poor; the South is rich. And it has been so for a verylong time.
Of course, there are spots of high per capita GDP in the North/ Northeast, as there aremunicipalities in the South/ Southeast/ Center-West where per capita GDP is low. Manaus,in the heart of the Amazonas state, is one of these exceptional cases: besides being the statecapital (always a bless), it houses a sizeable industrial pole (mostly electronics andmotorcycles) made up of iron, bricks, and tax incentives. Its GDP per capita iscorrespondingly high. Belém (state capital), Barcarena (a huge aluminum factory), andSerra Norte (Carajás project, iron ore mining), in Pará, also show up dark in the map. In theopposite side, it is noticeable that the poor Northeast in a sense penetrates deep intonorthern Minas Gerais (projects in the Jequitinhonha Valley, Minas Gerais, have beeneligible for receiving the tax incentives of regional policy since the creation of Sudene,).Also, the northern part of Goiás is almost as poor as the south of Bahia.
No matter how significant those exceptions might be, the first impression sticks, and avery clear divide between the poor North (and Northeast), and the rich South (plus theSoutheast and, to a lesser extent, the Center-West) stands out as the most important featureof the regional distribution of economic activity in Brazil.

MAP 1
GDP PER CAPITA OF BRAZILIAN MUNICIPALITIES, 1999
q��\Bv��B�������B���B�����NB���B�����B���B���������BifrB���B������P
����������� �����������������������������������������

A second-level of analysis of regional disparities in Brazil is that of the states. Table 1shows estimates of annual growth rates of GDP per capita for each Brazilian state, between1947 and 1999.5 Also shown are estimates of relative GDP per capita, and the ranks of thestates according to per capita GDP in 1947 (or in the earliest year for which data wasavailable) and in 1999.
Although this is not shown in table 1, the yearly rate of growth of Brazil’s per capitaGDP (1947-99) was estimated at 3.23 per cent. The states that grew faster than the nation’saverage were Amazonas, Pará, Piauí, Ceará, Sergipe, Bahia, Minas Gerais, Espírito Santo,Santa Catarina, Rio Grande do Sul and Goiás. The ones which grew slowlier than Brazilwere Rondônia, Acre, Roraima, Amapá, Maranhão, Rio Grande do Norte, Paraíba,Pernambuco, Alagoas, Rio de Janeiro, São Paulo, Mato Grosso do Sul and Mato Grosso.(Some care is in order with the states of Rondônia, Roraima, Acre, and Mato Grosso do Sulas their rates of growth refer to periods other than 1947/99.) Paraná grew at the same speedof Brazil. A negative correlation was obtained between initial per capita GDP and rates ofgrowth. This should indicate convergence, but the coefficient was not statistically differentfrom zero.
By 1947, Rio de Janeiro state had the country’s highest GDP per capita (209, ascompared with Brazil = 100). São Paulo (184) was second, and Rio Grande do Sul (123),third. The lowest three GDPs per inhabitant were those of Ceará (36), Piauí (34), andMaranhão (26); all Northeastern states. Half a century later (1999), Paraná topped the list(160), followed by São Paulo (140), and Mato Grosso (128). At the bottom, the same three:Maranhão (31), Ceará (29), and Piauí (25). One would observe that, in p.c GDP relativeterms, all of these states had lost ground, in the meantime.
5 Estimates of the GDPs of some states of the North (the former Federal Districts, or Territories, as theywere called) are only available for the years 1959-99. For Mato Grosso do Sul, the earliest estimate isfor 1985. Tocantins, created in 1988, is left out of the analysis.

Table 1States of BrazilRates of Growth (1947/99)*, Relative Values (1947 and 1999) and Ranks of per CapitaGDP (1947 and 1999)
GDP Per Capita in YearZero** GDP Per Capita in 1999
State
AnnualGrowth Rate(Percent)*
Brazil =100 Rank
Brazil =100 Rank
(RankYear 0) –
(Rank1999)
Rondonia (1959) 2.19 79.30 9 65,22 11 -2
Acre (1959) 2.47 54.13 15 49,66 17 -2
Amazonas 4.5 100.51 6 101,50 8 -2
Roraima (1959) 3.2 44.63 19 51,56 16 3
Pará 3.43 60.06 14 47,67 19 -5
Amapá (1959) 1.78 109.91 4 60,62 12 -8
Maranhão 2.87 26.04 25 30,52 23 2
Piauí 3.50 34.32 24 24,60 25 -1
Ceará 3.63 35.80 23 29,16 24 -1
Rio G do Norte 3.19 49.32 16 46,23 20 -4
Paraíba 2.81 40.05 22 48,51 18 4
Pernambuco 3.03 61.78 13 39,60 22 -9
Alagoas 3.17 44.18 20 57,80 13 7
Sergipe 3.93 45.07 18 39,90 21 -3
Bahia 3.94 46.16 17 53,43 15 2
Minas Gerais 3.82 73.85 10 54,48 14 -4
Espírito Santo 4.30 62.36 12 91,27 9 3
Rio de Janeiro 2.16 208.81 1 107,69 7 -6
São Paulo 2.81 184.37 2 139,53 2 0
Paraná 3.23 102.76 5 159,99 1 4
Santa Catarina 4.15 99.29 7 119,05 4 3
Rio Grande do Sul 3.52 123.01 3 110,84 6 -3
M G Sul (1985) 1.16 80.26 8 117,84 5 3
Mato Grosso 2.91 72.46 11 127,38 3 8
Goiás 3.80 41.75 21 90,57 10 11
Source: Estimates by IPEA, Department of Urban and Regional Studies, on the basis of IBGE data. Rates were obtained byordinary least-square regressions of GDP per capita against an independent variable t = 0…n, where ti stands for a givenyear. [Functional form yt =yo (1+r)t
which is linear in the logs].* 1959/99 for Acre, Amapá, Rondônia, Roraima; 185/99 for Mato Grosso do Sul** 1947, unless otherwise specified.
The right-most column of table 1 compares the 1947 and 1999 ranks of GDP percapita. A negative number indicates loss of rank (the number itself shows how manypositions were lost); a positive number is assigned to states whose 1999 rank was higherthan the corresponding figure to year zero. (Again, year zero is not the same to every state.)Big losers were Rio Grande do Norte (4 positions lost), Minas Gerais (also 4), Pará (5), Riode Janeiro (6), Amapá (8, but remember that his year zero is 1959), and Pernambuco (9

positions lost). At the opposite side, Paraíba (4 positions gained), Paraná (also 4), Alagoas(7), Mato Grosso (8), and Goiás (11) were the winners.
In spite of those ups and downs, Figure 1, with yearly estimates of two inequalityindexes of state per capita GDPs (Theil-L and the weighted Coefficient of Variation) showsthat in the very long run there has been some convergence among the states of Brazil. But italso reveals that the path to a slight reduction in disparities was not a smooth one. One canidentify five sub-periods, commented below:
Figure 1Inequality of Per Capita GDP Among States, 1947-99
0
0,1
0,2
0,3
0,4
0,5
0,6
1947
1949
1951
1953
1955
1957
1959
1961
1963
1965
1967
1969
1971
1973
1975
1977
1979
1981
1983
1985
1987
1989
1991
1993
1995
1997
1999
Theil-L Coeff Variation
1947-56: stable inequality. Measured by the weighted Coefficient of Variation(WCV, the weights being the state populations), but for slight oscillations, inequality isunchanged from the beginning to the end of this period. Theil-L first shows an upwardmovement (increasing inequality), followed by an accommodation, in such a way that,looking just at the extreme years, inequality is stable. These were years of intense economicgrowth which culminated in the first half of implementation of Kubitscheck’s Target Plan(1955-59). In the absence of an explicit regional policy, it may happen that some keygovernment programs, such as the construction of the new capital, Brasília, and of the roadsconnecting it to the rest of the country, have played a role in avoiding the increase ininequality that was at the same time being produced by the spurt of industrial growth in therichest states.
1956-65: decreasing inequality. From 1956 to 1965, both Theil-L and WCV point toa decrease in inequality among state per capita GDPs. Recall that in 1960, Brazil’seconomy entered a phase of slow growth, but it also started implementing a regionaldevelopment policy favoring particularly the Northeastern states. Both factors may haveworked to decreasing state inequalities, as the regional policy focused on the poorest states,while the economic crisis hit more intensely the richest, industrial, ones.

1965-71: rising inequality. Contrary to what had happened in the previous period, theyears from 1965 to 1971 (slow growth at the beginning, then strong growth, from 1968 on)was a period when inequality among Brazilian states rose. No clear-cut relationshipbetween that trend and government policy can be established, though.
1971-86: decreasing inequality. From 1971 to 1986, Brazil entered a long period ofsteady decline of state per capita GDP inequality. Several factors may help explaining thisoutcome. For one thing, the early seventies were years of opening up of new lands toagriculture, especially in the undeveloped Center-West region. This was stimulated, fromthe demand side, by the consolidation of Brasília as the country’s capital, and, from thesupply side, by some important technical improvements that had made it possible extendinglarge-scale commercial agriculture to the cerrado (savannah) lands of Goiás and MatoGrosso. Besides, investment by public enterprises peaked on the II National DevelopmentPlan years (1974-79). This benefited some less developed regions such as the Northeast,further contributing to the lowering of GDP disparities among states.
1986-99: again, inequality in the rise. From 1986 to 1999, the WCV indicator showsinequality rising. As to Theil-L, the picture is less clear-cut. The index moves upward, from1986 to 1989, but it remains almost unchanged in the rest of the period. So, the end-to-endpicture is one of a slight increase in inequality. Again, no obvious connection can be madebetween these trends in inequality and government polices or the general movement of theBrazilian economy. To be sure, with few exceptions, 1986 to 1999 were years of sloweconomic growth in Brazil. Public investment, which admittedly had been an equalizingfactor in the preceding period (as the state enterprises, in particular, invested heavily inpoorer regions), had collapsed. Instruments and institutions of regional development policy,by their turn, had already lost their strength. On its turn, globalization was also on themarch, although its effect on regional inequalities is not easy to determine.
I started talking about regional disparities among Brazilian municipalities (Map 1);then I went on to deal with the states (table 1 and figure 1). Now, the regions are to beconsidered, as they are in table 2. In the whole 1947-99 period, the Center-West was the bigwinner, as in the average its p.c. GDP grew each year 1,1 percentage point above Brazil’s.As a matter of fact, all regions but the richest one (Southeast) grew faster than the nationalaverage, suggesting that interregional disparities in the country may have diminished in thesecond half of the twentieth century.
Taking 1960 as the starting year of implementation of an explicit regional policy inBrazil, it is possible to break 1947-99 into two sub-periods named in table 2 “Pre-RegionalPolicy Years” (1947-59), and “Years of Regional Policy” (1960-99). For Brazil as a whole,and for every region, average growth was higher in the first than in the latter period. In the1947-59, the Northeast grew slowlier than Brazil, and also than the other regions. After1960, the situation has reversed. This can perhaps be counted as an evidence of theeffectiveness of regional policy, as it concerns the Northeast. The North has also grownmore rapidly than the country, but this had happened in the previous period as well. Thefrontier region of Center West was ahead of all the others, in both sub-periods.
As to the sub-periods in table 2, a general observation is that when the Brazilianeconomy (most of all, the Southeast) decelerates, the rate of growth in the Northeast alsogoes down, but typically less than it does in the country as a whole, from which follows

that the product per head gap between the Northeast and the rest of the country decreases.The reverse happens, however, in times of rapid growth of the country as a whole.
Table 2Brazil and RegionsRates of Annual Growth of Per Capita GDP(Several Periods between 1947 and 1999)(Percent)
North Northeast Southeast South Center-West
Brazil
Whole Period (1947-1999) 3.62 3.40 3.01 3.50 4.24 3.23
Pre-Regional Policy Years (1947-1959) 3.96 3.55 3.85 3.77 5.44 3.94
Years of Regional Policy (1960-99) 3.54 2.81 2.50 3.30 3.66 2.74
Slowdown of Sixties (1960-67) -0.16 2.65 1.70 0.88 2.54 1.69
Economic Miracle (1968-73) 9.16 3.73 8.79 8.16 10.71 8.10
Adjusting to First Oil Shock (1974-79) 7.13 5.04 3.36 4.68 6.91 4.04
Debt Crisis (1980-83) 2.70 0.42 -2.98 -0.84 1.11 -1.82
High Inflation (1984-1994) 0.05 0.14 0.23 1.49 1.72 0.45
Stabilization and Slow Growth (1995-99) -2.51 1.54 1.03 -0.05 2.07 0.80
Source: Estimates by IPEA, Department of Urban and Regional Studies, on the basis of IBGE data. Rates were obtained byordinary least-square regressions of GDP per capita against an independent variable t = 0…n, where ti stands for a givenyear. [Functional form yt = yo (1+r)t
which is linear in the logs].
Except for the periods starting in 1947, the pair of variables (x0, y0) used in the regressions refers to the year immediatelypreceding the one shown in each line of the table. For instance, the set of (x,y) used to estimate the growth rate of p.c. GDPfor 1960-99 include 1959 and the p.c. GDP for 1959. This procedure captures the rate of growth of y observed in 1960.
Table 3 (and figure 2) displays estimates of Gross Domestic Product per capita forBrazil’s regions. As far as the Northeast is concerned, after an improvement in the fifties,GDP per capita in 1960 was 46 per cent the country’s corresponding figure. Then, ups anddowns, just to end the nineties again at 46 percent – exactly as it had been four decades ago.The same story holds for the North. A comment suggests itself at this point: if convergenceof a region’s GDP per capita to the country’s average is the ultimate criterion for judgingthe effectiveness of regional development policy, then it can be said that in Brazil suchpolicy was far from being a great success, at least for the Northeast.6
6 A word of caution: comparing observations for the extreme years may be somewhat misleading, asshort-run fluctuations obliterate long-run trends. So, no excessive weight should be given to theassessment made in the text. As to a methodological observation, the constancy of Northeast relativep.c. GDP in 1960 and 1999 is compatible with the finding in table 2 that the region’s rate of growthfrom 1960 to 1999 was higher than Brazil’s. Remember that the estimation of growth rates in table 2was made by fitting a constant-rate-of-growth curve to the data, while in table 3 one compares relativep.c. GDPs just in the two extreme years.

Table 3Regions of BrazilGross Domestic Product per CapitaSelected Years (1965 to 1999)(Index Numbers, Brazil = 100)Regions /Years 1950 1960 1965 1970 1975 1980 1985 1990 1995 1999
North 54 61 54 56 48 62 62 64 65 60
Northeast 42 46 49 39 38 41 46 44 45 46
Southeast 150 145 143 153 149 144 136 138 138 137
South 108 105 102 94 107 106 114 106 119 119
Center-West 53 58 73 71 73 87 104 122 90 94
Source: IBGE, National and Regional Accounts
Figure 2Per Capita GDP of Regions, 1950-1999
(Brazil = 100)
30
50
70
90
110
130
150
1950 1960 1965 1970 1975 1980 1985 1990 1995 1999
Northeast Southeast Center-West North
A closer look at Table 3 reveals that, while Northeast’s relative pc GDP declined from1960 to 1970, it significantly increased in the ensuing 15 years, making up (and just this)for the losses of the sixties. From 1985 on, the region’s relative pc GDP remained roughlystable. So, if there was a period for which regional policy can claim to have beensuccessful, this is the years spanning from 1970 to 1985. From the vantage point of a 2002observer, that does not seem an outstanding record. In 1985, it might have.
To the Center-West, the story went differently, as there is steady improvement from1960 to 1990, then sharp decline between 1990 and 1995, and a slight recovery from thelatter year to 1999. This is a success story, of course, but remember that the Center-Westwas and to an extent still is a frontier region whose development is better explained by the
opening up of new lands (even though this is not unrelated to government actions) than as aconsequence of an explicit regional development policy.
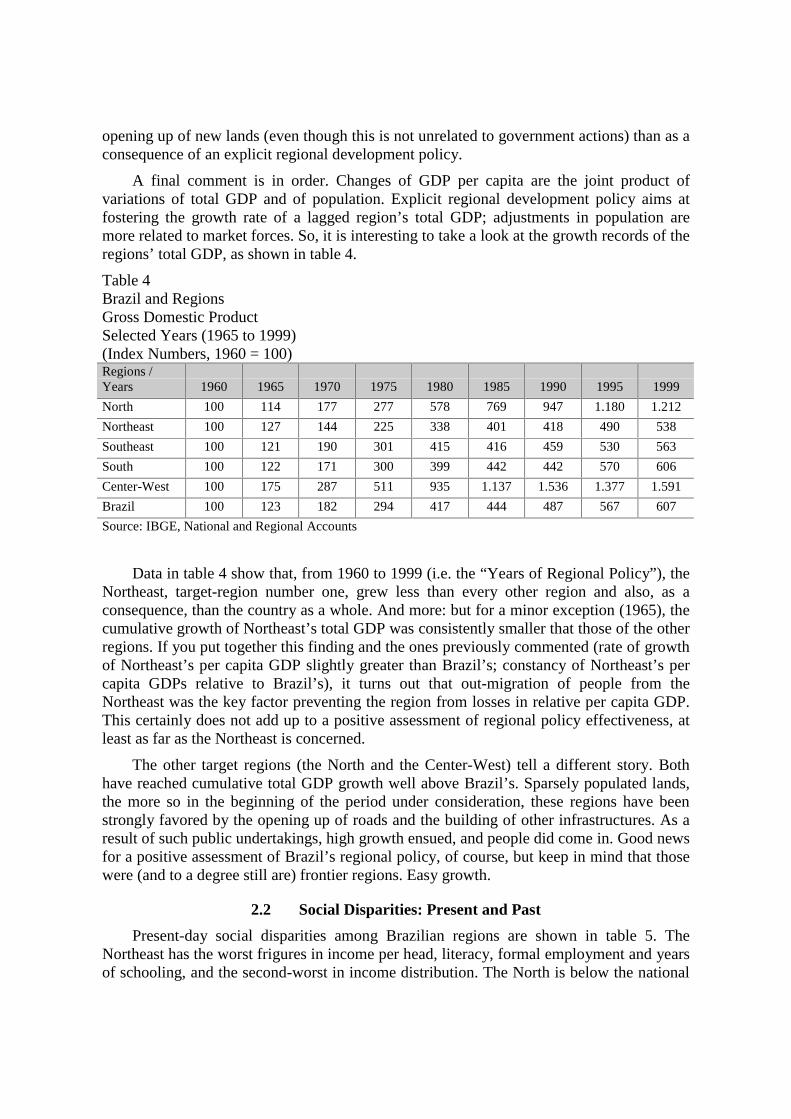
A final comment is in order. Changes of GDP per capita are the joint product ofvariations of total GDP and of population. Explicit regional development policy aims atfostering the growth rate of a lagged region’s total GDP; adjustments in population aremore related to market forces. So, it is interesting to take a look at the growth records of theregions’ total GDP, as shown in table 4.
Table 4Brazil and RegionsGross Domestic ProductSelected Years (1965 to 1999)(Index Numbers, 1960 = 100)Regions /Years 1960 1965 1970 1975 1980 1985 1990 1995 1999
North 100 114 177 277 578 769 947 1.180 1.212
Northeast 100 127 144 225 338 401 418 490 538
Southeast 100 121 190 301 415 416 459 530 563
South 100 122 171 300 399 442 442 570 606
Center-West 100 175 287 511 935 1.137 1.536 1.377 1.591
Brazil 100 123 182 294 417 444 487 567 607
Source: IBGE, National and Regional Accounts
Data in table 4 show that, from 1960 to 1999 (i.e. the “Years of Regional Policy”), theNortheast, target-region number one, grew less than every other region and also, as aconsequence, than the country as a whole. And more: but for a minor exception (1965), thecumulative growth of Northeast’s total GDP was consistently smaller that those of the otherregions. If you put together this finding and the ones previously commented (rate of growthof Northeast’s per capita GDP slightly greater than Brazil’s; constancy of Northeast’s percapita GDPs relative to Brazil’s), it turns out that out-migration of people from theNortheast was the key factor preventing the region from losses in relative per capita GDP.This certainly does not add up to a positive assessment of regional policy effectiveness, atleast as far as the Northeast is concerned.
The other target regions (the North and the Center-West) tell a different story. Bothhave reached cumulative total GDP growth well above Brazil’s. Sparsely populated lands,the more so in the beginning of the period under consideration, these regions have beenstrongly favored by the opening up of roads and the building of other infrastructures. As aresult of such public undertakings, high growth ensued, and people did come in. Good newsfor a positive assessment of Brazil’s regional policy, of course, but keep in mind that thosewere (and to a degree still are) frontier regions. Easy growth.
2.2 Social Disparities: Present and Past
Present-day social disparities among Brazilian regions are shown in table 5. TheNortheast has the worst frigures in income per head, literacy, formal employment and yearsof schooling, and the second-worst in income distribution. The North is below the national

averages in income per head and formal employment. It is (in a positive welfare scale) wellbelow the Southeast in every indicator, but in years of schooling (but remember that thisfigure is just for the urban North). The Center-West is better off than Brazil as a whole insome indicators, such as income per head, literacy, years of schooling, and worse off informal employment and income distribution.
Table 5Brazil and RegionsSelected Social Indicators, 2001(a)
Regions / Country
Personal NominalIncome per Head
(2000)
(R$/month)(b)
Illiteracy Rate(2001)
(Percent)
Formal Employment(1999)
(Percent of TotalEmployment)
Years of Schooling(2001)
(Years)
Gini Index ofPersonal Income
Distribution (2001)(c)
North 576,84 7,8 45,3 6,3 (d)
0,598
Northeast 448,45 17,7 43,2 5,3 0,617
Southeast 944,72 7,1 68,3 6,2 0,586
South 796,26 5,4 71,2 6,6 0,572
Center-West 855,83 9,2 52,9 6,7 0,622
Brazil 768,83 11,4 61,3 6,2 0,609
Source: IBGE, Demographic Census (2000), and PNAD (2001)
(a) Or latest year available, as stated in each column.
(b) Average monthly nominal income of householders with a non-zero nominal income.
(c) Gini Index of Personal Income Distribution of nominal income of householders with a non-zero nominalincome.
(d) Urban North.
It is difficult to observe trends in social indicators over the long run. In any case, table6 shows estimates of poverty incidence for the regions of Brazil in selected years, from1970 to 1999. The ratio of poor people to total population has declined in Brazil and all itsregions in the last three decades (table 6 and figure 3), a result that followed from acombination of economic growth and social policies. Since, as seen before, the aggregategrowth of Northeast’s per capita and total GDP can only marginally be attributed toregional development policy, and since social policies are not part of regional developmentpolicies, it follows that the latter has little bearing on the improvement of social conditionsobserved in the Northeast over the past thirty years. Again, we do not come up withpleasant conclusions as to the effectiveness of regional (development) policy for theNortheast. But improvement in social conditions, as represented by the proportion of poorpeople in total population, did happen.

Table 6Brazil and RegionsPercentage of Poor People in Total PopulationSelected Years (1970 to 1999)(Percentage)
IPEA / UNDP Estimates (1) GVF Estimates (2)Regions /Years 1970 1980 1991 1992 1996 1999
North 80,10 51,29 58,63 47,5 31,2 34,9
Northeast 87,85 66,53 71,68 60,6 48,4 50,2
Southeast 50,60 22,65 29,66 26,9 14,9 16,8
South 69,89 31,92 36,88 29,4 17,1 19,8
Center-West 73,71 37,48 39,31 37,2 23,1 23,6
Brazil 67,90 39,47 45,46 38,9 26,4 28,4
u������\BJSKBJ���BS[YRNBS[ZRNBS[[SKBkdigBQBkrgcBQBwpfrNBj����Bf����������Bt�����B��Bd�����NBS[[ZBBJTKBJ���S[[TNBS[[XNBS[[[KBi������Bx�����Bh���������NB�����B��BkdigBQBp�������Bj��������Bu������P
Figure 3Poverty Incidence in Regions, 1970-1999
(Percentages)
12
22
32
42
52
62
72
82
1970 1980 1991 1992 1996 1999
Northeast Southeast Center-West
3. Regional Development Institutions and Instruments
3.1 Regional Development Institutions
The Bank of the Amazon is now 60-year old. Originally named Banco da Borracha(literally, Bank of Rubber, i.e. a credit agency specialized in the financing of just one, ifimportant, sector), BASA is nowadays a development bank, something it was not when it

started operations. Bank of Northeast (BN) was created, in 1952, from the start, as adevelopment bank. But it is generally accepted that the modern period of regionaldevelopment policy in Brazil began only seven years later when Sudene (theSuperintendence for the Development of Northeast) came into being. Development, moreprecisely economic development, was then the word of the day.
A bird’s-eye view of regional development institutions in contemporary Brazil is nowgiven.
A. Sudene / Adene. Up to May 2001, Sudene was Brazil’s most important regionaldevelopment institution, in the sense that it was nominally responsible for coordinating theactions of every branch of the federal government operating in the Northeast, the numberone problem-region. Also, on its inception, and shortly afterwards, Sudene commanded ahuge amount of financial resources. On its heyday, Sudene administered Finor (NortheastInvestment Fund, made up of parcels of the corporate income tax), granted or denied othertax incentive also related to the corporate income tax, and had some bearing upon the FNE(Northeast Constitutional Loan Fund).
This all notwithstanding, in May 2001, Sudene was extinguished, and a new successorbody, Adene (Agency for the Development of Northeast) was created. After a long delay,its directors took office by August 2002, but they were never given the human and financialmeans even to put together the administrative apparatus of the institution. So far, therefore,Adene has been but an acronym, with no real existence whatsoever. The President-electLula da Silva has said that his government will recreate Sudene. With some money, ornone? With outstanding and well-paid new personnel, or not? With a shadow of the formerpower, or not? No one knows.
Sudene’s headquarters (as well as Adene’s) are located in Recife, Pernambuco. It is tobe noticed that, since the failure of Sudene (which of course precedes its official abolitionby decades), the institutional apparatus of regional policy in Northeast has been in a state ofdisarray.
B. Sudam / ADA. (Superintendence for the Development of the Amazon Region) wasalso extinguished in May 2001, together with Sudene, under suspicions of corruption.Created in 1974, Sudam administered Finam (the Amazon Investment Fund, counterpart ofFinor), and the other fiscal incentives for regional development (already referred to inrelation to Sudene). ADA (Agency for the Development of the Amazon Region) is Sudam’ssuccessor institution. The same comments made to Adene also hold true to ADA, whoseheadquarters (as were Sudam’s) are in Belém.
C. Banco do Nordeste (Bank of Northeast, BN). Established in 1952, Banco doNordeste, describes itself as today’s leading financial institution of the region. BN, in itsown words “a unique combination of development, investment and commercial bank”, has174 branches covering over 1955 cities in the region, which today includes parts of MinasGerais and Espírito Santo states. It supplies about 78 per cent of all the rural and industrialloans in the Northeast. As of now, total assets of BN are about R$ 13.5 billion. BNheadquarters are located in Fortaleza, Ceará.
Banco do Nordeste used to have a central role in the administration of regional taxincentives (by being the sole institution responsible for the financial operations related toFinor-supported projects); it is by and large responsible for managing FNE (Northeast

Constitutional Loan Fund), operates as a retail bank for BNDES (the National Economicand Social Development Bank), and in recent years has been able to bring in sizeableamounts of funds from the Inter-American Development Bank and from private sources inEurope and the United States.
D. BASA (Bank of the Amazon Region) was created as Banco de Crédito da Borracha(Bank of Credit for Rubber, 1942) to supply credit for rubber production in order to help inwar effort of the Allies. After the War, it was renamed Banco de Crédito da Amazônia(Bank of Credit for the Amazon Region) and, in 1966, as Banco da Amazônia. It isnowadays a development bank responsible for administering FNO (North ConstitutionalLoan Fund). Belém is the city where the central administration of BASA is located.
E. Codevasf, (Company for the Development of the São Francisco and ParnaíbaValleys) today is mainly concerned with constructing and administrating irrigation projects.Despite its many shortcomings, Codevasf deserves credit for carrying on some of the mostsuccessful economic development experiments ever tried in Northeast. The Petrolina-Juazeiro irrigation pole, for instance, has become a profitable and sustainable case ofeconomic and social development. Codevasf’s headquarters are in Brasilia.
F. DNOCS, (National Department for Public Works Against the Droughts), the oldestof regional federal institutions (its ancestor, IOCS, was created in 1909) is widely taken asa dismantled body, in charge of administering several loss-making irrigation projectsscattered in Northeast, and still responsible for constructing dams (of varied sizes) andsmall-scale wells in the region. DNOCS headquarters are located in Fortaleza, Ceará.
G. Chesf, (São Francisco Hydroelectricity Company). Although not explicitly aregional development institution, Chesf (created in 1948) has played so important a role inNortheast that it has to be mentioned. Still a public enterprise, Chesf operates in thegeneration and transmission sector of electric power. Even though the precise figure is notavailable, it can safely be said that Chesf is responsible for over 95 per cent of the totalgeneration of electric power in Northeast (Maranhão state excluded, since it is supplied byEletronorte). Its headquarters are in Recife, Pernambuco.7
H. Eletronorte (The Hydroelectricity Company for the Northern Region) was createdin 1972. Located in Brasília, Eletronorte is responsible for the generation and transmissionof electric power in the Northern region.
I. BNDES (National Bank for Economic and Social Development), created in 1952 (aswas BN), is not a regional, but a national institution. Occasionally, however, BNDES hasmade unique contributions for the development of the Northeast and, to a lesser extent,theNorth and Center-West. The bank was one of the main sources of funds for the financing ofpath-breaking projects such as the petrochemical pole of Camaçari (Bahia state), thehydroelectric power generation plant of Xingó (São Francisco river, states of Alagoas andSergipe), and the new automobile assembly plant of Ford in Bahia. BNDES operatesNordeste Competitivo (Competitive Northeast), and Amazônia Integrada (IntegratedAmazon) credit programs purposely designed to foster the regions’ economic potentiality.
7 Eletronorte is the state-owned electric power company of the Northern region. See below.
According to the Bank, “Regional action by the BNDES has the objective of elevatingthe salaries and living conditions in the underdeveloped regions of Brazil, thus reducingsocial and economic inequality observed in those regions. Consequently, BNDES actionhas been directed to making viable the greatest number of possible investments in thoseregions, where credit is offered through better financing conditions, lower interest rates,extended payment schedules and increased financing participation in the total value of theinvestments. Similar initiatives are being taken with respect to the Northeast and Central-West region, as well as other micro-regions that are in need of economic revitalization.”
Other federal banks such as Banco do Brasil (Bank of Brazil, BB) and CaixaEconômica Federal (Federal Savings Bank, CEF) also operate in the lagged regions,although none of them could properly be named a development institution. (Even less so, aregional development institution.) In spite of this, by financing agricultural activities (BB),and being the only source of funding for low-income housing and public sanitation works(CEF), both institutions have made significant contribution to the development ofNortheast.
3.2 Instruments for the Development of Lagged Regions
The instruments of regional development promotion can be broadly divided into threecategories: tax and financial incentives; long-term and short-term credit; and publicinvestment, both of the government properly said, and of the state enterprises. They areconsidered in more detail in this section.
Four federal banks supplying credit as a development instrument are present inNortheast and the Amazon region. They are Banco do Nordeste (BN), BASA (Bank of theAmazon Region), Banco Nacional de Desenvolvimento Econômico e Social (BNDES),Caixa Econômica Federal (CEF), and Banco do Brasil (BB).
3.2.1 Banco do Nordeste
BN is responsible for administering FNE (the Constitutional Loan Fund for theNortheast). Other resources of BN include funds provided by the Inter-AmericanDevelopment Bank and by BNDES. As of now, the main credit programs offered by BNare:
A. Industrial (Industrial Credit). Clients are private industrial enterprises of any size,provided they are under the control of Brazilians. Cooperatives and associations areelegible for credit. The program provides long-term loans for the creation, expansion,modernization and relocation of industrial plants.
B. Programa Nordeste Competitivo (Competitive Northeast Program). Adevelopment program created by BNDES, but also operated by BN. (See additionalinformation in the section on BNDES).
C. PMPE, Programa de Apoio às Micro e Pequenas Empresas, (Program for Microand Small Enterprises). Urban-based micro and small private-sector enterprises under thecontrol of Brazilians are eligible as recipients of long-term loans for the creation,expansion, modernization and relocation of plants. Funds are available for fixed (building,machines, etc) and working capital.

D. Proatur, Programa de Apoio ao Turismo Regional (Program for Regional TourismPromotion). For Brazilian private enterprises located in places selected as tourist poles byEmbratur (Braziliam Tourism Enterprise). Offers credit for creation, expansion,modernization and reform of ventures in the tourist sector.
E. Rural, Programa de Apoio ao Desenvolvimento Rural do Nordeste (Program forthe Rural Development of Northeast). Aims at promoting the development of livestock-farming through infrastructure modernization of the livestock farms; increasing productionand productivity of farms in the sector.
F. Agrin, Programa de Apoio ao Desenvolvimento da Agroindústria do Nordeste(Program for the Development of Agriculturally-Based Industries). The program has as itspurpose to facilitate the creation, expansion, modernization and relocation of agriculturally-based industrial plants making it possible for them to open up new employmentopportunities and bring economic progress to rural areas in Northeast.
G. Proger, Programa de Fomento à Geração de Emprego e Renda do Nordeste doBrasil (Program for Job and Income Creation in Brazil’s Northeast). The program has as itsclients small individual producers and enterprises in the rural and urban sectors. It helpscredit-takers to create jobs and income through support to new production, training ofmanpower and infrastructure creation.
H. Prodetec, Programa de Apoio ao Desenvolvimento Tecnológico (ProgramStimulus to the Technological Development). The program’s objectives are to acceleratethe technological development of the region with emphasis on the promotion of efficiencyand competitiveness of rural and industrial enterprises.
I. Banco da Terra, (Bank of the Land). It is aimed at reaching rural landless workers,especially wage-earners, sharecroppers, and small landowners with areas smaller than theminimum. The program provides loans for landownership reorganization and settlement.
J. FNE-Verde, Programa de Financiamento à Conservação e Controle do MeioAmbiente (Green FNE, Credit Program for the Conservation and Control of theEnvironment). Aims at financing the development of environmentally sound productiveactivities, and expenditures of environmental conservation and control.
K. Prodesa, Programa de Apoio à Reorientação da Pequena e Média Unidade Ruraldo Semi-Árido Nordestino (Program of Support for the Reorientation of the Small andMedium-Size Rural Enterprise of the Semi-Arid Region). Oriented to agricultural engineersrural proprietors that commit themselves to full time dedication to the agricultural activity.The program has as objectives restructuring, strengthening and modernizing small andmedium-size farms of the Semi-Arid region, giving priority to the diversification of theactivities and to technological updating.
L. Pronaf, Programa Nacional de Fortalecimento da Agricultura Familiar (NationalProgram for the Development of Family-Based Agriculture). See below section 7 for moredetails on this program.
M. Programa de Apoio ao Aperfeiçoamento Tecnológico e Gerencial da EmpresaNordestina, (Program of Support to the Technological and Managerial Improvement ofNortheastern Company). Northeastern companies are eligible. The focus of the program is
placed upon the managerial improvement of companies, especially by application ofmethods of total quality.
N. Cédula da Terra, Projeto Piloto de Apoio à Reforma Agrária (Bill of the Land) isa pilot project for agrarian reform. Associations of rural landless workers are eligible forobtaining loans for acquisition of land in governmental land reform projects.
O. Protrabalho, Programa de Promoção do Emprego e Melhoria da Qualidade deVida do Trabalhador na Região Nordeste(Pro-Work). Companies of any size based onNortheast are eligible. Objectives include job generation and betterment of life conditionsof workers.
P. Pro-Solo, Programa de Incentivo ao Uso de Corretivos de Solos (Pro-Soil). Ruralproducers of any farm size are eligible. The program aims at increasing productivity ofNortheastern agriculture by stimulating the adequate chemical treatment of soils.
Q. Crediamigo, Centro Nordestino de Micro-Crédito (Northeast Micro-CreditCenter). The purpose of the program is to contribute to the development of the micro-business sector in the region. As of now, more than 400 thousand operations of creditconcession have been made. Target population are small entrepreneurs who developservice, commerce and other sector productive activities who need credit for workingcapital and purchase of equipment. Access is easy and bureaucratic controls greatlysimplified.
3.2.2 Banco da Amazônia
Bank of the Amazon administers FNO, the North Constitutional Fund, which is itsmain source of funds. BASA has programs such as Brasil Empreendedor (Pro-Entrepreneurship Program); Proinfra (Credit for Infrastructure); and special credit lines forinvestment in tourism, industry and agriculture.
The main source of funds for BASA is FNO (North Constitutional Loan Fund). Thebank has also intermittently operated as an agent for BNDES in the Amazon region.
3.2.3 BNDES
BNDES provides long-term financing of investments for private companies in allareas, including foreign companies operating in Brazil. Many of the companies thatparticipated in the privatization program have received financial support from BNDES. Thebank activities include financing and co-financing, security subscriptions (of stock anddebentures) for the capital markets and project finance. Regional programs are:
Nordeste Competitivo. (Competitive Northeast). With very few exceptions, BNDEScredit programs are open to companies located in any Brazilian region. In an attempt tobetter suit the less developed areas, however, BNDES has created some regional programssuch as Nordeste Competitivo (Competitive Northeast) for Northeast. Companies located inthe area under jurisdiction of former Sudene (Northeast and parts of the Minas Gerais andof the Espírito Santo states) are eligible for credit concession.
Nordeste Competitivo is but a new brand name for the same old credit programs ofBNDES, such as Finem (Financiamento a Empreendimentos, Financing for Undertakings),BNDES Automático (Automatic BNDES), and Finame (Financiamento de Máquinas e

Equipamentos, Financing for Machinery and Equipment). Projects in sectors in which theregion has demonstrated competitiveness can ask for credit under special conditions. Theseinclude interest rate rebates (in relation to rates charged by BNDES to similar operations inother regions) and a lower threshold for direct financing by the bank. BNDES has allocatedR$ 5 billion to the program, which is due to end by April 2002. Up to May 2001, R$3.3billion had been lent by BNDES in credit concession under Nordeste Competitivo.8
The other regional programs of BNDES, namely, Amazônia Integrada (IntegratedAmazon), Programa do Centro-Oeste (Center-West Program), and Reconversul(Programa de Reconversão Produtiva da Metade Sul e do Noroeste do Rio Grande do Sul,Program for the Productive Restructuring of the Southern Half and the North-West of RioGrande do Sul) have similar features.
According to the Bank, the regional programs of BNDES aim at raising income andsocial standards of Brazil’s less developed regions. The bank’s strategic orientation is tofinance as many viable projects as possible in those regions, by offering credit in favorableterms: lower interest rates, longer amortization periods, and a higher proportion of BNDESfunds in total costs of the projects. Over the last five years, BNDES granted R$19,3 billionthrough the regional programs to projects in the Northeast, the Center-West, the Amazon,and the southern part of the Rio Grande do Sul state.
3.2.4 Caixa Econômica Federal
Although never a regional development bank, Caixa Econômica Federal (FederalSavings Bank, CEF) is the only source of long run credit for the housing and sanitationsector in Brazil and the regions. With total assets of R$ 121.5 billion, CEF is the secondlargest bank in Latin America. Caixa Econômica has no special program or favoredconditions for projects in Northeast or the North. Their credit programs have to bementioned, however, given the significance of the two above mentioned sectors.
3.2.5 Banco do Brasil
Largest bank in Latin America (total assets of R$ 138.4 billion), Banco do Brasilsupplies agricultural credit and is responsible for the implementation of some governmentdevelopment programs. The bank has no specially tailored credit program for Northeast.Table 4.8 displays figures on credit concession by Bank of Brazil for investment inagriculture and livestock by state of Northeast, from 1996 to 1999.
3.2.6 Finor, Finam and other fiscal incentives
Up to May 2001, companies interested in setting new plants or expand existing ones inthe Northeast (plus parts of the states of Minas Gerais and Espírito Santo) and the Amazoncould count on a system of tax and financial incentives offered by the Federal governmentand administered by former Sudene and Sudam. Incentives included the ones provided byFinor, Fundo de Investimentos do Nordeste (Northeast Investment Fund), Finam (the
8 When it was created, Nordeste Competitivo would only finance projects in a few pre-selected sectors.Later, these restrictive conditions were relaxed and every competitive project became in principleeligible.

Amazon Investment Fund) and the special incentives of reduction and reinvestment ofincome tax portions.
A. Finor / Finam. The main source of Finor and Finam was the deduction of 18 percent of the corporate income tax. Companies in the manufacturing sector, agribusiness,agriculture, tourism, and infrastructure with new projects or projects for expanding ormodernizing existing plants were eligible for support by the fund whose operatingconditions were recently (May 2001) modified.
Projects supported by Finor and Finam were of two main types. Under article 5,companies with approved projects would receive money and give in exchange debenturesto the Fund. By the time the new project started operations, 70 per cent of those debenturescould be exchanged for stock of the company who owned the supported project; 30 per centhad to be repaid in money (plus interest and other charges). This had always been more atheoretical proposition than a matter-of-fact one for very few of the inconvertibledebentures have ever been repaid.
Under article 9, large companies would form joint ventures for setting new plants inthe Northeast or the Amazon. Provided their project was approved, those companies couldwrite debentures and exchange them for money from Finor or Finam. The total amountthese companies could channel to the new project was 70 per cent of their contribution tothe Fund (i.e. 70 per cent of the 18 per cent of their payable income tax).By the time thenew production unit went into operation, the debentures could be converted into stock.
B. Special Incentives. Until the changes decreed by May 2001, industrial andagricultural companies which planned to implement new undertakings in the Northeast orthe Amazon region were entitled to a 75 per cent reduction in their income tax. Theincentive was good for a period of ten years. (Several changes in the operating procedureswere made along the years). The value not paid as income tax had to be productivelyinvested in the region.
Companies already operating were also eligible for income tax reductions, in that casewith an upper bound of 37.5 per cent. There also was an incentive for reinvestment ofincome tax portions favoring industrial, agricultural and civil construction companiesoperating in Northeast. These companies could deduct part of their income tax which,together with an equal amount of their own funds could be earmarked for upgrading of theirequipment.
The special incentives of income tax reductions were valued by some companies asalmost as important as the Finor and Finam incentives. A generous interpretation of the lawhad made concession of the special incentives nearly mandatory, something that greatlyreduced the effectiveness of the instrument for promotion of regional development.
C. The newly created FDN and FDA. By a Provisional Act (Medida Provisória) n.2146-1, issued on May 4, 2001, the federal government abolished Sudene, created ADN,the Agency for the Development of the Northeast, and gave birth to a new fund (calledFDN, Fundo para o Desenvolvimento do Nordeste, Northeast Development Fund). Finorwas not abolished: previous arrangements (mainly article 9) that involved the allocation ofparts of the income tax of some companies for specific projects in the region will be kept;commitments of Finor with already under construction “article 5” projects will also be

honored. In the long-run, i.e. once such previous commitments are worked out, Finorwould, of course, vanish.9
The big change of the new (FDN) fund, as compared with Finor is its public character.Under the laws regulating Finor, the money entering the fund was never considered publicmoney. Rather, the funds were legally defined as private property, even though theiradministration was mainly made by the government. With FDN, things will be different:the money is, from the beginning, public, in the sense that it will be collected as taxes. As apublic fund, FDN will be included in the Federal Government fiscal budget. To be spent,resources of FDN will have to follow the same bureaucratic channels of every other publicmoney. This is supposed to be a good thing, as a more strict control of payments could inprinciple be obtained. In practical terms, may end up as being just another hindrance, withno real positive consequence for regional development.
At the moment, the Medida Provisória (twice renewed) is under the scrutiny ofCongress, with a view of transforming it (or not) in ordinary law. No one can foretell whatis going to come out of this process. A good guess would be that nothing will happen, atleast not during the Cardoso government. In this scenario, the government will continuerenewing its Medida Provisória; no effective creation of either ADN or FDN will takeplace; and everyone will wait for the next government to try to settle the matter.
3.3 Regional Transfers of Income
As of now, the most important regional policy instrument in Brazil has nothing to dowith Sudene, Sudam, Adene, ADA, Banco do Nordeste, BNDES, tax incentives, publicinvestment or the like. It is embodied in the transfers programs of the Social Security, of theHealth, and the Education Minister, to name just the biggest. As Table 7 demonstrates, theyearly amount of money that those programs unwittingly transfer from other regions to theNortheast is more that ten times greater than the average annual Finor; about seven timesthe annual FNE, twenty times the yearly credit conceded by Banco do Brasil to investmentsin the region, and so on. I am talking of net transfers, i.e., of gross transfers less thecontribution of the region to the financing of each program. The North is also a recipient, ifrelatively less so.
9 Provisional Act (MP) 2146-1 was later modified by MP 2146-6 (June 6, 2001) and MP 2146-3 (June28, 2001). Few substantial changes other than treating separately (in two MPs) the cases of Sudene andof Sudam (the Superintendency for the Development of the Amazon Region) were made.

Table 7Brazil and RegionsEstimates of Transfers of Income Among Regions, 1999(In R$ million and percentage)
Regions, / BrazilNorth Northeast Southeast South
Center-West Brazil
National Income (adjusted) 24.254 104.771 362.103 115.851 50.265 -
Net Transfers as a percentage ofadjusted national income 3,8% 7,7% (1,9)% 0,6% (5,3)% 0
Gross Transfers 2.969 16.755 42.522 12.925 3.480 78.652
Financing of Transfers 2.044 8.728 49.466 12.265 6.149 78.652
Net Transfers 925 8.028 (6.944) 660 (2.669) 0Source: IPEA (Department of Regional and Urban Studies)
Obs: Transfers include payments of social security benefits, in-kind benefits (e.g. free meals in public schools), free medical assistance;free education, and others.
Although the short-term benefits of such transfers are noticeable, one could askwhether this policy is not antithetical to economic development. Given that the amount ofsocial expenditures has reached in Brazil such levels as to nearly eliminate publicinvestment, I do think that there are problems here. With the state so busy implementingthis sort of policy, it is not likely that economic development will revive in the country orits regions. In retrospect, it seems that stagnation has been the rule, and that the brief periodof strong growth of the seventies, the exception. Income transfers do nothing topermanently eliminating poverty in the less developed regions. In due time, a new fiscalcrisis will ensue, transfers of income will have to be drastically cut, and we will discoverthat the Northeast, in particular, is as vulnerable as it was forty years ago, when Sudene wascreated, and great expectations were in order.
4. Clusters and Local Competitive Advantage
4.1 Clusters and Regional Development in Brazil
In the literature on regional development, cluster has become a fashionable word. Arecent work by IPEA researched several industrial clusters in Brazil, located off the biggestindustrial cities. Among them, the clusters of furniture in Espírito Santo, Ubá city (MinasGerais) and Serra Gaúcha (Gaucho Hills, Rio Grande do Sul state); shoemaking in Franca(São Paulo) and Nova Serrana (Minas Gerais); textiles and dressmaking in Nova Friburgo(Rio de Janeiro), and Campina Grande (Paraíba); ecological tourism in Bonito (MatoGrosso do Sul); software in Joinville (Santa Catarina).
It is well known that clusters centered on agricultural activities (fruit production) havedeveloped in far-away places such as Petrolina (Pernambuco) / Juazeiro (Bahia); andMossoró / Assu (Rio Grande do Norte). Grain (mostly soybean) production has also heavilyconcentrated in the previously undeveloped (and unpopulated) lands around Barreiras(Bahia), Balsas (Maranhão), and the south of Piauí. Some years ago, the same hadhappened to the lands of Mato Grosso and Goiás.

A detailed map of industrial and agro-based clusters in less developed parts of Brazil isstill lacking. A generalized belief is that in many places clustering is paving the way fordevelopment, especially for the development of lagged regions.
4.2 Policies for Cluster Promotion
Clustering is a new word in regional development promotion, in Brazil and elsewhere.In the case of Northeast, two things deserve mention: the so-called Pro-Northeast Initiative,and Banco do Nordeste’s Development Lighthouse.
A. Pro-Northeast Initiative. Pro-Northeast Initiative (Iniciativa pelo Nordeste) wasan attempt to coordinate cluster promoting actions by three state governments (Bahia,Ceará, and Pernambuco) in four sectors or would-be clusters: irrigated fruits (Pernambucoand Bahia), soybean (Bahia), tourism (Pernambuco, Ceará, Bahia), and software/hardwareproduction (Pernambuco and Bahia). The Initiative received support from the World Bank,BNDES, and IPEA. It started in mid-1997 and lasted until the end of 1999. In Pernambuco,work begun by the Iniciativa was continued under the coordination of Condepe, the state’sPlanning Institute.
In spite of its limited scope, lack of resources, and other flaws, the Iniciativa mayclaim to have been the first attempt to bring in to Brazil the very idea of clustering.Entrepreneurs in the software production (Recife, Pernambuco) credit the Iniciativa for theestablishment of profitable commercial links with the US market. In tourism, some of theideas brought in by the Iniciativa (such as the creation of a brand name Nordeste forpromoting the region as a whole) seem to have taken root. Of course, there are few moreconcrete results to be reported. In any case, the idea of clustering as the basic component ofa regional development strategy has become established. Shortly before being abolished,Sudene was in the course of devising a broad strategy for the development of Northeastcentered on clustering. The Rio Grande do Norte state is nowadays implementing its ownversion of the Iniciativa. It may have been a promising starting point. Or not.
B. Banco do Nordeste’s Development Lighthouse. Working independently, andrefusing to use the word cluster, Banco do Nordeste announced in 1998 a much broaderinitiative, under the brand name Development Lighthouse (Farol do Desenvolvimento).According to the bank, Development Lighthouse is an entrepreneurial activity that aims atcreating in each locality a climate favorable to the promotion of its own sustainabledevelopment.
The Farol is present in all municipalities of Northeast, North of Minas Gerais andNorth of Espírito Santo states. It is essentially a regular forum, whose members(representatives of local executive, legislative and judiciary powers, labor unions, publicenterprises, employer associations, religious leaders, NGO, and others) meet at least sixtimes a year, under the leadership of local staff of Banco do Nordeste.
Specific objectives of the Farol include:
• Developing the economic opportunities of each municipality, and contributing tothe enhancement of competitiveness of local producers;
• Contributing to the integration of productive networks relevant to the specificmunicipality;
• Coordinating the joint actions of contiguous municipalities, in order to reachsolutions for shared problems;
• Taking initiatives to establish useful partnerships to solve problems of local ofinfrastructure;
• Developing a view of the future shared by the relevant agents in each municipality.
Although in many cases the above objectives may seem too ambitious, or abstract, theweight of the Bank has been a relevant factor in the achievement of solutions to specificproblems of several municipalities. By putting together people who better know the localworld, the Farol seems to be a very good idea and one that may bring slow but steadybenefits to the communities.
C. BASA’s New Strategy. Since 2000, Bank of the Amazon has worked with IPEA inthe identification of the main clusters in the Region, as well as its problems, potential,obstacles to further development, and the like. On the basis of such knowledge, BASA isalready pursuing a strategy of cluster promotion in the Amazon, in an attempt to foster theRegion’s development. It has been proposed that cluster promotion become a key elementof BASA’s action, especially as it relates to the allocation of FNO funds.
5. Regional Development and the Lula da Silva Government10
As a candidate, Mr. Lula da Silva promised to promote a more balanced regionaldevelopment in his would-be government. It is thus expected that he will stimulate theimplementation of a nation-wide regional development policy, with an eye at promoting thedevelopment of lagged regions, and facilitating their adaptation to a globalized world.Lula’s new regional policy will be negotiated with the States and the Municipalities, and itwill take into high consideration the productive potential of each region, as well as theobstacles to its full development and insertion in the international economy.
Starting from the productive capacity already installed in a region, the new policy willwork for the region’s strengthening. The main objectives and strategies are as follows:
A. Reduction of regional inequalities. Equity is the key word here. That principlewill translate into a tireless fight for reducing the inequalities of income among regions, foropening up new economic opportunities for lagged regions, and for improving the workingconditions all over the country.
B. Efficiency and Competitiveness. Designing mechanisms to orient public andprivate investment decisions toward reaching higher levels of efficiency andcompetitiveness (especially) in less developed regions is to be another fundamentalprinciple of the new regional policy.
C. Territorial fragmentation. For the new government, large economies such as oursare in need of policies capable of combining the internal integrative effort with aprogressive opening to the world market. While some regions are already relatively open to
10 This section follows very closely (in some cases, translate) the chapter on regional developmentpolicy of (then) presidential candidate Luís Inácio Lula da Silva’s program.

external trade, a deliberate effort is in order to avoid that certain areas be kept at themargin, more and more condemned to a state of permanent poverty.
D. Fiscal war among states. The lack of a true regional development policy has pavedthe way for the unhealthy competition between states and, in some cases, evenmunicipalities, known as fiscal war. With the help of the federal government, this currentstate of things will be replaced by the responsible and flexible coordination of state andmunicipal actions, doing away with the fiscal war, without eliminating a certain degree ofhealthy competition among states and municipalities.
E. Concentration of production. The government will stimulate a reduction ofregional concentration of productive assets and of production, by strengthening localspecializations. The new regional policy will deal differently with the various kinds ofregions. A proposed classification is as following: (1) Dynamic Areas (i.e. areas that aredoing well, and whose productive capacity is modern and competitive); (2) Areas UnderRestructuring (i. e. areas which used to be rich and competitive; have been changing theireconomic structure; but still are potentially competitive); (3) Stagnated Areas (areas of loweconomic dynamism); (4) Undeveloped Areas (i.e. areas that have been kept aside of theeconomic development process, and whose potential has to be better known and explored);(5) Borderline Areas (i.e. areas near the country’s Western and Northern borders, thatpresent specific problems and need special attention of the federal government).
F The National Council of Regional Policy. The new government will propose thecreation of a National Council of Regional Policy, and of a National Fund of RegionalDevelopment, the latter conceived of as an instrument that will enable the government toreach the objective of reducing regional inequalities. It will be a statutory responsibility ofthe Council to analyze the regional impacts of sector policies. The new regional policy willbe partly financed by the National Fund, whose administration will be democratized.
6. Concluding RemarksGood news, and bad news. In the pleasant side, there has been convergence of per
capita GDPs among the Brazilian states, although this has not been true for every sub-period between 1947 and 1999. As to the official regions (North, Northeast, Center-West,Southeast, and South), the trend is less clear, the more so because of troublesomeNortheast. All in all, in the last half-century, growth at a reasonable speed has been the rulefor states and regions. Social conditions have also improved everywhere. The bad news isthat disparities, be they economic or social, among regions, states, and municipalitiesremain great. The worn-out expression “the two Brazils” still holds, as anyone can testifylooking at the map with p. c. GDPs of the country’s municipalities: a divide between a richSouth and a poor North is easily seen. And, worse than all this, in the last fifteen years orso, convergence among state p.c. GDPs has stopped, if not been reversed.
The extent to which regional policies have been responsible for the good or bad news,however, is far from clear. No doubt that, in more recent times, regional policy institutionsand instruments were dismantled, and convergence lost speed, or was reversed. Butcausation may be in either way, i.e. from the withdrawal of the state to the end ofconvergence, or from the latter to the former. In any case, little has been left of the oldregional policies. Today’s situation is one of scarcity of resources (especially for vitally

important infrastructure construction); plenty of uncoordinated actions; worsening trends inboth aspects.
There is of course good news too. Bank of Northeast has transformed itself into averitable development agency; and BASA seems to be in the same track. President-electLula da Silva has announced that he will recreate Sudene, and give the institution a strongsupport. For the good or worse, some state governments have achieved success in attractingout-of-state capital and better utilizing their own resources; and, in the Northeast,particularly, new economic poles other than the big state capitals (e.g. Petrolina-Juazeiro,PE/BA; Mossoró-Açu, RN, Barreiras, BA) have reached a sort of Rostowian self-sustainedgrowth, partly as a result of healthy regional development policy initiatives of the past.Regional impacts of globalization are still uncertain but, surely, in this area, there arechallenges, but also opportunities.
(São Paulo, Dec 8, 2002)
PIB per capita 980 a 12481249 a 27052706 a 47694770 a 90000Other