12:00 noon uk time
TRANSCRIPT
Earnings Presentation Third Quarter 2015
11 November 2015
12:00 noon UK time

2 Page
Forward-looking statements
Certain statements made in this announcement may include ‘forward-looking statements’. These statements may be identified by the use of words like ‘anticipate’, ‘believe’, ‘could’, ‘estimate’, ‘expect’, ‘forecast’, ‘intend’, ‘may’, ‘might’, ‘plan’, ‘predict’, ‘project’, ‘scheduled’, ‘seek’, ‘should’, ‘will’, and similar expressions. The forward-looking statements reflect our current views and are subject to risks, uncertainties and assumptions. The principal risks and uncertainties which could impact the Group and the factors which could affect the actual results are described but not limited to those in the ‘Risk Management’ section in the Group’s Annual Report and Consolidated Financial Statements for the year ended 31 December 2014. These factors, and others which are discussed in our public announcements, are among those that may cause actual and future results and trends to differ materially from our forward-looking statements: actions by regulatory authorities or other third parties; our ability to recover costs on significant projects; the general economic conditions and competition in the markets and businesses in which we operate; our relationship with significant clients; the outcome of legal and administrative proceedings or governmental enquiries; uncertainties inherent in operating internationally; the timely delivery of vessels on order; the impact of laws and regulations; and operating hazards, including spills and environmental damage. Many of these factors are beyond our ability to control or predict. Other unknown or unpredictable factors could also have material adverse effects on our future results. Given these factors, you should not place undue reliance on the forward-looking statements.

3 Page
Jean Cahuzac, CEO

4 Page
Q3 2015 highlights
OUTLOOK
FINANCIAL
• Revenue $1.2 billion
• Adjusted EBITDA $351 million
• Adjusted EBITDA Margin 29%
• Diluted EPS of $0.46 per share
• Net cash of $104 million
OPERATIONAL
• Strong project execution
• Significant progress on projects in both hemispheres
• 74% Global vessel utilisation
• Cost reduction and resizing programme on track
• Active fleet reduced to 33 vessels
ORDER IN-TAKE
• Order backlog $6.7 billion
- $0.4 billion adverse foreign exchange movement
• $1.1 billion order intake including:
- West Nile Delta, Egypt
- Culzean, UK - EPRS, Australia
• Challenging business outlook persists
• Timing of market awards remains uncertain
• Positioned well to strengthen through the cycle
• Collaboration with clients to reduce their project costs

5 Page
Business Unit performance overview
Southern Hemisphere and Global Projects
• Significant progress on the T.E.N. project offshore Ghana and Lianzi SURF and Topside projects offshore Angola
• Erha North project substantially completed
• High levels of activity for the PLSVs offshore Brazil
Northern Hemisphere and Life of Field
• Significant progress on Catcher, Mariner and Montrose projects offshore UK
• Aasta Hansteen project offshore Norway progressed well
• Heidelberg project completed in the Gulf of Mexico
• Life of Field activity levels remained low
6 Page
SURF (2) $5.3bn (78%)
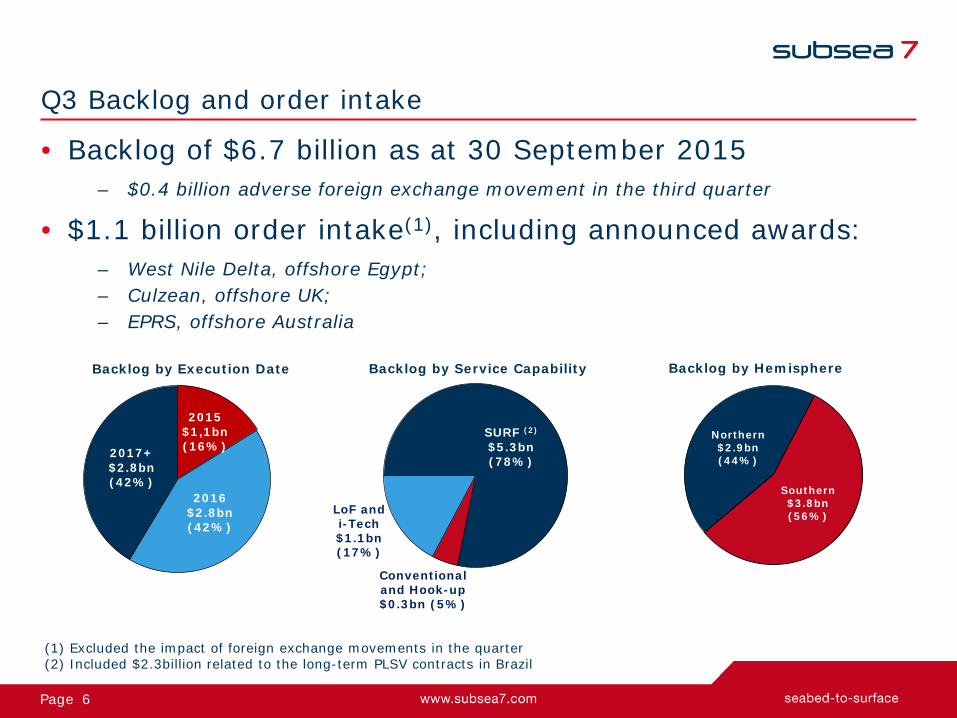
Q3 Backlog and order intake
• Backlog of $6.7 billion as at 30 September 2015 – $0.4 billion adverse foreign exchange movement in the third quarter
• $1.1 billion order intake(1), including announced awards: – West Nile Delta, offshore Egypt; – Culzean, offshore UK; – EPRS, offshore Australia
Backlog by Service Capability Backlog by Hemisphere
Conventional and Hook-up $0.3bn (5%)
(1) Excluded the impact of foreign exchange movements in the quarter (2) Included $2.3billion related to the long-term PLSV contracts in Brazil
LoF and i-Tech $1.1bn (17%)
2015 $1,1bn (16%)
2016 $2.8bn (42%)
2017+ $2.8bn (42%)
Backlog by Execution Date
Northern $2.9bn (44%)
Southern $3.8bn (56%)

7 Page
Ricardo Rosa, CFO
8 Page
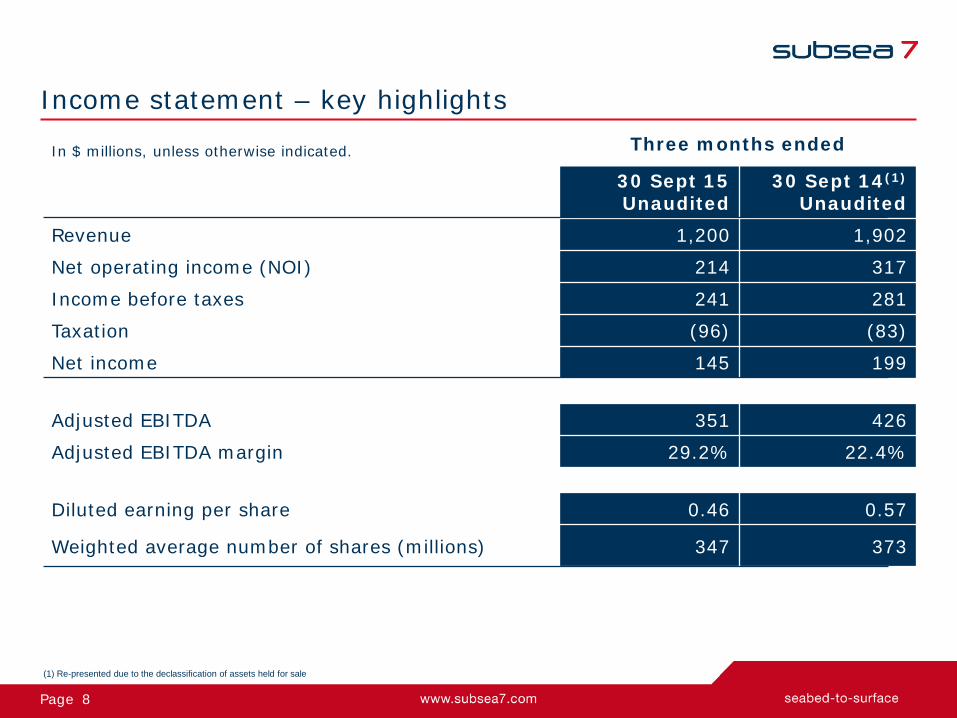
Income statement – key highlights
In $ millions, unless otherwise indicated. Three months ended
30 Sept 15 Unaudited
30 Sept 14(1)
Unaudited Revenue 1,200 1,902
Net operating income (NOI) 214 317
Income before taxes 241 281
Taxation (96) (83)
Net income 145 199
Adjusted EBITDA 351 426
Adjusted EBITDA margin 29.2% 22.4%
Diluted earning per share 0.46 0.57
Weighted average number of shares (millions) 347 373
(1) Re-presented due to the declassification of assets held for sale

9 Page
Income statement – supplementary details In $ millions Three months ended
30 Sept 15 Unaudited
30 Sept 14 (1)
Unaudited
Administrative expenses (89) (86)
Share of net income of associates and joint ventures 33 24
Depreciation and amortisation (100) (109)
Impairment of property, plant and equipment (37) -
Net operating income 214 317 Net finance income/(costs) 2 (2)
Other gains and losses 25 (34)
Income before taxes 241 281 Taxation (96) (83)
Net Income 145 199
Net Income Attributable to:
Shareholders of the parent company 158 207
Non-controlling interests (13) (8)
( 1) Re-presented due to the declassification of assets held for sale

10 Page
Business Unit performance
Note: excludes Corporate segment, which reported revenue of $20 million and a net operating loss of $51 million in Q3 2015 and revenue of $26 million and net operating loss of $108 million for the 9 months ended 30 September 2015
Revenue NOI
$670m
$185m
Southern Hemisphere and Global Projects Q3 2015
Revenue NOI
$510m
Northern Hemisphere and Life of Field Q3 2015
$80m
Revenue NOI
$1,993m
$434m
Southern Hemisphere and Global Projects 9 months to 30 Sep 2015
Revenue NOI
$233m
Northern Hemisphere and Life of Field 9 months to 30 Sep 2015
$1,714m

11 Page
Summary of YTD 2015 cash flow
$ millions
Cash and cash equivalents at 31 Dec 2014 573
Net cash generated from operating activities 628 Decrease of $99 million in net operating liabilities
Net cash flow used in investing activities (487) Included capital expenditure of $548m mainly on new-build vessel programme
Net cash flow used in financing activities (33) Included repurchase of convertible bonds
Other movements (24)
Cash and cash equivalents at 30 Sept 2015 657
• Net cash of $104m as at 30 September 2015 compared to net debt of $6m as at 31 December 2014
• Third quarter net cash generated from operating activities was $409 million, which included a $96 million increase in net operating liabilities
12 Page
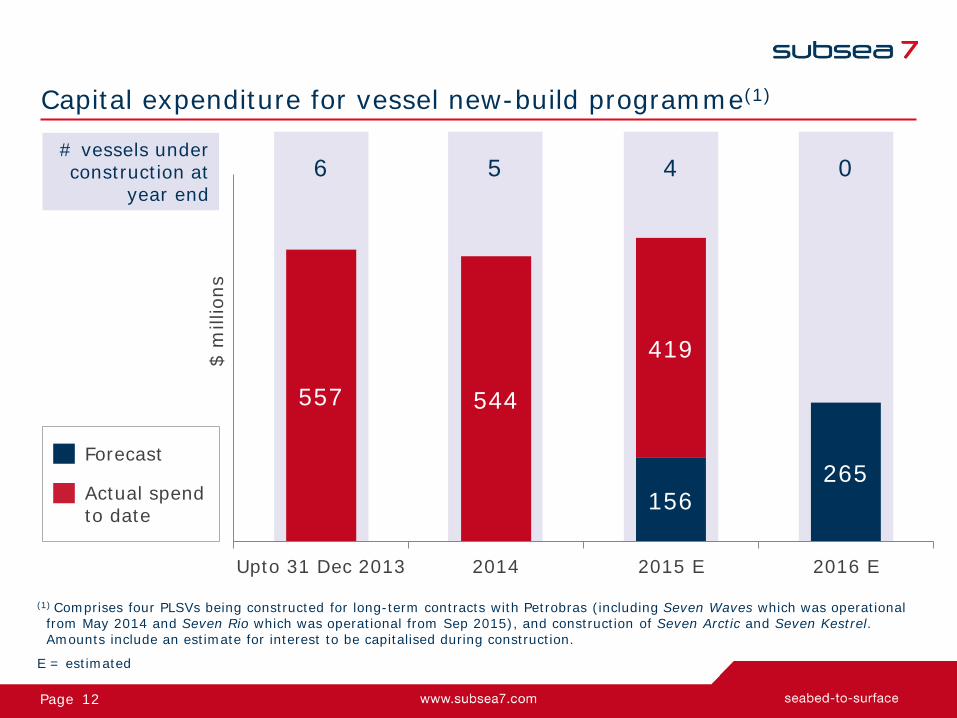
Capital expenditure for vessel new-build programme(1)
(1) Comprises four PLSVs being constructed for long-term contracts with Petrobras (including Seven Waves which was operational from May 2014 and Seven Rio which was operational from Sep 2015), and construction of Seven Arctic and Seven Kestrel. Amounts include an estimate for interest to be capitalised during construction.
E = estimated
# vessels under construction at
year end
156 265
557 544
419
Upto 31 Dec 2013 2014 2015 E 2016 E
6 5 4 0
$ m
illio
ns
Forecast
Actual spend to date
13 Page
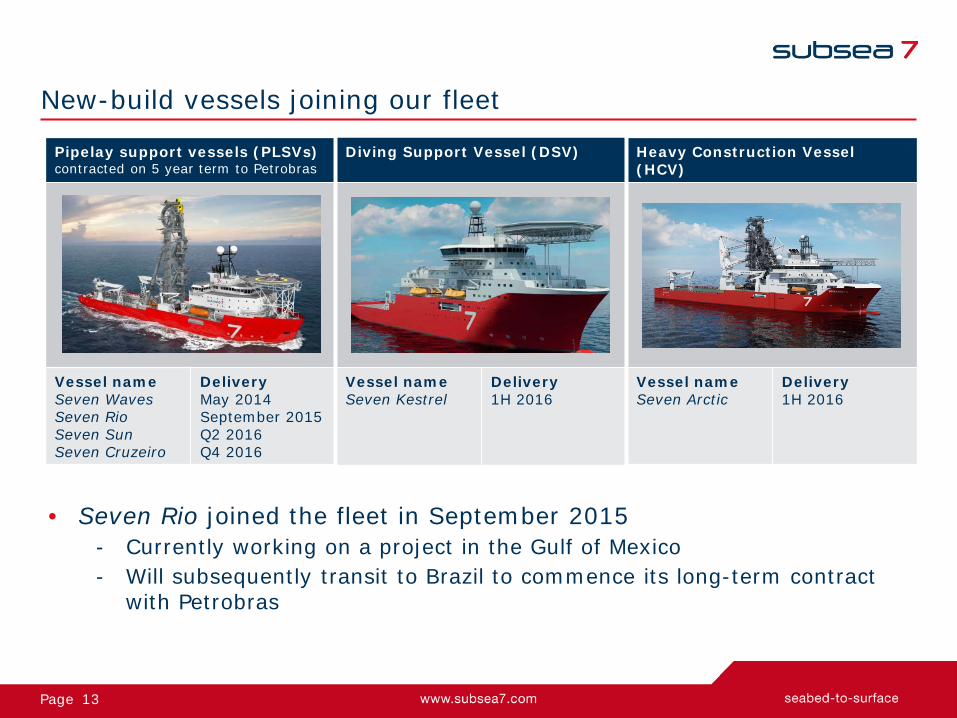
New-build vessels joining our fleet
Pipelay support vessels (PLSVs) contracted on 5 year term to Petrobras
Diving Support Vessel (DSV) Heavy Construction Vessel (HCV)
Vessel name Seven Waves Seven Rio Seven Sun Seven Cruzeiro
Delivery May 2014 September 2015 Q2 2016 Q4 2016
Vessel name Seven Kestrel
Delivery 1H 2016
Vessel name Seven Arctic
Delivery 1H 2016
• Seven Rio joined the fleet in September 2015 - Currently working on a project in the Gulf of Mexico - Will subsequently transit to Brazil to commence its long-term contract
with Petrobras

14 Page
Financial guidance
2015 Guidance
Revenue Significantly lower than 2014 (unchanged)
Adjusted EBITDA percentage margin Higher than 2014
Admin expense $310-330 million - including $40 million resizing charge
Net finance income $5-10 million
Depreciation and Amortisation $410-430 million - excluding impairment charges
Full year effective tax rate 33% - 35%
Total capital expenditure $750-775 million
- new build programme $575 million
- Sustaining capex $175-200 million
2016 Group revenue and Adjusted EBITDA percentage margin expected to decrease significantly compared to 2015
15 Page
Jean Cahuzac, CEO
16 Page
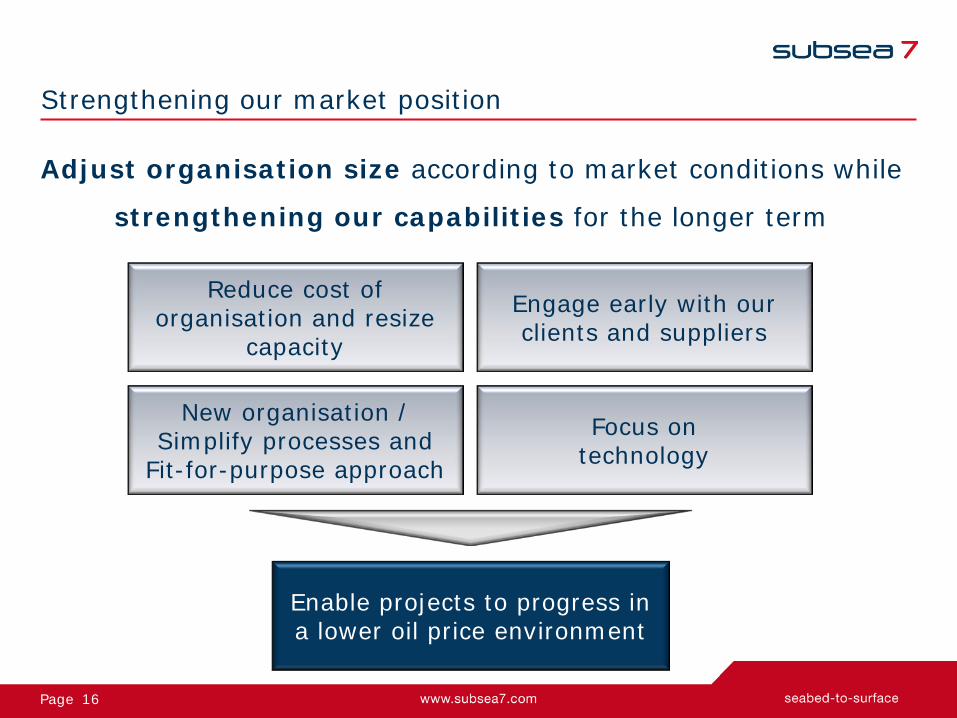
Strengthening our market position
Adjust organisation size according to market conditions while
strengthening our capabilities for the longer term
Focus on technology
Enable projects to progress in a lower oil price environment
Engage early with our clients and suppliers
New organisation / Simplify processes and
Fit-for-purpose approach
Reduce cost of organisation and resize
capacity

17 Page
Cost reduction and resizing programme
• By early 2016: – $550 million of annual savings – 2,500 headcount reduction – 12 vessels identified for release
• 8 owned vessels to be stacked or sold
• 4 charter vessels to be returned
• Progress as at Q3 2015: – Headcount reduction on track – Active fleet reduced to 33 vessels – 6 vessels stacked
• Seven Polaris (to be scrapped)
• Seven Navica • Seven Inagha • Rockwater 1 • Seven Discovery • Seven Petrel
– 1 chartered vessel returned
39 33 32
0
10
20
30
40
50
Q2 2015 Q3 2015 2016 (e)
Total and active vessels
Active fleet Stacked Under construction
Reducing our costs by early 2016
44 43 39
0
5
10
15
Q4 '14 Q1 '15 Q2 '15 Q3 '15 Q4 '15(e)Q1 '16(e)
Headcount ‘000s 13
10.5

18 Page
Strengthening our client relationships
• Agreed to partner with clients longer term to deliver mutual benefits
• Work on a preferred supplier / exclusive basis
• Engage early to develop the right solutions
• Deliver cost effective results
• Enhanced collaboration based on trust and transparency

19 Page
Business Unit outlook Northern Hemisphere and Life of Field • Very limited new opportunities in offshore UK and Norway
• Some activity in the Gulf of Mexico ● Including project tenders for Mad Dog 2 and Hopkins
• Life of Field activity remains low, particularly in the North Sea
Southern Hemisphere and Global Projects • Timing of new awards to market remains uncertain
• Domestic gas projects less impacted by market conditions
• Continuing project tenders include:
Subsea 7 Alliances with KBR/Granherne and OneSubsea • Positive client interest in early engagement opportunities
• Bonga South West • Coral FLNG
• Golfinho • Rotan
• Vashishta • West Nile Delta phase 2

20 Page
Q & A
21 Page
Appendix

22 Page
Our global presence
• Catcher, Premier • Culzean, Maersk • Western Isles, Dana • Montrose, Talisman • Laggan Tormore, Total • West Franklin 2, Total • USC & Pipelay, Shell • Enochdhu, Conoco • LOF Total / Taqa
• Heidelberg, Anadarko • LOF, BP
• PLSVs, Petrobras • Shell BC-10 Ph3
• T.E.N., Tullow (JV Partner) • West Nile Delta, BP • East Nile Delta, Pharonic • Erha North2, Exxon • CLOV, Total • OFON 2, Total • Lianzi Chevron • Block 31, BP
• Al Khalij, Total • Gorgon, Chevron • EPRS, INPEX/Chevron
• Martin Linge, Total • Aasta Hansteen, Statoil • Oseberg Delta, Statoil • Knarr, BG • Maria, Wintershall • LOF, Statoil

23 Page
Major project progression Continuing projects >$100m between 5% and 95% complete as at 30 September 2015 excluding PLSV and Life of Field day-rate contracts
0% 10% 20% 30% 40% 50% 60% 70% 80% 90% 100%
OFON 2 (Nigeria)
Lianzi Surf (Angola)
Montrose (UK)
Clair Ridge (UK)
Martin Linge (Norway)
Lianzi Topside (Angola)
Mariner (UK/Norway)
Western Isles (UK)
SLMP (Norway)
TEN (Ghana)
Aasta Hansteen (Norway)
Catcher (UK)
Stampede (GOM)
Sonamet (Angola)
Southern Hemisphere
Northern Hemisphere
24 Page
Adjusted EBITDA • Adjusted earnings before interest, taxation, depreciation and amortisation (‘Adjusted EBITDA’) is a non-IFRS
measure that represents net income before additional specific items that are considered to impact the comparison of the Group’s performance either period-on-period or with other businesses. The Group defines Adjusted EBITDA as net income adjusted to exclude depreciation, amortisation and mobilisation costs, impairment charges or impairment reversals, finance income, other gains and losses (including gain on disposal of subsidiary and gain on distribution), finance costs and taxation. Adjusted EBITDA margin is defined as Adjusted EBITDA divided by revenue, expressed as a percentage.
• The items excluded from Adjusted EBITDA represent items which are individually or collectively material but which are not considered representative of the performance of the business during the periods presented. Other gains and losses principally relate to disposals of investments, property, plant and equipment and net foreign exchange gains or losses. Impairments of assets represent the excess of the assets’ carrying amount over the amount that is expected to be recovered from their use in the future or their sale.
• Adjusted EBITDA and Adjusted EBITDA margin have not been prepared in accordance with IFRS as adopted by the EU. These measures exclude items that can have a significant effect on the Group’s income or loss and therefore should not be considered as an alternative to, or more meaningful than, net income (as determined in accordance with IFRS) as a measure of the Group’s operating results or cash flows from operations (as determined in accordance with IFRS) as a measure of the Group’s liquidity.
• Management believes that Adjusted EBITDA and Adjusted EBITDA margin are important indicators of the operational strength and the performance of the business. These non-IFRS measures provide management with a meaningful comparative for its Business Units, as they eliminate the effects of financing, depreciation and taxation. Management believes that the presentation of Adjusted EBITDA is also useful as it is similar to measures used by companies within Subsea 7’s peer group and therefore believes it to be a helpful calculation for those evaluating companies within Subsea 7’s industry. Adjusted EBITDA margin may also be a useful ratio to compare performance to its competitors and is widely used by shareholders and analysts following the Group’s performance. Notwithstanding the foregoing, Adjusted EBITDA and Adjusted EBITDA margin as presented by the Group may not be comparable to similarly titled measures reported by other companies.

25 Page
For the period (in $millions) Three Months Ended
30 Sept 2015 Three Months Ended
30 Sept 2014(1)
Net operating income 214 317
Depreciation, amortisation and mobilisation 100 109
Impairment of Property, Plant and Equipment 37 -
Adjusted EBITDA 351 426
Revenue 1,200 1,902
Adjusted EBITDA % 29.2% 22.4%
Reconciliation of Adjusted EBITDA Net operating income to Adjusted EBITDA
For the period (in $millions) Three Months Ended
30 Sept 2015 Three Months Ended
30 Sept 2014(1)
Net income 145 199
Depreciation, amortisation and mobilisation 100 109
Impairment of Property, Plant and Equipment 37 -
Finance income (3) (4)
Other gains and losses (25) 34
Finance costs 1 6
Taxation 96 83
Adjusted EBITDA 351 426
Revenue 1,200 1,902
Adjusted EBITDA % 29.2% 22.4%
Net income to Adjusted EBITDA
(1) Re-presented due to the declassification of assets held for sale
26 Page
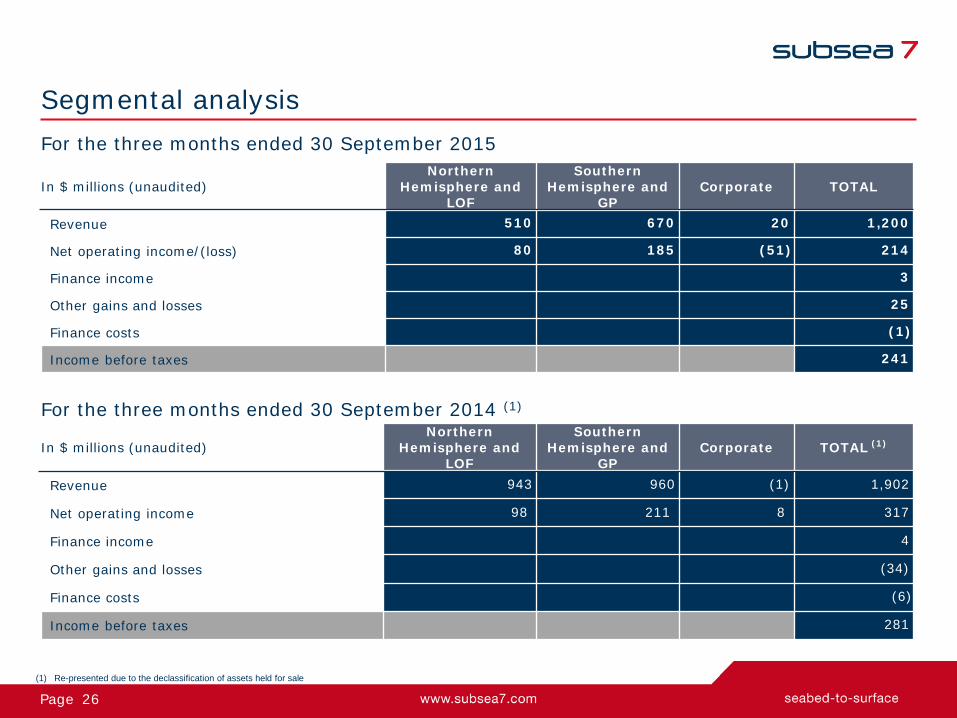
In $ millions (unaudited) Northern
Hemisphere and LOF
Southern Hemisphere and
GP Corporate TOTAL (1)
Revenue 943 960 (1) 1,902
Net operating income 98 211 8 317
Finance income 4
Other gains and losses (34)
Finance costs (6)
Income before taxes 281
In $ millions (unaudited) Northern
Hemisphere and LOF
Southern Hemisphere and
GP Corporate TOTAL
Revenue 510 670 20 1,200
Net operating income/(loss) 80 185 (51) 214
Finance income 3
Other gains and losses 25
Finance costs (1)
Income before taxes 241
Segmental analysis For the three months ended 30 September 2015
For the three months ended 30 September 2014 (1)
(1) Re-presented due to the declassification of assets held for sale
27 Page
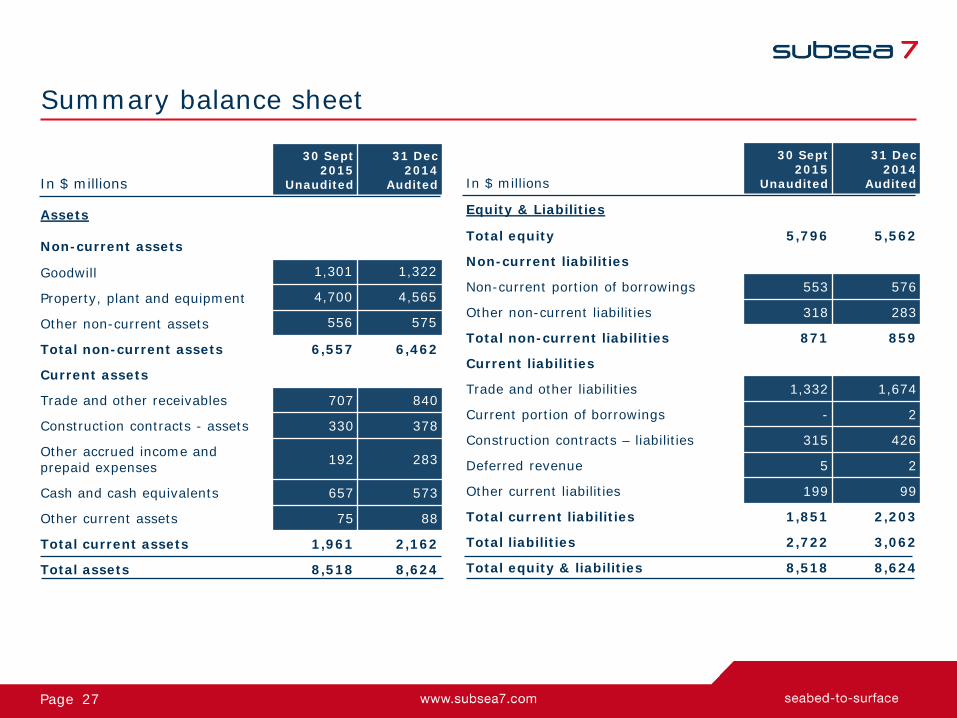
Summary balance sheet
In $ millions
30 Sept 2015
Unaudited
31 Dec 2014
Audited
Assets
Non-current assets
Goodwill 1,301 1,322
Property, plant and equipment 4,700 4,565
Other non-current assets 556 575
Total non-current assets 6,557 6,462
Current assets
Trade and other receivables 707 840
Construction contracts - assets 330 378
Other accrued income and prepaid expenses 192 283
Cash and cash equivalents 657 573
Other current assets 75 88
Total current assets 1,961 2,162
Total assets 8,518 8,624
In $ millions
30 Sept 2015
Unaudited
31 Dec 2014
Audited
Equity & Liabilities
Total equity 5,796 5,562
Non-current liabilities
Non-current portion of borrowings 553 576
Other non-current liabilities 318 283
Total non-current liabilities 871 859
Current liabilities
Trade and other liabilities 1,332 1,674
Current portion of borrowings - 2
Construction contracts – liabilities 315 426
Deferred revenue 5 2
Other current liabilities 199 99
Total current liabilities 1,851 2,203
Total liabilities 2,722 3,062
Total equity & liabilities 8,518 8,624

28 Page
Active fleet management plan
(1) PLSV constructed for long-term contract with Petrobras
2014 2015 2016
Additions Seven Waves(1) (delivered May 2014)
Seven Rio(1)
(delivered Sept 2015) Seven Sun(1)
Seven Cruzeiro(1)
Seven Arctic Seven Kestrel
Removals
Owned to be Stacked /Sold or Scrapped
Seven Osprey Seven Discovery
Rockwater 1 Seven Polaris Seven Navica Seven Inagha Seven Antares Seven Petrel
Chartered to be returned Skandi Seven Havila Subsea
Skandi Neptune
Normand Subsea or Acergy Viking
Year end active fleet 39 30 32
• 33 vessels in the active fleet as at Q3 2015 • 6 owned vessels stacked, 1 vessel returned, 4 under construction

29 Page