2 21 2014 2013 fye results v final
TRANSCRIPT
Earnings Call | February 21, 2014

Cautionary Statement
February 21, 2014 Newmont Mining Corporation 2
Cautionary Statement Regarding Forward Looking Statements, Including Outlook:
This presentation contains “forward-looking statements” within the meaning of Section 27A of the Securities Act of 1933, as amended, and Section
21E of the Securities Exchange Act of 1934, as amended, which are intended to be covered by the safe harbor created by such sections and other
applicable laws. Such forward-looking statements may include, without limitation: (i) estimates of future production and sales; (ii) estimates of
future costs applicable to sales and All-in sustaining costs; (iii) estimates of future consolidated and attributable capital expenditures; (iv) plans and
expectations relating to saving or reductions in costs and expenditures; (v) expectations regarding decisions regarding future exploration or
development projects and the development, growth and exploration potential of the projects; (vi) expectations regarding future dividend payments,
and (vii) expectations regarding the timing and/or likelihood of closing the term loan, future debt repayment and financial flexibility. Forward-looking
statements often include words such as "anticipates," "estimates," "expects," "projects," "intends," "plans," "believes" and words and terms of
similar substance in connection with discussions of future operating or financial performance. Estimates or expectations of future events or results
are based upon certain assumptions, which may prove to be incorrect. Such assumptions, include, but are not limited to: (i) there being no
significant change to current geotechnical, metallurgical, hydrological and other physical conditions; (ii) permitting, development, operations and
expansion of the Company’s projects being consistent with current expectations and mine plans; (iii) political developments in any jurisdiction in
which the Company operates being consistent with its current expectations; (iv) certain exchange rate assumptions for the Australian dollar to the
U.S. dollar, as well as other the exchange rates being approximately consistent with current levels; (v) certain price assumptions for gold, copper
and oil; (vi) prices for key supplies being approximately consistent with current levels; and (vii) the accuracy of our current mineral reserve and
mineral resource estimates. Where the Company expresses or implies an expectation or belief as to future events or results, such expectation or
belief is expressed in good faith and believed to have a reasonable basis. However, such statements are subject to risks, uncertainties and other
factors, which could cause actual results to differ materially from future results expressed, projected or implied by the “forward-looking
statements”. Such risks include, but are not limited to, gold and other metals price volatility, currency fluctuations, increased production costs and
variances in ore grade or recovery rates from those assumed in mining plans, political and operational risks, community relations, conflict
resolution and outcome of projects or oppositions and governmental regulation and judicial outcomes. For a more detailed discussion of such risks
and other factors, see the Company’s 2013 Annual Report on Form 10-K, filed on February 20, 2014, with the Securities and Exchange
Commission, as well as the Company’s other SEC filings. The Company does not undertake any obligation to release publicly revisions to any
“forward-looking statement,” including, without limitation, outlook, to reflect events or circumstances after the date of this presentation, or to reflect
the occurrence of unanticipated events, except as may be required under applicable securities laws. Investors should not assume that any lack of
update to a previously issued “forward-looking statement” constitutes a reaffirmation of that statement. Continued reliance on “forward-looking
statements” is at investors' own risk.

Overview

Serious Injuries
Down 60%
LATFR** Down 45%
TRAFR* Down 28%
2013 total injury rate of 0.47 is the lowest on record
176 people not injured
36 people not off work
9 people not seriously injured
*TRAFR – Total Recordable Accident Frequency Rate (per 200,000 man hours worked)
**LTAFR – Lost Time Accident Frequency Rate (per 200,000 man hours worked)
Safety is our core value
Newmont Mining Corporation 4February 21, 2014

Newmont Mining Corporation 5February 21, 2014
Leveraging strengths to deliver value
Strong asset portfolio
• 70% of production from US, Australia, NZ
Stable production base
• ~5 Moz of consistent gold production
Sharp focus on core competencies
• 90% of revenue generated from gold
• Superior record on safety and sustainability
Continuous cost improvement
• $600M – $700M savings from 2014 – 2016
Clear capital allocation priorities
• Financial flexibility, development and dividends
Top development prospects
• Merian, Long Canyon, Ahafo Mill, Subika
Underground
Head frame for Turf Vent Shaft

Delivering on our commitments
2013 Highlights
• Reduced full year consolidated spending1 by
$966 million or 14% over prior year
accelerating delivery of planned reductions of
$500-750 million
• Reduced All-in sustaining costs2 by 6% over
prior year
• Completed Akyem and Phoenix copper leach
projects on time and on budget
• Increased attributable gold production to 5.1
Moz, at the top end of 2013 Outlook
• Enhanced value of project development and
exploration pipeline through optimization
program
• Divested approximately $600 million in non-
core assets and reduced dividend
Tanami gold pour, Australia
Newmont Mining Corporation 6February 21, 2014

*Consolidated spending excludes stockpile and ore on leach pad write downs
$7.043
$6.077
($9) $702
$235
$29 $9
2012 Consolidated
spending
Costs applicable to
sales
Sustaining Capital
Adv. Proj. & Exploration
Other Expense, net
G&A 2013 Consolidated
spending
Consolidated spending (US$M)
Nearly $1.0 billion in reduced spending in 2013
Down 14% or $966M
Newmont Mining Corporation 7February 21, 2014

5.000
5.100
Guidance
4.8 – 5.1Moz
Akyem & Phoenix delivered
on time and on budget
2013
Met high-end of 2013 outlook (koz)
First Gold Pour at Akyem
Phoenix Copper Leach
Increased attributable gold production in 2013
Newmont Mining Corporation 8
2012
February 21, 2014

Long Canyon +1.0Moz
Tanami +1.1Moz
Notable gold reserve additions
2013 attributable gold proven
and probable reserves (Moz)
Long Canyon
+1.0Moz
Merian
+0.5Moz
Tanami
+1.1Moz
@ 0.065 oz/ton
@ 0.035 oz/ton
@ 0.169 oz/ton
2012 and 2013 gold and copper
reserve grades (oz/ton, %)
0,028
0,030
Au
0,20%0,22%
2012 2013 2012 2013
99,288,4
5,1 2,57,1
6,2
2012 Additions Gold Price Revisions Depletions 2013
2013 gold reserve grades improved 7% over prior year
Newmont Mining Corporation 9February 21, 2014
Cu

Investment pipeline with optionality
February 21, 2014 Newmont Mining Corporation 10
Merian (Suriname)
• Investment decision in 2014
• Estimating 400 – 500 Koz/year
Long Canyon (Nevada)
• Investment decision in 2015
• Estimating ~150Koz/year (Phase 1)
• Estimating ~300Koz/year (Phase 2)
Ahafo Mill Expansion (Ghana)
• Investment decision in 2015
• Estimating ~200 Koz/year
Subika Underground (Ghana)
• Investment decision in 2015
• Estimating ~200 Koz/year
Exploration camp at Merian

Extensive exploration portfolio with long term upside
February 21, 2014 11Newmont Mining Corporation
Maqui Maqui
• Copper Gold sulfide
• Mineralization open
Subika Underground
• Open on strike
• Extension on current
mineralization
Federation (Tanami)
• 250m from existing site
• Mineralization open
• Higher grades
Exodus
• Fast into production
• Mineralization open
Bull Moose
• Fast into production
• Mineralization open
• Underground
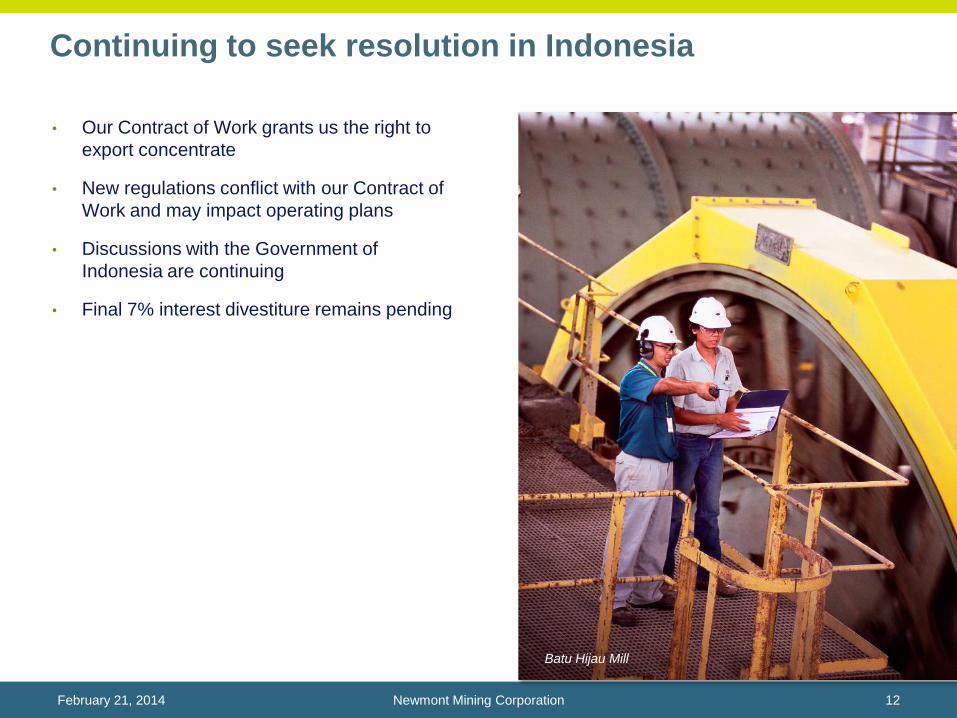
Continuing to seek resolution in Indonesia
Batu Hijau Mill
• Our Contract of Work grants us the right to
export concentrate
• New regulations conflict with our Contract of
Work and may impact operating plans
• Discussions with the Government of
Indonesia are continuing
• Final 7% interest divestiture remains pending
Newmont Mining Corporation 12February 21, 2014

Financial Results
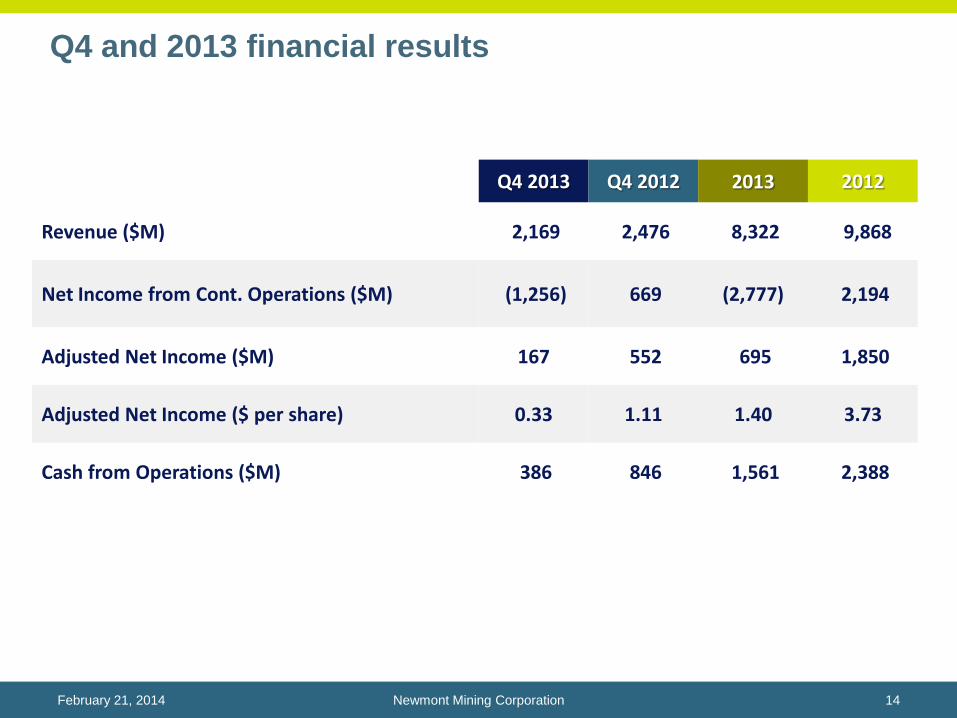
Q4 and 2013 financial results
Q4 2013 Q4 2012 2013 2012
Revenue ($M) 2,169 2,476 8,322 9,868
Net Income from Cont. Operations ($M) (1,256) 669 (2,777) 2,194
Adjusted Net Income ($M) 167 552 695 1,850
Adjusted Net Income ($ per share) 0.33 1.11 1.40 3.73
Cash from Operations ($M) 386 846 1,561 2,388
Newmont Mining Corporation 14February 21, 2014

2013 reported EPS reconciliation to adjusted EPS
US$ per share
Newmont Mining Corporation 15February 21, 2014
$(4,94)
$1.40
$2,51 $1,07 $0,11 $0,61
$0,50
$5.77
$(0.49)
$(0.12)
($6,00)
($5,00)
($4,00)
($3,00)
($2,00)
($1,00)
$0,00
$1,00
$2,00
$3,00
Net income attributable to Newmont stockholders
Income from discontinued operations
Asset Impairments
Tax valuation allowance
Asset Sales Other Adjusted Net Income
NRV Write-down Gold
NRV Write-down Copper
Adjusted Net Income,
excluding NRV Write-
down
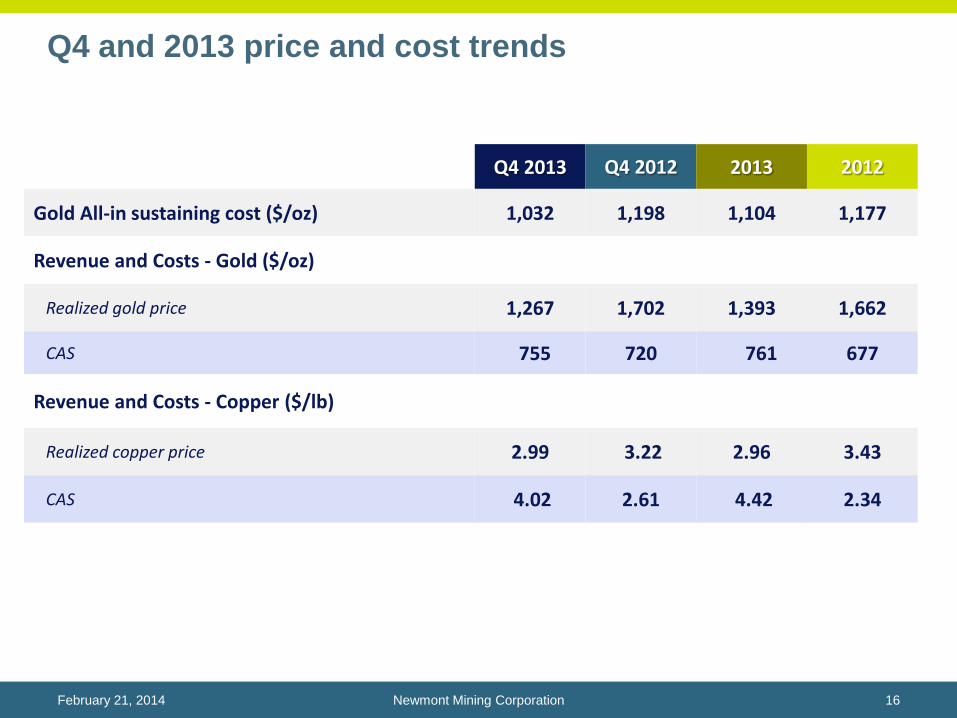
Q4 and 2013 price and cost trends
Q4 2013 Q4 2012 2013 2012
Gold All-in sustaining cost ($/oz) 1,032 1,198 1,104 1,177
Revenue and Costs - Gold ($/oz)
Realized gold price 1,267 1,702 1,393 1,662
CAS 755 720 761 677
Revenue and Costs - Copper ($/lb)
Realized copper price 2.99 3.22 2.96 3.43
CAS 4.02 2.61 4.42 2.34
Newmont Mining Corporation 16February 21, 2014

$672 $675 $636 $642$500 $546
$865 $851
$1.071$927
$596$487
$761$677 $691
$505
$650
$878$966
$2,332
Improving 2013 CAS/ounce net of stockpile write-downs
2012
CAS Net of NRV NRV
2013
Newmont Mining Corporation 17February 21, 2014
Year to date CAS (US$/oz)
Consolidated North America South America Australia / New
Zealand
Indonesia Africa

Disciplined capital allocation
Newmont Mining Corporation 18
Improved financial flexibility
• Year end cash balance of approximately $1.6B, no borrowings on $3B revolver
• Cash from Operations of approximately $1.6B in 2013 and $400M in Q4 2013
• Secured commitments to refinance $575 million of debt due in 2014 with 5-year term loan
• Divested approximately $600 million of non-core assets in 2013, with more possible in 2014
Enhance Portfolio
• Invest in organic projects that meet value and risk criteria
• Evaluate only the most compelling M&A opportunities that are cash flowing and value
accretive
Return cash to shareholders
• Modified dividend policy, reducing payout levels to align with market conditions
• Preserves financial flexibility and ability to invest in organic growth
February 21, 2014

Maintaining investment grade rated balance sheet
Scheduled debt repayments ($M)
Newmont Mining Corporation 19February 21, 2014
$-$0,10
$0,20
$0,40
$0,60
$0,80
$1,00
$1,20
$1,40
$1,60 Annualized dividend per share ($)4
For every $100/oz change in gold price
over $1,300/oz the annual dividend
increases $0.20
$10 $10 $24
$623
$72
$1.346$1.500
$600
$1.100$1.000
2014 2015 2016 2017 2018 2019 Column1 Column2 2022 Column3 2035 2039 2042/\/\/\/
3

Operating Results

1.960 1.951
'12 '13
$691
$964
'12 '13
526557
Q4 '12 Q4 '13
Attributable Production
(koz)
$596
$764
$898
$965
Q4 '12 Q4 '13
All-in Sustaining
Cost ($/oz)• Delivered strong 2013 production from
Carlin and Phoenix
• Controlling costs - CAS exclusive of
write-downs at $642 for 2013
• Phoenix Copper Leach commercial
production in Q4; 15-25kt expected
annually for 2014-2016
$1,053
Phoenix
$636
Newmont Mining Corporation 21February 21, 2014
North America: Reduced AISC by 8%
CAS CAS
CAS CAS

744
588
'12 '13
$505
$650
'12 '13
134
111
Q4 '12 Q4 '13
Attributable Production
(koz)
$617
$833
Q4 '12 Q4 '13
All-in Sustaining
Cost ($/oz)
$1,098
• Lower grade ore processed in 2013 led to
lower year over year production
• CAS exclusive of write-downs at $546 for
2013
• Verde Bioleach testing ongoing
$1,370$1,317
$1,032
Yanacocha
Newmont Mining Corporation 22February 21, 2014
South America: Held costs with maturing assets
CAS CAS
CAS CAS

561
699
'12 '13
$596
$487
'12 '13
123
291
Q4 '12 Q4 '13
Attributable Production
(koz)
$694
$393
Q4 '12 Q4 '13
All-in Sustaining
Cost ($/oz)
$973
Akyem
$1,133
$510
$790
• Produced 129,000 ounces of gold in first
quarter of production at Akyem
• Reduced CAS by 18% from prior year
• 2014 attributable production outlook of
785 to 850Koz, up 17% from 2013
Newmont Mining Corporation 23February 21, 2014
Africa: Akyem delivered on time and on budget
CAS CAS
CAS CAS

33
23
'12 '13 '12 '13
7
6
Q4 '12 Q4 '13
Attributable gold
production (koz)
Q4 '12 Q4 '13
All-in Sustaining
Cost ($/oz)
$1,687
$1,947
$2,804
16
22
Q4 '12 Q4 '13
Attributable copper
production (Mlb)
$2,77
$4,36
Q4 '12 Q4 '13
CAS ($/lb)
76 78
'12 '13
$2,36
$5,17
'12 '13
Gold Copper
$2,385
$1,292
$1,946
$1,071
$2,332
Newmont Mining Corporation 24February 21, 2014
Indonesia: Progressed Phase 6 stripping campaign
CAS CAS
CAS CAS
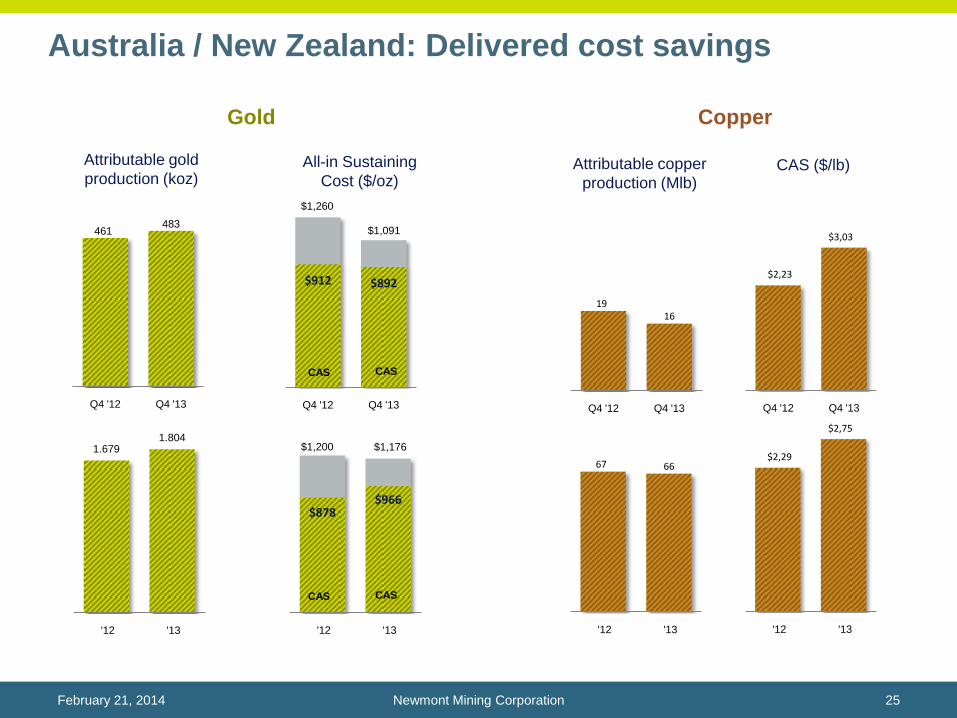
$2,29
$2,75
'12 '13
67 66
'12 '13
1.6791.804
'12 '13
$878 $966
'12 '13
461483
Q4 '12 Q4 '13
Attributable gold
production (koz)
$912 $892
Q4 '12 Q4 '13
All-in Sustaining
Cost ($/oz)
$1,200
$1,260
$1,091
$1,176
1916
Q4 '12 Q4 '13
Attributable copper
production (Mlb)
$2,23
$3,03
Q4 '12 Q4 '13
CAS ($/lb)
Newmont Mining Corporation 25February 21, 2014
Australia / New Zealand: Delivered cost savings
Gold Copper
CAS CAS
CAS CAS

2014-2016 Outlook

Gold production recovers in 2015 and 2016
2014 2015 2016
Attributable gold production outlook5
(Moz)
4.6 – 4.94.8 – 5.2 4.8 – 5.2
North America
• Increasing with higher grades
Australia/New Zealand
• Stable across most of portfolio
Africa
• Steady at Aykem, stabilizing at Ahafo
South America
• Declining as assets mature
Indonesia
• Increasing as we reach primary ore
Newmont Mining Corporation Slide 27February 21, 2014

Copper production increases at Batu Hijau
2014 2015 2016
Attributable copper production outlook (Kt)
95 – 110
145 – 160
125 – 140
North America
• Steady production at Phoenix
Australia/New Zealand
• Stable at Boddington
Indonesia
• Return to primary ore from Phase 6
Newmont Mining Corporation Slide 28February 21, 2014

All-in sustaining cost outlook stable over three years
Newmont Mining Corporation 29
$1,075 –$1,175
$950 – $1,050$985 – $1,085
2014 2015 2016
Outlook Inflation
Gold All-in sustaining cost outlook (US$M)
February 21, 2014
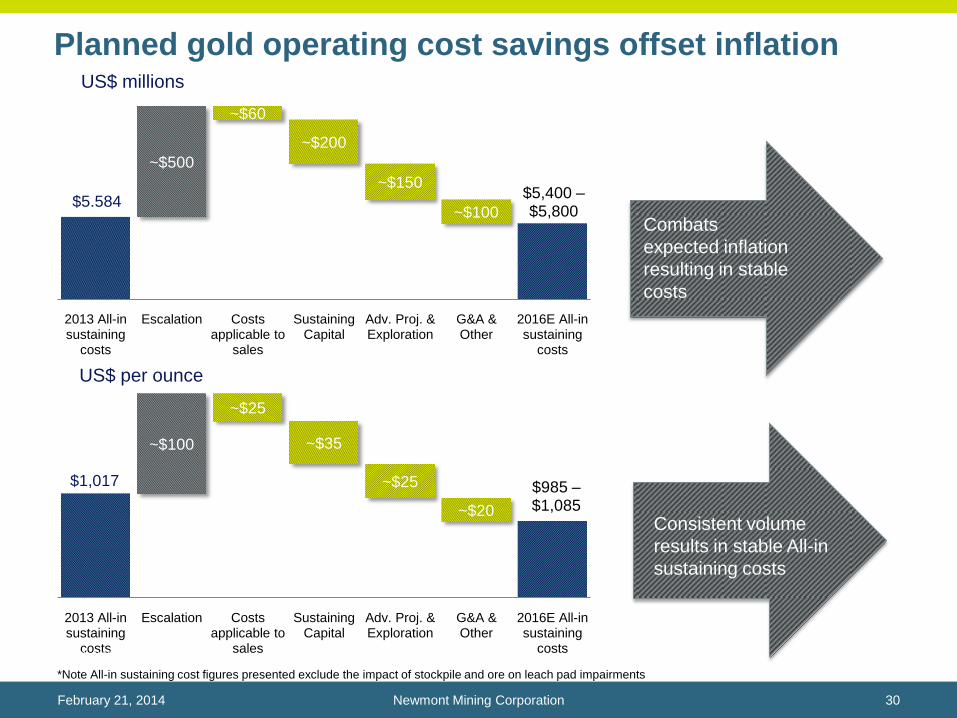
$1,017 $985 –$1,085
~$100
~$25
~$35
~$25
~$20
2013 All-in sustaining
costs
Escalation Costs applicable to
sales
Sustaining Capital
Adv. Proj. & Exploration
G&A & Other
2016E All-in sustaining
costs
US$ per ounce
Planned gold operating cost savings offset inflation
Boddington, Australia
Newmont Mining Corporation 30February 21, 2014
$5.584$5,400 –$5,800
~$500
~$60
~$200
~$150
~$100
2013 All-in sustaining
costs
Escalation Costs applicable to
sales
Sustaining Capital
Adv. Proj. & Exploration
G&A & Other
2016E All-in sustaining
costs
US$ millions
Consistent volume
results in stable All-in
sustaining costs
Combats
expected inflation
resulting in stable
costs
*Note All-in sustaining cost figures presented exclude the impact of stockpile and ore on leach pad impairments

$742
$975 –$1,075
~$70
~$200~$15 ~$10 ~$15
2013 All-in sustaining
costs
Escalation Volume Sustaining Capital
Adv. Proj. & Exploration
G&A & Other
2016E All-in sustaining
costs
$3,24
$1.85 – $2.05
~$0.30~$1.00
~$0.30~$0.05
~$0.25
2013 All-in sustaining
costs
Escalation Volume Sustaining Capital
Adv. Proj. & Exploration
G&A & Other
2016E All-in sustaining
costs
Improving copper output with additional cost savings
Boddington, Australia
Newmont Mining Corporation 31February 21, 2014
US$ per pound
US$ millions
Costs
increase
due to
incremental
volume
increase
Per unit
costs are
reduced on
increased
volume and
further cost
savings
*Note All-in sustaining cost figures presented exclude the impact of stockpile and ore on leach pad impairments

Total capital spending to decline ~30% from 2014
2014 2015 2016
Australia / New Zealand
Indonesia
Africa
South America
North America
Consolidated capital expenditure outlook (US$M)
$1,300 - $1,400
$1,000 - $1,100
$900 - $1,000
Newmont Mining Corporation 32February 21, 2014
*Excluding future investment opportunities

Boddington, Australia
Newmont Mining Corporation 33February 21, 2014
Vision for the future
• Business positioned to capture benefits of
economic recovery and demand growth
• Portfolio of longer-life, lower-cost assets
• Steady production profile
• Ongoing cost and capital discipline
• Investment grade balance sheet and financial
flexibility
• Stronger growth pipeline
• Compelling shareholder value
Twin Creeks
Questions

Appendix

a The outlook ranges presented herein represent forward looking statements, which are subject to certain risks and uncertainties. See cautionary statement on page
b All-in sustaining cost (“AISC”) is a non-GAAP metric defined as the sum of cost applicable to sales (including all direct and indirect costs related to current gold production incurred to
execute on the current mine plan), remediation costs (including operating accretion and amortization of asset retirement costs), G&A, exploration expense, advanced projects and R&D,
treatment and refining costs, other expense, net of one-time adjustments and sustaining capital. Note that the Company has updated this metric to now include treatment and refining
costs.
2012 2013 2014 2015 2016
Actual Actual Outlook Outlook Outlook
Gold (Attributable Moz)5.0 5.1 4.6 – 4.9 4.8 – 5.2 4.8 – 5.2
Gold (Consolidated Moz)5.6 5.5 5.0 – 5.4 5.6 – 6.0 5.4 – 5.7
Gold CAS ($/oz)$677 $761 $740 - $790 $690 - $740 $740 - $790
Gold AISC ($/oz)$1,177 $1,104 $1,075 - $1,175 $950 - $1,050 $985 - $1,085
Copper (Attributable kt)65 65 95 - 110 145 - 160 125 – 140
Copper (Consolidated kt)102 103 160 – 175 275 – 300 225 – 240
Copper CAS ($/lb)$2.34 $4.42 $2.00 - $2.25 $1.20 - $1.45 $1.40 - $1.65
Copper AISC ($/lb)n/a n/a $2.75 - $2.95 $1.60 - $1.85 $1.80 - $2.05
Newmont Mining Corporation 36February 21, 2014
2014 – 2016 Outlook as of January 30, 2014

Newmont has worked to develop a metric that expands on GAAP measures such as cost of goods sold and non-GAAP measures to provide visibility into the economics of our gold mining operations related to
expenditures, operating performance and the ability to generate cash flow from operations.
Current GAAP-measures used in the gold industry, such as cost of goods sold, do not capture all of the expenditures incurred to discover, develop, and sustain gold production. Therefore, we believe that All-in
sustaining costs and attributable All-in sustaining costs are non-GAAP measures that provide additional information to management, investors, and analysts that aid in the understanding of the economics of our
operations and performance compared to other gold producers and in the investor’s visibility by better defining the total costs associated with producing gold.
All-in sustaining cost (“AISC”) amounts are intended to provide additional information only and do not have any standardized meaning prescribed by GAAP and should not be considered in isolation or as a
substitute for measures of performance prepared in accordance with GAAP. The measures are not necessarily indicative of operating profit or cash flow from operations as determined under GAAP. Other
companies may calculate these measures differently as a result of differences in the underlying accounting principles, policies applied and in accounting frameworks such as in International Financial Reporting
Standards (“IFRS”), or by reflecting the benefit from selling non-gold metals as a reduction to AISC. Differences may also arise related to definitional differences of sustaining versus development capital activities
based upon each company’s internal policies.
The following disclosure provides information regarding the adjustments made in determining the All-in sustaining costs measure:
Cost Applicable to Sales - Includes all direct and indirect costs related to current gold production incurred to execute the current mine plan. Costs applicable to sales (“CAS”) included by-product credits from
certain metals obtained during the process of extracting and processing the primary ore-body. CAS is accounted for on an accrual basis and excludes Amortization and Reclamation and remediation, which is
consistent with our presentation of CAS on the Statement of Consolidated Income. In determining All-in sustaining costs, only the CAS associated with producing and selling an ounce of gold is included in the
measure. Therefore, the amount of gold CAS included in AISC is derived from the CAS presented in the Company’s Statement of Consolidated Income less the amount of CAS attributable to the production of
copper at our Boddington and Batu Hijau mines. The copper CAS at those mine sites is disclosed in Note 3 – Segments that accompanies the Consolidated Financial Statements in the Company’s form 10-K for
the year ended December 31, 2013, which is expected to be filed on February 20, 2014. The allocation of CAS between gold and copper at the Boddington and Batu Hijau mines is based upon the relative sales
percentage of copper and gold sold during the period.
Remediation Costs - Includes accretion expense related to asset retirement obligations (“ARO”) and the amortization of the related Asset Retirement Cost (“ARC”) for the Company’s operating properties recorded
as an ARC asset. Accretion related to ARO and the amortization of the ARC assets for reclamation and remediation do not reflect annual cash outflows but are calculated in accordance with GAAP. The
accretion and amortization reflect the periodic costs of reclamation and remediation associated with current gold production and are therefore included in the measure. The allocation of these costs to gold and
copper is determined using the same allocation used in the allocation of CAS between gold and copper at the Boddington and Batu Hijau mines.
Advanced Projects and Exploration - Includes incurred expenses related to projects that are designed to increase or enhance current gold production and gold exploration. We note that as current resources are
depleted, exploration and advance projects are necessary for us to replace the depleting reserves or enhance the recovery and processing of the current reserves. As this relates to sustaining our gold
production, and is considered a continuing cost of a mining company, these costs are included in the AISC measure. These costs are derived from the Advanced projects, research and development and
Exploration amounts presented in the Company’s Statement of Consolidated Income less the amount attributable to the production of copper at our Boddington and Batu Hijau mines. The allocation of these costs
to gold and copper is determined using the same allocation used in the allocation of CAS between gold and copper at the Boddington and Batu Hijau mines.
General and Administrative - Includes cost related to administrative tasks not directly related to current gold production, but rather related to support our corporate structure and fulfilling our obligations to operate
as a public company. Including these expenses in the AISC metric provides visibility of the impact that general and administrative activities have on current operations and profitability on a per ounce basis.
Other Expense, net - Includes costs related to regional administration and community development to support current gold production. We exclude certain exceptional or unusual expenses from Other expense,
net, such as restructuring, as these are not indicative to sustaining our current gold operations. Furthermore, this adjustment to Other expense, net is also consistent with the nature of the adjustments made to
Net income (loss) as disclosed in the Company’s non-GAAP financial measure Adjusted net income (loss). The allocation of these costs to gold and copper is determined using the same allocation used in the
allocation of CAS between gold and copper at the Boddington and Batu Hijau mines.
Treatment and Refining Costs - Includes costs paid to smelters for treatment and refining of our concentrates to produce the salable precious metal. These costs are presented net as a reduction of Sales.
Sustaining Capital - We determined sustaining capital as those capital expenditures that are necessary to maintain current gold production and execute the current mine plan. Capital expenditures to develop new
operations, or related to projects at existing operations where these projects will enhance gold production or reserves, are considered development. We determined the breakout of sustaining and development
capital costs based on a systematic review of our project portfolio in light of the nature of each project. Sustaining capital costs are relevant to the AISC metric as these are needed to maintain the Company’s
current gold operations and provide improved transparency related to our ability to finance these expenditures from current operations. The allocation of these costs to gold and copper is determined using the
same allocation used in the allocation of CAS between gold and copper at the Boddington and Batu Hijau mines.
All-in sustaining costs reconciliation
Newmont Mining Corporation 37February 21, 2014
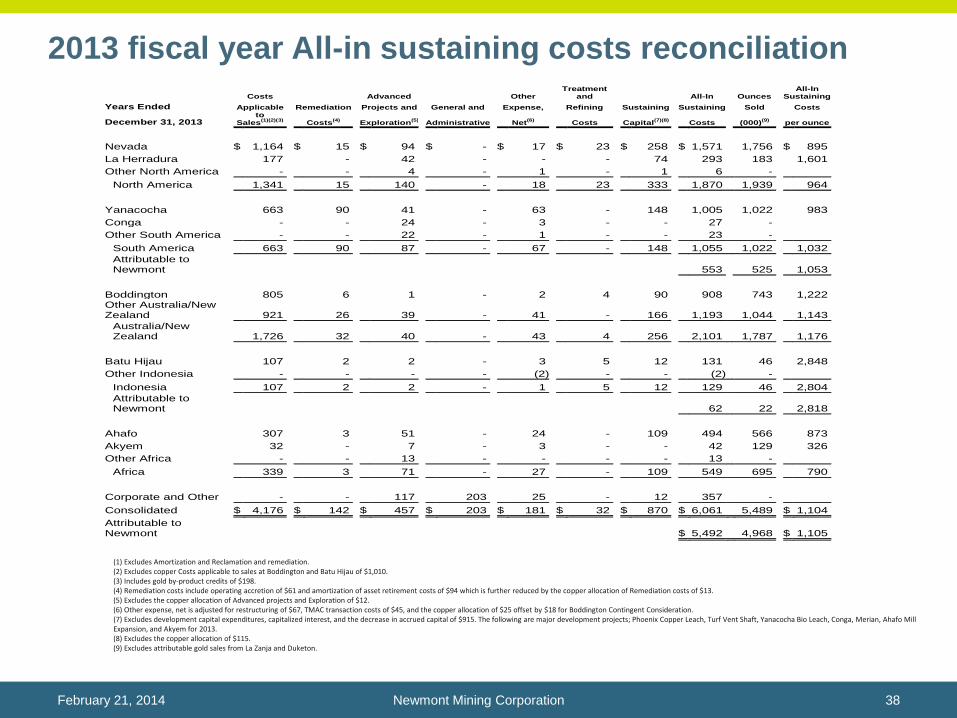
(1) Excludes Amortization and Reclamation and remediation.(2) Excludes copper Costs applicable to sales at Boddington and Batu Hijau of $1,010.(3) Includes gold by-product credits of $198.(4) Remediation costs include operating accretion of $61 and amortization of asset retirement costs of $94 which is further reduced by the copper allocation of Remediation costs of $13.(5) Excludes the copper allocation of Advanced projects and Exploration of $12.(6) Other expense, net is adjusted for restructuring of $67, TMAC transaction costs of $45, and the copper allocation of $25 offset by $18 for Boddington Contingent Consideration.(7) Excludes development capital expenditures, capitalized interest, and the decrease in accrued capital of $915. The following are major development projects; Phoenix Copper Leach, Turf Vent Shaft, Yanacocha Bio Leach, Conga, Merian, Ahafo Mill Expansion, and Akyem for 2013.(8) Excludes the copper allocation of $115.(9) Excludes attributable gold sales from La Zanja and Duketon.
2013 fiscal year All-in sustaining costs reconciliation
Newmont Mining Corporation 38February 21, 2014
Costs Advanced Other Treatment
and All-In Ounces All-In
Sustaining
Years Ended Applicable Remediation Projects and General and Expense, Refining Sustaining Sustaining Sold Costs
December 31, 2013 to
Sales(1)(2)(3)
Costs(4)
Exploration(5)
Administrative Net
(6)
Costs
Capital
(7)(8)
Costs
(000)(9)
per ounce
Nevada $ 1,164 $ 15 $ 94 $ - $ 17 $ 23 $ 258 $ 1,571 1,756 $ 895
La Herradura 177 - 42 - - - 74 293 183 1,601
Other North America - - 4 - 1 - 1 6 -
North America 1,341 15 140 - 18 23 333 1,870 1,939 964
Yanacocha 663 90 41 - 63 - 148 1,005 1,022 983
Conga - - 24 - 3 - - 27 -
Other South America - - 22 - 1 - - 23 -
South America 663 90 87 - 67 - 148 1,055 1,022 1,032
Attributable to Newmont 553 525 1,053
Boddington 805 6 1 - 2 4 90 908 743 1,222 Other Australia/New Zealand 921 26 39 - 41 - 166 1,193 1,044 1,143
Australia/New Zealand 1,726 32 40 - 43 4 256 2,101 1,787 1,176
Batu Hijau 107 2 2 - 3 5 12 131 46 2,848
Other Indonesia - - - - (2) - - (2) -
Indonesia 107 2 2 - 1 5 12 129 46 2,804
Attributable to Newmont 62 22 2,818
Ahafo 307 3 51 - 24 - 109 494 566 873
Akyem 32 - 7 - 3 - - 42 129 326
Other Africa - - 13 - - - - 13 -
Africa 339 3 71 - 27 - 109 549 695 790
Corporate and Other - - 117 203 25 - 12 357 -
Consolidated $ 4,176 $ 142 $ 457 $ 203 $ 181 $ 32 $ 870 $ 6,061 5,489 $ 1,104
Attributable to Newmont $ 5,492 4,968 $ 1,105

Costs Advanced Other Treatment
and All-In Ounces All-In
Sustaining
Years Ended Applicable Remediation Projects and General and Expense, Refining Sustaining Sustaining Sold Costs
December 31, 2012 to
Sales(1)(2)(3)
Costs(4)
Exploration(5)
Administrative Net
(6)
Costs
Capital
(7)(8)
Costs
(000)(9)
per ounce
Nevada $ 1,098 $ 12 $ 138 $ - $ 18 $ 22 $ 499 $ 1,787 1,719 $ 1,040
La Herradura 132 - 41 - - - 71 244 212 1,151
Other North America - - 2 - 1 - - 3 -
North America 1,230 12 181 - 19 22 570 2,034 1,931 1,053
Yanacocha 669 34 59 - 70 - 479 1,311 1,325 989
Conga - - 61 - - - - 61 -
Other South America - - 69 - 4 - 10 83 -
South America 669 34 189 - 74 - 489 1,455 1,325 1,098
Attributable to Newmont 788 681 1,157
Boddington 623 6 6 - 3 7 112 757 711 1,065 Other Australia/New Zealand 796 24 84 - 47 - 231 1,182 905 1,306
Australia/New Zealand 1,419 30 90 - 50 7 343 1,939 1,616 1,200
Batu Hijau 71 2 5 - 8 7 23 116 67 1,731
Other Indonesia - - - - (3) - - (3) -
Indonesia 71 2 5 - 5 7 23 113 67 1,687
Attributable to Newmont 53 32 1,656
Ahafo 314 4 53 - 24 - 85 480 527 911
Akyem - - 19 - 1 - - 20 -
Other Africa - - 12 - 1 - - 13 -
Africa 314 4 84 - 26 - 85 513 527 973
Corporate and Other - - 126 212 18 - 25 381 -
Consolidated $ 3,703 $ 82 $ 675 $ 212 $ 192 $ 36 $ 1,535 $ 6,435 5,466 $ 1,177
Attributable to Newmont $ 5,708 4,787 $ 1,192
(1) Excludes Amortization and Reclamation and remediation.(2) Excludes copper Costs applicable to sales at Boddington and Batu Hijau of $535.(3) Includes gold by-product credits of $231.(4) Remediation costs include operating accretion of $55 and amortization of asset retirement costs of $40 which is further reduced by the copper allocation of Remediation costs of $13.(5) Excludes the copper allocation of Advanced projects and Exploration of $29.(6) Other expense, net is adjusted for restructuring of $58, Hope Bay care and maintenance of $144, Boddington Contingent Consideration of $12, and the copper allocation of $43.(7) Excludes development capital expenditures, capitalized interest, and the decrease in accrued capital of $1,523. The following are major development projects; Emigrant, Phoenix Copper Leach, Turf Vent Shaft, Yanacocha Bio Leach, Conga, Tanami Vent Shaft, Ahafo Mill Expansion, and Akyem for 2012.(8) Excludes the copper allocation of $ 152.(9) Excludes attributable gold sales from La Zanja and Duketon.
2012 fiscal year All-in sustaining costs reconciliation
Newmont Mining Corporation 39February 21, 2014
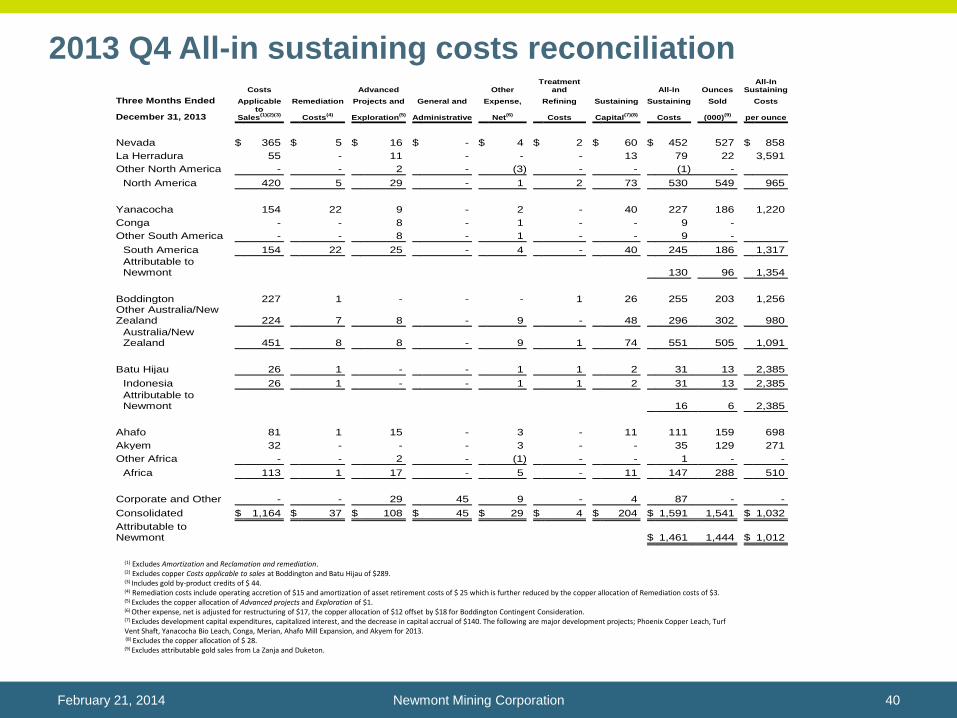
2013 Q4 All-in sustaining costs reconciliation
Newmont Mining Corporation 40February 21, 2014
Costs Advanced Other Treatment
and All-In Ounces All-In
Sustaining
Three Months Ended Applicable Remediation Projects and General and Expense, Refining Sustaining Sustaining Sold Costs
December 31, 2013 to
Sales(1)(2)(3)
Costs(4)
Exploration(5)
Administrative Net
(6)
Costs
Capital
(7)(8)
Costs
(000)(9)
per ounce
Nevada $ 365 $ 5 $ 16 $ - $ 4 $ 2 $ 60 $ 452 527 $ 858
La Herradura 55 - 11 - - - 13 79 22 3,591
Other North America - - 2 - (3) - - (1) -
North America 420 5 29 - 1 2 73 530 549 965
Yanacocha 154 22 9 - 2 - 40 227 186 1,220
Conga - - 8 - 1 - - 9 -
Other South America - - 8 - 1 - - 9 -
South America 154 22 25 - 4 - 40 245 186 1,317
Attributable to Newmont 130 96 1,354
Boddington 227 1 - - - 1 26 255 203 1,256 Other Australia/New Zealand 224 7 8 - 9 - 48 296 302 980
Australia/New Zealand 451 8 8 - 9 1 74 551 505 1,091
Batu Hijau 26 1 - - 1 1 2 31 13 2,385
Indonesia 26 1 - - 1 1 2 31 13 2,385
Attributable to Newmont 16 6 2,385
Ahafo 81 1 15 - 3 - 11 111 159 698
Akyem 32 - - - 3 - - 35 129 271
Other Africa - - 2 - (1) - - 1 - -
Africa 113 1 17 - 5 - 11 147 288 510
Corporate and Other - - 29 45 9 - 4 87 - -
Consolidated $ 1,164 $ 37 $ 108 $ 45 $ 29 $ 4 $ 204 $ 1,591 1,541 $ 1,032
Attributable to Newmont $ 1,461 1,444 $ 1,012
(1) Excludes Amortization and Reclamation and remediation.(2) Excludes copper Costs applicable to sales at Boddington and Batu Hijau of $289.(3) Includes gold by-product credits of $ 44.(4) Remediation costs include operating accretion of $15 and amortization of asset retirement costs of $ 25 which is further reduced by the copper allocation of Remediation costs of $3.(5) Excludes the copper allocation of Advanced projects and Exploration of $1.(6) Other expense, net is adjusted for restructuring of $17, the copper allocation of $12 offset by $18 for Boddington Contingent Consideration.(7) Excludes development capital expenditures, capitalized interest, and the decrease in capital accrual of $140. The following are major development projects; Phoenix Copper Leach, Turf Vent Shaft, Yanacocha Bio Leach, Conga, Merian, Ahafo Mill Expansion, and Akyem for 2013.(8) Excludes the copper allocation of $ 28.(9) Excludes attributable gold sales from La Zanja and Duketon.

2012 Q4 All-in sustaining costs reconciliation
Newmont Mining Corporation 41February 21, 2014
Costs Advanced Other Treatment
and All-In Ounces All-In
Sustaining
Three Months Ended Applicable Remediation Projects and General and Expense, Refining Sustaining Sustaining Sold Costs
December 31, 2012 to
Sales(1)(2)(3)
Costs(4)
Exploration(5)
Administrative Net
(6)
Costs
Capital
(7)(8)
Costs
(000)(9)
per ounce
Nevada $ 281 $ 3 $ 14 $ - $ 1 $ 3 $ 95 $ 397 483 $ 822
La Herradura 36 - 13 - - - 33 82 48 1,708
Other North America - - - - (2) - - (2) -
North America 317 3 27 - (1) 3 128 477 531 898
Yanacocha 146 9 10 - 22 - 104 291 238 1,223
Conga - - 13 - - - - 13 - -
Other South America - - 10 - 2 - 10 22 - -
South America 146 9 33 - 24 - 114 326 238 1,370
Attributable to Newmont 179 123 1,455
Boddington 174 1 - - 1 1 51 228 204 1,118 Other Australia/New Zealand 223 7 18 - 8 - 64 320 231 1,385
Australia/New Zealand 397 8 18 - 9 1 115 548 435 1,260
Batu Hijau 24 - 2 - 2 1 8 37 19 1,947
Indonesia 24 - 2 - 2 1 8 37 19 1,947
Attributable to Newmont 18 9 1,947
Ahafo 73 1 11 - 6 - 19 110 105 1,048
Akyem - - 4 - 1 - - 5 - -
Other Africa - - 4 - - - - 4 - -
Africa 73 1 19 - 7 - 19 119 105 1,133
Corporate and Other - - 29 50 (1) - 6 84 - -
Consolidated $ 957 $ 21 $ 128 $ 50 $ 40 $ 5 $ 390 $ 1,591 1,328 $ 1,198
Noncontrolling interests 166 125 1,328
Attributable to Newmont $ 1,425 1,203 $ 1,185
(1) Excludes Amortization and Reclamation and remediation.(2) Excludes copper Costs applicable to sales at Boddington and Batu Hijau of $174.(3) Includes gold by-product credits of $ 67.(4) Remediation costs include operating accretion of $13 and amortization of asset retirement costs of $ 11 which is further reduced by the copper allocation of Remediation costs of $3.(5) Excludes the copper allocation of Advanced projects and Exploration of $9.(6) Other expense, net is adjusted for Hope Bay Care and Maintenance of $15, restructuring of $10, and the copper allocation of $7 .(7) Excludes development capital expenditures, capitalized interest, and the decrease in capital accrual of $373. The following are major development projects; Emigrant, Phoenix Copper Leach, Turf Vent Shaft, Yanacocha Bio Leach, Conga, Tanami Vent Shaft, Ahafo Mill Expansion, and Akyem for 2012.(8) Excludes the copper allocation of $ 53.(9) Excludes attributable gold sales from La Zanja and Duketon.

Consolidated spending reconciliation
Newmont Mining Corporation 42February 21, 2014
Consolidated Spending ($M) Three Months Ended
December 31,
Year Ended December 31,
2013
2012
2013
2012
Costs applicable to sales $ 1,454
$ 1,131
$ 5,186
$ 4,238
CAS inventory related write-downs (348)
(7)
(972)
(33)
Advanced projects, research and development and Exploration 109
137
469
704
General and administrative 45
50
203
212
Other expense, net (1)
35
47
206
235
Sustaining capital 231
444
985
1,687
Consolidated Spending $ 1,526
$ 1,802
$ 6,077
$ 7,043
(1) Other expense, net is adjusted for restructuring of $67, TMAC transaction costs of $45, and Boddington contingent consideration of ($18) for 2013; 2012 other expense, net is adjusted for Hope Bay care and maintenance of $144, restructuring costs of $58, and Boddington contingent consideration of $12.

Three Months Ended December
31,
Years Ended December 31,
2013
2012 2013 2012
Net income (loss) attributable to Newmont stockholders $ (1,166) $ 673 $ (2,462) $ 1,809
Loss (income) from discontinued operations
(8) (28) (61) 76
Impairments
1,345 42 2,875 80
Tax valuation allowance
- - 535 -
Asset Sales
(3) (82) (246) (90)
TMAC transaction costs
- - 30 -
Boddington contingent consideration
(12) - (12) 8
Restructuring and other
11 6 36 26
Income tax benefit from internal restructuring
- (59) - (59)
Adjusted net income (loss) $ 167 $ 552 $ 695 $ 1,850
Adjusted net income (loss) per share, basic $ 0.33 $ 1.11 $ 1.40 $ 3.73
Adjusted net income (loss) per share, diluted $ 0.33 $ 1.11 $ 1.40 $ 3.71
Adjusted net income reconciliation
Newmont Mining Corporation 43February 21, 2014

Investors are encouraged to read the information contained in this presentation in conjunction with the following notes footnotes, the Cautionary
Statement on slide 2 and the factors described under the “Risk Factors” section of the Company’s most recent Form 10-K, filed with the SEC on
February 20, 2014.
1. Non-GAAP metric. See page 42 for reconciliation.
2. All-in sustaining cost is a non-GAAP metric. See pages 37 to 41 for more information and a reconciliation to the nearest GAAP metric.
3. Subject to negotiation of final documentation of term loan and satisfaction of customary closing conditions.
4. The declaration and payment of dividends remains at the discretion of the Board of Directors and will depend on the Company's financial results,
cash requirements, future prospects and other factors deemed relevant by the Board.
5. 2014 - 2016 Outlook projections used in this presentation (“Outlook”) are considered “forward-looking statements” and represent management’s
good faith estimates or expectations of future production results as of January 30, 2014 and are based upon certain assumptions, including, but not
limited to, metal prices, oil prices, Australian dollar exchange rate, and those set forth on slide 2. Consequently, Outlook cannot be guaranteed.
Investors are cautioned that the Company does not undertake to subsequently reaffirm, provide comfort or otherwise update Outlook to reflect
events or circumstances after the date hereof or to reflect the occurrence of unanticipated events. Investors should not assume that any lack of
update constitutes a current reaffirmation of Outlook. See slide 36 Outlook table.
Endnotes
Newmont Mining Corporation 44February 21, 2014