2. fy2021 financial forecast 3. update of mid-term
TRANSCRIPT


3. Update of Mid-Term Business Plan “Small but Beautiful”
2
1. FY2020 Financial Results
2. FY2021 Financial Forecast

FY2020 Sales Volume Results (vs. FY2019)
3
Retail sales
(000 units)
FY2019(APR 2019-MAR 2020)
FY2020(APR 2020–MAR 2021)
Regarding retail sales in China, we changed the calculation method for retail
sales volume from FY2019. As a result, retail sales recorded in FY2019 may
include retail sales recorded in or before FY2018.
GLOBAL -326 (-29%)
ASEAN -101 (-35%)
Australia/NZ -16 (-18%)
Japan -22 (-23%)
China, others -38 (-27%)
North America -47 (-29%)
Europe -71 (-33%)
Latin America, Middle
East/Africa, etc.-31 (-23%)

* Net income attributable to owners of the parent
FY2020 Financial Results Summary (vs. FY2019)
4
(Billion yen, 000 units)
2,270.3 1,455.5 -814.8 229.5 345.4 377.9 502.7
12.8(0.6%)
-95.3 -108.1 -53.3 -29.3 -4.1 -8.6
-3.8 -105.2 -101.4 -58.7 -28.3 -5.9 -12.3
-25.8 -312.3 -286.5 -176.2 -33.7 -34.1 -68.3
-82.8 -178.8 -96.0 -211.5 8.5 33.8 -9.6
1,127 801 -326 139 212 218 232

FY2019 (APR 2019–
MAR 2020)
FY2020(APR 2020–
MAR 2021)
(billion yen)
FY2020 Operating Profit Variance (vs. FY2019)
5
Others ForexVolumeSales
Expenses
Cost
Reduction,
etc.
Mix
/Selling
Price
Structural
ReformsR&D
FX rate (Yen) Effect(bill yen)FY2019 FY2020
USD 109 105 -6.0
EUR 121 124 +2.1
THB 3.52 3.41 +6.9
AUD 75 77 +3.0
RUB 1.69 1.39 -2.2
Others - - -0.1
Japan -2.3
ASEAN -51.4
China, others -5.3
North America -20.0
Europe -28.4
Australia/NZ -2.7
Others -17.5
Increase in
procurement
cost
-17.2
Factory
expenses -5.0
Aftersales -11.8
Quality cost,
etc.-12.8
Indirect
labor cost+15.8
Depreciation +13.7
G&A
expenses,
etc.
+6.1
(billion yen)
4Q/FY2019 (JAN–MAR 2020)
4Q/FY2020(JAN–MAR 2021)
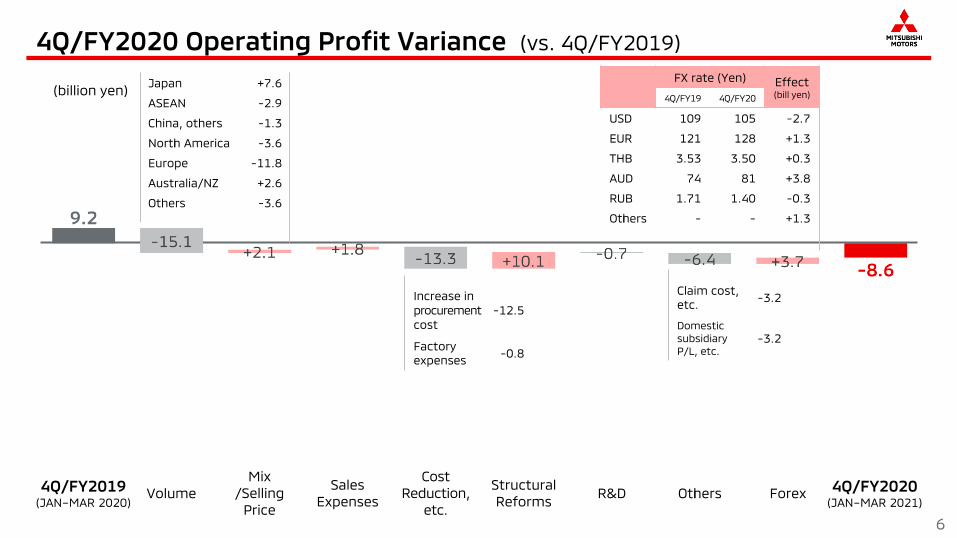
4Q/FY2020 Operating Profit Variance (vs. 4Q/FY2019)
6
Others ForexVolumeSales
Expenses
Cost
Reduction,
etc.
Mix
/Selling
Price
Structural
ReformsR&D
Japan +7.6
ASEAN -2.9
China, others -1.3
North America -3.6
Europe -11.8
Australia/NZ +2.6
Others -3.6
Increase in
procurement
cost
-12.5
Factory
expenses -0.8
Claim cost,
etc.-3.2
Domestic
subsidiary
P/L, etc.
-3.2
FX rate (Yen) Effect(bill yen)4Q/FY19 4Q/FY20
USD 109 105 -2.7
EUR 121 128 +1.3
THB 3.53 3.50 +0.3
AUD 74 81 +3.8
RUB 1.71 1.40 -0.3
Others - - +1.3
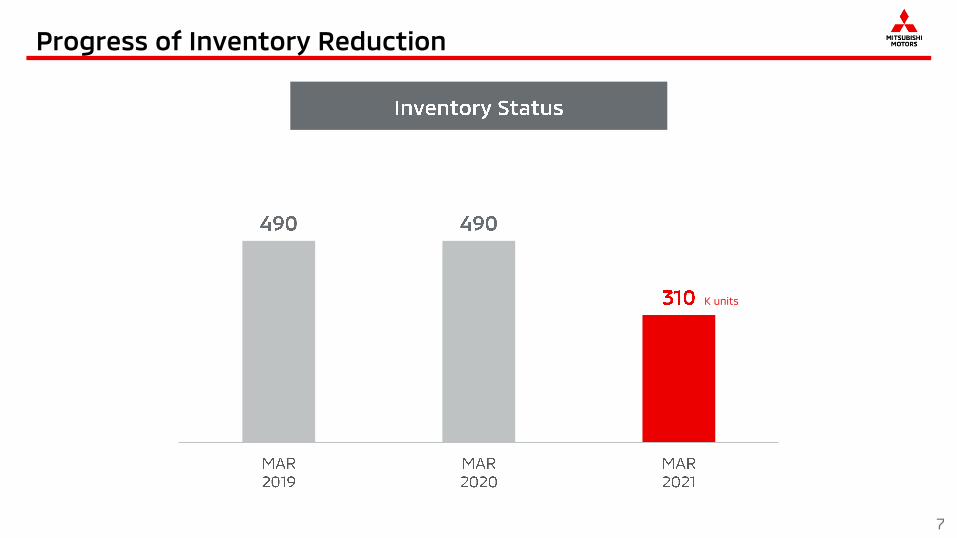
Progress of Inventory Reduction
7
K units
3. Update of Mid-Term Business Plan “Small but Beautiful”
8
1. FY2020 Financial Results
2. FY2021 Financial Forecast
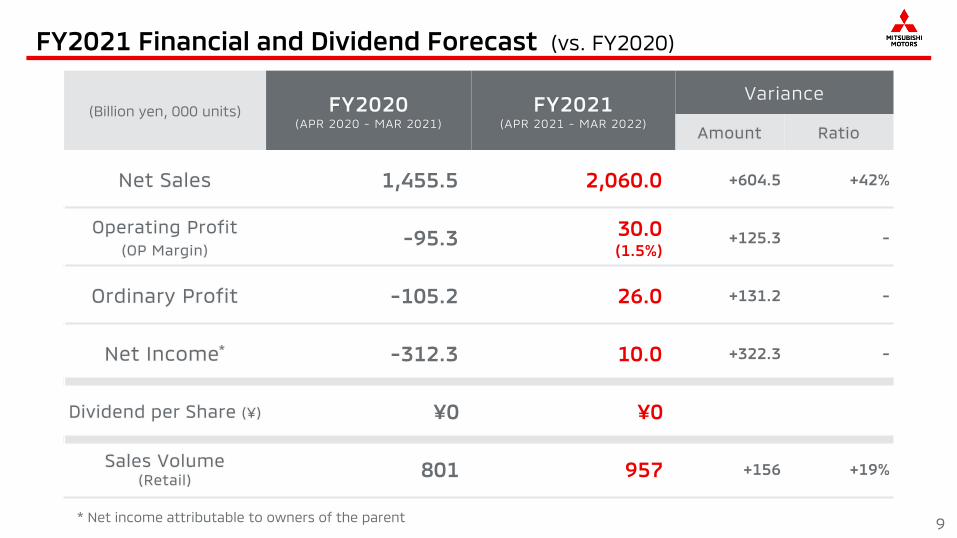
* Net income attributable to owners of the parent
FY2021 Financial and Dividend Forecast (vs. FY2020)
9
(Billion yen, 000 units)
1,455.5 2,060.0 +604.5 +42%
-95.3 30.0(1.5%)
+125.3 -
-105.2 26.0 +131.2 -
-312.3 10.0 +322.3 -
¥0 ¥0
801 957 +156 +19%

FY2021 Sales Volume Forecast (vs. FY2020)
10
Retail sales
(000 units)
FY2020(APR 2020-MAR 2021)
FY2021(APR 2021–MAR 2022)
GLOBAL +156 (+19%)
ASEAN +88 (+47%)
Australia/NZ +19 (+26%)
Japan +21 (+29%)
China, others -5 (-5%)
North America +41 (+36%)
Europe -20 (-14%)
Latin America, Middle
East/Africa, etc.+12 (+11%)
FY2020
Actual (APR 2020–MAR 2021)
FY2021
Forecast(APR 2021–MAR 2022)
(billion yen)
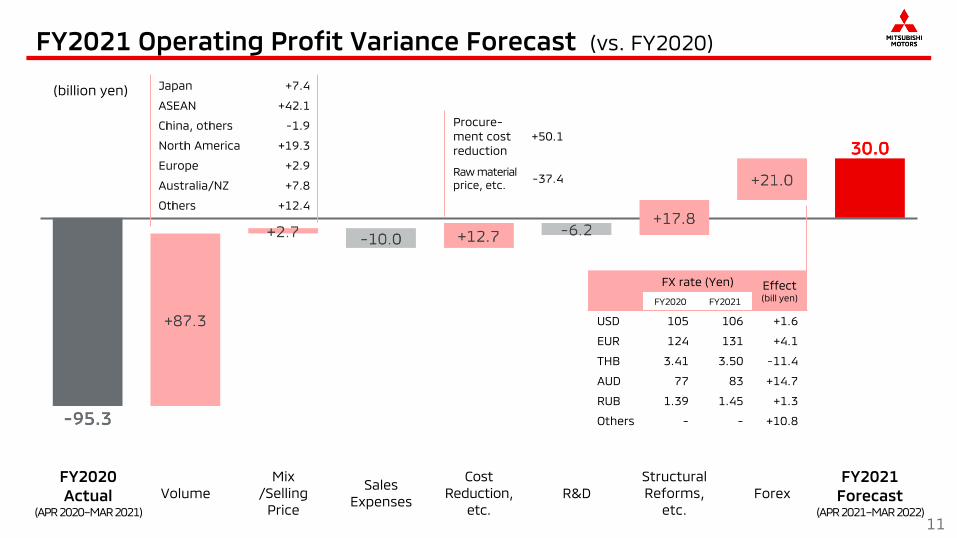
FY2021 Operating Profit Variance Forecast (vs. FY2020)
11
ForexSales
Expenses
Cost
Reduction,
etc.
Mix
/Selling
Price
R&D
Structural
Reforms,
etc.
Japan +7.4
ASEAN +42.1
China, others -1.9
North America +19.3
Europe +2.9
Australia/NZ +7.8
Others +12.4
FX rate (Yen) Effect(bill yen)FY2020 FY2021
USD 105 106 +1.6
EUR 124 131 +4.1
THB 3.41 3.50 -11.4
AUD 77 83 +14.7
RUB 1.39 1.45 +1.3
Others - - +10.8
Procure-
ment cost
reduction
+50.1
Raw material
price, etc. -37.4
Volume
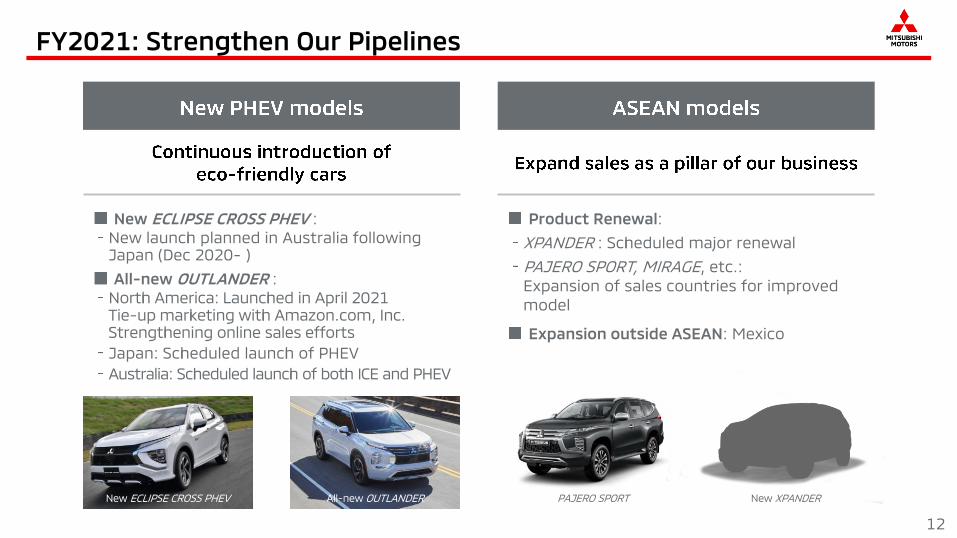
FY2021: Strengthen Our Pipelines
12
Product Renewal:
XPANDER : Scheduled major renewal
PAJERO SPORT, MIRAGE, etc.:
Expansion of sales countries for improved
model
Expansion outside ASEAN: Mexico
New ECLIPSE CROSS PHEV :
New launch planned in Australia followingJapan (Dec 2020- )
All-new OUTLANDER :
North America: Launched in April 2021Tie-up marketing with Amazon.com, Inc.Strengthening online sales efforts
Japan: Scheduled launch of PHEV
Australia: Scheduled launch of both ICE and PHEV
New XPANDERPAJERO SPORTAll-new OUTLANDERNew ECLIPSE CROSS PHEV

3. Update of Mid-Term Business Plan “Small but Beautiful”
13
1. FY2020 Financial Results
2. FY2021 Financial Forecast
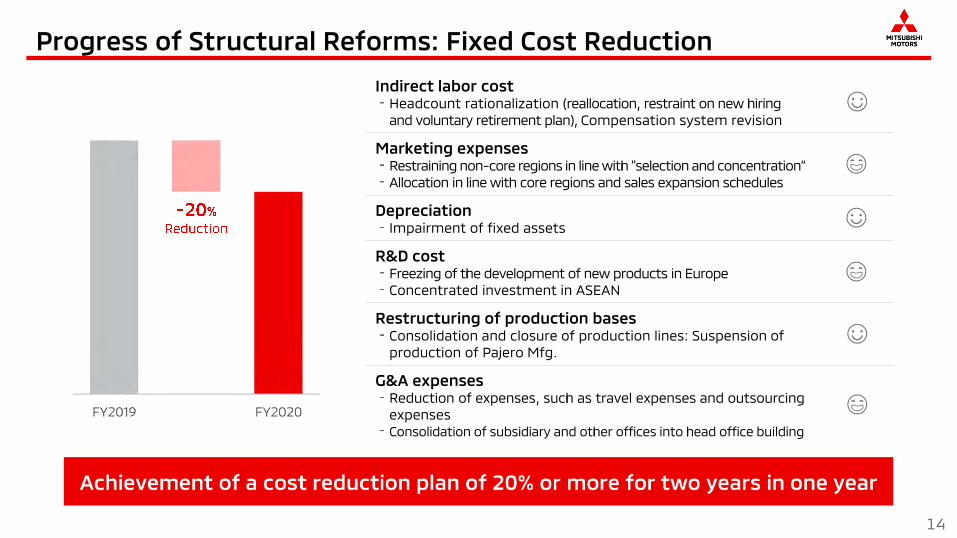
Progress of Structural Reforms: Fixed Cost Reduction
14
Indirect labor costHeadcount rationalization (reallocation, restraint on new hiring
and voluntary retirement plan), Compensation system revision☺
Marketing expensesRestraining non-core regions in line with "selection and concentration“
Allocation in line with core regions and sales expansion schedules😄
DepreciationImpairment of fixed assets
☺
R&D costFreezing of the development of new products in Europe
Concentrated investment in ASEAN😄
Restructuring of production basesConsolidation and closure of production lines: Suspension of
production of Pajero Mfg.☺
G&A expensesReduction of expenses, such as travel expenses and outsourcing
expenses
Consolidation of subsidiary and other offices into head office building
😄
one year

Progress of Structural Reforms: Europe
15
Sales
Decision to freeze new product
development and review sales network
Action in FY2020:
Decision to freeze development of new cars
for Europe
Promoting optimization of selling prices,
improvement of logistics and fixed costs
and other operational efficiencies
Reorganization of sales network:
Planning a step-by-step downsizing to curb
dealer compensation costs and the impact
on P/L
Withdrawal from new car sales business in
some markets by 2023
(Sales country: 32 to 17 countries)
Products
Optimized product lineup
Organize product lineups:
Freezing of new car development; termination
of sales of non-compliant models
Launched ECLIPSE CROSS PHEV in response
to strong demand from sales companies
Two OEM models from Renault
ECLIPSE CROSS PHEV

Action on ASEAN/Oceania
16
Expand sales by capturing opportunities in core regions
Thailand
Indonesia
Malaysia
Australia New Zealand
Philippines
Vietnam
☔ ☔

Redefining Our Vision
17

The New Environmental Plan Package (Announced in November 2020)
18
Average CO2 emissions
from new vehicles
Percentage of
electric vehicles
Average CO2 emissions
from business activities
Set up electric vehicles for all models by 2030

Our EV Development
19
Joint development
with Nissan
Joint development
with GAC
years
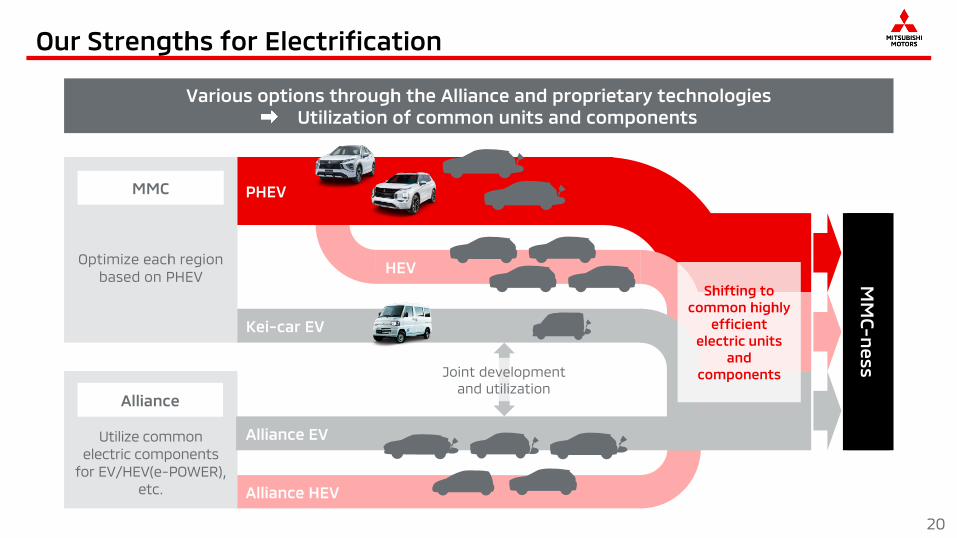
Our Strengths for Electrification
20
Kei-car EV
Joint development
and utilization
Alliance HEV
HEV
Various options through the Alliance and proprietary technologies
Utilization of common units and components
PHEV
Utilize common
electric components
for EV/HEV(e-POWER),
etc.
Alliance
Optimize each region
based on PHEV
MMC
Alliance EV
MM
C-n
ess
Shifting to
common highly
efficient
electric units
and
components

Kei-car Commercial EV: Various Business Opportunities
21
Easy-handling Kei-car commercial vehicle with
quick-charging capability
Spacious luggage equivalent to its ICE model
Range for route delivery applications
10 years of experience and reliability since its launch
Delivered more than 9,000 units to more than
40 companies and local governments nationwide;
Supporting last one mile of clean logistics
M I N I C A B M i E V
Expand business to capture needs for a carbon neutral society
Scheduled delivery of about 200 test vehicles to 20 companies, including logistics, telecommunications, and
electric power companies following Japan Post
Commencement of product enhancement for the next generation: Expansion of running range, cost reduction,
and reflection of test results in products

Our Electrification Technologies: Superiority of PHEV
22
Smaller environmental
impact
(ton)
Life Cycle Assessment (LCA)
advantage considering power
generation Mix
ICE HEV PHEV BEVPHEV
LCA Forecast in 2030 (Thailand)
In a case of CO2 Factor=330g/kWh*
SUV PHEV
Driving performance with which you
can go anywhere without worrying
about the shortage of electricity
ASEAN
Electrification with less investment
burden on charging infrastructure
Gasoline engines can generate battery power
without worrying about cruising range
Overcoming conditions that are BEV’s
weaknesses like continuous hill climbing,
extremely high and low temperatures
Production
Running
Transition estimation of the number of
quick chargers* (unit/10km2)
(unit) China
Germany
Japan
Thailand
Indonesia
*According to research (Assumes:
mid-size SUV running 0.2 million km)
*According to research

Our Electrification Technologies: Providing Value Through EV/PHEV
23
Enterprise
Source of power in disasters
Power support during the transportation of vaccines
Region
V2G: Contributing to the stabilization of
electricity supply and demand
Alternative mobility for gasoline refugees
Local government
SDGs: CO2 reduction measures
BCP: Source of power in emergencies
Personal
Achieving personal SDGs
Source of power in disasters

Our Electrification Technologies: CSR
24
CSR
Free-lending OUTLANDER PHEV:High mobility during disasters:
*
*as end of April, 2021
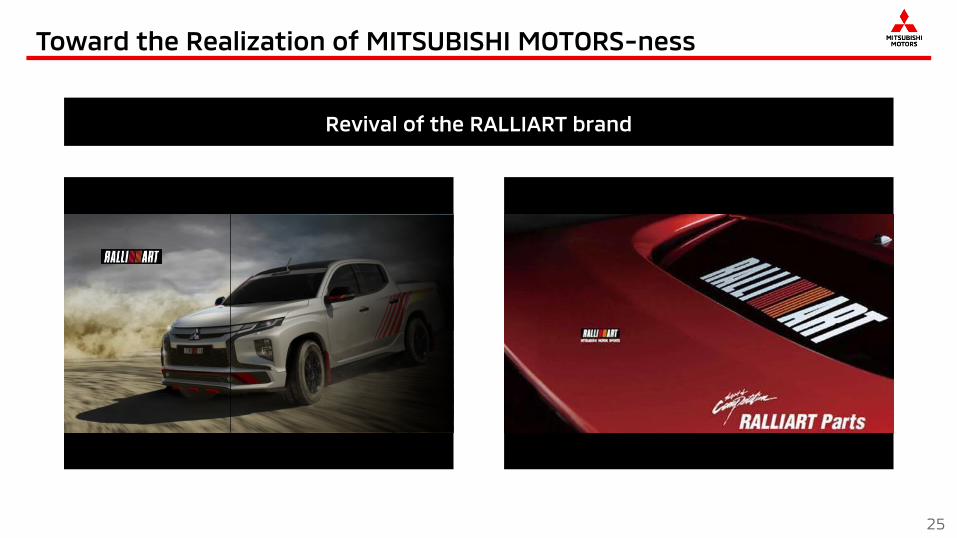
Toward the Realization of MITSUBISHI MOTORS-ness
25
Revival of the RALLIART brand
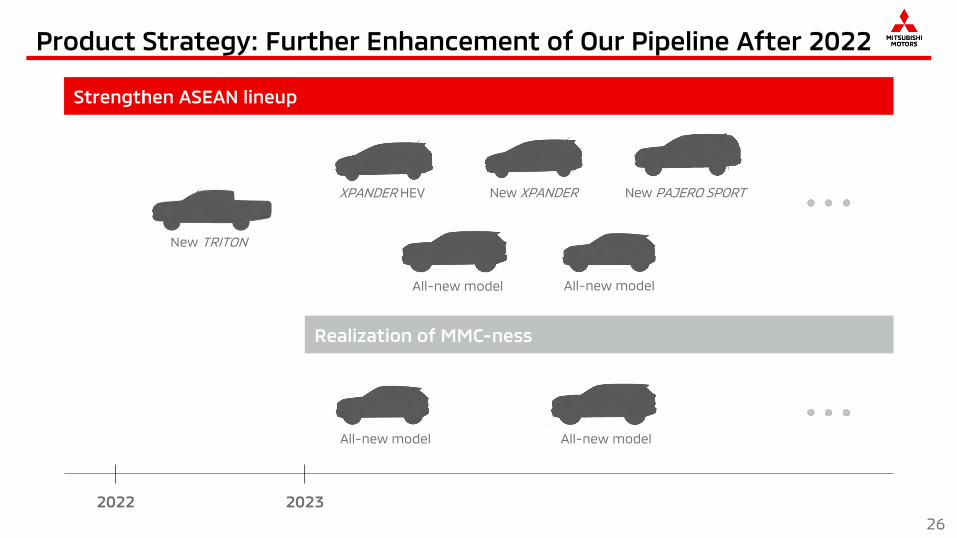
Product Strategy: Further Enhancement of Our Pipeline After 2022
26
20232022
Strengthen ASEAN lineup
New TRITON
All-new model All-new model
XPANDER HEV New XPANDER New PAJERO SPORT
Realization of MMC-ness
All-new model All-new model


28
APPENDIX
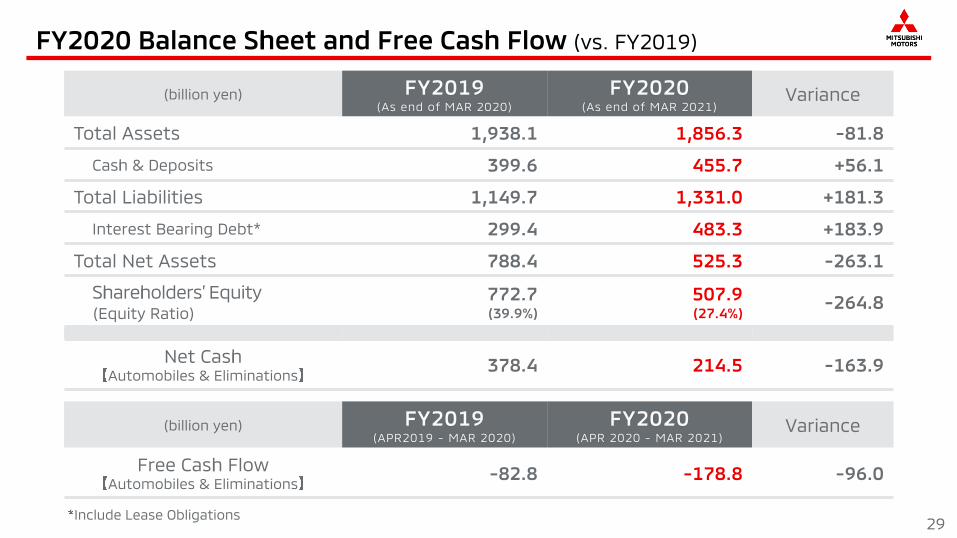
Include Lease Obligations
FY2020 Balance Sheet and Free Cash Flow (vs. FY2019)
29
(billion yen) Variance
Total Assets 1,938.1 1,856.3 -81.8
Cash & Deposits 399.6 455.7 +56.1
Total Liabilities 1,149.7 1,331.0 +181.3
Interest Bearing Debt* 299.4 483.3 +183.9
Total Net Assets 788.4 525.3 -263.1
Shareholders’ Equity(Equity Ratio)
772.7(39.9%)
507.9(27.4%)
-264.8
Net Cash Automobiles & Eliminations
378.4 214.5 -163.9
(billion yen) Variance
Free Cash FlowAutomobiles & Eliminations
-82.8 -178.8 -96.0
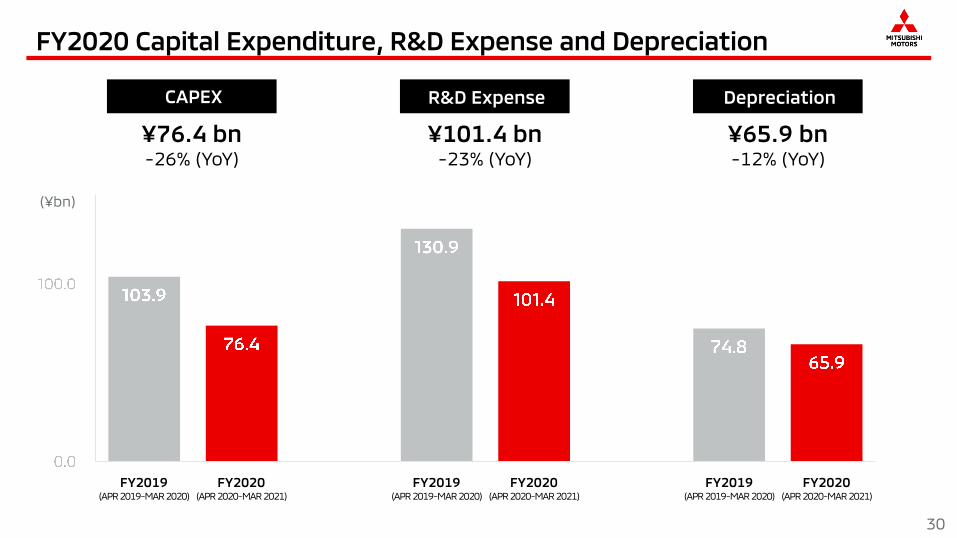
FY2020 Capital Expenditure, R&D Expense and Depreciation
30
CAPEX DepreciationR&D Expense
¥76.4 bn-26% (YoY)
¥101.4 bn-23% (YoY)
¥65.9 bn-12% (YoY)
0%
1%
2%
3%
4%
5%
6%
1 2 3 4 5 6 7 8
(¥bn)
FY2019(APR 2019-MAR 2020)
FY2020(APR 2020-MAR 2021)
FY2019(APR 2019-MAR 2020)
FY2020(APR 2020-MAR 2021)
FY2019(APR 2019-MAR 2020)
FY2020(APR 2020-MAR 2021)

FY2020 Regional Performance (vs. FY2019)
31
(billion yen)
Net Sales Operating Profit
FY2019(APR 2019 – MAR 2020)
FY2020(APR 2020 – MAR 2021)
Variance FY2019(APR 2019 – MAR 2020)
FY2020(APR 2020 – MAR 2021)
Variance
GLOBAL 2,270.3 1,455.5 -814.8 12.8 -95.3 -108.1
‐ Japan 460.5 422.1 -38.4 -12.6 -29.5 -16.9
‐ ASEAN 551.9 317.7 -234.2 63.6 9.3 -54.3
‐ China,
others41.7 19.2 -22.5 -1.5 -3.0 -1.5
‐ North
America315.1 194.6 -120.5 -18.2 -33.3 -15.1
‐ Europe 474.7 183.3 -291.4 -18.1 -20.0 -1.9
‐ Australia
/NZ176.8 173.3 -3.5 -4.4 -7.4 -3.0
‐ Others 249.6 145.3 -104.3 4.0 -11.4 -15.4

FY2021 Regional Sales Forecast (vs. FY2020)
32
(billion yen) Variance
GLOBAL 1,455.5 2,060.0 +604.5
‐ Japan 422.1 465.0 +42.9
‐ ASEAN 317.7 535.0 +217.3
‐ China, others 19.2 15.0 -4.2
‐ North America 194.6 375.0 +180.4
‐ Europe 183.3 225.0 +41.7
‐ Australia/NZ 173.3 235.0 +61.7
‐ Others 145.3 210.0 +64.7
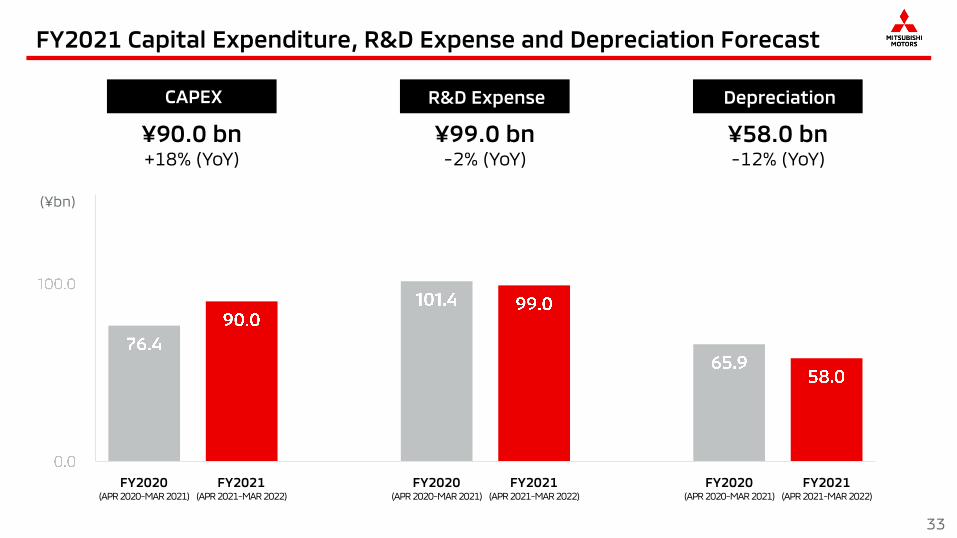
FY2021 Capital Expenditure, R&D Expense and Depreciation Forecast
33
CAPEX DepreciationR&D Expense
¥90.0 bn+18% (YoY)
¥99.0 bn-2% (YoY)
¥58.0 bn-12% (YoY)
0%
1%
2%
3%
4%
5%
6%
1 2 3 4 5 6 7 8
(¥bn)
FY2020(APR 2020-MAR 2021)
FY2021(APR 2021-MAR 2022)
FY2020(APR 2020-MAR 2021)
FY2021(APR 2021-MAR 2022)
FY2020(APR 2020-MAR 2021)
FY2021(APR 2021-MAR 2022)
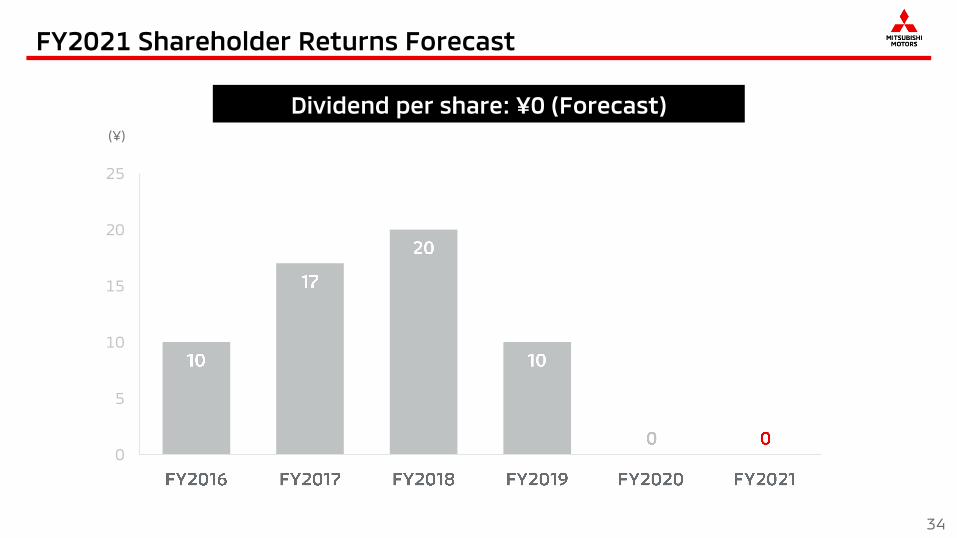
FY2021 Shareholder Returns Forecast
34
Dividend per share: ¥0 (Forecast)(¥)
0
5
10
15
20
25

35
This presentation contains forward-looking statements, based on judgments and estimates that
have been made on the basis of currently available information. By nature, such statements are
subject to uncertainty and risk. Therefore, you are advised that the final results might be
significantly different from the aforementioned statements due to changes in economic
environments related to our business, market trends, fluctuations in interest rates and exchange
rate, changes in laws, regulations and government policies, etc.
Potential risks and uncertainties are not limited to the above and Mitsubishi Motors is not under
any obligation to update the information in this presentation to reflect any developments or events
in the future.
If you are interested in investing in Mitsubishi Motors, you are requested to make a final
investment decision at your own risk, taking the foregoing into consideration. Please note that
neither Mitsubishi Motors nor any third party providing information shall be responsible for any
damage you may suffer due to investment in Mitsubishi Motors based on the information shown in
this presentation.