research market forecast mid-year 2011 - poland
TRANSCRIPT

Accelerating success.
POLAND
RESEARCH & FORECAST REPORT
MID-YEAR 2011

2011 | RESEARCH & FORECAST MID-YEAR REVIEW | POLAND
TABLE OF CONTENTS
Executive summary 3
Economic overview 4
Investment market 5
Land market 6
Industrial market 8
Office market 10
Retail market 12
Key metric definitions 14

3 | COLLIERS INTERNATIONAL
RECENT TRENDS
• Economy: In H1 2011 the Polish economy expanded steadily, despite a slightly
weaker performance recorded in Q2. The GDP is estimated to have grown at a pace
exceeding 4.0%.
• Investment: Poland is still perceived by the international investment community as the
main marketplace in the region. H1 2011 a stabilisation of core yields across all asset
classes was observed in H1 2011. Over 50% of total transaction volume recorded in
the discussed period refered to office investments.
• Land: A continuing trend of buyer‟s domination in the transaction process can be
observed. H1 2011 brought several significant transactions. Investors and developers
have bought land worth EUR 150 million.
• Industrial: H1 2011 resulted in an apparent increase in the number of new warehouse
investments. The transaction volume was about 800,000m². Compared to the first
three months of the year, the transaction volume increased by nearly 7%. Vacancy
rate showed a slight downward trend and at the end of H1 was at 13.3%. Rents in
general remained stable with a slight upward trend.
• Offices: The year so far has been marked by pre-lets. The share of pre-lease
agreements in the total volume of leased space is increasing, which is a sign of a real
revival in the market and its healthy condition.
• Retail: The retail market in Poland saw revival as both developers as well as retailers
presented their expansion plans. In H1 2011 over 250,000m² of retail space was
delivered to the market. Another 400,000m² is planned to be completed by the end of
2011. Increasing supply of modern retail space in secondary cities is facilitating the
expansion of retail chains in regional locations.
MARKET PROGNOSIS
• Economy: The second half of the year will witness a slowdown in the pace of
economic growth. The upcoming months will bring a gradual decrease in both inflation
and unemployment. However, a considerable rise in the number of FDI is expected.
• Investment: It is anticipated that overall activity in 2011 will approach 2010 levels. The
pricing gap between core and non-core assets is expected to increase further in H2
2011.
• Land: As a result of the crisis break in investments, the lack of available dwellings has
influenced a significant recovery in residential developers‟ activity. Developers are now
aiming at large and medium-sized cities. Investment plots intended for shopping malls
and retail parks are of interest to many Polish and foreign companies.
• Industrial: An increase in planned investments can be observed in most markets.
Further growth in demand is predicted, both in Warsaw and in other regions. It is
expected that rents will remain stable with a slight upward trend.
• Offices: Due to a relatively low amount of vacant space in Warsaw‟s non-central
locations tenants may be forced to search for space in buildings within the CBD.
Effective rents in non-central locations may move upwards, whereas they should
remain stable or even slightly decrease in the city centre.
• Retail: Developers are targeting mainly small and medium-sized cities, which still are
not saturated in terms of modern retail space. Top international retail chains will follow
this direction and enter regional markets. Anticipating higher activity from retailers,
rents in prime locations will begin to increase. The trend of tenants switching to the
best retail destinations and newly opened high quality shopping centres will continue.
MARKET INDICATORS
2010* 2011*
GDP GROWTH
UNEMPLOYMENT
WAGES
INFLATION
INVESTMENT VOLUMES
OFFICE RENTS
INDUSTRIAL RENTS
RETAIL RENTS
YIELDS
* COMPARED TO THE PREVIOUS YEAR
RESEARCH & FORECAST REPORT | MID-YEAR 2011 | POLAND | EXECUTIVE SUMMARY
Executive summary

4 | COLLIERS INTERNATIONAL
RESEARCH & FORECAST REPORT | MID-YEAR 2011 | POLAND | ECONOMIC OVERVIEW
Source: Central Statistical Office, Ministry of Finance
Source: Central Statistical Office, Ministry of Finance
Source: Central Statistical Office, Ministry of Finance
Economic overview
SUMMARY
• The Polish economy expanded steadily in H1 2011 as the GDP grew at a pace
exceeding 4%. Preliminary estimates show that the economic performance recorded in
Q2 was slightly weaker than in comparison to the previous period, yet the Central
Statistical Office predicts that the GDP will maintain dynamics similar to Q1.
• The GDP growth in Q2 was mainly driven by strong consumer demand and high
dynamics in the construction sector. In comparison to the previous quarter a decrease
in industrial output was reported. An upswing in investment demand recorded in Q1
(6% in a yoy analysis) is expected to be continued in the following quarter.
• As it was expected during H1 2011 an upward trend in the consumer price index was
observed. The inflation rate in Q1 amounted to 3.8% and reached 4.6% in Q2. To
tame the increasing inflation the Monetary Policy Council decided to raise the interest
rates four times throughout the six past months.
• Despite a drop in Q2 (12.2% against 13.1% in Q1 2011), the unemployment rate
remained relatively high during H1 2011. The unemployment rate in June stood at
11.8% and was the lowest value reported during the last six months.
• The average monthly nominal salary in the enterprise sector in June 2011 reached
PLN 3600.47 (EUR 900.11), which was a 5.8% increase in comparison to the same
period of 2010. The average monthly wages in H1 2011 grew by 4.6% in
a yoy analysis.
• The Ministry of Economy estimates that the inflow of foreign direct investments in the
first five months of 2011 amounted to EUR 4.2 bln. Poland remained an attractive
location for investors, thanks to its steady economic and political situation, skilled work
force and competitive labour costs. It is also worth mentioning that during the first six
months of 2011, rising investment activity within the special economic zones was
recorded.
PROGNOSIS
• H2 2011 will witness a slowdown in the pace of economic growth. The National Bank
of Poland estimates that the GDP in 2011 will amount to 4%.
• Analysts predict that the inflation rate will drop during H2 2011.
• The upcoming months will bring a slow decrease in the unemployment rate – mainly
because of increasing seasonal work. Experts predict that unemployment will fall to
11.5% by the end of the year.
• According to the Ministry of Economy the total inflow of foreign direct investment in
2011 might exceed EUR 10 bln. The peak of investors‟ activity is anticipated in the
second half of the year.
0,0
1,0
2,0
3,0
4,0
5,0
6,0
7,0
0
80
160
240
320
400
480
560
GDP Annual ChangeGDP (bln)
0
5
10
15
20
25
UNEMPLOYMENT (%)
0
1
2
3
4
5
INFLATION (%)
Key Economic Figures
GDP Growth 4.2%
Unemployment 12.2%
Inflation 4.6%

5 | COLLIERS INTERNATIONAL
SUMMARY
• Stabilisation of core yields across all asset classes can be witnessed in H1 2011. Any
further movement in pricing is expected to depend largely on the impact of the
sovereign debt crisis.
• Poland is still perceived by the international investment community as the main
marketplace in the region and the liquidity has remained high in H1 2011. It‟s
recognition as a largely „core market‟ in the CEE region has been upheld.
• Approximately EUR 960 million of investment transacted in H1 2011 across all asset
classes. The market has been driven by office investment transactions (53.5% of total
volume), followed by retail (38.5%) and logistics (8%). There have been no hotel
transactions this year to date.
• Austrian (due to the sale of the stake in the Europolis portfolio by CA Immo) and
German investors dominated the market in terms of volume of closed transactions,
followed by UK investors.
• Warsaw has dominated the market in terms of volume, accounting for approx. 83% of
all transactions closed in H1 2011, which translates into EUR 795 mln. Ca. EUR 165
mln of investment product was traded in regional cities, which indicates sustained
liquidity which stretches beyond Warsaw.
PROGNOSIS
• Poland is still on-track to drive the investment volumes in the region, primarily due to
healthy macro-economic dynamics and the availability of product.
• We expect the pricing gap between core and non-core assets to continue to grow
through the second half of this year.
• Investors perceive favourable leasing dynamics and their anticipation of a „supply gap‟
in major cities as one of the main drivers of the market.
• Core funds are expected to continue to dominate the investment landscape for the
medium term, given their ability to conduct “all equity” transactions, or at low leverage
levels.
• Notwithstanding the above, we note that certain funds are approaching their
investments more selectively and may be inclined to sell if the pricing can match their
expectations.
• Stabilisation of core yields in the mid-term continues to be dependent on the
macroeconomic fundamentals of the Euro Zone and the CEE region in the wake of the
sovereign debt crisis.
• As several transactions are currently either in due diligence or are approaching that
stage, we expect that overall transaction activity in 2011 will approach 2010 levels.
Source: Colliers International
Source: Colliers International
RESEARCH & FORECAST REPORT | MID-YEAR 2011 | POLAND | INVESTMENT MARKET
Key Investment Figures
H1 Investment Turnover EUR 960 mln
Prime Office Yields 6.7%
Prime Retail Yields 6.7%
Prime Industrial Yields 8.0%
Investment market
0
1000
2000
3000
4000
5000
INVESTMENT VOLUME(EUR mln)
0%
2%
4%
6%
8%
10%
12%
14%
PRIME YIELDS
Industrial Retail Office

6 | COLLIERS INTERNATIONAL
GENERAL OVERVIEW
• The land market has started to revive after the crisis. The first signs of this were
transactions concluded in the last few weeks of 2010. A further market upswing was
recorded in the first half of 2011, during which the value of land transactions exceeded
EUR 125 mln.
• Contrary to H2 2010, an increased number of companies with their own or confirmed
debt funds, interested in buying investment land was observed.
• For investment sites with valid Development Conditions or covered by a Local Plan,
the sales process – from offer to the transfer of ownership – extended considerably
over time and can take up to twelve months. In the case of land without Conditions or
a Plan or with documents requiring changes, the process can take up to two years.
• Despite the concluded and pending transactions, today‟s market cannot be compared
to the market before the crisis. The only similarity which can be observed is the unique
investment opportunity to acquire land in a very good location at a reasonable price.
Good investment sites attract several or even a dozen potential investors, whose
financial capabilities and investment potential should be verified.
• Areas well-prepared for the investment process, in terms of technical, legal and
planning are attracting the highest prices. As always, location is a major factor
determining the value.
TRENDS
• The trend of buyers‟ domination continues.
• In terms of transactions, their number is still low due to the continuing difficulty in
financing commercial projects. However, the volume of those concluded is still
impressive.
• Fluctuations in the global economy and turmoil in the European Union are impacting
on the market. This is influencing transactions, leading to reconsideration of offers,
price, and even to postponement of the closure process.
• Sluggishness among some local authorities, particularly in Kraków and Warsaw, in
issuing building permits continues to have a negative impact on the market, and is
prolonging the investment process.
PRICES AND TRANSACTION
• The first half of the year has brought several significant transactions. Investors and
developers have bought land worth EUR 150 million. This volume is impressive,
despite the small number of transactions.
• Prices of investment sites in all sectors have stabilised. This applies both to areas
where the price declines were the greatest, and to those, where prices have reached
their upper level.
• Investment plots intended for shopping malls and retail parks are seeing interest from
Polish and foreign companies. The prices for land suitable for shopping malls in
Warsaw range between EUR 300-600 per m². Outside of Warsaw prices are lower at
around EUR 120-450 per m². Land for retail parks is priced in the range between
EUR 150-190 per m². The price depends on location; local market saturation and the
plot‟s investment potential.
RESEARCH & FORECAST REPORT | MID-YEAR 2011 | POLAND | LAND MARKET
Land market
TRENDS 2011
Office investment sites
SUPPLY
DEMAND
PRICES
TRENDS 2011
Residential investment sites
SUPPLY
DEMAND
PRICES
TRENDS 2011
Retail investment sites
SUPPLY
DEMAND
PRICES
Source: Colliers International
Source: Colliers International
Source: Colliers International

7 | COLLIERS INTERNATIONAL
Source: Colliers International
Source: Colliers International
PROGNOSIS
• Ongoing negotiations and concluded preliminary agreements may allow the land
market in 2011 to reach a value of EUR 0.3-0.375 billion.
• Land intended for offices in Warsaw, Wrocław and Kraków attract the highest interest.
As for TriCity and Poznań, projects started during the crisis have been
re-established and new transactions may well be on the horizon, although these
markets remain less buoyant than in Warsaw or Wrocław.
• As a result of the hiatus in investments caused by the crisis, the lack of available
dwellings has influenced a significant recovery in residential developers‟ activity.
These developers are focusing on large and medium-sized cities.
• The growth of the tourist market and the upcoming Euro 2012 in Poland, will continue
to contribute significantly to the development of both hotel chains and individual hotel
units. However, the finalised and upcoming transactions are of a lower value
compared to the rest of the real estate market.
LAND DEPARTMENT – ONGOING PROJECTS IN 2011
– SELLER’S REPRESENTATION PORTFOLIO
RESEARCH & FORECAST REPORT | MID-YEAR 2011 | POLAND | LAND MARKET
PRICES AND TRANSACTIONS
INVESTOR LOCATION
PLOT
SIZE
(ha)
TRANSACTION
VALUE
(mln PLN)
J.W.
Construction
Kasprzaka,
Warsaw
8.1 174
Dom
Development
Powązkowska,
Warsaw
9.9 168
Echo
Investment
Konstruktorska,
Warsaw
7.4 63
Echo
Investment
Hotel Mercure,
Warsaw
n/a 125
PRICES FOR THE OFFICE DEVELOPMENT
SITES (EUR/m² of GLA)
TOWN/ REGION MIN MAX AVERAGE
Warsaw CBD 300 850 575
Kraków 150 350 250
Łódź 100 150 125
Poznań 165 300 233
Upper Silesia 75 150 113
TriCity 100 350 225
Wrocław 100 450 275
Source: Colliers International
PRICES FOR THE RESIDENTIAL
DEVELOPMENT SITES (EUR/m² of PUM)
TOWN/ REGION MIN MAX AVERAGE
Warsaw:
CBD
300 700 500
Warsaw:
outside CBD
140 350 245
Kraków 120 450 285
Łódź 80 200 140
Poznań 80 300 190
Upper Silesia 60 200 130
TriCity 100 300 200
Wrocław 130 350 240
CLIENT PROJECT FUNCTIONPLOT SIZE
(ha)
INVESTMENT
POTENTIAL (m²)
ASKING
PRICES
(mln PLN)
FSO SA Toruńska, Warsaw Commercial 6.00 50,000 38
FSO SAŻerański Chanel,
WarsawMixed-use 8.26 50,000 47
FSO SA Falenica, Warsaw Residential 2.80 25,000 12
KCI SA Poznańska, Kraków Residential 2.50 33,000 n/a
KCI SA Rybitwy, Kraków Commercial 14.80 n/a n/a
Sita Suez Group Brzezińska, Łódź Residential 11.00 n/a 12
Sita Suez Group Darwina, Kraków Residential 1.80 n/a 5
IGD Silesia Sp. z o.o. Bukowińska, Warsaw Residential 0.60 21,500 45
IGD Mokotów Sp. z o.o.Emerald Tower,
WarsawOffice 0.40 20,000 45
BRJ InvestmentBeethovena II,
WarsawOffice 0.91 16,000 34
BP Investment Beethovena I, Warsaw Office 4.41 n/a 70
Hala Koszyki Savleigh Hala Koszyki, Warsaw Mixed-use 0.94 20,000 48
Metsa Tissue/Konstans Konstancin-Jeziorna Mixed-use n/a 120,000 n/a
Mor Eden Towers Grzybowska, Warsaw Residential 0.60 26,850 72
Drewnica DevelopmentShipyard City Gdańsk,
GdańskMixed-use 20.20 230,000 136
Vantage DevelopmentPromenady
Wrocławskie, WrocławMixed-use 15.10 n/a n/a
Nowe Ogrody 4 Sp. z
o.o.
Droga Męczenników
Majdanka, LublinResidential 6.90 75,600 65
Source: Colliers International

8 | COLLIERS INTERNATIONAL
Source: Colliers International
Source: Colliers International
GENERAL OVERVIEW
• The first half of 2011 saw an apparent increase in the number of new warehouse
investments. In the first two quarters, almost 140,000 m² was delivered through ten
projects, of which over 75% was supplied to the market in Q2. The total supply of
warehouse space in Poland at the end of H1 2011 was approximately 6.5 million m².
Currently, around 347,000 m² of modern warehouse space is under construction.
• In the first half of 2011 the transaction volume was about 800,000 m², of which over
51% was signed in Q2. Compared to the first three months of the year, transaction
volume increased nearly by 7%. More than 64% of the total transactions were new
contracts, with the remaining 36% being renegotiations and expansions.
• Vacancy rate showed a slight downward trend and, at the end of Q2 2011, was at
13.3%.
• Rents for warehouse space in general remained stable. An increase in rental rates
was observed in the regions with a low level of available space such as in Kraków,
Poznań and Upper Silesia.
SUPPLY
• Warsaw – the total supply of warehouse space in Warsaw‟s three zones at the end of
Q2 2011 amounted to nearly 2.5 million m² (compared to Q1, the supply has increased
by over 48,000m²). More than 65.8% of warehouse space is located in Zone II. At the
end of Q2, over 26,000 m² of modern warehouse space (Zone I and II) was under
construction, with 1.2 million m² in the planning stage of which 61% is in Zone II.
• Central Poland – the total supply of warehouse space at the end of Q2 amounted to
more than 930,000m². Just one project has been delivered to the market – Tulipan
Park Łódź, comprising the so-called ”small business units”, offering small warehouse
modules. Currently, about 22,000m² of industrial area is under construction.
• Poznań – warehouse space in H1 2011 increased by nearly 21,500m². Two buildings
in Panattoni Park Poznań I were completed. The existing supply has now increased to
almost 824,000m², while projects under construction constitute about 54,500m².
• Upper Silesia – current supply is more than 1.23 million m² and this remains the
second largest warehouse market in Poland. Currently, over 80,000m² of warehouse
space is under construction.
• Kraków – in terms of existing supply Kraków is one of the smallest warehouse markets
in Poland. The existing supply as of the end of H1 of 2011 amounted to slightly more
than 81,000m². In the first half of the year over 13,000m² of modern warehouse space
was delivered to the market.
• Wrocław – the total supply of modern warehouse space exceeded 617,000m². At the
end of Q2 around 67,000m² was under construction
• Gdańsk – the total stock of warehouse space at the end of H1 2011 was approximately
134,000m².
• Toruń – currently, the total supply of warehouse space is 95,600 m². Only one project
with an area of 1,100m² is under construction, while at the planning stage, there is
around 100,000m².
• Szczecin – Szczecin remains Poland‟s smallest warehousing market. Overall supply at
the end of H1 amounted to less than 42,000m².
RESEARCH & FORECAST REPORT | MID-YEAR 2011 | POLAND | INDUSTRIAL MARKET
Industrial market
TRENDS 2011
SUPPLY
DEMAND
RENTS
VACANCY
39%
8%18%
4%
4%
2%
24%
1%
DEVELOPERS MARKET SHARE BY EXISTING SUPPLY
ProLogis SEGRO
Panattoni MLP
Europolis PointPark Properties
Other Goodman
0
200,000
400,000
600,000
800,000
1,000,000
1,200,000
1,400,000
1,600,000
1,800,000
TOTAL SUPPLY BY REGIONS
9 | COLLIERS INTERNATIONAL
Source: Colliers International
Source: Colliers International
DEMAND
• Warsaw – the demand for warehouse space in H1 2011 was relatively high. Nearly
371,000m² of warehouse space was leased, which represented 43% of the total
transaction volume in Poland. Most of the lease agreements were signed in Zone I –
over 184,000m².
• Central Poland – total leased space in amounted to 78,800m², of which approximately
77% was leased in Q2.
• Poznań – rented space in H1 reached the level of over 70,000m², of which more than
56% was leased in Q1.
• Upper Silesia – in the first six months of 2011, 32 leases for a total area of over
159,000m² were signed. In terms of transaction volume, Upper Silesia ranks second
after Warsaw.
• Kraków – five leases for 28,000m² were signed. The majority of them in Q2.
• Wrocław – in H1 2011, 14 lease agreements were signed for a total area of over
84,000m²
• Gdańsk – in the period from January to June 2011 nearly 25,000m² was leased.
• Szczecin – the market here observed limited tenant activity. There were just two
contracts signed during the first half of the year for a total area of 9,000m².
• Toruń – in H1 2011, there were no lease transactions due to the lack of availability of
warehouse space in this market.
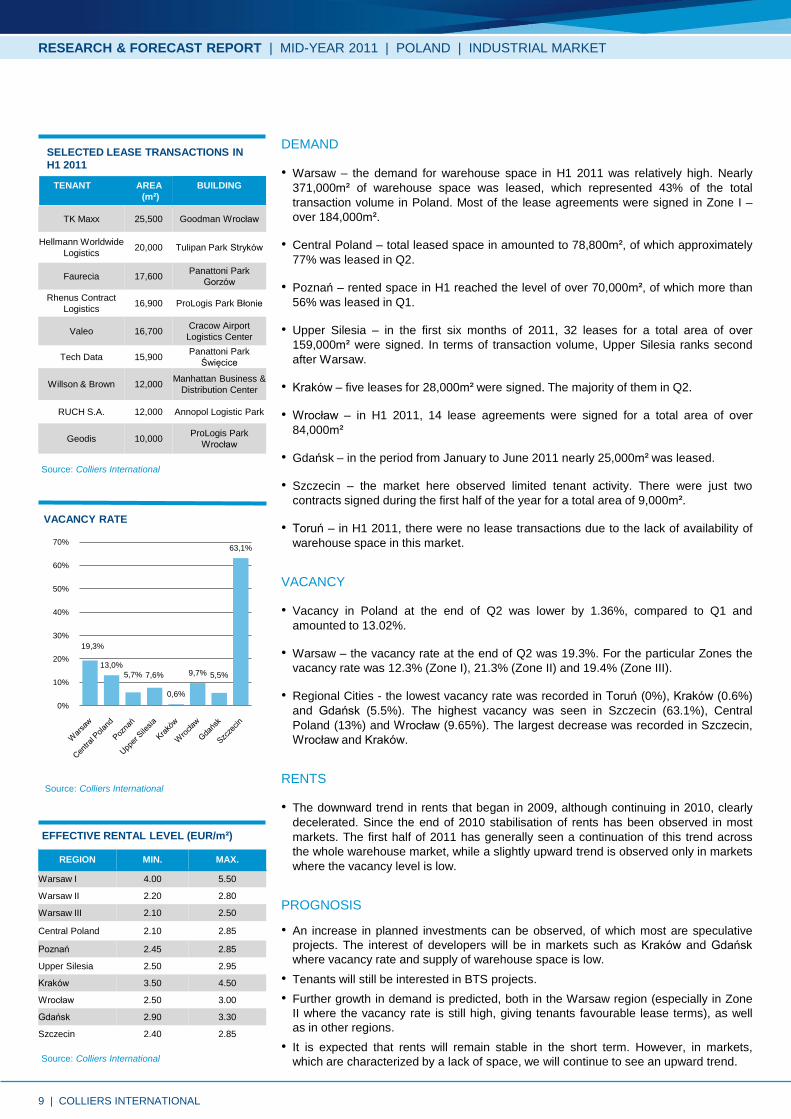
VACANCY
• Vacancy in Poland at the end of Q2 was lower by 1.36%, compared to Q1 and
amounted to 13.02%.
• Warsaw – the vacancy rate at the end of Q2 was 19.3%. For the particular Zones the
vacancy rate was 12.3% (Zone I), 21.3% (Zone II) and 19.4% (Zone III).
• Regional Cities - the lowest vacancy rate was recorded in Toruń (0%), Kraków (0.6%)
and Gdańsk (5.5%). The highest vacancy was seen in Szczecin (63.1%), Central
Poland (13%) and Wrocław (9.65%). The largest decrease was recorded in Szczecin,
Wrocław and Kraków.
RENTS
• The downward trend in rents that began in 2009, although continuing in 2010, clearly
decelerated. Since the end of 2010 stabilisation of rents has been observed in most
markets. The first half of 2011 has generally seen a continuation of this trend across
the whole warehouse market, while a slightly upward trend is observed only in markets
where the vacancy level is low.
PROGNOSIS
• An increase in planned investments can be observed, of which most are speculative
projects. The interest of developers will be in markets such as Kraków and Gdańsk
where vacancy rate and supply of warehouse space is low.
• Tenants will still be interested in BTS projects.
• Further growth in demand is predicted, both in the Warsaw region (especially in Zone
II where the vacancy rate is still high, giving tenants favourable lease terms), as well
as in other regions.
• It is expected that rents will remain stable in the short term. However, in markets,
which are characterized by a lack of space, we will continue to see an upward trend.
RESEARCH & FORECAST REPORT | MID-YEAR 2011 | POLAND | INDUSTRIAL MARKET
TENANT AREA
(m²)
BUILDING
TK Maxx 25,500 Goodman Wrocław
Hellmann Worldwide
Logistics 20,000 Tulipan Park Stryków
Faurecia 17,600Panattoni Park
Gorzów
Rhenus Contract
Logistics 16,900 ProLogis Park Błonie
Valeo 16,700Cracow Airport
Logistics Center
Tech Data 15,900Panattoni Park
Święcice
Willson & Brown 12,000Manhattan Business &
Distribution Center
RUCH S.A. 12,000 Annopol Logistic Park
Geodis 10,000ProLogis Park
Wrocław
SELECTED LEASE TRANSACTIONS IN
H1 2011
REGION MIN. MAX.
Warsaw I 4.00 5.50
Warsaw II 2.20 2.80
Warsaw III 2.10 2.50
Central Poland 2.10 2.85
Poznań 2.45 2.85
Upper Silesia 2.50 2.95
Kraków 3.50 4.50
Wrocław 2.50 3.00
Gdańsk 2.90 3.30
Szczecin 2.40 2.85
EFFECTIVE RENTAL LEVEL (EUR/m²)
Source: Colliers International
19,3%
13,0%
5,7% 7,6%
0,6%
9,7% 5,5%
63,1%
0%
10%
20%
30%
40%
50%
60%
70%
VACANCY RATE

10 | COLLIERS INTERNATIONAL
OVERVIEW
• The first half of 2011 saw modest supply of new office space coming to the Polish
market. Slightly over 95,000 m2 of office space was completed both in Warsaw and in
the 8 main regional markets. This amount of space constitutes only 37% of new supply
delivered in H1 2010.
• Leasing activity remains at a high level. Increasing demand for office space combined
with the modest supply is pushing vacancy rates downwards in Warsaw and in all
regional markets.
• Tenants act with greater confidence with respect to the future of their business
activities and they are attempting to secure large space units at favourable lease
conditions.
• 2011 so far is marked by pre-lets. The share of pre-lease agreements in the total
volume of leased space is increasing, which is a sign of a real revival in the market
and its healthy condition.
SUPPLY
• Warsaw – the total stock of office space grew insignificantly in H1 2011. Thanks to
completion of 28,353m2 within four office schemes it amounted to 3,505,035m2.
Two office projects were completed in the Upper South Zone (Mokotów) – Platinium IV
(13,000m2) and Racławicka Point (1,918m2) and two other projects were completed in
the City Centre – Pałac Młodziejowskiego (4,964m2) and Mokotowska Square
(8,471m2). Currently ca 115,000m2 of office space is under construction for delivery
before the year end. The largest amount of space will be completed in the CBD and in
the Upper South Zone.
• Regional cities – the total stock of regional markets grew by almost 68,000 m2 during
the first half of the year. The largest increase in total stock was recorded in Kraków,
where almost 26,400m2 was delivered onto the market with, among others, two
buildings of Bonarka4Business (15,694m2) and the first phase of the Green Office
scheme (8,000m2). Lublin saw the second largest new supply among regional
markets, as 13,500m2 of office space was completed within the Gray Office Park A.
The TriCity was third thanks to delivery of the Allcon Park 3 (9,116m2). At the end of
June 2011 almost 90,000m2 of office space was under construction, and planned for
delivery in 2011.
DEMAND
• Warsaw – mid-year take-up in the Warsaw market surpassed 320,000m2, which in
comparison with the results recorded in H1 2010 constitutes a 46% increase.
35% of leasing activity in H1 took place in the central locations. Among non-central
locations the Upper South Zone enjoyed the most popularity and its share in the total
volume of leased space amounted to 32%. The majority of lease transactions were
concluded for lease of small units below 1,000 m2. The average deal size for the
period was 1,063m2. Nine lease agreements surpassed 5,000m2. In comparison with
H1 2010 the share of renegotiations and renewals in the total volume of leased space
decreased by 6 pp and was at the level of 30%, whereas the share of pre-lets
significantly increased (25% against 5% in the same period of 2010). The largest
agreements include 43,500m2 pre-leased by TP SA and 11,000m2 renewed by Ernst
& Young in Rondo 1.
• Regional cities – slowly but steadily regional markets are regaining their importance. In
H1 2011 transactions surpassing 155,000m2 took place, with the largest leasing
activity recorded in Kraków (almost 50,000m2) and Poznań (over 30,000m2). The
majority of transactions were new agreements. Renegotiations and renewals
constituted 27% of the total recorded take-up and pre-lets had a 26% share in the total
volume of leased space. H1 2011 was characterised by a high leasing activity
performed by tenants from the BPO sector.
Source: Colliers International
Source: Colliers International
RESEARCH & FORECAST REPORT | MID-YEAR 2011 | POLAND | OFFICE MARKET
Office market
CITY TOTAL STOCK (m2) VACANCY (%)
Warsaw 3,505,035 6.2
Kraków 414,420 11.7
Wrocław 311,330 4.3
Poznań 195,580 11.3
TriCity 225,180 14.6
Katowice 184,730 19.3
Łódź 181,590 22.3
Lublin 61,980 10.5
Szczecin 43,060 4.4
Source: Colliers International
TRENDS 2011
SUPPLY
DEMAND
RENTS
VACANCY
KEY OFFICE FIGURES
H1 2011
6%
30%
39%
25%
Expansions
Renewals & Renegotiations
New agreements excluding pre-lets
Pre-let agreements
TAKE-UP COMPOSITION
TAKE-UP (in thous. m2)
0
50
100
150
200
250
300
350
2008 H1
2008 H2
2009 H1
2009 H2
2010 H1
2010 H2
2011 H1

11 | COLLIERS INTERNATIONAL
RESEARCH & FORECAST REPORT | MID-YEAR 2011 | POLAND | OFFICE MARKET
The largest agreements include 16,000m2 renewed by Shell in KBP 400 in Kraków,
14,600m2 pre-leased by Grupa Allegro in Pixel in Poznań and 11,500m2 preleased by
Infosys BPO Poland in Green Horizon in Łódź.
VACANCY
• Warsaw – the average vacancy rate for the city as a whole has been decreasing for
the last twelve months and at the end of H1 2011 stood at 6.17%. The vacancy rate in
the CBD, which was growing since the end of 2008, has stabilized above 8%. In non-
central locations, due to the small amount of new supply, the vacancy rate continues to
drop. At the end of H1 2011 it stood at 5.2%.
• Regional cities – vacancy rates range from 4.3% in Wrocław to 22.3% in Łódź. In
comparison with rates recorded at the end of 2010 and in Q1 2011 almost all cities
recorded a decrease in the amount of vacant offices. This can be attributed to the high
leasing activity recorded in H1 2011 and very limited supply of new office space.
RENTS
• Warsaw – asking rents remain stable with the average at the level of ca. EUR 21.5
/m2 per month in the CBD and EUR 15.5 /m2 per month in non-central locations. Due
to the relatively high amount of unleased space in the central area some office
buildings in the CBD offer space in the range of EUR 16-19 /m2 per month. A-class
buildings in prime locations leased to a high degree offer space at even EUR 25-28
/m2 per month.
• Regional cities – rental rates generally continue to range between EUR 12 and
15 /m2 per month. Lowest asking rates remain in Katowice and Łódź, and the highest
in Poznań and Wrocław.
PROGNOSIS
• Due to a relatively low amount of vacant space in Warsaw‟s non-central locations
tenants may be forced to search for space in buildings within the CBD.
• Delivery of further schemes in the central area which remain vacant to a high degree,
may result in a further increase in vacancy rates for CBD.
• Effective rents in non-central locations may move upwards, whereas they should
remain stable or even slightly decrease in the city centre.
• Pre-lease agreements will continue to be popular among tenants as a means of
securing space in desired locations at favourable conditions.
• As regards regional markets, new supply scheduled for delivery in H2 2011 will be
higher than the amount of space which entered the market in H1 2011. If demand for
space remains at the current level, this new supply will allow for further stabilisation in
most markets.
• TriCity will experience the largest increase among regional markets and may
experience a significant growth in vacancy rates. In order to attract tenants landlords
may offer more favourable leasing terms.
SELECTED LEASE TRANSACTIONS
IN H1 2011
TENANT SIZE (m2) BUILDING
TP SA Pre-lease: Miasteczko
TP / Warsaw 43,700
Shell
Renegotiation/
renewal: KBP 400 /
Kraków16,000
Grupa AllegroPre-lease:
Pixel / Poznań
14,600
Infosys BPO
Poland
Pre-lease: Green
Horizon /
Łódź 11,500
Ernst & Young
Renegotiation/
renewal: Rondo 1 /
Warsaw11,000
SABRERenewal + expansion: Buma Square
/ Kraków8,900
Frontex Renewal + expansion: Rondo 1 /
Warsaw8,800
Rabobank
Group
Pre-lease: Senator /
Warsaw2,840
Source: Colliers International
VACANCY RATE IN CENTRAL AND
NON-CENTRAL LOCATIONS
Source: Colliers International
CITYMIN.
(EUR/m2)
MAX.
(EUR/m2)
Warsaw
CBD 19.0 24.0
Warsaw
outside CBD13.0 16.0
Kraków 12.0 15.0
Wrocław 13.5 15.5
Poznań 14.5 16.5
TriCity 13.5 15.0
Katowice 12.0 13.5
Łódź 11.0 12.5
Source: Colliers International
AVERAGE ASKING RENTS
0%
1%
2%
3%
4%
5%
6%
7%
8%
9%
2008 H1
2008 H2
2009 H1
2009 H2
2010 H1
2010 H2
2011 H1
Central Non-central
12 | COLLIERS INTERNATIONAL
GENERAL OVERVIEW
• The retail market in Poland revived in the first half of 2011, both on the supply and
demand side.
• Developers are returning to the market by presenting their expansion plans for the
coming years. In the first half of 2011 over 250,000 m² of retail space was delivered to
the market, which is a 13% increase yoy.
• The first half of 2011 can be described as moderately optimistic in terms of retailers‟
activity on the Polish market. One of the reasons is quite good economic conditions,
and in June 2011 retail sales in Poland increased by 10.9% yoy. Moreover, there are
still many potential locations which are seeing interest from retail chains. There were
also some new entries by brands which were yet not present on the Polish retail
market.
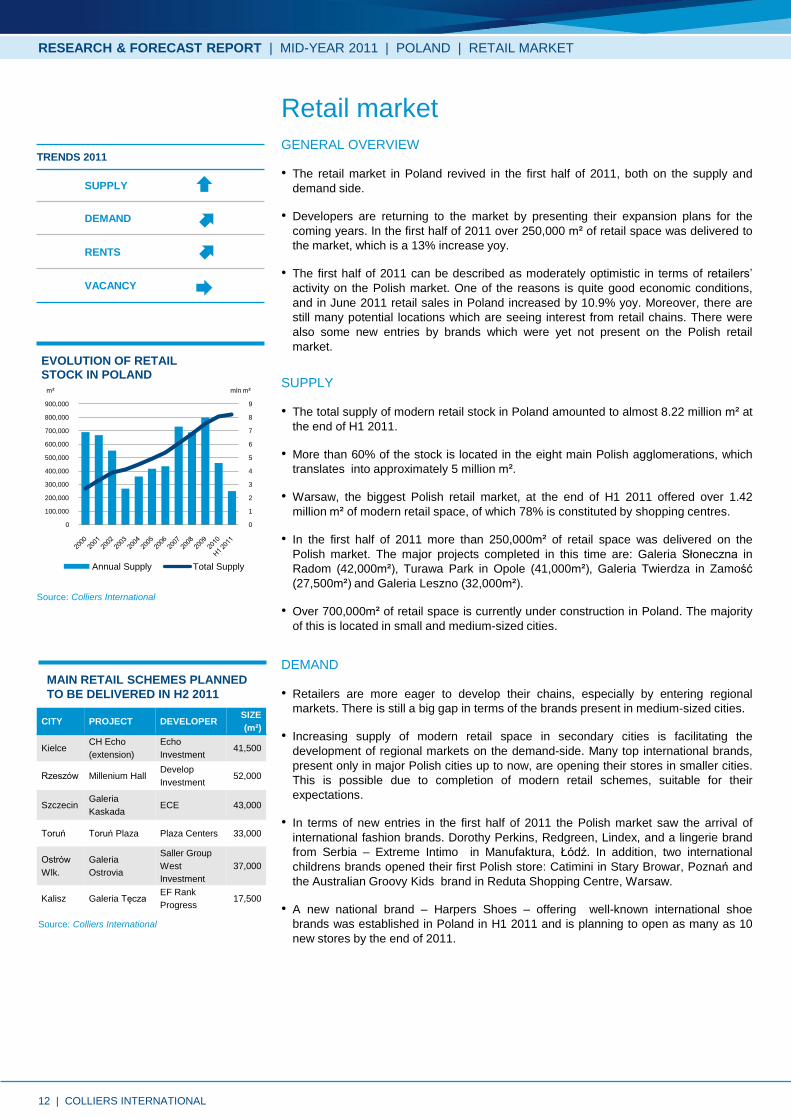
SUPPLY
• The total supply of modern retail stock in Poland amounted to almost 8.22 million m² at
the end of H1 2011.
• More than 60% of the stock is located in the eight main Polish agglomerations, which
translates into approximately 5 million m².
• Warsaw, the biggest Polish retail market, at the end of H1 2011 offered over 1.42
million m² of modern retail space, of which 78% is constituted by shopping centres.
• In the first half of 2011 more than 250,000m² of retail space was delivered on the
Polish market. The major projects completed in this time are: Galeria Słoneczna in
Radom (42,000m²), Turawa Park in Opole (41,000m²), Galeria Twierdza in Zamość
(27,500m²) and Galeria Leszno (32,000m²).
• Over 700,000m² of retail space is currently under construction in Poland. The majority
of this is located in small and medium-sized cities.
DEMAND
• Retailers are more eager to develop their chains, especially by entering regional
markets. There is still a big gap in terms of the brands present in medium-sized cities.
• Increasing supply of modern retail space in secondary cities is facilitating the
development of regional markets on the demand-side. Many top international brands,
present only in major Polish cities up to now, are opening their stores in smaller cities.
This is possible due to completion of modern retail schemes, suitable for their
expectations.
• In terms of new entries in the first half of 2011 the Polish market saw the arrival of
international fashion brands. Dorothy Perkins, Redgreen, Lindex, and a lingerie brand
from Serbia – Extreme Intimo in Manufaktura, Łódź. In addition, two international
childrens brands opened their first Polish store: Catimini in Stary Browar, Poznań and
the Australian Groovy Kids brand in Reduta Shopping Centre, Warsaw.
• A new national brand – Harpers Shoes – offering well-known international shoe
brands was established in Poland in H1 2011 and is planning to open as many as 10
new stores by the end of 2011.
Source: Colliers International
Source: Colliers International
RESEARCH & FORECAST REPORT | MID-YEAR 2011 | POLAND | RETAIL MARKET
Retail market
0
1
2
3
4
5
6
7
8
9
0
100,000
200,000
300,000
400,000
500,000
600,000
700,000
800,000
900,000
EVOLUTION OF RETAIL STOCK IN POLAND
Annual Supply Total Supply
mln m²m²
TRENDS 2011
SUPPLY
DEMAND
RENTS
VACANCY
MAIN RETAIL SCHEMES PLANNED
TO BE DELIVERED IN H2 2011
CITY PROJECT DEVELOPERSIZE
(m²)
KielceCH Echo
(extension)
Echo
Investment41,500
Rzeszów Millenium HallDevelop
Investment52,000
SzczecinGaleria
KaskadaECE 43,000
Toruń Toruń Plaza Plaza Centers 33,000
Ostrów
Wlk.
Galeria
Ostrovia
Saller Group
West
Investment
37,000
Kalisz Galeria TęczaEF Rank
Progress17,500

13 | COLLIERS INTERNATIONAL
VACANCY
• Vacancy levels in 8 major Polish agglomerations range between 0.5-3%.
• The lowest rates are recorded in Szczecin (0.52%) and Warsaw Agglomeration
(0.78%), while the highest vacancy level is noted in TriCity Agglomeration (almost 3%).
RENTS
• In the last few months a slight increase in rents has been observed in selected
locations, especially in the best shopping centres in major Polish cities.
• The highest rental levels are invariably recorded in Warsaw and Kraków. Prime rents
for units up to 100m², leased by fashion retailers can reach EUR 80 /m2 per month in
the best shopping centres in Kraków and EUR 90 /m2 per month in Warsaw.
• Rental levels in shopping centres in Warsaw range between EUR 70-90 /m2 per month
for units of 100m², in regional cities rents these are approximately 40% lower.
• In terms of the best high street locations Warsaw and Kraków are still the leaders. The
rents have remain unchanged and range between EUR 75-95 /m2 per month. Far
lower levels are recorded in Łódź (Piotrkowska Street) or Katowice (3 Maja Street),
where shopping centres attract the majority of retailers at the expense of high street
development.
PROGNOSIS
• In Poland developers‟ activity is significant, and over 700,000m² of retail space is
currently under construction. Developers are aim mainly at small and medium-sized
cities, which still are not saturated in terms of modern retail space.
• By the end of 2011 it is expected that total retail stock will reach 8.6 mln m², as few big
retail schemes are planned to be delivered on the Polish market, e.g. Millenium Hall in
Rzeszów, Galeria Kaskada in Szczecin or Toruń Plaza.
• Retailers‟ activity is likely to increase. The macro situation in Poland is favourable and
retail chains will try to find possible gaps, especially on the markets in medium-sized
cities.
• The trend of retailers switching to the best newly opened retail schemes and high
quality existing shopping centres will continue.
• The vacancy rate should remain mostly unchanged. It will most likely fall in the best
shopping centres, which are targeted by retail chains, but increasing supply will offer
new retail space and stabilise the situation.
• Regarding retailers‟ activity, rental levels are expected to rise slightly, but this is
expected to be focused on the best retail destinations in major Polish cities.
Source: Colliers International
Source: Colliers International
RESEARCH & FORECAST REPORT | MID-YEAR 2011 | POLAND | RETAIL MARKET
SELECTED LEASE TRANSACTION
IN H1 2011
TENANT AREA
(m²)
LOCATION
Rossmann 1,350 Manufaktura, Łódź
Intermarché 2,800 Galeria Leszno
VIP Collection 130 Złote Tarasy, Warsaw
TK Maxx 2,870 RP Matarnia, Gdańsk
Catimini 56 Stary Browar, Poznań
Parfois 105 Krupówki, Zakopane
Massimo Dutti 420 Wzgórze, Gdynia
Groovy Kids 110 Reduta, Warsaw
United Colors of
Benetton123 Janki, Warsaw
0%
1%
2%
3%
VACANCY LEVELS IN MAJOR POLISH AGGLOMERATIONS
This publication does not necessarily deal with every
important topic nor cover every aspect of the topics with
which it deals. It is not designed to provide legal or other
advice.
Key metric definitions
• Prime Headline Capital Value (derived): This is a calculation of market value derived
from the annual prime headline rent divided by the prime (net initial) yield.
• Prime Net Initial Yield: The yield an investor is prepared to pay to buy a Grade A
building, fully-let to high quality tenants at an open market rental value in a prime
location. Lease terms should be commensurate with the market. As a calculation Net
Initial Yield = first years‟ net income/purchase price (prior to deducting fees and taxes)
• Prime Headline Rent: Represents the top open-market tier of rent that could be
expected for a unit of standard size commensurate with demand, of the highest quality
and specification in the best location in the market at the survey date. This should
reflect the level at which relevant transactions are being completed at the time but
need not be exactly identical to any of them, particularly if deal flow is very limited or
made up of unusual one-off deals. If there are no relevant transactions during the
survey period, the quoted figure will be more hypothetical, based on expert opinion of
market conditions, but the same criteria on building size and specification will apply.
• Prime Net Effective Rent: Prime Net Effective Rent is the lowest rent payable, based
on a calculation of the Prime Headline Rent, less the monetary equivalent of the
highest of either the rent-free period or fit-out contribution available at the time of the
survey date.
• Average Headline Rent: Average Headline Rent represents the average open-market
tier of rent that could be expected for a unit of standard size commensurate with
demand, based on a blend of Grade A & B space across a range of locations in the
market at the survey date.
• Total Competitive Stock: Includes the gross leasable floor space in all A and B class
buildings.
• Space Under Active Construction: Represents the total amount of gross leasable
floor space of properties where construction has commenced on a new development
or in existing properties where a major refurbishment/renovation is ongoing at the
survey date.
• Space Under Construction – Inactive: Represents the total amount of gross
leasable floor space of properties where construction had started/where a major
refurbishment/renovation was ongoing, but activity has since stopped for a period of 3
months or longer.
• Vacant Space: The total gross leasable floor space in existing properties that meet
the Competitive Stock definition, which is physically vacant and being actively
marketed at the survey date. Space should be available for immediate occupation.
COLLIERS RESEARCH
Colliers Research Services Group is recognized as a knowledge leader in the
commercial real estate industry, providing clients with valuable market intelligence to
support business decisions. Colliers research analysts provide multi-level support across
all property types, ranging from data collection to comprehensive market analysis.
Across the CEE-SEE-Russia region of EMEA, Colliers researchers regularly collect and
update data on key real estate metrics, set to consistent definitions. This information is
constantly managed using databases, enabling staff to readily produce analysis on key
regional markets including supply, demand, absorption, pricing and transaction data on
capital markets and the office, industrial and retail sector. In most CEE-SEE-Russian
markets, the office definitions used are consistent with those set out by the CEE
Research Forum – an umbrella group, of which Colliers is a founding member -
established to ensure consistent research methodologies are used, bringing greater
transparency and reliability to the analysis of real estate markets in the region.
512 offices in
61 countries on
6 continents
United States: 125
Canada: 38
Latin America: 18
Asia Pacific: 214
EMEA: 117
• $1.5 billion in annual revenue
• 978.6 million square feet under
management
• Over 12,500 professionals
CONTACT:
Research & Consultancy
Dominika Jędrak
Director
Mobile: + 48 666 819 242
Email: [email protected]
COLLIERS INTERNATIONAL POLAND
Pl. Piłsudskiego 3
00-078 Warsaw
Tel. + 48 22 331 78 00
www.colliers.com
RESEARCH & FORECAST REPORT | MID-YEAR 2011 | POLAND | KEY METRIC DEFINITIONS
www.colliers.com

Accelerating success.www.colliers.com