2002 annual report - asian banks bank 2002...in retrospect, the overall economic environment in 2002...
TRANSCRIPT

2002 ANNUAL REPORT
FUBON COMMERCIAL BANK
169, Jen Ai Road, Section 4 Taipei, Taiwan
Tel: (02) 2771-6699

I. Corporate Spokesperson Lin Jiu-Liang
Senior Vice President Tel: (02) 2271-6699 2. Contact Information – Corporate Headquarter and Branches Please see page 87 3. Transfer Agency Registrar & Transfer Dept., Fubon Securities Co., Ltd. 7F, 138, Ming Sheng E. Road, Sec. 3, Taipei, Taiwan Tel:(02)2717-1033 4. Credit Rating Agency Taiwan Ratings Corporation 23F, 100, Roosevelt Road, Section 2, Taipei, Taiwan Tel:(02)2368-8277 5. Auditors Huang Min-Chuan, Ho, Chih-Ru Deloitte & Touche 5F, 102, Kuang Fu S. Road, Taipei, Taiwan Tel: (02) 2751-8866 6. Corporate Website:
www.fubonbank.com.tw

Table of Contents
0 Item
Page
Cover 1
Inside Cover 2
Table of Contents 3
I. Message to the shareholders 4
II. Company Profile 6
1. Company Introduction 6
2. Company Structure 9
3. Company Capitalization & Shareholdings 14
III. Operating Profile 15
1. Business Scope 15
2. Market & Business Conditions 16
3. Work Force 27
4. Risk Management 28
IV. Operation and Capital Utilization Plan 30
1. Current Year Operating Plan 30
2. Research & Development 35
V. Financial Statement 37

MESSAGE TO SHAREHOLDERS In retrospect, the overall economic environment in 2002 was uncertain, characterized by a volatile domestic stock market and foreign exchange market. Under such unfavorable conditions, Fubon Bank launched its well defined business strategy by developing its niche market with a view to emerge as the leading brand in the market and shake off the yoke of acute competition. This helped Fubon to project the corporate image of “Fubon Bank is No. 1”.
First of all, Fubon Bank has successfully acquired three hundred thousand credit card customers in good standing under its “No Annual Fee Platinum Card” innovative strategy rather than playing the numbers game in interest rates as the others in the industry did. It is because of its innovative strategy that Fubon Bank has successfully promoted its credit card business with the issuance of 2 million credit cards in 2002, an increase of 60% from the 1.2 million cards of 2001. This enabled Fubon to emerge as one of the top three credit card issuers in Taiwan.
In the area of consumer financing, Fubon Bank did not compete with the other financial institutions in unveiling the product of “adjustable rate mortgage”. Instead, Fubon targeted the market of rational buyers, and has been the first bank to launch the “Fixed Rate Mortgage”. Similarly, Fubon is also the first bank to launch the “adjustable rate personal loan” product. These two products helped Fubon to sustain stable growth in gaining new accounts and profits, and hit right into the mark of the niche market. In addition, Fubon Bank is aware of the high demand of financing from small enterprises. Therefore, it founded the “Small Business Finance Department” in September 2002, and kicked off the new product of “Boss Account”. In just a matter of four months, Fubon Bank has drawn loans down by up to NT$2 billion. This has cleared up the cloudy sky over corporate banking.
In 2003, Fubon Bank will persist to uphold its spirit of innovation, and will seek growth from its current establishment. Further, Fubon Bank will integrate all the resources of its subsidiaries for integrated marketing in order to yield synergy. In practice, Fubon will act in the following three directions:
1. Work proactively with Taipei Bank in the integration of back-office and mid-office operation for resource sharing and integrated marketing.
2. After the grand opening of “Fubon Keelung Road Financial Center” in July 2002, Fubon Bank managed to continue its working relationship with Fubon Securities in sharing facilities for integrated banking and securities services. Besides, Fubon seeks to step up its training of the banking staff so that they are capable of marketing in insurance, securities and banking.
3. Share database resources with its subsidiaries for customer relationship management in order to maximize cost-effectiveness and provide a full-range of financial services.
Despite the weak recovery of the global economy, Fubon Bank yielded good performance in 2002. The return on equity before loan loss provisioning of Fubon Bank has reached the international standard of 27.43% with pre-provision pre-tax profit at NT$7.78 billion, an increase of more than 100% from that of 2001. For improving its asset quality, Fubon Bank has declared
- 4 -

recognized loss of NT$ 4.368 billion in the disposition of non-performing loans to asset management companies. At the same time Fubon Bank also increased the loan loss provision of NT$ 2.64 billion. This adjustment made the pre-tax profit at NT$745 million, but made the coverage rate for overdue loans up to 47%, which helped to buttress the foundation of Fubon Bank for sustained growth.
We therefore would like to express our gratitude to our shareholders and leaders in other sectors, and wish our customers and shareholders to continue their guidance and encouragement. We will try with the best of our efforts for the best performance.
- 5 -

I. Company Profile 1. Introduction Established in 1992, Fubon Commercial Bank (FCB) is one of the 16 new banks licensed to engage in banking activities in Taiwan following the liberalization of the industry. Since its inception, FCB has grown into one of the leading and most profitable private commercial banks in Taiwan. As of December 19, 2001, Fubon Financial Holding Company Ltd. obtained 100% of the shares outstanding of FCB through a share swap. In accordance with Taiwan banking regulations, FCB’s shares were de-listed from the Taiwan Stock Exchange on the same date. Milestones in FCB history are summarized as the following:
7/89In response to government policies of liberalization and internationalization, Chairman Tsai Wan-tsai perceived the need to raise domestic standards of financial services. He decided to found a bank that would provide high-quality financial services to business and the public. He gathered other like-minded business leaders to organize the Fubon Commercial Bank.
1/92FCB’s founding meeting and first shareholders’ meeting was convened at the Chung Tai Hotel. The first Supervisors and Board of Directors were elected.
4/92Four business units launched operations: the Business Department, Savings Department, Min Sheng Branch and Jen Ai Branch. FCB was now officially open for business.
5/92The Kaohsiung and Tao Yuan Branches opened. 6/92The Taichung Branch opened.
12/92Credit card business was launched. 2/93Telephone banking was launched.
11/93 The Tu Cheng Branch opened. 12/93The Sung Shan, Chung Li, Tainan and Feng Shan Branches opened; and the Trust
Department was established. 7/94The International Department began operations.
10/94The Ling Ya Branch opened. 11/94The Chia Yi and San Chung Branches opened. 12/94The Pa Teh Branch opened.
4/95The main bank headquarters and the business Department moved to a new location in the Fubon Building on Jen Ai Rd., and its original location of the Business Department was renamed the Chung Shan Branch. The Personal Banking Center was established, making FCB the first of post-liberalization banks to offer specialized personal financial service. Automatic banking was also launched.
5/95FCB was the first post-liberalization bank to officially join the Trade-Van FEDI. 8/95The Offshore Banking Branch (OBU) was set up.
11/95The Pan Chiao Branch opened. 12/95The San Min Branch opened.
1/96The Pei-Taichung Branch opened.
2/96A new program was launched combining mortgage and life insurance. The Fubon Group home page was put onto the World Wide Web.
4/96O.T.C. trading began for FCB stock. The Chien Kuo Branch opened.
- 6 -

5/96FCB cooperated with the Taiwan Power Company to become the first bank offering telephone payment of electric bills. The PC banking service system went into operation.
7/96FCB cooperated with the Bureau of Motor Vehicles to provide telephone payment of the automobile fuel tax.
8/96FCB cooperated with the water utility to provide telephone payment of water bills.
10/96"Mixed Demand/Time Deposit Foreign Currency Accounts" launched to allow customers more diverse choices in financial management.
10/96The Hsin Chu Branch opened. 1/97The Hsin Tien Branch opened. 3/97Non-discretionary trust fund by lump sum/cost-averaging method investment in
domestic trust fund was launched. 3/97The Tien Mu Branch opened. 9/97The Hsi Chih Branch opened.
10/97The Min Sheng Branch became a designated foreign exchange bank. 11/97The International Department launched non-delivery forward operations. The
Yung Kang Branch opened. 12/97A designated foreign exchange bank branch was established in Kaohsiung. The
Huei Long Branch opened. 1/98The Cheng Chung Branch opened. 8/98 The Savings Department and Jen Ai Branch became designated foreign exchange
banks. 10/98FCB shares were officially listed on the Taiwan Stock Exchange on
10/1/98The Mu Ja and Hsin Chuang Branches began operations. 11/98The Hsin Ying Branch began operations. 12/98The Ping Tung and Chien Chen Branches began operations.
2/99 The Credit Card Center was reorganized as the Credit Card Department, and the Personal Finance Department was established.
5/99The 1999 Shareholders Meeting was convened and Yu, Cheng S. was elected as Chairman.
8/99 The Taichung Branch became a designated foreign exchange bank. 10/99The Ministry of Finance gave special dispensation for FCB, Acer, and Mastercard
Taiwan to jointly conduct Mondex trial operations. FCB and Taiwan Cellular Co. pioneered the launch of mobile banking.
11/99The Tun Nan Branch began operations. 12/99 The Electronic Banking Department was established.
3/00 FCB became Taiwan’s first bank to earn Ministry of Finance approval to launch Internet Banking services. The Hsuang Ho Branch was established.
5/00 Fubon Group and Citigroup announced a Strategic Alliance. 7/00 FCB set a new precedent by issuing electronic gift certificates in cooperation with
the SOGO department store. Depositors and Credit Cards Broke the Million Mark.
10/00FCB introduced its on-line website payment services. 11/00 The All-in-one Fubon Money Account was launched, integrating all of a
customer's dealinged with FCB into a single convenient account. 03/01 The Yuan Lin Branch opened. JCB Credit Card services were launched. 05/01The Platinum credit card was introduced. 06/01The Nei Hu Branch opened. 07/01Corporate reorganization plans were implemented.
- 7 -
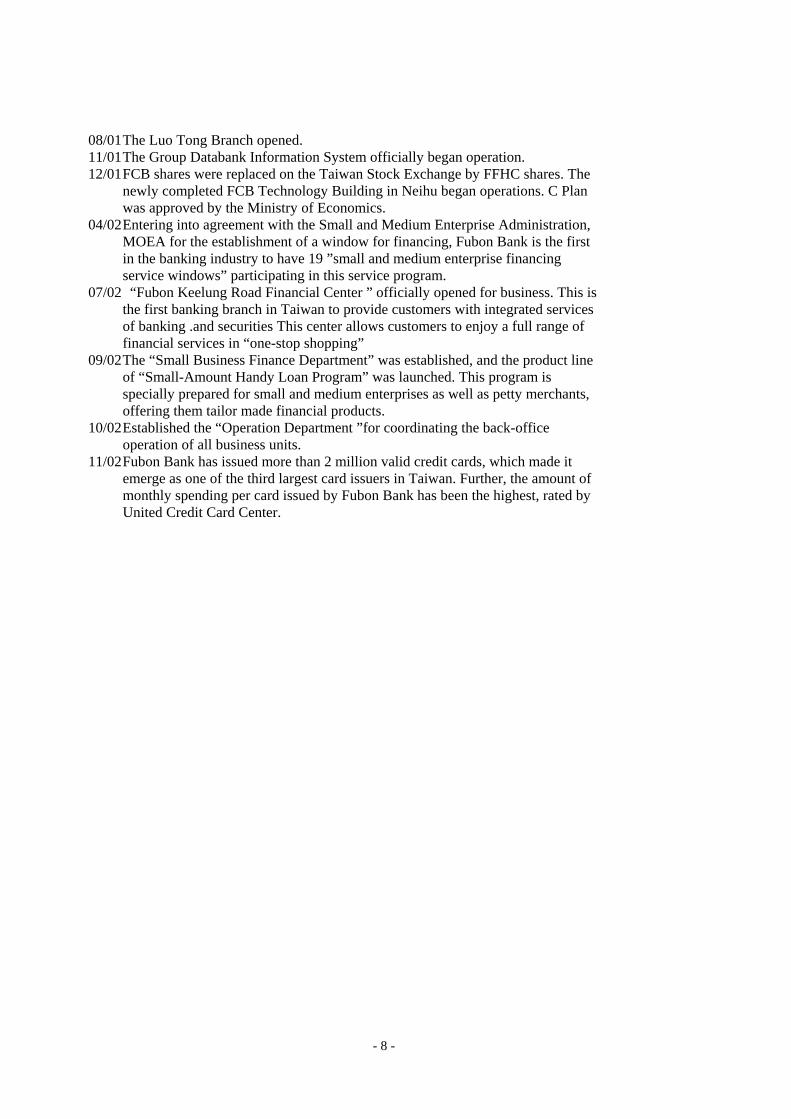
08/01The Luo Tong Branch opened. 11/01 The Group Databank Information System officially began operation. 12/01FCB shares were replaced on the Taiwan Stock Exchange by FFHC shares. The
newly completed FCB Technology Building in Neihu began operations. C Plan was approved by the Ministry of Economics.
04/02Entering into agreement with the Small and Medium Enterprise Administration, MOEA for the establishment of a window for financing, Fubon Bank is the first in the banking industry to have 19 ”small and medium enterprise financing service windows” participating in this service program.
07/02 “Fubon Keelung Road Financial Center ” officially opened for business. This is the first banking branch in Taiwan to provide customers with integrated services of banking .and securities This center allows customers to enjoy a full range of financial services in “one-stop shopping”
09/02The “Small Business Finance Department” was established, and the product line of “Small-Amount Handy Loan Program” was launched. This program is specially prepared for small and medium enterprises as well as petty merchants, offering them tailor made financial products.
10/02Established the “Operation Department ”for coordinating the back-office operation of all business units.
11/02Fubon Bank has issued more than 2 million valid credit cards, which made it emerge as one of the third largest card issuers in Taiwan. Further, the amount of monthly spending per card issued by Fubon Bank has been the highest, rated by United Credit Card Center.
- 8 -

2. Company Structure (1) Organization Chart
Shareholder’s Meeting
Board of Directors Chairman Directors
President
Consumer Banking Group
Corporate Banking Group
Financial Services Group
Treasury Department Office Administration Group
Corporate Banking Department
Corporate Credit Department
Project Finance Department
Consumer Banking Department
Consumer Credit Department
Financial Services Department
International Banking Dept.
Electronic Banking Department
Customer Service Center
Trust Department
Credit Card Department
Accounting Department
Human Resources Department
Planning Department
IT Department
Office Administration Department
Operation Department
Small-Amount Handy Loan C
Small Business Finance Dept.
Asset-Liability Management Committee Faculty Evaluation
Committee Credit Evaluation
Committee Trust Asset
Evaluation Committee Work Rationalization
Promotion Committee Auditing Department
Supervisors
Regional Centers Regional Centers Regional Centers
39 Branches
- 9 -
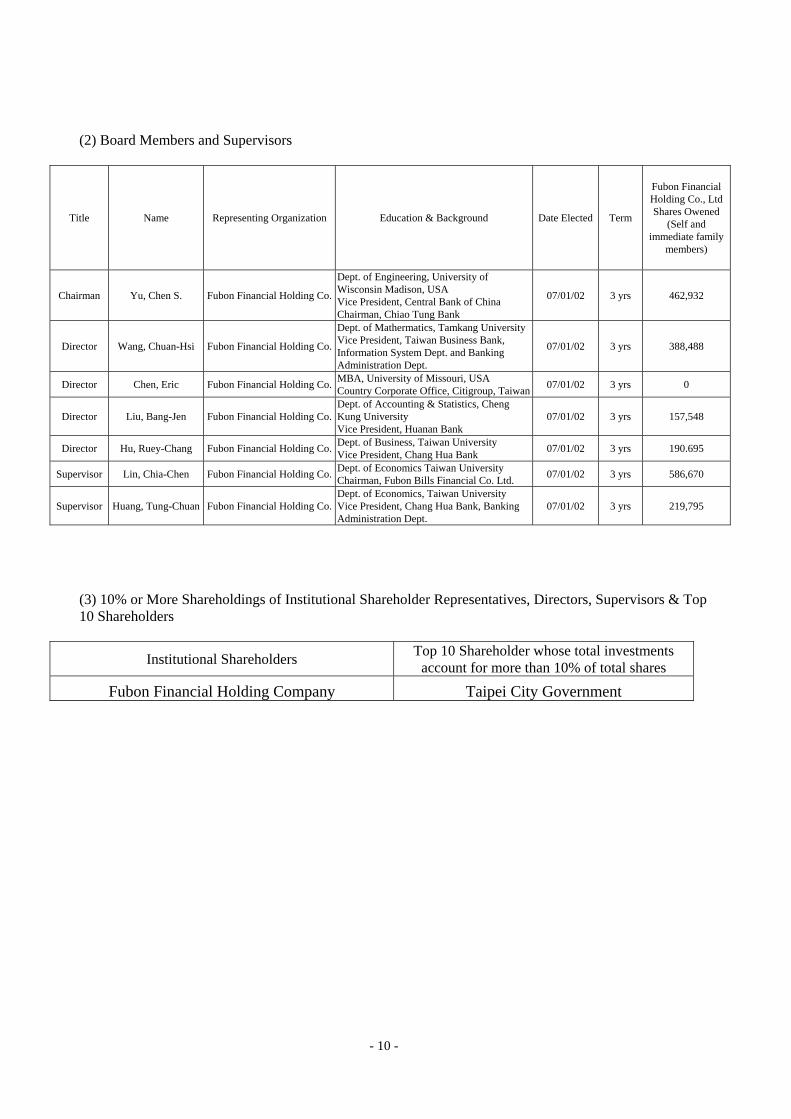
(2) Board Members and Supervisors
Title Name Representing Organization Education & Background Date Elected Term
Fubon Financial Holding Co., Ltd Shares Owened
(Self and immediate family
members)
Chairman Yu, Chen S. Fubon Financial Holding Co.
Dept. of Engineering, University of Wisconsin Madison, USA Vice President, Central Bank of China Chairman, Chiao Tung Bank
07/01/02 3 yrs 462,932
Director Wang, Chuan-Hsi Fubon Financial Holding Co.
Dept. of Mathermatics, Tamkang University Vice President, Taiwan Business Bank, Information System Dept. and Banking Administration Dept.
07/01/02 3 yrs 388,488
Director Chen, Eric Fubon Financial Holding Co. MBA, University of Missouri, USA Country Corporate Office, Citigroup, Taiwan 07/01/02 3 yrs 0
Director Liu, Bang-Jen Fubon Financial Holding Co.Dept. of Accounting & Statistics, Cheng Kung University Vice President, Huanan Bank
07/01/02 3 yrs 157,548
Director Hu, Ruey-Chang Fubon Financial Holding Co. Dept. of Business, Taiwan University Vice President, Chang Hua Bank 07/01/02 3 yrs 190.695
Supervisor Lin, Chia-Chen Fubon Financial Holding Co. Dept. of Economics Taiwan University Chairman, Fubon Bills Financial Co. Ltd. 07/01/02 3 yrs 586,670
Supervisor Huang, Tung-Chuan Fubon Financial Holding Co.Dept. of Economics, Taiwan University Vice President, Chang Hua Bank, Banking Administration Dept.
07/01/02 3 yrs 219,795
(3) 10% or More Shareholdings of Institutional Shareholder Representatives, Directors, Supervisors & Top 10 Shareholders
Institutional Shareholders Top 10 Shareholder whose total investments account for more than 10% of total shares
Fubon Financial Holding Company Taipei City Government
- 10 -

(4) Senior Management
Title Name Educational/ Professional Experience Term Starting Date
Holding Company
Shares Owned
Holding Company
Shares Owned By Immediate
Family
President Wang,Chuan-Hsi
Tam Kang University, Mathematics Dept. Vice President, Taiwan Business Bank Vice President, Electronic Data System Taiwan Corp.
01/11/96 312,037 76,451
Executive Vice President, Kaoshiung Pintong Regional Center of Corporate Banking
Hu, Ruey-Chang
National Taiwan University, Business Department Vice President, Chang Hua Bank 30/04/01 190,695 0
Executive Vice President, Corporate Banking Group Liu, Bang-Jen
Cheng Kung University, Accounting & Statistics Dept. Vice President Hua Nan Bank
30/04/01 157,548 0
Chief Auditor Li, Su-May
Cheng Chi University Banking Department Vice President & Deputy Chief Economist, Cocurrently Chief of Credit Center, The International Commercial Bank of China
16/04/02 0 0
Assistant Executive VP, Financial Services Group Kao, Chao-Yang National Taiwan University, Law Department
Manager, Taiwan Small-Medium Commercial Bank 30/04/01 15,058 0
Assistant Executive Vice President, Office Administration Group
Huang, Kuo-Tai
National Cheng Chi University, Graduates School of Statistics Division Chief, Taiwan Business Bank 30/04/01 59,175 215,234
Assistant Executive VP, Consumer Banking Group Chen, Cliff Tam Kang University, Hydraulic Engineering Dept.
Vice President, Citibank, Taiwan 30/04/01 7,730 1,308
Senior Vice President, Office Administration Department
Lin, Jiu-Liang National Taiwan University, Graduate School of Finance Vice President, T.C. Bank
30/04/01 28,457 0
Vice President, Accounting Office Tseng, Ding-Jye Cheng Chi University, Banking Department
Manager, TNSoong & Co., TNS 17/04/00 10,268 0
Senior Vice President, Information Technology Office
Huang, Ei Sue Soochow University, Accounting Department System Analyst, Szi Ping Company, Taiwan Small-Medium Business Commercial Bank
17/04/00 151,192 0
Senior Vice President, Human Resource Office Yeh, Yih-Wen Chinese Culture University, Labor Graduate School
Junior Specialist of Hua Nan Bank 01/04/98 67,456 0
Assistant Executive VP, Credit Card Division Chang, Cheng-Chih
National Ocean University Shipping & Transportation Management Vice President, Chung Shing Bank
01/01/00 95,812 2,141
Senior Vice President, Electronic Banking Department
Huang, Johnnathan
National Central University, Mathematics Dept. Manager, Center of Data Operation, Sysnet Co. Ltd 22/12/99 120,939 0
Vice President, Planning Department Yao, Sunny Taiwan University, Economics Dept.
Asst Vice President, Taiwan business Bank 19/08/02 61,007 22,124
Senior Vice President Treasury Division Chung, Sylvia
Capital English Commercial College, International Finance Dept. Senior Vice President, Taishin International Bank
18/03/02 0 0
Vice President, Financial Service Department Chen Yifen MBA, University of California, Berkely, USA
Vice President, Citibank, Taiwan 12/08/02 59,466 0
Vice President, Centralized Processing Department
Huang, His-Hwa Taipei Business Junior College, Accounting & Statistics Dept. Junior Specialist, Hua Nan Bank
07/01/02 113,172 7,218
Vice President, Corporate Banking Department
Lin, Hsih-Yao Miami University of Ohio, Graduate School of Business Administration, Senior Specialist, Farmers Bank of China
07/01/02 5,443 0
Senior Vice President, Corporate Credit Department
Chiu, Hsien-Long Extension School, Taipei Business College, International Trade Department Junior Specialist, Hua Nan Bank
09/09/98 90,788 17,618
- 11 -

Senior Vice President, Small Business Finance Department/ Project Finance Department
Hong, Chu-Min
Chia Yi Business Vocational School, General Business Dept. Vice Devision Chief, Hua Nan Bank 17/09/98 13,881 0
Senior Vice President, Taipei Region of Small-Amount Handy Loan Center
Tsai, Chao-Hsiung
China Business College Business Administration Department Manager, Hua Nan Bank 15/10/02 45,640 0
Senior Vice President, Tao Yuan Region of Small-Amount Handy Loan Center / Pa The Branch
Wei, Tzu-Feng
Kwang Fu High School Associate Vice President, Taiwan Business Bank 15/10/02 85,797 0
Vice President, Kaohsiung & Pintung Region of Small-Amount Handy Loan Center / Chien Chen Branch
Cheu, Auten
Fong Chia University, Accounting Department Manager, Chang Hua Bank
15/10/02 9,536 0
Assistant Executive Vice President, Taipei Regional Center Ⅰ of Corporate Banking/ Business Dept.
Guu, Daw-Shin
Taiwan University, Agricultural Economics Dept. Vice Division Chief, Hua Nan Bank 30/04/01 10,877 0
Senior Vice President, Taipei Regional Center Ⅱof Corporate Banking / Min Sheng Branch
Chao, Philip
Chung Hsing University, Business Administration Dept. Specialist, Citibank, Taiwan 30/04/01 70,794 0
Senior Vice President, Taipei Regional Center Ⅲ of Corporate Banking / Pan Chiao Branch
Peng Min-Tsai
Extension College of NCCU, Administration Dept. Vice President, Taiwan Business Bank 01/01/02 30,510 0
Senior Vice President, Taoyuan Regional Center of Corporate Banking/ Tao Yuan Branch &環北分行
Chou, Tzu-Show
Extension College of NCCU, Administration Dept. Vice President, Taiwan Business Bank 01/01/02 125,202 0
Senior Vice President, Hsin Chu Regional Center of Corporate Banking / Hsin Chu Branch
Pan, Yu-Juce
Extension School of Taipei Business College, International Trade Dept. Associate Vice President, Hua Nan Bank 01/01/02 65,168 1,326
Senior Vice President, Taichung Regional Center of Corporate Banking /Taichung Branch
Yen, Tsai-Yuan
National Cheng Kung University, Statistics Dept. Vice President, E. Sun Bank 30/04/01 9,928 0
Senior Vice President, Tainan Regaional center of Corporate Banking / Tai-nan Branch
Chen, Shiao-Yiao
National Chen Chi University, Accounting & statistic Dept. Vice President, E. Sun Bank 30/04/01 12,678 0
Vice President, Consumer Credit Dept. / Taoyuan Regional Center of Consumer Banking
Lin, Pei-Yuan
Tam Kang University Banking & Insurance Dept. Vice President, Bao Dao Bank 30/04/01 10,665 0
Vice President, Taipei Regional Center Ⅰof Consumer Banking
Yao, Fong-Tse Taipei Business College, Acounting Dept. Vice Division Chief, Hua Nan Bank 30/04/01 141,235 0
Vice President, Taipei Regional Center Ⅱof Consumer Banking /Tien Mu Branch & San Chung Branch
Lien, Jimmy
University of Northern Illinois, Graduate School of Computer Science Assistant Manager, AnTai Bank 01/01/02 32,473 65
Vice President, Taichung Regional Center of Consumer Banking /Northern Taichung Branch
Hsiao, Wen-Chi
Taichung Business College, Business Admin Dept. Assistant Manager, Chang Hua Bank
07/01/02 216,769 8,175
Senior Vice President, Tainan Regional Center of Consumer Banking/ Yung Kang Branch
Li, Cheng-Hsiung
Tai Na Business Vocational senior High School, Associate Vice President, Hua Nan Bank 30/04/01 52,159 0
- 12 -

Vice President, Kaoshiung Regional Center of Consumer Banking
Tsay, Her-Cherng Extension College of National Cheng Kung University, Statistics Department Assistant Manager, Chang Hua Bank
30/04/01 0 2,298
Senior Vice President, Trust Department Pan Esther
Taipei Business College, Banking & Insurance Dept.Soochow University, Economics Dept Associate Vice President, Taiwan First Investment & Trust Co.
12/08/02 76,308 0
Vice President, International Banking Department/ OBU Department
Chu, Chuan
Chung Shing University, Finance & Tax Dept., Assistatn Vice President, Taiwan Business Bank 19/08/02 50,380 0
Senior Vice President, Chung Shan Branch & Nan-King East Branch
Liao, An-Long National Chung Shing University, Law Dept., Division Chief, Chang Hua Bank 01/01/00 85,353 0
Senior Vice President, Jen-Ai Branch Lo, Wen-Chih Chung Li Vocational High School, Commerce Dept.
Junior Specialist, Hua Nan Nan Bank 01/04/93 66,258 4,212
Senior Vice President, Kaoshiung Branch Teng, Min-Chang Fong Chia University, Accounting Dept.
Manager, Hua Nan Bank 30/04/01 121,250 0
Vice President, Sung Shan Bank
Huang, Yao-Kwuang
Tam Kang University, Banking & Insurance Dept., Division Chief, Taiwan Business Bank 07/01/02 58,375 0
Vice President, Tu Cheng Branch Lo, Juei-Ding
Extension School of Taipei Business College, Business Administration Department Junior Specialist, Hua Nan Bank
07/01/02 41,718 0
Vice President, Chung Li Branch Juang, Chorng-Shi Extension College of NCCU, Administration Dept.
Junior Specialist, Hua Nan Bank 30/04/01 60,469 0
Vice President, Jia Yi Branch Lee, Lanny
National Ocean University Shipping & Transportation Management Dept. Vice President, E.Sun Bank
07/03/00 39,586 6,902
Vice President, Jia Yi Branch Juang, Ming-Shing Ping Tung Senior Vocational School
Manager, Hua Nan Bank 30/06/98 69,763 0
Senior Vice President, San Min Branch Huang, Wen-Shiung Soochow University, Law Dept.
Vice President, E. Sun Bank 04/01/00 714 98,507
Vice President, Chien Kuo Branch Lin Spencer S.T. Tam Kang College, Banking & Insurance Dept.
Vice President, Taiwan First Investment & Trust Co. 30/04/01 55,581 14,235
Vice President, Hisn Chu Branch
Chen, Tang-Lie Chinese Culture University, International Trade Dept. Junior Specialist, Chang Hua Bank
01/01/97 123,346 0
Vice President, His Chih Branch Hsiao, Cheng-Feng
Extension School of Taipei Business College, Banking and Insurance Dept., Manager, Hua Nan Bank
23/09/97 72,213 0
Vice President, Cheng Chung Branch & Tun Nan Branch
Chen, Hui-Yu Tulane University, Graduate School Business Administration Manager, Chang Hua Bank
01/01/02 76,134 0
Manager, Mu Ja Branch
Kao, Hsueh-Ping
Fong Chia University, Accounting Dept. 24/12/02 2,658 0
Vice President, Hsin Chuang Branch Li, Bud Soochow University, Business Administration Dept.,
Associate Vice President, E. Sun Bank 28/10/98 58,426 3,612
Vice President, Hsin Ying Branch Tu, A-Ching
Distance Junior College of Taipei Business Junior College, Business & Administration Dept. Assistant Manager, Farmer’s Bank
30/04/01 59,647 0
Vice President, Pin Tung Branch Kuo, Long-Chao San Shin Vocational School, Business Dept.
Manager, Hua Nan Bank 07/12/98 94,638 0
Vice President, Chien Chen Branch Liao, Tsung-Ming
Taichung Business College, Business Administration Dept. Junior Specialist, Chang Hua Bank
15/10/02 31,935 0
Vice Presidetn, Yuan Lin Branch Yang, Ju-Ping Fong Chian University, Banking & Insurance Dept.
Specialist of Training Center, Chang Hua Bank 14/09/00 105,917 0
Vice President, Luo-Tung Branch Yang, Bruce National Taiwan University, Business Dept.
Division Chief, Hua Nan Bank 30/04/01 113,771 0
Vice President, Nei-Hu Branch Chen, Alex Chung Shing, University, Economics Dept.,
Vice President, Bao Dao Bank 30/04/01 7,142 0
Manager, Keelung Road Branch Hsieh, Gloria
Shih Chien University, Accounting and Statistics Dept. Manager, Citi Bank, Taiwan
03/08/02 8,021 0
- 13 -

3.Company Capitalization and Shareholdings (1) Capital Item
Item Issued Unissued TotalCommon Stock 21,857,366,970 0.00 21,857,366,970
Total 21,857,366,970 0.00 21,857,366,970
Authorized Capital
(2) Shareholdings
ParValue/ # of Amount # of Amount Other Source
Date Share Shares (NT$) Shares (NT$) Source of Capitalization Other1992/3/10 10 1,000,000,000 10,000,000,000 1,000,000,000 10,000,000,000 Founding Capital
1995/7/7 10 1,035,718,229 10,357,182,290 1,035,718,229 10,357,182,290Capitalization of Retained Earnings:NT$357,182,290
- Approved by(84)Doc.#37601 ofTaiwan Ministry of Finance,7.1.95
1996/8/15 10 1,073,114,521 10,731,145,210 1,073,114,521 10,731,145,210Capitalization of Retained Earnings:NT$373,962,920
- Approved by(85)Doc.#41681ofTaiwan Ministry of Finance,7.1.95
1997/8/30 10 1,322,899,392 13,228,993,920 1,322,899,392 13,228,993,920
Equity Issue of NT$2,000,000,000;Capitalization of Retained Earnings:NT$497,848,710
- Approved by(86)Doc.#46218 ofTaiwan Ministry of Finance,6.26.97
1998/7/17 10 1,458,034,367 14,580,343,670 1,458,034,367 14,580,343,670
Capitalization of Retained Earnings:NT$1,020,624,900; Capitalization ofReserves: NT$330,724,850
- Approved by (87)Doc.#48477 ofTaiwan Ministry of Finance,6.4.98
1999/11/8 10 1,575,764,744 15,757,647,440 1,575,764,744 15,757,647,440
Capitalization of Retained Earnings:NT$812,795,180; Capitalization ofReserves: NT$364,508,590
- Approved by (88)Doc.#87118 ofTaiwan Ministry of Finance,10.1. 99
2000/8/7 10 1,734,572,033 17,345,720,330 1,734,572,033 17,345,720,330
Capitalization of RetainedEarnings:NT$1,173,646,760:Capitalization of Reserves:NT$414,426,130
- Approved by (89)Doc.#58907 ofTaiwan Ministry of Finance,7.7.00
2000/12/13 10 2,044,572,033 20,445,720,330 2,044,572,033 20,445,720,330Equity Issue of NT$3,100,000,000,Issue of Foreign Depositary Receipt
- Approved by (89)Doc.#58907 ofTaiwan Ministry of Finance,12.4.00
2001/9/3 10 2,185,736,697 21,857,366,970 2,185,736,697 21,857,366,970
Capitalization of Retained Earnings:NT$705,823,320; Capitalization ofReserves: NT$705,823,320
- Approved by (90)Doc.#144064of Taiwan Ministry of Finance,7.10.01
Authorized Capital Paid-in Capital Comment
(3) Issuance of financial bonds
The Board of Fubon Bank resolved on July 12, 2002 to apply with the Finance Bureau of the Ministry of Finance for the issuance of 10 billion NTD worth of financial bonds. The application has been approved by the Ministry of Finance on September 4 in the Tai.chai.zon (II) tzu.di No. 0910041374 Letter. Fubon Bank had released the first issue of second priority finacial bonds at 5 billion NTD on October 14 and 15, 2002, and the second issue of first priority financial bonds at 5 billion NTD on December 19 and 27, 2002. The total value of bonds oustanding after the two issues was at 10 NTD. Further, Fubon Bank has applied for trading the said bonds in the OTC market.
- 14 -
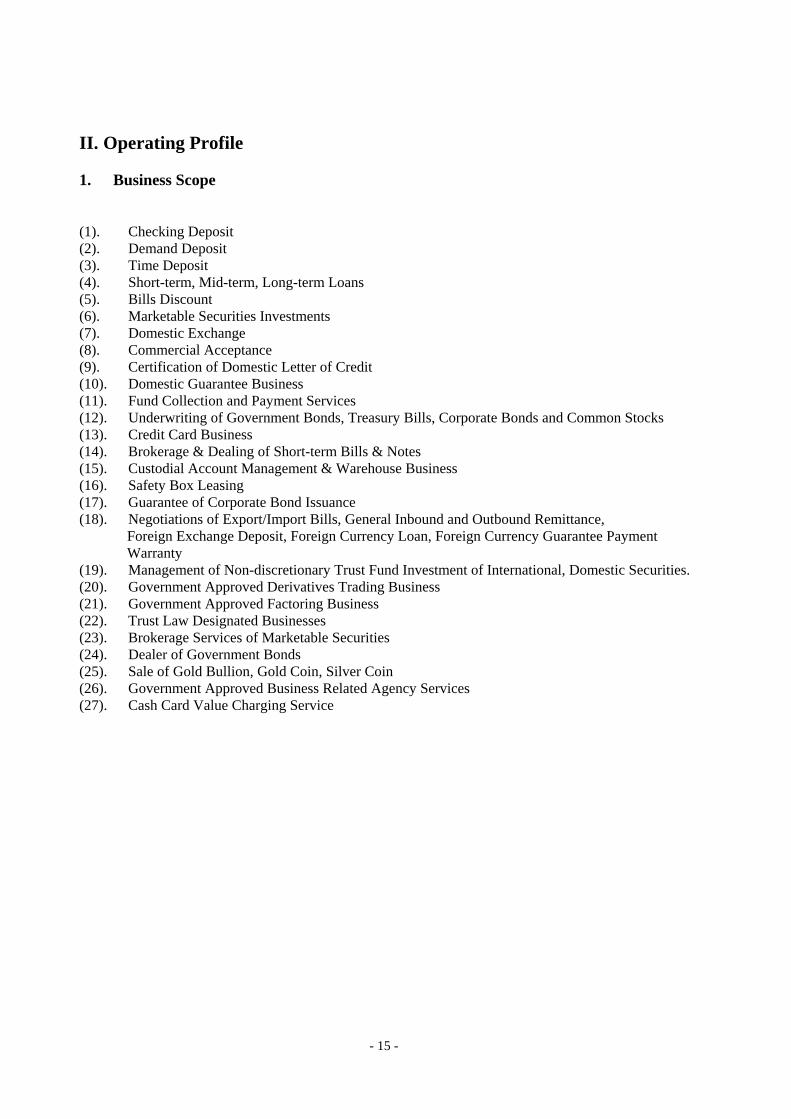
II. Operating Profile 1. Business Scope (1). Checking Deposit (2). Demand Deposit (3). Time Deposit (4). Short-term, Mid-term, Long-term Loans (5). Bills Discount (6). Marketable Securities Investments (7). Domestic Exchange (8). Commercial Acceptance (9). Certification of Domestic Letter of Credit (10). Domestic Guarantee Business (11). Fund Collection and Payment Services (12). Underwriting of Government Bonds, Treasury Bills, Corporate Bonds and Common Stocks (13). Credit Card Business (14). Brokerage & Dealing of Short-term Bills & Notes (15). Custodial Account Management & Warehouse Business (16). Safety Box Leasing (17). Guarantee of Corporate Bond Issuance (18). Negotiations of Export/Import Bills, General Inbound and Outbound Remittance,
Foreign Exchange Deposit, Foreign Currency Loan, Foreign Currency Guarantee Payment Warranty
(19). Management of Non-discretionary Trust Fund Investment of International, Domestic Securities. (20). Government Approved Derivatives Trading Business (21). Government Approved Factoring Business (22). Trust Law Designated Businesses (23). Brokerage Services of Marketable Securities (24). Dealer of Government Bonds (25). Sale of Gold Bullion, Gold Coin, Silver Coin (26). Government Approved Business Related Agency Services (27). Cash Card Value Charging Service
- 15 -

2. Marketing & Business Conditions (1) Deposits Plummeting interest rates in 2002 had great impacts on investors’ investment preference as well as corporate capital flow. Aiming at a Reserve Requirement Ratio of 65%, we fully geared up to generate cheap and stable long-term funding rather than to provoke saving and chequing accounts and redirected our strategy from institution-oriented to consumer-oriented. Despite of a little slip in terms of total deposits over the previous year due to decreasing time deposits, demand deposits showed leaping growth and accounted for 38.50% of total deposits, representing unmatched competitive advantage. Deposit Volume Unit:NT$1,000
2001 2002 2001 vs. 2002 Type Amount % Amount % Differences Growth%
Checking Deposits 2,332,640 1.03% 2,413,074 1.10﹪ 80,434 3.45﹪Demand Deposits Excluding Foreign Exchange 13,193,479 5.81% 16,539,594 7.56﹪ 3,346,115 25.36﹪ Including Foreign Exchange 17,573,505 7.73% 21,655,911 9.90﹪ 4,082,406 23.23﹪Demand Saving Deposits 56,143,524 24.70% 60,125,831 27.50﹪ 3,982,307 7.09﹪Time Deposits Excluding Foreign Exchange 48,857,314 21.50% 35,751,585 16.35﹪ -13,105,729 -26.82﹪ Including Foreign Exchange 66,576,215 29.30% 48,332,664 22.10﹪ -18,243,551 -27.40﹪Time Savings Deposits 63,805,062 28.08% 66,128,246 30.24﹪ 2,323,184 3.64﹪Postal Transfer Deposits 20,827,663 9.16% 20,018,070 9.16﹪ -809,593 -3.89﹪
Total (including foreign exchange)
227,258,609 100.00% 218,673,796 100.00﹪ -8,584,813 -3.78﹪
(2) Loans
The enterprises have been inert to make new investment and individuals have been hesitant to acquire properties due to the repercussion of the 2002 recession. As such, the loan market has not been ideal for Fubon. Yet, Fubon actively sought to develop products with higher profit margin and to develop the niche market. An obvious example is the “Boss Account” program for petty merchants, which made other lines of credit grow as high as 26.5%. Besides, the balance of revolving credit also grew by 58%, given the rapid growth in the credit card business. Further, personal lines of credit also prospered due to the unveiling of the “ fixed rate mortgage loan” into the market, a unique product of its kind. Indeed, Fubon enjoyed significantly growth in personal lines of credit, and this area of financing was ranked top in growth among other loan products. In corporate financing, Fubon Bank established the Business Development Center for assisting small and medium enterprises in financing. This enabled Fubon Bank to maintain small and medium business financing at the same level of the previous year. Fubon Bank had sold 5 billion NTD of non-performing loans to asset management companies in 2002 to substantially upgrade its quality of assets. For further enhancing the quality of its assets, Fubon Bank stated the previously restructured loans as non-performing loans, which drove the non-performing rate higher than that at the end of 2001.
Loan Business Volume Unit:NT$1,000
- 16 -

2001 2002 2001 vs.2002 Type
Amount % Amount % Differences Growth%
Large corporate Loans 49,410,981 34.90% 40,681,564 28.27% -8,729,417 -17.67%Small & Medium Business Loan 14,044,862 9.92% 14,000,039 9.73% -44,823 -0.32%Revolving Credit Loans 14,581,760 10.30% 23,032,245 16.00% 8,450,485 57.95%Consumer Loans 56,330,046 39.79% 57,066,623 39.66% 736,577 1.31%Other Revolving Loans 7,211,400 5.09% 9,123,779 6.34% 1,912,316 26.52%
Total 141,579,049 100% 143,904,250 100% 2,325,201 1.64%
Overdue Loan Amount & Ratio Unit:NT$1,000 12/31/2001 12/31/2002 Over Loan Amount 5,096,175 5,692,716 Over Loan Ratio 3.52% 3.91%
1. Commercial and Industrial (C&I) Loans
Corporate financing in 2002 was 10.61% less than that of the previous year. The major reasons were: (1) economic recession and the fermenting relocation of industry offshore which compelled Fubon Bank to tighten its credit authorization procedures; (2) the loan to governmental agencies dropped by 4 billion NTD because of the interest rate; (3) Fubon Bank tightened its measures in risk management for setting a higher standard of credit rate for less efficient accounts, and also adjusted loan targets and structures. As a result, the small and medium enterprises became the target group of marketing.
In conjunction with our policy of developing more small-medium business loans, Fubon Bank took full advantage of the Small-Medium Business Guarantee Fund (SMBGF), yielding impressive results. At the end of 2002, Fubon Bank has processed 4.2 billion NTD of loan under the mechanism, which made it the number one among post-deregulation banks in underwriting loans secured by guarantee of the SMBGF and the 11th position among all financial institutions.
Where the macroeconomic looked pessimistic, competition in the financial market became more acute. As for Fubon Bank, it has formed the “Small-Amount Handy Loan Center” and “Small Business Finance Department” to its domain of corporate financing in the 4th quarter of 2002 for enhancing its niche and make profit more lucrative. Further, Fubon Bank sought to increase its income by applying a fee for credit rating and processing of application. By the end of 2002, the balance of loans through “Small business Finance Dept. ” amounted to 2.6 billion NTD while the balance of loans through “Small-Amount Handy Loan Center” amounted to 1 billion NTD. In industry analysis, Fubon Bank is still the top lender to the manufacturing sector at 30.57%. The performance was more or less the same as the previous year.
Loan Volume by Industry Unit:NT$1,000
- 17 -
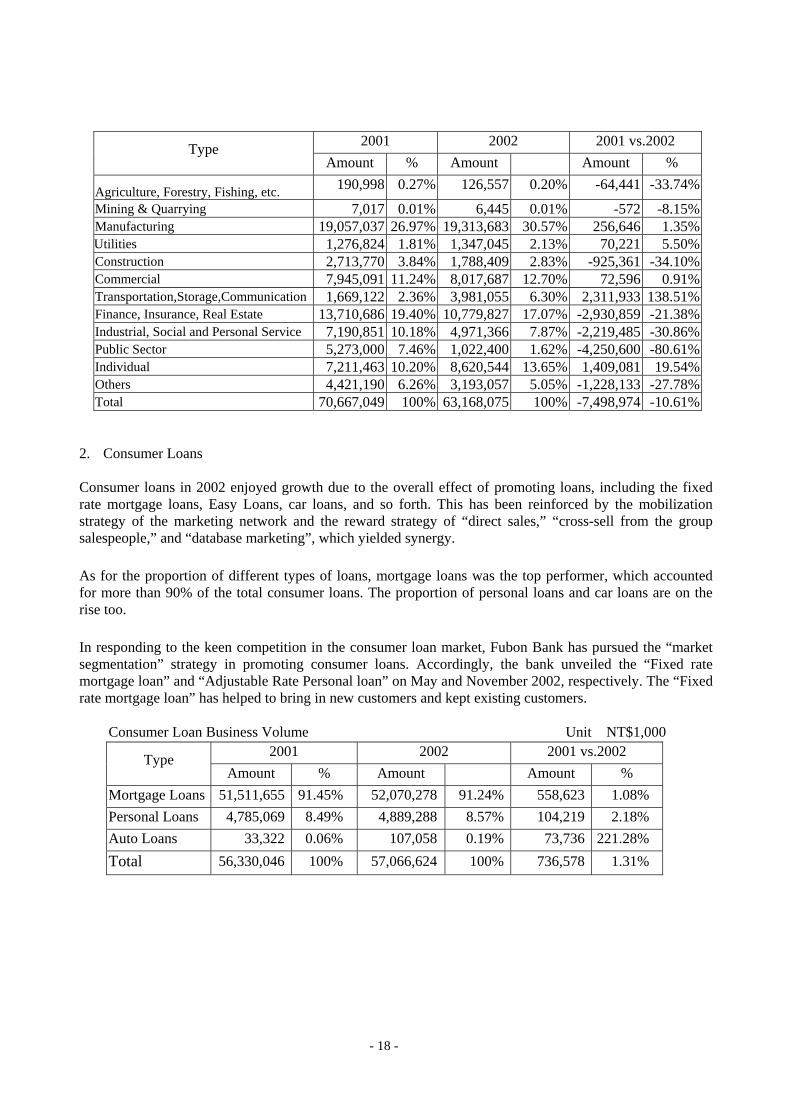
2001 2002 2001 vs.2002 Type Amount % Amount Amount %
Agriculture, Forestry, Fishing, etc. 190,998 0.27% 126,557 0.20% -64,441 -33.74%
Mining & Quarrying 7,017 0.01% 6,445 0.01% -572 -8.15%Manufacturing 19,057,037 26.97% 19,313,683 30.57% 256,646 1.35%Utilities 1,276,824 1.81% 1,347,045 2.13% 70,221 5.50%Construction 2,713,770 3.84% 1,788,409 2.83% -925,361 -34.10%Commercial 7,945,091 11.24% 8,017,687 12.70% 72,596 0.91%Transportation,Storage,Communication 1,669,122 2.36% 3,981,055 6.30% 2,311,933 138.51%Finance, Insurance, Real Estate 13,710,686 19.40% 10,779,827 17.07% -2,930,859 -21.38%Industrial, Social and Personal Service 7,190,851 10.18% 4,971,366 7.87% -2,219,485 -30.86%Public Sector 5,273,000 7.46% 1,022,400 1.62% -4,250,600 -80.61%Individual 7,211,463 10.20% 8,620,544 13.65% 1,409,081 19.54%Others 4,421,190 6.26% 3,193,057 5.05% -1,228,133 -27.78%Total 70,667,049 100% 63,168,075 100% -7,498,974 -10.61%
2. Consumer Loans Consumer loans in 2002 enjoyed growth due to the overall effect of promoting loans, including the fixed rate mortgage loans, Easy Loans, car loans, and so forth. This has been reinforced by the mobilization strategy of the marketing network and the reward strategy of “direct sales,” “cross-sell from the group salespeople,” and “database marketing”, which yielded synergy.
As for the proportion of different types of loans, mortgage loans was the top performer, which accounted for more than 90% of the total consumer loans. The proportion of personal loans and car loans are on the rise too.
In responding to the keen competition in the consumer loan market, Fubon Bank has pursued the “market segmentation” strategy in promoting consumer loans. Accordingly, the bank unveiled the “Fixed rate mortgage loan” and “Adjustable Rate Personal loan” on May and November 2002, respectively. The “Fixed rate mortgage loan” has helped to bring in new customers and kept existing customers.
Consumer Loan Business Volume Unit:NT$1,000 2001 2002 2001 vs.2002 Type
Amount % Amount Amount % Mortgage Loans 51,511,655 91.45% 52,070,278 91.24% 558,623 1.08% Personal Loans 4,785,069 8.49% 4,889,288 8.57% 104,219 2.18% Auto Loans 33,322 0.06% 107,058 0.19% 73,736 221.28% Total 56,330,046 100% 57,066,624 100% 736,578 1.31%
- 18 -
(3.) Credit Cards
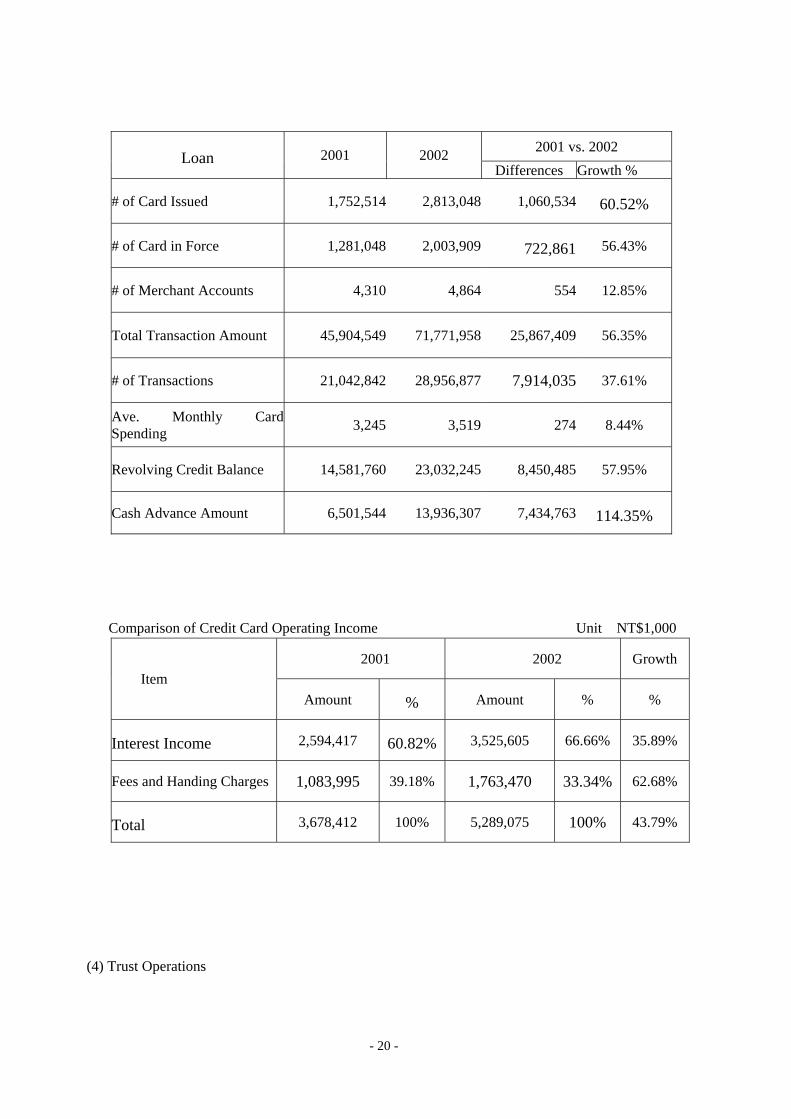
The marketing strategy of Fubon Bank in promoting credit cards in 2002 is to strengthen the competitiveness of products, to look for quality customers, to fully utilize the data warehouse system, to launch pre-approval campaigns for customers of the affiliates of the group including “credit card upgrading” and pre- approval for co-branded card and platinum card to selected groups of customers. The series of promotional campaigns has been widely accepted. In addition, Fubon Bank also launched segmented marketing of co-branded cards of high potential. For example, Fubon Bank works with TransAsia Telecommunications to issue the “TransAsia co-branded Card” and works with DHC to issue the “DHC co-branded Card”. Of all those cards issued, the “ Kuang San SOGO co-branded Card” is the most popular. As of the end of 2002, Fubon Bank has issued more than 2 million cards in force of which the 317,000 were platinum cards, which made Fubon ranked the third and second in respective market.
In order to improve the usage of credit cards and to augment the loyalty of customers, Fubon Bank has presented the “a number-matching sweepstakes game,” “Cathay Pacific Airlines Upgrade,” “Three Times Credit Card Bonuses for Department Store Consumption,” and “Disney – Treasury Island Credit Card 8 Purchases” in 2002. These series of event has helped to boost up the transaction amount with platinum cardholders in particular. The total consumption by credit cards in 2002 has increased by 25.867 billion NTD or 56.35% from that of the previous year.
Of all the member banks of the National Credit Card Center, cards in force issued by Fubon Bank accounted for 7.72% of the market share and the transaction amount at 10.40% of the market. After joining the CRIS-NS system of the National Credit Card Center, Fubon Bank has adopted the FALCON alert system to reduce the amount of counterfeit loss to 13 million NTD in 2002, 88 million NTD less than that of the previous year. The ratio of counterfeit credit card also reduced to only 0.018%.
Comparison of Credit Card Business Volume Unit:NT$1,000
- 19 -
2001 vs. 2002 Loan 2001 2002
Differences Growth %
# of Card Issued 1,752,514 2,813,048 1,060,534 60.52%
# of Card in Force 1,281,048 2,003,909 722,861 56.43%
# of Merchant Accounts 4,310 4,864 554 12.85%
Total Transaction Amount 45,904,549 71,771,958 25,867,409 56.35%
# of Transactions 21,042,842 28,956,877 7,914,035 37.61%
Ave. Monthly Card Spending 3,245 3,519 274 8.44%
Revolving Credit Balance 14,581,760 23,032,245 8,450,485 57.95%
Cash Advance Amount 6,501,544 13,936,307 7,434,763 114.35%
Comparison of Credit Card Operating Income Unit:NT$1,000
2001 2002 GrowthItem
Amount % Amount % %
Interest Income 2,594,417 60.82% 3,525,605 66.66% 35.89%
Fees and Handing Charges 1,083,995 39.18% 1,763,470 33.34% 62.68%
Total 3,678,412 100% 5,289,075 100% 43.79%
(4) Trust Operations
- 20 -
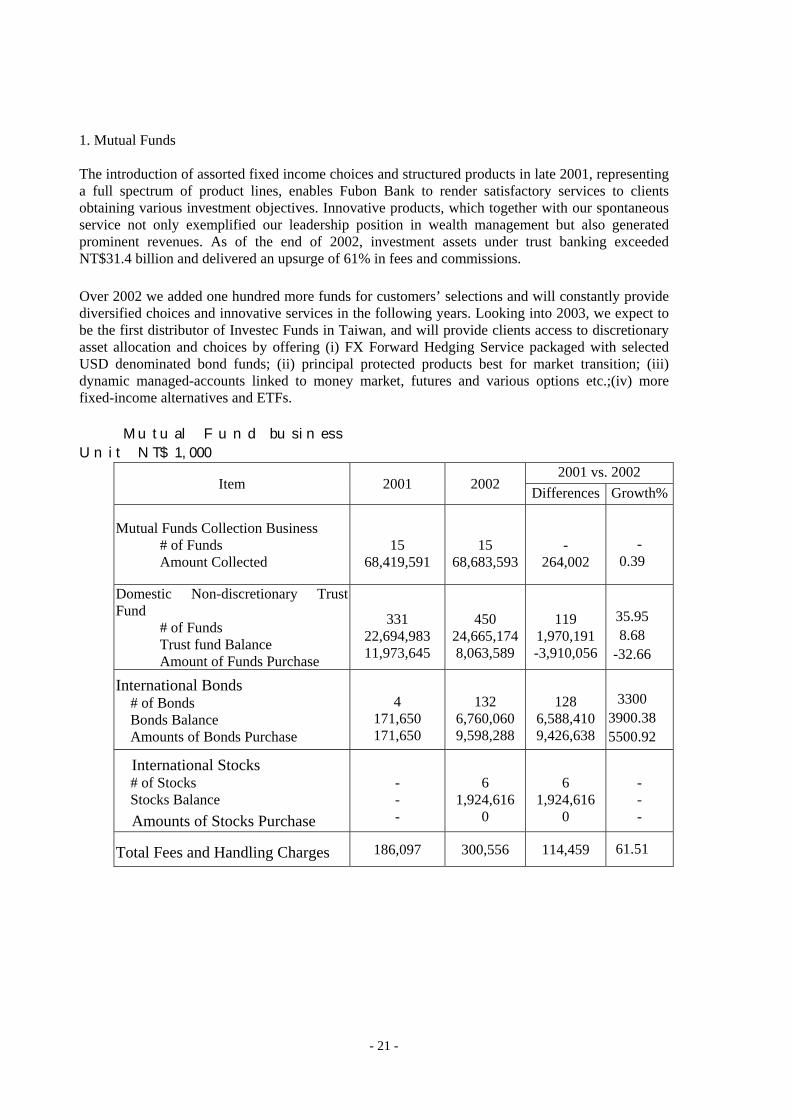
1. Mutual Funds The introduction of assorted fixed income choices and structured products in late 2001, representing a full spectrum of product lines, enables Fubon Bank to render satisfactory services to clients obtaining various investment objectives. Innovative products, which together with our spontaneous service not only exemplified our leadership position in wealth management but also generated prominent revenues. As of the end of 2002, investment assets under trust banking exceeded NT$31.4 billion and delivered an upsurge of 61% in fees and commissions.
Over 2002 we added one hundred more funds for customers’ selections and will constantly provide diversified choices and innovative services in the following years. Looking into 2003, we expect to be the first distributor of Investec Funds in Taiwan, and will provide clients access to discretionary asset allocation and choices by offering (i) FX Forward Hedging Service packaged with selected USD denominated bond funds; (ii) principal protected products best for market transition; (iii) dynamic managed-accounts linked to money market, futures and various options etc.;(iv) more fixed-income alternatives and ETFs.
Mutual Fund business
Unit:NT$1,000
2001 vs. 2002 Item 2001 2002 Differences Growth%
Mutual Funds Collection Business # of Funds Amount Collected
15
68,419,591
15
68,683,593
-
264,002
-
0.39﹪
Domestic Non-discretionary Trust Fund # of Funds
Trust fund Balance Amount of Funds Purchase
331
22,694,983 11,973,645
450
24,665,1748,063,589
119
1,970,191 -3,910,056
35.95﹪8.68﹪
-32.66﹪
International Bonds # of Bonds Bonds Balance Amounts of Bonds Purchase
4
171,650 171,650
132
6,760,0609,598,288
128
6,588,410 9,426,638
3300﹪
3900.38﹪5500.92﹪
International Stocks # of Stocks Stocks Balance Amounts of Stocks Purchase
- - -
6
1,924,6160
6
1,924,616 0
- - -
Total Fees and Handling Charges 186,097 300,556 114,459 61.51﹪
- 21 -
2. Fiduciary Service
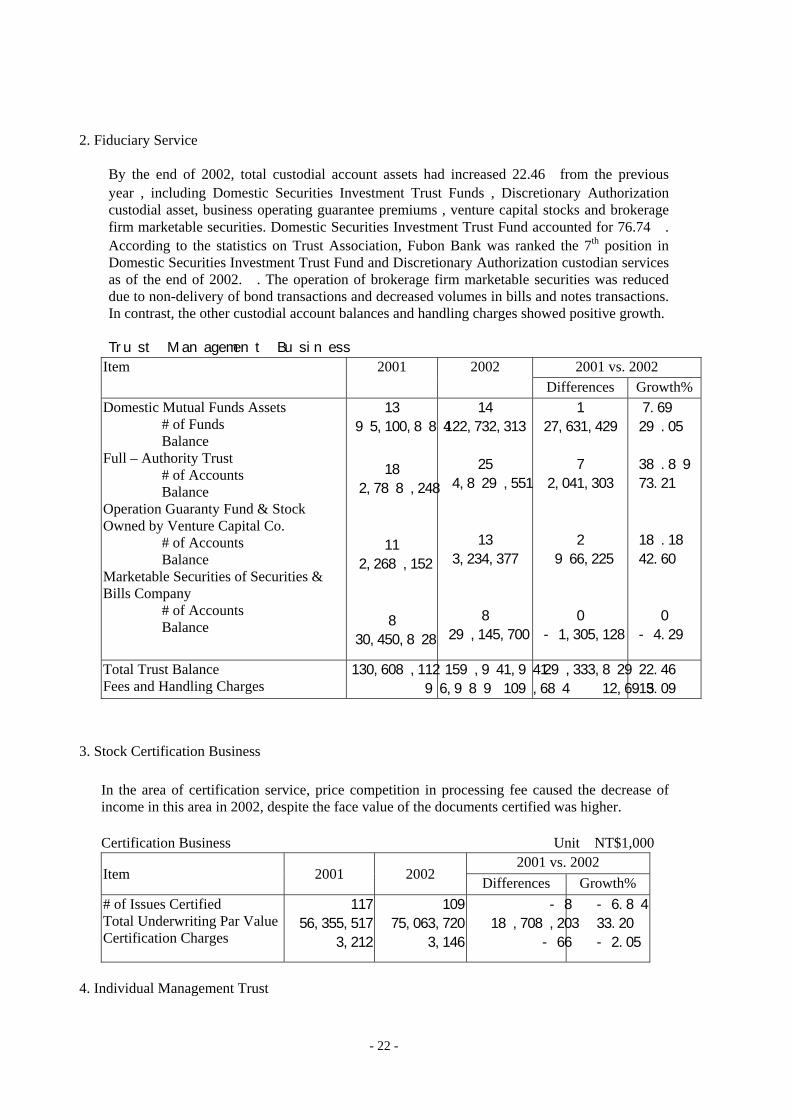
By the end of 2002, total custodial account assets had increased 22.46﹪from the previous year , including Domestic Securities Investment Trust Funds , Discretionary Authorization custodial asset, business operating guarantee premiums , venture capital stocks and brokerage firm marketable securities. Domestic Securities Investment Trust Fund accounted for 76.74﹪. According to the statistics on Trust Association, Fubon Bank was ranked the 7th position in Domestic Securities Investment Trust Fund and Discretionary Authorization custodian services as of the end of 2002. . The operation of brokerage firm marketable securities was reduced due to non-delivery of bond transactions and decreased volumes in bills and notes transactions. In contrast, the other custodial account balances and handling charges showed positive growth.
Trust Management Business
2001 vs. 2002 Item 2001 2002 Differences Growth%
Domestic Mutual Funds Assets # of Funds Balance Full – Authority Trust # of Accounts Balance Operation Guaranty Fund & Stock Owned by Venture Capital Co. # of Accounts Balance Marketable Securities of Securities & Bills Company # of Accounts Balance
13
95,100,884
18
2,788,248
11
2,268,152
8
30,450,828
14
122,732,313
25
4,829,551
13
3,234,377
8
29,145,700
1
27,631,429
7
2,041,303
2
966,225
0
-1,305,128
7.69﹪
29.05﹪
38.89﹪
73.21﹪
18.18﹪
42.60﹪
0
-4.29﹪
Total Trust Balance Fees and Handling Charges
130,608,112
96,989
159,941,941
109,684
29,333,829
12,695
22.46﹪
13.09﹪
3. Stock Certification Business
In the area of certification service, price competition in processing fee caused the decrease of income in this area in 2002, despite the face value of the documents certified was higher.
Certification Business Unit:NT$1,000 2001 vs. 2002
Item 2001 2002 Differences Growth% # of Issues Certified Total Underwriting Par Value Certification Charges
117
56,355,517
3,212
109
75,063,720
3,146
-8
18,708,203
-66
-6.84﹪
33.20﹪
-2.05﹪
4. Individual Management Trust
- 22 -
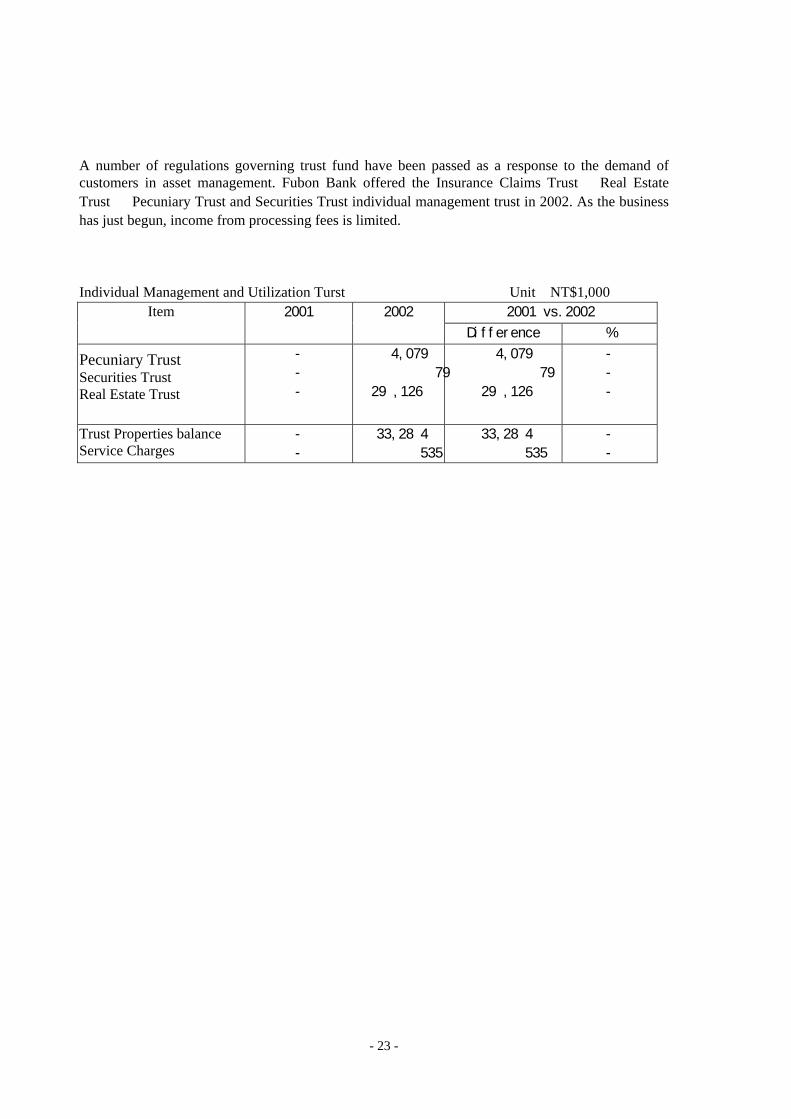
A number of regulations governing trust fund have been passed as a response to the demand of customers in asset management. Fubon Bank offered the Insurance Claims Trust 、Real Estate Trust 、Pecuniary Trust and Securities Trust individual management trust in 2002. As the business has just begun, income from processing fees is limited.
Individual Management and Utilization Turst Unit:NT$1,000
2001 2002 2001 vs.2002 Item Difference %
Pecuniary Trust Securities Trust Real Estate Trust
-
-
-
4,079
79
29,126
4,079
79
29,126
-
-
-
Trust Properties balance Service Charges
-
-
33,284
535
33,284
535
-
-
- 23 -
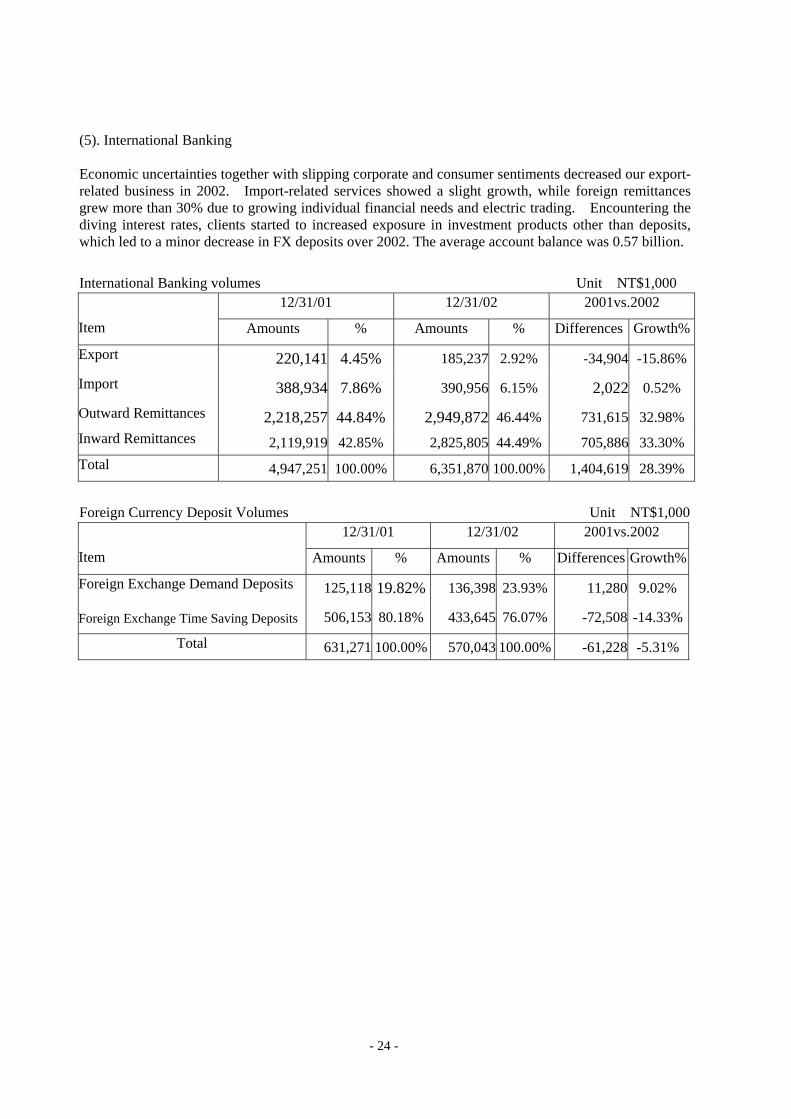
(5). International Banking Economic uncertainties together with slipping corporate and consumer sentiments decreased our export-related business in 2002. Import-related services showed a slight growth, while foreign remittances grew more than 30% due to growing individual financial needs and electric trading. Encountering the diving interest rates, clients started to increased exposure in investment products other than deposits, which led to a minor decrease in FX deposits over 2002. The average account balance was 0.57 billion. International Banking volumes Unit:NT$1,000
12/31/01 12/31/02 2001vs.2002
Item Amounts % Amounts % Differences Growth%
Export 220,141 4.45% 185,237 2.92% -34,904 -15.86%
Import 388,934 7.86% 390,956 6.15% 2,022 0.52%
Outward Remittances 2,218,257 44.84% 2,949,872 46.44% 731,615 32.98%Inward Remittances 2,119,919 42.85% 2,825,805 44.49% 705,886 33.30%Total 4,947,251 100.00% 6,351,870 100.00% 1,404,619 28.39%
Foreign Currency Deposit Volumes Unit:NT$1,000
12/31/01 12/31/02 2001vs.2002
Item Amounts % Amounts % Differences Growth%
Foreign Exchange Demand Deposits 125,118 19.82% 136,398 23.93% 11,280 9.02%
Foreign Exchange Time Saving Deposits 506,153 80.18% 433,645 76.07% -72,508 -14.33%
Total 631,271 100.00% 570,043 100.00% -61,228 -5.31%
- 24 -

(6). Financial Operations In the first quarter of 2002, Taiwan’s economy showed recovery from the recession. However, global economic growth slowed down in the second half of 2002 due to the accounting scandal in the U.S.A., the War in Iraq and the port sealing on the West Coast. The Central Bank of China further cut the rediscount rate in June and November in line with the global declining interest rate environment. The Bank unloaded its bond portfolio in 2002 and realized the part of the capital gains. To minimize the interest risk, the bill portfolio was over weighted with a view to shorten the duration of the asset portfolio. Investment Balance of Bonds, Commercial Papers, Stocks Unit:NT$1,000
2001 vs. 2002 Item 12/31/01 12/31/02 Differences Growth% Government Bonds 25,011,145 15,320,555 -9,690,590 -38.75% Financial Debentures 464,903 700,656 235,753 50.71% Corporate Bonds 7,694,269 5,618,859 -2,075,410 -26.97% Stocks 1,116,333 962,500 -153,833 -13.78% Mutual fund 2,349,481 2,448,177 98,696 4.20% Corporate Papers 99,342 10,484,212 10,384,870 10453.66% Total 36,735,473 35,534,959 -1,200,514 -3.27%
- 25 -

(7). Electronic Banking The number of customers and transactions for E-bank service in 2002 was 17.36% and 15.07% higher than that of the previous year. The number of customers and transaction volume for Internet Banking Services enjoyed significant growth from the previous year by 31.30% and 79.73%, respectively. The convenience of using Internet Banking Service attracted many customers to switch to Tele-Banking and PC-Banking services. In order to reinforce the habit of the customer in for automated banking service, account representatives have spent great efforts to guide customers in using process step by step, and to build up their trust and satisfaction in the service provided by Fubon Bank. Electronic Banking Business
2001 vs. 2002 Item 12/31/01 12/31/02
Differences Growth% # of Customers 138,990 182,496 43,506 31.30 % Internet Banking # of Transactions 1,763,383 3,169,305 1,405,922 79.73 % # of Customers 791,727 911,441 119,714 15.12 % Telebanking
# of Transactions 4,129,706 3,649,766 -479,940 -11.62 % # of Customers 7,885 7,988 103 1.31 % PC Banking # of Transactions 67,716 48,702 -19,014 -28.08 % # of Customers 2,384 2,437 53 2.22 % Mobile Banking # of Transactions 11,767 4,964 -6,803 -57.81 % # of Customers 940,986 1,104,362 163,376 17.36 % Total # of Transactions 5,972,572 6,872,737 900,165 15.07 %
ATM Business Unit:NT$1,000
2001 vs. 2002 Item 2001 2002
Differences Growth ATM Cards 1,117,539 1,296,795 179,256 16.04% ATM Sets 186 192 6 3.23% # of Transactions 10,892,756 12,834,802 1,942,046 17.83% Total Transaction Amounts 126,269,000 159,241,000 32,972,000 26.11%
3. Work Force
- 26 -

(1) Number of Employees, Average Age & Average Years Worked
12/31/01 12/31/02 2001 vs.2002 Item Persons % Persons % Differences Growth%Employees 1405 80.29% 1406 76.37% 1 0.07%
Service person (Includes Interns) 345 19.71% 435 23.63% 90 26.09%
Total 1750 100% 1841 100% 91 5.20%
Average Age 31.05 31.09 0.04 0.13%
Average Years Worked 7.04 8.06 1.02 14.49%
(2) Employee’s Education Levels
12/31/01 12/31/02 2001vs.2002 Item Persons % Persons % Differences Growth%Master’s Degree or Above 92 5.26% 98 5.32% 6 6.52% College 1,387 79.26% 1,460 79.3% 73 5.26% High School/Vocational School 268 15.31% 280 15.21% 12 4.48%
Jr.High or Below 3 0.17% 3 0.17% 0 0.00%
Total 1,750 100% 1841 100% 91 5.20%
- 27 -

4. Risk Management (1). Loan Authorization Risk To fully utilize limited resources and exercise effective risk control, we undertook our loan authorization in accordance with the related regulations stipulated in Banking Law and other government mandated laws. Depending on the borrower, the secured item, the business group, industry sector and the investment type involved, we then set a ceiling of risk tolerance to avoid over concentration, thereby protecting our financial operations. (2). Credit Risk We were able to effectively control our credit risk by properly monitoring transaction amounts. In the case of interbank loans and repurchase agreements, we exercised our control of transaction amounts based on each trading partner’s credit profile; in the case of outright purchases, we controlled the safe amount based on the credibility of the securing financial institution. Credit lines on derivatives shall be carried out in accordance with “Fubon Commercial Bank Derivatives Trading Processing Procedure.” (2). Interest Risk We mainly used the interest rate sensitivity gap-to-net value ratio and the interest rate sensitive asset-to-interest rate sensitive liability ratio to control risk to a manageable level. We carefully monitored both these ratios, making sure that they fell between appropriate parameters. (3). Exchange Rate Risk The Bank has strict controls over its foreign exchange position including the overall exposure limit, individual dealer’s position limit, single transaction limit and stoploss limit , counterparty ‘s limits and relevant authorization are governed under the Bank’s “Foreign Exchange , Money Market and Capital Market Internal Guidelines” which is reviewed regularly to enhance the risk management.
(4). Derivatives Trading Risk In compliance with the related government regulations, the “FCB Derivatives Trading Processing Procedure” guidelines were submitted to and approved by the FCB Board of Directors. These procedures regulate the accountability of all transaction, settlement, management and audit departments. In addition, we also conducted regular profit/loss evaluations based on the trading nature (hedging vs. non-hedging). The results were all submitted to the general manager or other authorized, responsible persons in order to ensure new business was developed in accordance with sound management practices for credit risk, market risk, liquidity risk, operating risk and litigation risk. (5). Risk Management Information System
- 28 -

In light of our increased business volumes, FCB adopted the real-time risk management system - “Kondor+” provided by Reuters to control our interest risk, exchange risk and credit risk. Kondor+ is equipped to exercise quantity limit controls on all financial product positions, trader positions and counterpart credit risks as well as country risks. It also provides data regarding real-time market price evaluation to allow users to conduct sensitivity analyses on interest rate and exchange rate fluctuations. This information system greatly improved the efficiency of manual control and helped to avoid risk control blind spots, enhancing our financial operating performance.
- 29 -
IV. Operating Plan 1. Current Year Operating Plan (1) Financial Services
1. For meeting the goal in the balance between deposit and loan, Fubon Bank maintained the ratio of deposits to loans at 65%. In addition, it also adjusted the deposit structure and to increase the proportion in demand deposits and offers loans with lower cost equity capital.
2. Offer more principal protected products and investment-linked insurance to clients for their asset allocation with restricted investment risk and further increase our fees income.
3. Enact customer classification to provide customized products and services to clients with different enquiries. We will keep on establishing sophisticated Customer Relationship Management (CRM) based on the data warehouse system and expand the penetration of Personal Banking and Platinum Banking at aggressive paces.
4. For expanding the servicing network in financial management, Fubon Bank persists to remodel its branches in order to fortify its functions in marketing and related services. In addition, Fubon added more location for ATM facilities, cash deposits machines, and developed new functions for e-transactions for enhancing its automated banking services.
5. Fubon Bank puts tremendous effort to centralize its operation and make the process more rational. In practice, Fubon simplifies the operation procedure and enhances the efficiency. The human resources saved from the simplified process were used in the development of other business with higher added value.
6. Fubon launched the CNR (Customer Net Revenue) system for the evaluation of staff
performance on a monthly basis. This helps to boost up the morale of the staff in business development, bolster sales and improve customer service quality.
(2) International Banking
1. Fubon takes the establishment of a foreign exchange center for the full-fledged development of foreign exchange the primary goal of the year. The purpose of this is to centralize the operation and yield better efficiency, and to cut down the cost of operation and upgrade work quality.
2. In supporting the Ministry of Economic Affairs in launching the Project C in financing the suppliers, Fubon developed the c-Payment system for online transaction of foreign currencies. This system integrates the function of controlling credit limit in foreign currencies, and helps to exercise timely control over the information of customer orders and credit limit. In effect, this system provides the services of capital management and disbursement in foreign currencies for the customers.
3. The demand deposits account in foreign currency allows for direct conversion between NT
- 30 -

Dollars and various foreign currencies, which is a solution for enhancing the multiple functions of foreign currency deposit accounts. With this type of account, customers get better choices with more convenience.
4. For increasing the volume of foreign currency deposits to pool up the foreign currency reserve of the bank, and satisfy the needs of customers in full-range financial services, Fubon Bank will continue to present more varieties of combined-feature banking accounts.
(3) Corporate Banking
1. In responding to the demand of the exporters, Fubon Bank works in conjunction with Fubon Insurance Co. to promote international account receivable finance.
2. Persist to enhance the relationship with small and medium enterprises and take advantage of “Small and Medium Business Credit Guarantee Fund”(SMBCGF) to minimize loan risk.
3. Fubon Bank’s automated credit-check and credit granting system were officially
launched for service at the end of 2002. The loan application and review process were computerized and standardized for efficiency. In responding to BASEL 2, which will be in effect in 2006, the credit-evaluation mechanism will be included into the automated processing system in order to help the Corporate Banking Department to control and monitor asset quality.
4. Participate in the Project C (financing project) of MOEA in supply chain financing, install the mechanism of e-finance for the industrial sector, and improve the industry’s efficiency and competitiveness by integrating financial flow and distribution networks.
5. In responding to the internationalization of finance and providing customers with diversified financial instruments, Fubon Bank plans to promote derivative products to satisfy the need of the customers in risk-avoidance and financing. The financial instruments undertaken by Fubon Bank are forward contracts, options, swaps, and a number of other financial derivatives combining assets and liabilities. The main market for derivatives is the group of enterprises in good standing and is in need of derivatives.
6. In order to cooperate with the Small Business Division MOEA to help the unemployed middle-age people for setting up their own businesses, Fubon Bank plans to offer the “Small Business Loan” to those customers for acquitting manufacturing facility, business locations, and machinery.
7. Working with Taipei Bank to establish the mechanism of marketing and risk control. The
- 31 -

database and data control for the stakeholders of Fubon Bank and Taipei Bank and as required by law have been completed. In light of overall risk control, Fubon Bank establishes the upper limit of credit to common accounts (including the subsidiaries in stocks and bills) and the mechanism of information sharing on industry/credit check/review/overdue/collection/bad debt. In the integration of marketing, the bank will also establish the mechanism for joint processing and transfer on credit application.
8. For improving operation efficiency and enhancing the standardization, rationality of operation procedure in order to achieve the goal of streamlining human resources, Fubon Bank will establish 8 Business Financial Center. This could help to effectively control operation risk and account officers could devote much of their time to earn new customers and to maintain good relations with existing customers.
(4) Consumer Banking
1. In responding to the growing demand in the market of small loans, Fubon Bank develops a wide array of convenient credit limits to attract customers for enhancing the competitiveness in market.
2. Select potential customers for marketing purpose through the mechanism of customer
information sharing. Provide customers with special offers and services and develop personal loan market by building up good relations with customers.
3. Expand the sales team and adopts the system of “product specialists” to improve overall
business performance through professional division of labor.
4. Map out the strategy for mobilizing the sales channels and relevant reward system for better performance
5. Exercise reasonable risk control with the use of credit-check and credit rating system. In
addition, the bank also establishes the customer evaluation system and workshop with the standard timing for processing credit-check and credit rating more efficiently.
6. Adjust the policy and procedure in granting credits and strengthen the collection process, and speed up the coverey of overdue loans to reduce the rate of non-performing loan.
7. Enhance the management in customer service, establish index for control the customer drain, understand the customers, and reduce the cancellation of accounts.
8. Set up the computerized collection system actively in order to enhance collection effort through the aspects of operation, management, strategy, system, and effectiveness.
(5) Credit Cards
1. Improve the competitiveness of products and enhance the added-value of products and
- 32 -
loyalty to brand name
2. Utilize Fubon Financial’s resources more effectively for cross selling, and arrange relevant activities at the right time for various customer segments in order to increase the volume of credit card issuance and the amount of spending.
3. Enhance the issuance of platinum cards in quantity and transaction amount through the
strategy of wealth management and double platinum brands so that the contribution value of the card could be maximized.
4. Actively plan for the customer loyalty campaign and credit card promotion to enhance customer loyalty and usage rate.
5. Work with renowned enterprises for promoting the “co-branded card” and joint marketing in segmented market so that more cards would be issued and higher amount would be spent on cards.
6. Upgrade the IVR system and install the CTI system, and also strengthen professional training and customer service quality for improving service efficiency and customer satisfaction.
7. Plan and install the automated credit scoring system, establish standard operation procedure, control the quality of channel sources and enhance the efficiency and timing in reviewing application.
8. Step up the collection of default accounts and enhance risk control.
- 33 -

(6) Trust Operation
1. Introduce a variety of Designated Purpose Trust Fund and enhance the competitiveness and absorb funds from the market by product differentiation.
2. Upgrade the function of the fund trading system, enhance the service of electronic transaction
of funds, make business more convenience and reduce operating cost with e-commerce.
3. Increase involvement in custodial business for mutual fund asset and discretionary authorization custodial investment management, also develop new custodial business that will expand our trust management capacity.
4. Design and develop personal trust business for the demand of customers in asset allocation
and trust planning.
5. Promote standard trust products like Common Trust Fund and joint trust, fund, insurance, and other financial products. The products can satisfy the needs of the investors and are beneficial to the business growth of Fubon Bank.
6. The mandatory or semi-mandatory personal pension plan will be in effect when the “Labor
Pension Act” is passed. Fubon Bank plans to develop Employee Benefit trust and pension trust business by having personal pension accounts and the trust system consolidated.
(7) Information Service
1. Integrate information security mechanism to enhance the security of Fubon Bank’s Internet comply with ISO 17799 Safety Standard for real time monitoring, to prevent malicious attack, and to reduce the risk of loss.
2. Establish business center and integrate the working platform of notes, remittance, collection,
and credit evaluation process. Integrate with the graphic image system to improve operation efficiency and to reduce operating cost.
3. Provide diversified trust platform, coordinate with the promotion of money trust to maximize
investment effect of trust fund. By using the system and consolidate management the investment of trust fund could be optimized. By combining the overseas stocks and bonds system, the bank could provide customers more diverse financial services.
4. “Card Chip” is for the protection of the cardholder. The construction of ATM Chip and credit
card systems is to improve the security of transaction and the integrated function of credit cards.
5. Promote the integration of Fubon Bank virtual channels and the standardization of the
interface.
6. Integrate the service system of CTI customer center in response to business expansion and diversification. Construct automatic voice mail system for enhancing the capacity in replying to customer calls and reduce the time of conversation between customer and service personnel on telephone in order to improve the service quality and Fubon Bank’s image.
- 34 -
2 Research & Development (1) Establishment of MOEA Financing Project Center (Project C)
The Financing Project of MOEA is to help the supplier finance electronically for placement of orders to manufacturing centers and for account receivables. The bank will be able to control the purchase order information between the supplier and the manufacturing centers in order to reduce credit-authorization risk. To the supplier, the system minimizes time for financing; to the manufacturing center, it increases the incentive for business dealings with suppliers. This creates win-win-win scenario for the supplier, the manufacturing center and the bank. The platform of Project C is almost ready; in fact, Fubon Bank is going to establish an account receivable slips audit center for this project before the end of April 2002.
(2) Second Generation Boss Account– Cash Card
The “Boss Account” was introduced by the Small Business Finance Department in September 2002. This move has stirred up high tide in the financial market. The main purpose of the “Boss Account” is to provide small proprietorships or vendors with mid-term working capital or with funding for the acquisition, repair and maintenance of equipment. For sustaining its success and furthering its business growth, Fubon Bank plans to propose the “Cash Card” to valuable ”Boss Account” customers in April 2003 in order to broaden its customer base, maintain relation with existing customers, and create a win-win situation for customers and the bank.
(3) e-LOAN business
Basing on the experience in developing the e-LOAN platform in Project C, Fubon Bank manages to change current process of revolving loans to e-Loan platform in order to provide excellent financial service and reduce the workload of the Bank.
(4) ATM IC Card
In the wake of development in chip technology and the increasing demand in e-Payment services, the Bankers Association and FISC started to research and develop the operation procedure for the 2nd generation ATM chips. The design aimed at simplicity, convenience and flexibility in the using of cards. Fubon Bank has taken part in the planning of the same scheme since October 2002. It is expected that Fubon Bank will unveil ATM cards with conforming chips and relevant automated machines by the end of 2003.
(5) e-Check
In preparing for future demand in e-commerce and online financial transactions, and complying with the fund appropriation function of Project C under the Ministry of Economic Affairs, Fubon Bank has started to work on the planning of the e-Check system since May 2002. This system has the advantages of data security, convenience in application, and low cost. Fubon Bank has been selected by TWNCH as one of the three banks in the pilot run of this project. It is expected that e-Check operation will be officially launched in the second quarter of 2003.
- 35 -

(6) Card Chip
The Bankers Association has reached consensus with its member banks and agreed to set aside 0.0442% of the amount for each Chip Card transaction to the acquiring bank for covering the high cost paid for the Chip Card migration. This will include replacement of chip-capable POS terminals and the adjustment of circuits for the entire system. The plan is expected to kick off in 2003. In responding to the development of the Chip Card, Fubon Bank has worked towards the multi-functional chip card (including the ATM card, credit card, e-purse, loyalty program, and project sharing) and planned to work with partners to develop and execute the chip card migration plan in order to provide customers with advanced and excellent services through an integrated option.
(7) New Trust Products
The key of trust business development is to satisfy the demand of consumers and investors. Under the structure of financial holding company, it is necessary to develop new trust business by cooperating with domestic regulations and integrating organizational resources in addition to provide better service. The R&D focus of the year is to plan on the Collective Investment Trust Fund , Common Trust Funds, Asset Securitization , Employees Benefit Trust , Pecuniary Rights& Secured Estate Trust in order to provide customers with comprehensive asset management service.
- 36 -

V. Financial Statements INDEPENDENT AUDITORS’ REPORT We have audited the accompanying balance sheets of Fubon Commercial Bank Co., Ltd. (the “Bank”) as
of December 31, 2002 and 2001, and the related statements of income, changes in shareholders' equity
and cash flows for the years then ended. These financial statements are the responsibility of the Bank’s
management. Our responsibility is to express an opinion on these financial statements based on our
audits.
We conducted our audits in accordance with generally accepted auditing standards and “Guidelines for
Certified Public Accountants’ Examinations of and Reports on Financial Statements of Financial
Institutions” in the Republic of China. Those standards and guidelines require that we plan and perform
the audit to obtain reasonable assurance about whether the financial statements are free of material
misstatement. An audit includes examining, on a test basis, evidence supporting the amounts and
disclosures in the financial statements. An audit also includes assessing the accounting principles used
and significant estimates made by the management, as well as evaluating the overall financial statement
presentation. We believe that our audits provide a reasonable basis for our opinion.
In our opinion, the financial statements referred to above present fairly, in all material respects, the
financial position of the Bank as of December 31, 2002 and 2001, and the results of its operations and its
cash flows for the years then ended, in conformity with the “Standards for the Preparation of Financial
Statements of Public Companies” and generally accepted accounting principles in the Republic of China.
As described in Notes 9 and 13 to the financial statements, the Bank holds NT$313.2 million of Fubon
Financial Holding Co., Ltd. shares which was originally accounted as restricted assets at December 31,
2001. However, in accordance with file No.91111467 issued by the Ministry of Financial on April 8,
2002, those shares held should be treated as treasury stocks and recorded as a reduction in shareholders’
equity. Accordingly, the 2001 financial statements as presented herein have been restated for such change
.
37

Deloitte & Touche
Taipei, Taiwan, Republic of China
February 6, 2003
The above auditors’ report and the following financial statements are English translations of the Chinese auditors’ report and financial statements prepared for and used in the Republic of China. The accompanying financial statements were prepared using accounting principles, procedures and reporting practices generally accepted in the Republic of China and are not intended to present the financial position and results of operations and cash flows in accordance with accounting principles and practices generally accepted in countries and jurisdictions other than those in the Republic of China. The standards, procedures and practices utilized to audit such financial statements are those generally accepted and applied in the Republic of China.
38

FUBON COMMERCIAL BANK BALANCE SHEETS DECEMBER 31, 2002 AND 2001 (Expressed in Thousands of New Taiwan Dollars) 2002 2001
NT$
NT$
ASSETS Cash (Note 3) 21,494,876 15,012,539Due from banks (Note 3 and 7) 21,465,309 12,841,836
10,472,457 12,594,277Short-term investments, net (Note 4 and 17) 37,674,975 36,735,473Receivables, net (Note 5 and 6) 13,170,121 8,976,051Prepayments 79,276 91,707Loans, net (Note 6 and 17) 142,278,365 140,863,185Long-term investments, net (Note 7 and 17) 10,566,813 10,006,299Property and equipment, net (Note8 and 17) 5,022,239 4,739,016Leasehold assets, net (Note 8 and 17) 232,492 203,596Other assets, net (Notes 6, 9, 13 and 15) 5,606,424 4,506,499
TOTAL ASSETS 268,063,347 266,570,478
2002 2001 NT$
NT$LIABILITIES AND SHAREHOLDERS’ EQUITY
LIABILITIES:Due to banks (Note 17) 1,565,988 821,788Payables 8,119,3659,157,587Advance from customs 174,042 127,012Deposits (Note 10 and 17) 218,841,188 227,481,240Financial Bonds(Note 11) 10,000,000 - Appropriated loan fund 53,732 69,536Provisions for guarantee and security trading losses 341,645 338,145Other liabilities 324,768 450,335
TOTAL LIABILITIES 240,458,950 237,407,421
SHAREHOLDERS’ EQUITY (Note 13): Common stock 21,857,367 21,857,367Capital surplus 1,443,760 1,438,541Retained earnings:
Legal reserve 3,576,309 2,691,158Special reserve 252,058 598,438Unappropriated retained earnings 854,960 2,963,801
Unrealized loss on valuation of long-term investments (Note 7)
(134,725) (73,058)
Treasury stock (245,332) (313,190)TOTAL SHAREHOLDERS’ EQUITY 27,604,397 29,163,057TOTAL LIABILITIES AND SHAREHOLDERS’ EQUITY 268,063,347 266,570,478
Due from Central Bank of China(Note 3)
See accompanying notes to the financial statements.
39

40
FUBON COMMERCIAL BANK STATEMENTS OF INCOME FOR THE YEARS ENDED DECEMBER 31, 2002 AND 2001 (Expressed in Thousands of New Taiwan Dollars, Except Per Data) 2002 2001 NT$ NT$ OPERATING REVENUES:
Interest income (Note 17) 11,398,412 13,774,516 Fee income (Note 17) 2,613,380 1,664,592 Net gain on trading bills and securities 3,435,573 4,056,495 Net gain on long-term investments (Note 7) 976,323 635,229 Net gain on foreign exchange 107,435 140,073 Other operating revenues 9,351 -
Total operating revenues 18,540,474 20,270,905 OPERATING COSTS:
Interest expenses (Note 17) 4,969,879 9,240,432 Fee expenses 1,711,699 737,502 Provision for loan and other losses (Note 6) 2,673,742 3,643,563 Other operating expenses 7,663 -
Total operating costs 9,362,983 13,621,497 OPERATING GROSS PROFIT 9,177,491 6,649,408 SELLING, GENERAL & ADMINISTRATIVE EXPENSES (Note 17) 4,155,176 3,545,911
NET OPERATING INCOME 5,022,315 3,103,497 NON-OPERATING REVENUES (Note 17) 329,648 259,532 NON-OPERATING EXPENSES (Note 14) 4,606,638 359,347 INCOME BEFORE INCOME TAX 745,325 3,003,682 INCOME TAX BENEFIT (EXPENSE) (Note 15) 4,314 (54,384) NET INCOME 749,639 2,949,298 Income Income Before Net Before Net Income tax income Income tax income EARNINGS PER COMMON SHARE AS REPORTED 0.34 0.35 1.39 1.37 DIVIDEND-ADJUSTED EARNINGS PER COMMON
SHARE (Note 16) 1.39 1.37 See accompanying notes to the financial statements.

41
FUBON COMMERCIAL BANK STATEMENTS OF CHANGES IN SHAREHOLDERS’ EQUITY FOR THE YEARS ENDED DECEMBER 31, 2002 AND 2001 (Expressed in Thousands of New Taiwan Dollars)
Retained earnings
Unrealized losses on
Common stock
Capital surplus
Legal reserve
Special reserve
Unappropriated
valuation of long-term investment
Treasury stock
Total shareholders’ equity
NT$ NT$ NT$ NT$ NT$ NT$ NT$ NT$ Balance as of January 1, 2001 20,445,720 2,144,280 2,026,675 186,020 2,216,853 (610,170) (311,350) 26,098,028 Appropriation of retained earnings:
Legal reserve - - 664,483 - (664,483) - - - Special reserve - - - 412,418 (412,418) - - - Stock dividends 705,824 - - - (705,824) - - - Cash dividends - - - - (403,327) - - (403,327) Employee cash bonus - - - - (13,424) - - (13,424)
Capital surplus transferred to capital 705,823 (705,823) - - - - - - Net income for year 2001 - - - - 2,949,298 - - 2,949,298 Recovery of unrealized losses on valuation
of long-term investments -
-
-
-
-
537,112
-
537,112
Retained earnings adjustment due to changes in long-term investments
-
-
-
-
(2,790)
-
-
(2,790)
Treasury stock - - - - - - (1,840) (1,840) Gain on sale of property and equipment
transferred to capital surplus -
84
-
-
(84)
-
-
-
Balance as of December 31, 2001 21,857,367 1,438,541 2,691,158 598,438 2,963,801 (73,058) (313,190) 29,163,057 Appropriation of retained earnings:
Legal reserve - - 885,151 - (885,151) - - - Recovery of special reserve - - - (346,380) 346,380 - - - Cash dividends - - - - (2,300,000) - - (2,300,000) Employee cash bonus - - - - (21,000) - - (21,000)
Capital surplus transferred to unappropriated retained earnings
-
(1,291)
-
-
1,291
-
-
-
Net income for year 2002 - - - - 749,639 - - 749,639 Unrealized losses on valuation of long-term
investments -
-
-
-
-
(61,667)
-
(61,667)
Treasury stock sold to employees - 6,510 - - - - 67,858 74,368 Balance as of December 31, 2002 21,857,367 1,443,760 3,576,309 252,058 854,960 (134,725) (245,332) 27,604,397 See accompanying notes to the financial statements.

42
FUBON COMMERCIAL BANK STATEMENTS OF CASH FLOWS FOR THE YEARS ENDED DECEMBER 31, 2002 AND 2001 (Expressed in Thousands of New Taiwan Dollars) 2002 2001 NT$ NT$ CASH FLOWS FROM OPERATING ACTIVITIES:
Net income 749,639 2,949,298 Adjustments to reconcile net income to net cash
provided by operating activities: Depreciation and amortization 254,473 237,798 Provision for loan and other losses 2,673,742 3,643,563 Loss on sale of bad loans 4,367,562 - Recovery of provision for decline in market value of long-term
investments (30,291) (3,500) Loss on reduction of long-term investment 20,513 32,346 Provision for decline in market value of foreclosed properties - 50,000 Provision for losses on guarantees transferred to non-operating
income (26,500) (96,000) Net investment revenue under the equity method (970,602) (579,618) Cash dividends from invested company 26,504 95,803 Net loss on disposal of assets 3,542 958 Net loss on disposal of long-term investment 102,005 32,999 Net loss on disposal of foreclosed properties 98,316 72,892 Property and equipment reclassified to expense 213 753 Changes in assets and liabilities:
Receivables (2,446,456) 510,691 Acceptances receivable 41,973 (30,315) Receivable on forward contracts for trading purposes 15,832 (5,947) Prepayments 12,431 35,523 Deferred tax assets (53,029) (94,198) Payables (718,268) (2,373,513) Payable on forward contracts for trading purposes (16,117) 1,690 Collection for customers (12,607) (38,060) Acceptances (45,788) 29,441 Advances from customers 47,030 (71,213) Net cash provided by operating activities 4,094,117 4,401,391 (Continued)

FUBON COMMERCIAL BANK STATEMENTS OF CASH FLOWS FOR THE YEARS ENDED DECEMBER 31, 2002 AND 2001 (Expressed in Thousands of New Taiwan Dollars) 2002 2000 NT$ NT$ CASH FLOWS FROM INVESTING ACTIVITIES:
(Increase)/ decrease in reserve due from Central Bank 299,150 2,206,056 (Increase)/ decrease in due from banks 7,006,523 1,346,955 (Increase)/ decrease in short-term investments 10,828,596 (21,510,734) (Increase)/ decrease in loans (including non-accrual loan) (2,006,490) (905,870) Increase in long-term investments (7,015,049) 14,995,246 Proceeds from sale of long-term investments 239,827 (2,176,167) Purchase of property and equipment 56,321 54,109 Proceeds from sale of property and equipment (322,467) (667,206) Increase in receivable on forward contracts for hedging purpose 2,109 7,366 Increase in payable on forward contracts for hedging purpose 412,906 - Proceeds from sales of foreclosed properties 1,823,436 962,127 Increase in guarantee and margin deposits and other assets 298,946 372,491
Net cash used in investing activities (3,291,036) (244,618)
CASH FLOWS FROM FINANCING ACTIVITIES: Increase/ (decrease) in due to banks 744,200 396,913 Increase in deposits accepted and remittances payable (8,640,052) 361,083 Increase in guarantee deposits received and other liabilities 10,000,000 - Decrease in appropriated loan fund (15,804) (20,825) Cash dividends (125,567) 121,561 Proceeds from GDR (2,313,436) (400,758) GDR-related expenses - (1,840) Increase in treasury stock 74,369 -
Net cash provided by financing activities (276,290) 456,134 NET INCREASE (DECREASE) IN CASH AND CASH
EQUIVALENTS 12,150,599 (702,720) EFFECT OF EXCHANGE RATE CHANGES ON CASH 6,723 (85,222) CASH AND CASH EQUIVALENTS, BEGINNING OF YEAR 45,310,971 46,098,913 CASH AND CASH EQUIVALENTS, END OF YEAR 57,468,293 45,310,971 (Continued)
43
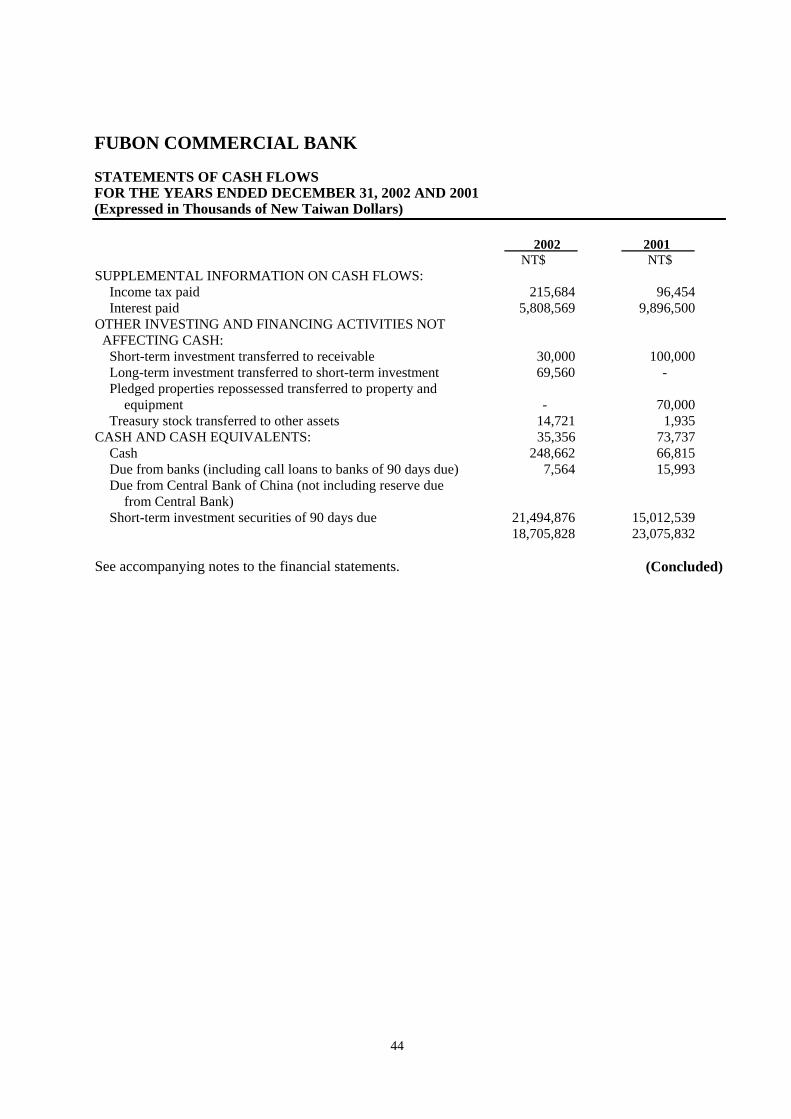
FUBON COMMERCIAL BANK STATEMENTS OF CASH FLOWS FOR THE YEARS ENDED DECEMBER 31, 2002 AND 2001 (Expressed in Thousands of New Taiwan Dollars) 2002 2001 NT$ NT$ SUPPLEMENTAL INFORMATION ON CASH FLOWS:
Income tax paid 215,684 96,454 Interest paid 5,808,569 9,896,500
OTHER INVESTING AND FINANCING ACTIVITIES NOT AFFECTING CASH:
Short-term investment transferred to receivable 30,000 100,000 Long-term investment transferred to short-term investment 69,560 - Pledged properties repossessed transferred to property and
equipment - 70,000 Treasury stock transferred to other assets 14,721 1,935
CASH AND CASH EQUIVALENTS: 35,356 73,737 Cash 248,662 66,815 Due from banks (including call loans to banks of 90 days due) 7,564 15,993 Due from Central Bank of China (not including reserve due
from Central Bank) Short-term investment securities of 90 days due 21,494,876 15,012,539
18,705,828 23,075,832
See accompanying notes to the financial statements. (Concluded)
44
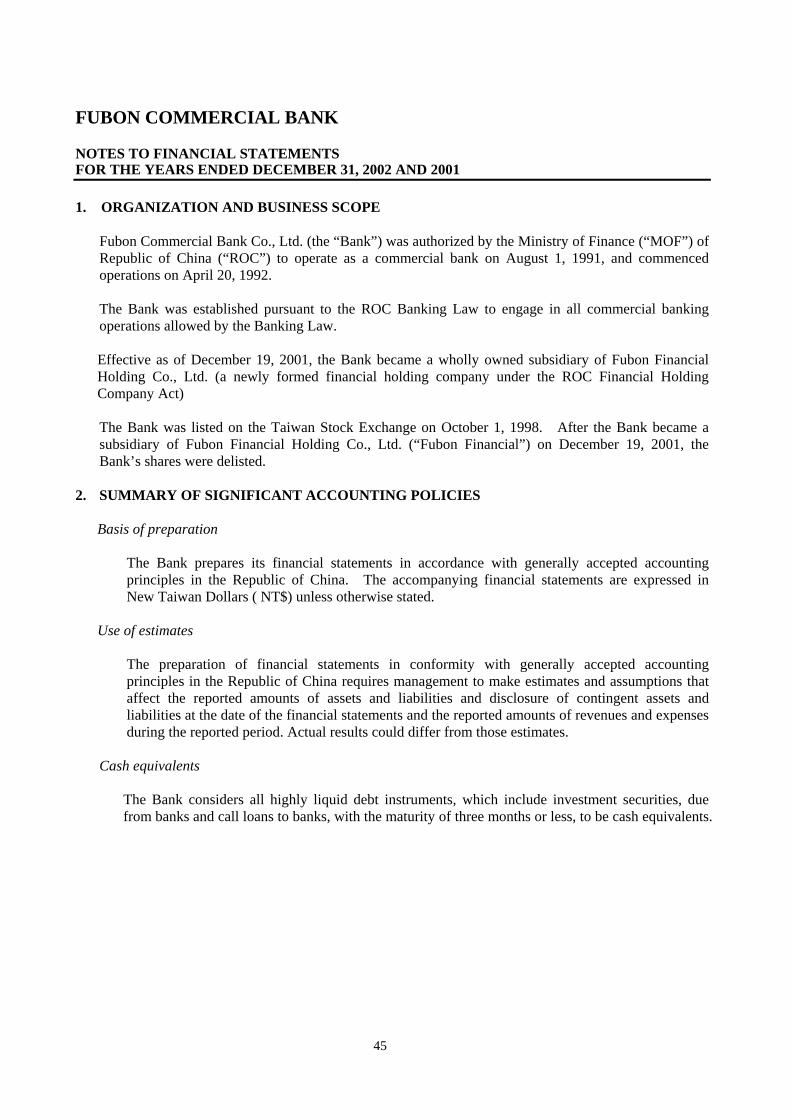
FUBON COMMERCIAL BANK NOTES TO FINANCIAL STATEMENTS FOR THE YEARS ENDED DECEMBER 31, 2002 AND 2001 1. ORGANIZATION AND BUSINESS SCOPE
Fubon Commercial Bank Co., Ltd. (the “Bank”) was authorized by the Ministry of Finance (“MOF”) of Republic of China (“ROC”) to operate as a commercial bank on August 1, 1991, and commenced operations on April 20, 1992. The Bank was established pursuant to the ROC Banking Law to engage in all commercial banking operations allowed by the Banking Law. Effective as of December 19, 2001, the Bank became a wholly owned subsidiary of Fubon Financial Holding Co., Ltd. (a newly formed financial holding company under the ROC Financial Holding Company Act) The Bank was listed on the Taiwan Stock Exchange on October 1, 1998. After the Bank became a subsidiary of Fubon Financial Holding Co., Ltd. (“Fubon Financial”) on December 19, 2001, the Bank’s shares were delisted.
2. SUMMARY OF SIGNIFICANT ACCOUNTING POLICIES
Basis of preparation The Bank prepares its financial statements in accordance with generally accepted accounting principles in the Republic of China. The accompanying financial statements are expressed in New Taiwan Dollars ( NT$) unless otherwise stated.
Use of estimates
The preparation of financial statements in conformity with generally accepted accounting principles in the Republic of China requires management to make estimates and assumptions that affect the reported amounts of assets and liabilities and disclosure of contingent assets and liabilities at the date of the financial statements and the reported amounts of revenues and expenses during the reported period. Actual results could differ from those estimates.
Cash equivalents
The Bank considers all highly liquid debt instruments, which include investment securities, due from banks and call loans to banks, with the maturity of three months or less, to be cash equivalents.
45

Short-term investments
Marketable equity securities are recorded at cost when acquired and are stated at the lower of aggregate cost or market value. Market value is determined by the average closing price of the last month of the accounting period. Stock dividends are treated as an increase in the number of shares. The cost of marketable equity securities sold is determined by the weighted-average cost method.
The market value for mutual funds is determined by the net asset value per share accounted by the investment management companies. Short-term notes are recorded at cost when acquired and are stated at the lower of aggregate cost or market value on the balance sheet date, if the market value is available. The cost of these notes, interest income, and gain or loss either due to maturity or resulting from the sale of notes are determined by the specific identification method.
Loans
Loans are stated at the principal amounts less allowance for possible loan losses and non-accrual loans transferred to other assets. Non-accrual loans are defined as: 1. Loans for which the most recent principal or interest payment is overdue by more than six
months, or 2. Loans on which the Bank has initiated foreclosure and the related collateral has been sold.
3. When there are postponement or modification of the credit terms for the debtors, the Bank
agrees to receive partial interests and the rest of interests are stopped accumulating. The interests during the stopped accumulating period are not recognized until realized.
Allowance for loan losses
In determining the allowance for credit losses, the Bank evaluates the collectability of its loan portfolio and credit guarantees based on the borrowers’/ clients’ payment history and the related loan classification as non-performing, in accordance with “Rules for Bank Assets Evaluation, Loss Reserve Provision, and Disposing of Overdue loans, Non-accrual Loans and Bad Debts” issued by the MOF. Write-off of specific loans under MOF guidelines are first offset against the recorded allowance for loan losses. If the allowance is insufficient to cover loans write-offs, the Bank recognizes additional losses on loans in the statement of income for the current period. Amounts of bad debts recovered are accounted for as non-operating income in the statement of income. As a result of changes in the operating and financial performance of customers and general economic conditions of the market which may have an impact on the debtors’ ability to repay their loans, and uncertainties related to the future realization of collateral values, the ultimate losses may be different from the amounts presently estimated and provisioned.
46

Reserve for guarantees and securities losses
The reserve for losses on guarantees is determined by evaluating the potential losses of acceptances, guarantees and letters of credit on the balance sheet date. The accumulated reserve is recorded as a liability on the balance sheet. Amounts recovered are accounted for under non-operating income in the statement of income. According to the “Rules Governing the Administration of Securities Firms”, 10% of the monthly gains on trading bills and securities less the monthly losses should be set aside into a reserve until the reserve equals NT$200.0 million. Such reserve can only be used to offset actual losses.
Long-term investments
Long-term investments in listed companies, where the Bank owns less than 20% of the voting stock and lacks significant operational influence over the investees, are stated at the lower of cost or market value. Unrealized losses thereon are recorded as a reduction in shareholders’ equity. Long-term investments in non-listed companies, which represent less than 20% of the investee’s common stock ownership, are stated at cost. However, when there is evidence showing that a decline in the recorded value of such investment is other that temporary, the investment is written down to reflect the decline in value and the resulting loss is recognized in the period of such a write-down. Stock dividends are not recognized as income but treated as an increase in the number of shares held. Investments in equity securities in which the Bank owns 20% or more of the investee’s voting shares and has significant influence over the investee are accounted for under the equity method. Under the equity method, the difference between the acquisition cost of the investment and the underlying equity of the investment is amortized over five years on a straight-line basis and recognized as investment income or loss. Upon sale of long-term equity investments (accounted for under the cost method), the difference between the weighted average cost and sale price is used to compute the resulting gain or loss reflected in the statement of income. A corporation becomes a subsidiary when another corporation acquires a controlling interest (over 50 percent) in its outstanding voting stock. When a parent-subsidiary relationship exists, consolidated financial statement are required unless both the assets and operation income of the subsidiary are less than 10% of the amounts of the parent company or the consolidation is not proper due to the different operating characteristics between the parent company and its subsidiary. If the combined total assets and combined operating income of the unqualified subsidiaries are more than 30% of the amounts of the parent company, the subsidiaries with assets and operating income amounted to more than 3% of the parent’s amounts still need to be consolidated in the parent’s financial statements until the combined total assets and combined operating income of the unqualified subsidiaries decreases to less than 20% of the amounts of the parent company. The Bank’s subsidiaries that do not meet such criteria for consolidation are accounted for under the equity method of accounting. Unrealized gains and losses from transactions between the Bank and investees under equity method are eliminated or deferred to the future years. The unrealized gains and losses that resulted from depreciable and amortizable assets are recognized over the useful years of assets. In addition, the unrealized gains and losses from other kinds of assets are recognized in the year which they are realized.
47

Long-term debt investments
Long-term debt investments, which are intended to be held for over one year, are stated at cost. Premiums and discounts are amortized over the Bank’s intended holding period of the debt instruments. In addition, long-term debt investments are denominated in foreign currency translated into NT dollars at regulated exchange rates. The resulting foreign exchange gains or losses are included in the statement of income for the period. Unrealized losses are recognized in the statement of income for the period.
Property and equipment and leasehold assets
Property and equipment and leasehold assets are stated at cost. Depreciation of buildings and equipment is provided over the estimated useful lives of the respective assets on the straight-line method. Leasehold improvements are amortized over the lesser of lease terms or the useful lives of such improvements. Renewals and improvements are capitalized and depreciated accordingly, repairs and maintenance are charged to expenses as incurred.
Foreclosed assets Foreclosed assets are recorded at the appraised value, which is generally believed to be the fair market value at the time of acquisition. When the cost is less than the net realizable value at the balance sheet date, provisions for decline in value of such assets is recognized as losses in the statement of income for the period.
Retirement plan
The Bank has established a retirement plan for all employees. Pension plan benefits are based primarily on participants’ compensation and years of credited service. The Bank contributions to pension assets are equal to 8% of total salary expense. In compliance with ROC Securities and Futures Commission regulations, the Bank implemented ROC Statement of Financial Accounting Standards (SFAS) No. 18, “Accounting for Pensions” to account for pension plan on actuarial basis. An actuarial valuation of the pension liability is performed at the balance sheet date, and a minimum pension liability is reported in the financial statements in the amount based on the difference between the plans accumulated benefit obligation and the fair value of plans’ assets, when the cumulative benefit obligation exceeds the fair market value of the pension fund assets.
Interest income
Interest income is recognized on an accrual basis except for interest on non-accrual loans. Such interest on non-accrual loans is recognized when received.
48

Income tax The Bank adopted the amended SFAS statement No. 22 “Accounting for Income Tax” which requires inter-period and intra-period tax allocations in addition to computing current period income tax expense. Furthermore, it requires recognition of deferred income tax liabilities on future taxable temporary differences, and deferred income tax assets on future deductible temporary differences, prior year’s loss carry-forwards and investment tax credits. The realization of deferred income tax assets is further assessed, and a valuation allowance, if needed, is provided accordingly. Adjustment of prior year’s income tax expense is recorded as current period income tax expense in the year of adjustment. Deferred income tax assets and liabilities are classified as current or non-current in accordance with the underlying assets or liabilities. Deferred income taxes not relating to assets or liabilities are classified as current or non-current based on the expected period to realize or reverse. Additionally, a 10% business income tax on undistributed earnings is recognized as expense in the year of the resolution of the shareholders’ meeting.
Foreign currency transactions
Foreign currency transactions are recorded in New Taiwan dollars at the rates of exchange in effect when the transactions occurred. Gains or losses resulting from adjustments or settlements of foreign currency assets and liabilities are credited or charged to income. Foreign currency assets and liabilities at the balance sheet date are translated at year-end exchange rates, and resulting gains or losses are credited or charged to current income.
Derivative financial instruments The Bank is party to certain derivative transactions, including forward contracts, currency swaps, interest rate swaps and currency options. The Bank also engages in forward currency contracts on behalf of its customers.
Foreign currency swaps
Memorandum entries of the notional amount of foreign currency swap contracts entered into for hedging purposes are recorded on contracting dates. Unrealized gains or losses resulting from the change in rates are recognized as period gains or losses.
Forward currency contracts
Net assets and liabilities resulting from open foreign currency forward contracts are recorded in New Taiwan dollars at the rate of exchange in effect at the balance sheet date. Unrealized gains or losses resulting from the subsequent change in foreign currency exchange rates are recognized as current period gains or losses.
49

Cross currency swaps For cross currency swap contracts, memorandum entries of the nominal amounts are recorded on the contracting dates. Forward accounts receivable and accounts payable are offset on the balance sheet date with the differences listed as net assets or liabilities. For trading contracts, differences in market value are recognized as transaction gains or losses. For non-trading contracts, interest receivables or payables and amortized principal as determined by agreement are recognized as current interest income or expenses, along with the hedged positions.
Options For option contracts, the premium collected from put options is recognized as advance receipts and the premium paid for call options is recognized as prepaid expenses. The values of the option contracts are evaluated every month according to the market prices, and the differences are recognized as current period revenues or expenses.
Interest rate swaps The Bank engages in such contracts for hedging purposes. Interest receivables or payables related to such swap contract, together with hedged positions, are recognized as current interest income or expenses.
Non-delivery deposit forward contracts Given that there is no physical transfer of principal in non-delivery forward transactions, only memorandum entries of nominal amount are recorded on contracting date. Upon maturity of a contract, gains or losses resulting from the difference in exchange rate applied on maturity date are credited or charged to the current period. On the balance sheet date, differences resulting from exchange rate adjustments of uncleared positions with respect to the time remaining are recognized as current exchange gains or losses.
Commitments and contingencies
If losses on commitments and contingencies are considered probable and can be reasonably estimated, then the losses are recorded in the statement of income for the current period.
Earnings per share of common stock
Earnings per share (EPS) are computed as net income divided by the weighted average number of outstanding shares of common stock. The effect of any increase in outstanding shares due to the issuance of stock dividends, from retained earnings or capital surplus, is computed retroactively.
Treasury stock
The Bank uses the cost method to account for treasury stock. Under the cost method, treasury stock is debited at the cost of the shares purchased. When treasury stock is sold at a price greater than the cost, the difference is credited to capital surplus-treasury stock. If the sales price of treasury stock is lower than the cost, the difference is used to offset capital surplus from similar treasury stock. If the capital surplus-treasury stock account is insufficient to cover the excess of the cost over the price, retained earnings is debited for the remaining amount. The book value of each share of treasury stock is equal to its weighted-average value and is calculated according to its reason for purchase. When treasury stock is retired, capital surplus and common stock are debited according to the ratio of retiring treasury stock to total issued stock. When the book value of the retiring treasury stock is
50
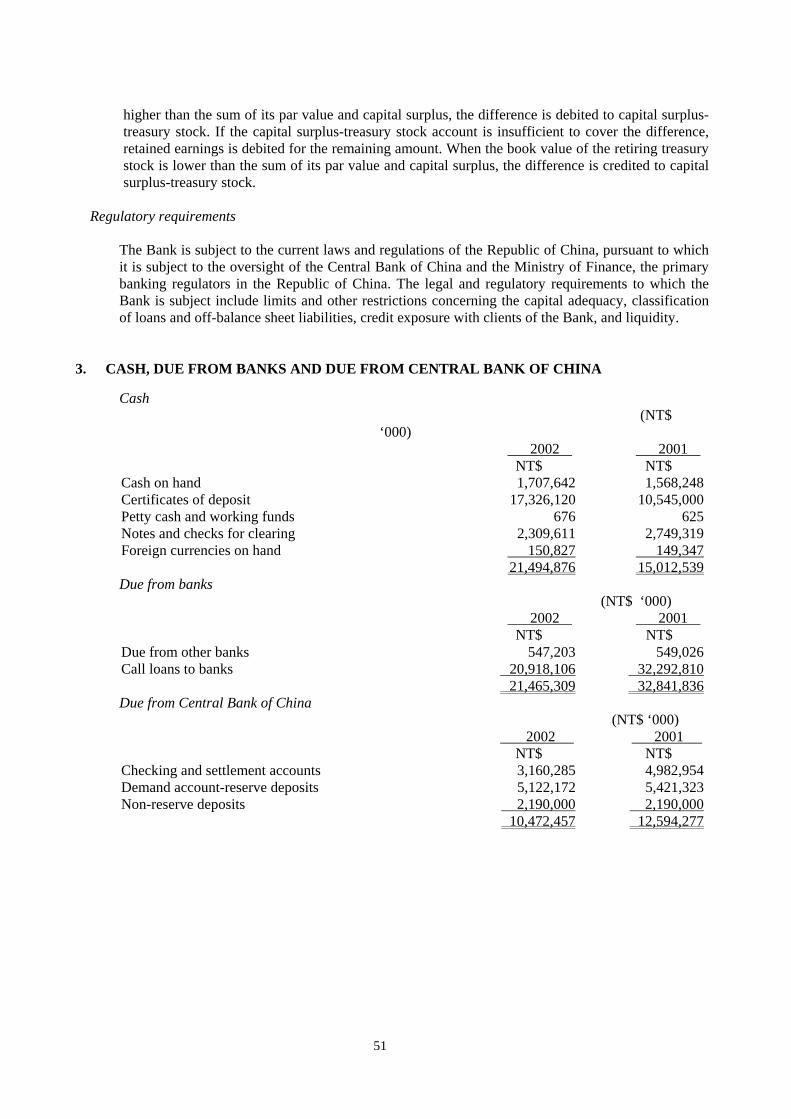
higher than the sum of its par value and capital surplus, the difference is debited to capital surplus-treasury stock. If the capital surplus-treasury stock account is insufficient to cover the difference, retained earnings is debited for the remaining amount. When the book value of the retiring treasury stock is lower than the sum of its par value and capital surplus, the difference is credited to capital surplus-treasury stock.
Regulatory requirements
The Bank is subject to the current laws and regulations of the Republic of China, pursuant to which it is subject to the oversight of the Central Bank of China and the Ministry of Finance, the primary banking regulators in the Republic of China. The legal and regulatory requirements to which the Bank is subject include limits and other restrictions concerning the capital adequacy, classification of loans and off-balance sheet liabilities, credit exposure with clients of the Bank, and liquidity.
3. CASH, DUE FROM BANKS AND DUE FROM CENTRAL BANK OF CHINA
Cash (NT$
‘000) 2002 2001 NT$ NT$
Cash on hand 1,707,642 1,568,248Certificates of deposit 17,326,120 10,545,000Petty cash and working funds 676 625Notes and checks for clearing 2,309,611 2,749,319Foreign currencies on hand 150,827 149,347 21,494,876 15,012,539Due from banks
(NT$ ‘000) 2002 2001 NT$ NT$
Due from other banks 547,203 549,026Call loans to banks 20,918,106 32,292,810 21,465,309 32,841,836Due from Central Bank of China
(NT$ ‘000) 2002 2001 NT$ NT$
Checking and settlement accounts 3,160,285 4,982,954Demand account-reserve deposits 5,122,172 5,421,323Non-reserve deposits 2,190,000 2,190,000 10,472,457 12,594,277
51
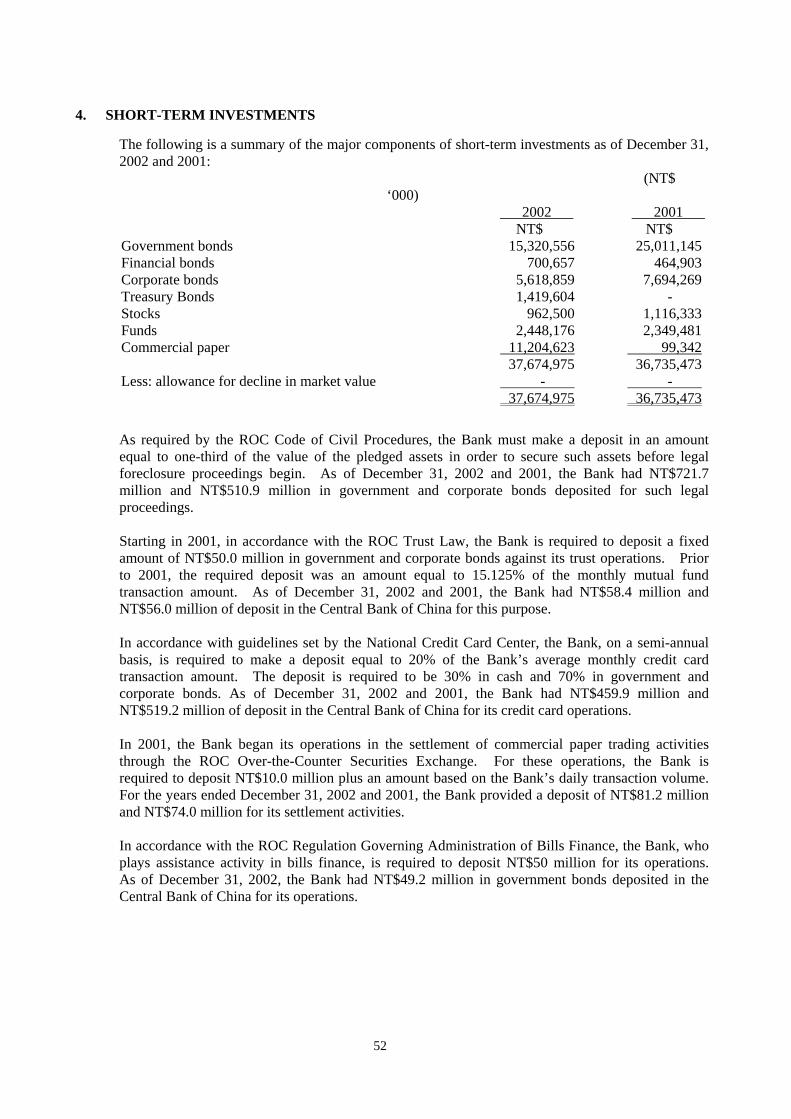
4. SHORT-TERM INVESTMENTS
The following is a summary of the major components of short-term investments as of December 31, 2002 and 2001:
(NT$ ‘000)
2002 2001 NT$ NT$
Government bonds 15,320,556 25,011,145Financial bonds 700,657 464,903Corporate bonds 5,618,859 7,694,269Treasury Bonds 1,419,604 - Stocks 962,500 1,116,333Funds 2,448,176 2,349,481Commercial paper 11,204,623 99,342 37,674,975 36,735,473Less: allowance for decline in market value - - 37,674,975 36,735,473
As required by the ROC Code of Civil Procedures, the Bank must make a deposit in an amount equal to one-third of the value of the pledged assets in order to secure such assets before legal foreclosure proceedings begin. As of December 31, 2002 and 2001, the Bank had NT$721.7 million and NT$510.9 million in government and corporate bonds deposited for such legal proceedings.
Starting in 2001, in accordance with the ROC Trust Law, the Bank is required to deposit a fixed amount of NT$50.0 million in government and corporate bonds against its trust operations. Prior to 2001, the required deposit was an amount equal to 15.125% of the monthly mutual fund transaction amount. As of December 31, 2002 and 2001, the Bank had NT$58.4 million and NT$56.0 million of deposit in the Central Bank of China for this purpose. In accordance with guidelines set by the National Credit Card Center, the Bank, on a semi-annual basis, is required to make a deposit equal to 20% of the Bank’s average monthly credit card transaction amount. The deposit is required to be 30% in cash and 70% in government and corporate bonds. As of December 31, 2002 and 2001, the Bank had NT$459.9 million and NT$519.2 million of deposit in the Central Bank of China for its credit card operations. In 2001, the Bank began its operations in the settlement of commercial paper trading activities through the ROC Over-the-Counter Securities Exchange. For these operations, the Bank is required to deposit NT$10.0 million plus an amount based on the Bank’s daily transaction volume. For the years ended December 31, 2002 and 2001, the Bank provided a deposit of NT$81.2 million and NT$74.0 million for its settlement activities. In accordance with the ROC Regulation Governing Administration of Bills Finance, the Bank, who plays assistance activity in bills finance, is required to deposit NT$50 million for its operations. As of December 31, 2002, the Bank had NT$49.2 million in government bonds deposited in the Central Bank of China for its operations.
52

5. RECEIVABLES
(NT$ ‘000) 2002 2001 NT$ NT$
Notes receivable 110 273,835Allowance for notes receivable (Note 6) - (170,972)Accounts receivable 6,995,815 4,475,322Allowance for accounts receivable (Note 6) (467,900) (70,063)Tax refund receivable 313,639 215,181Accrued income receivable 197,717 249,442Acceptance receivable 255,567 297,540Interest receivable 1,303,069 1,610,538Forward proceeds receivable 1,685,280 929,483Forward proceeds receivable - foreign currencies 2,049,622 814,760Other receivables 837,202 350,985 13,170,121 8,976,051
6. LOANS
Loans consist of the following as of December 31, 2002 and 2001: (NT$ ‘000)
2002 2001 NT$ NT$
Bills discounted and purchased 298,122 254,533Short-term loans and overdrafts 11,294,152 17,280,303Secured short-term loans and overdrafts 10,143,035 15,225,640Medium-term loans 42,436,171 26,806,948Medium-term secured loans 18,573,222 22,762,099Long-term loans 5,178,639 2,915,591Long-term secured loans 55,980,909 56,333,935Non-accrual loans 1,656,423 3,455,967
Gross loans 145,560,673 145,035,016Allowance for loan losses:
Loans, net of non-accrual loans (1,625,885) (715,864)Non-accrual loans (469,686) (672,263)
Net non-accrual loans, transferred to other assets (Note 9) (1,186,737) (2,783,704) 142,278,365 140,863,185
53
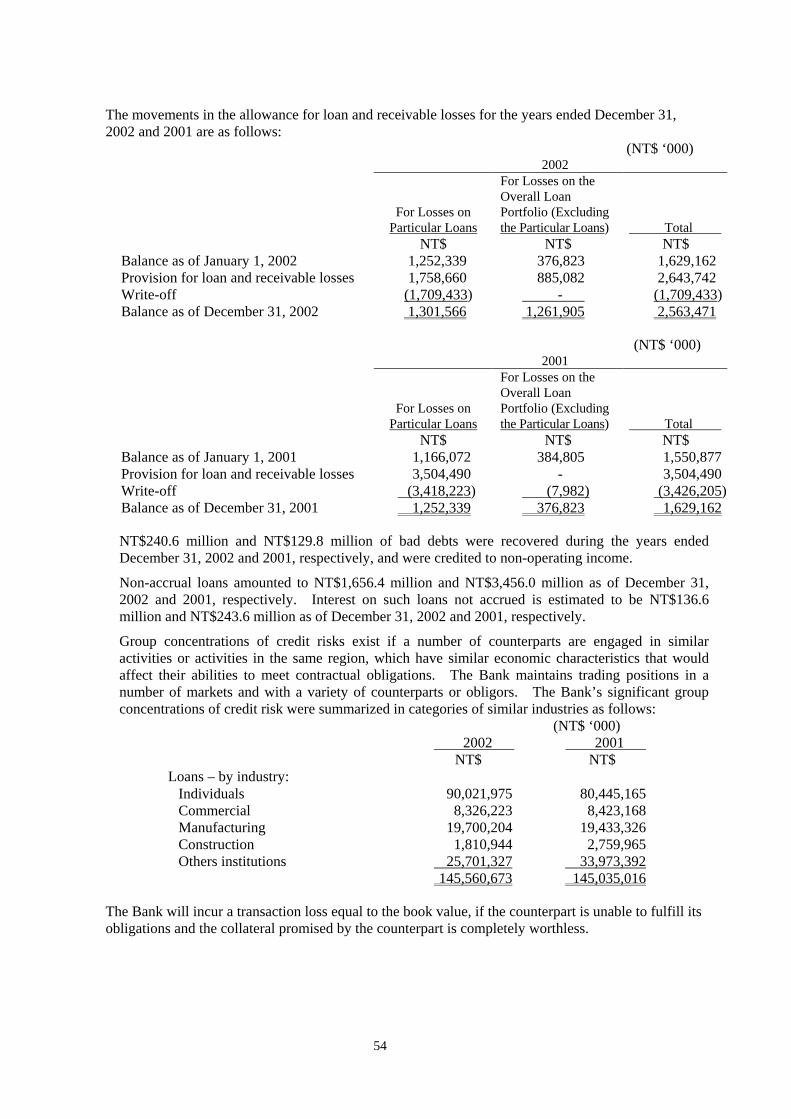
The movements in the allowance for loan and receivable losses for the years ended December 31, 2002 and 2001 are as follows:
(NT$ ‘000) 2002
For Losses on
Particular Loans
For Losses on the Overall Loan Portfolio (Excluding the Particular Loans) Total
NT$ NT$ NT$ Balance as of January 1, 2002 1,252,339 376,823 1,629,162Provision for loan and receivable losses 1,758,660 885,082 2,643,742Write-off (1,709,433) - (1,709,433)Balance as of December 31, 2002 1,301,566 1,261,905 2,563,471
(NT$ ‘000) 2001
For Losses on
Particular Loans
For Losses on the Overall Loan Portfolio (Excluding the Particular Loans) Total
NT$ NT$ NT$ Balance as of January 1, 2001 1,166,072 384,805 1,550,877Provision for loan and receivable losses 3,504,490 - 3,504,490Write-off (3,418,223) (7,982) (3,426,205)Balance as of December 31, 2001 1,252,339 376,823 1,629,162
NT$240.6 million and NT$129.8 million of bad debts were recovered during the years ended December 31, 2002 and 2001, respectively, and were credited to non-operating income.
Non-accrual loans amounted to NT$1,656.4 million and NT$3,456.0 million as of December 31, 2002 and 2001, respectively. Interest on such loans not accrued is estimated to be NT$136.6 million and NT$243.6 million as of December 31, 2002 and 2001, respectively.
Group concentrations of credit risks exist if a number of counterparts are engaged in similar activities or activities in the same region, which have similar economic characteristics that would affect their abilities to meet contractual obligations. The Bank maintains trading positions in a number of markets and with a variety of counterparts or obligors. The Bank’s significant group concentrations of credit risk were summarized in categories of similar industries as follows:
(NT$ ‘000) 2002 2001 NT$ NT$ Loans – by industry:
Individuals 90,021,975 80,445,165 Commercial 8,326,223 8,423,168 Manufacturing 19,700,204 19,433,326 Construction 1,810,944 2,759,965 Others institutions 25,701,327 33,973,392 145,560,673 145,035,016
The Bank will incur a transaction loss equal to the book value, if the counterpart is unable to fulfill its obligations and the collateral promised by the counterpart is completely worthless.
54

7. LONG-TERM INVESTMENTS
Long-term investments as of December 31, 2002 and 2001 consist of the following: (NT$ ‘000)
2002 2001 Percentage of
Ownership (%) Amount
NT$
Percentage of Ownership (%)
Amount
NT$ Equity securities:
Equity method: Fubon Construction Management Co., Ltd.
30.00
46,204
30.00
45,017
Fubon Bills Finance Co., Ltd. 100.00 5,893,401 99.79 4,958,644Fubon Leasing Co., Ltd. 99.99 838,094 99.99 836,891Fubon Future Co., Ltd. 30.00 217,877 30.00 219,411Fu-Yin Insurance Agent Co., Ltd. 95.00 33,478 95.00 14,282Fubon Insurance Agent Co., Ltd. 99.00 2,153 99.00 2,826
Cost method: Fubon Securities Finance Co., Ltd. 5.67 337,011 5.67 337,011Fubon Venture Capital Co., Ltd. 5.00 25,000 5.00 25,000Taiwan High Speed Rail Co., Ltd. 1.01 500,000 1.01 500,000Taiwan Fixed Network Co., Ltd. 0.22 200,000 0.22 200,000Taiwan Assets Management Co., Ltd. 1.14 200,000 1.14 200,000Other (percentage of shares held under
5 % or amount under 100,000 thousand)- 390,739 - 405,739
The lower of cost or fair market value method: Fubon Financial Holding Co., Ltd. 0.50 1,164,336 0.76 1,164,336Other (percentage of shares held under
5 % or amount under 100,000 thousand)- 21,717
- 42,230
9,870,010 8,951,387Less: allowance for decline in market value (134,725) (73,058)
9,735,285 8,878,329Long-term debt investment 969,921 1,297,755Less: allowance for decline in market value (138,393) (169,785) 831,528 1,127,970
10,566,813 10,006,299
All the invested companies of the Bank under the equity method excluding Fubon Construction Management Co., Ltd. and Fubon Future Co., Ltd. are subsidiaries over 50% held by the Bank. However, each subsidiary’s total assets and total operating income are below the criterion of marking consolidated financial statements, and all the subsidiaries’ combined assets and combined operating income are under 30% of the Bank’s total assets and total operating income, therefore the Bank and its subsidiaries are not necessary to prepare the consolidated financial statements.
55

For the years ended December 31, 2002 and 2001, the original costs and investment revenues of investments under the equity method of accounting were as follows:
(NT$ ‘000)
Original cost Investment revenue 2002 2001 2002 2001 NT$ NT$ NT$ NT$ Fubon Construction Management Co., Ltd. 30,000 30,000 1,187 4,508Fubon Bills Finance Co., Ltd. 3,910,329 3,900,291 924,719 531,172Fubon Leasing Co., Ltd. 999,900 999,900 1,203 8,673Fubon Future Co., Ltd. 196,170 196,170 13,529 22,555Fu-Yin Insurance Agent Co., Ltd. 1,900 1,900 29,888 11,880Fubon Insurance Agent Co., Ltd. 1,980 1,980 76 831
In September 2001, the Board of Directors resolved to invest in Fubon Bills Finance Co., Ltd. The Bank acquired the stocks amounted to NT$2,082.0 million at NT$12.45 per share from September 2001 through November 2001, and then acquired the stocks amounted to NT$78 thousand at NT$12.975 per share from June 2002 through July 2002. Therefore the percentage of ownership increased to 100.00%. Furthermore, related parties were involved in this transaction as disclosed in Note 17.
As of December 31, 2002 and 2001, long-term debt investments consisted of the following:
(NT$ ‘000) 2002 2001 Corporate bonds NT$ NT$
Domestic 382,580 315,063 Foreign - 45,246
Floating rate notes Domestic 86,950 262,553 Foreign 223,550 389,767
Other 276,841 285,126 969,921 1,297,755
Long-term debt corporate bonds are primarily denominated in US dollars and have future maturities ranging to 2013.
8. PROPERTY AND EQUIPMENT, AND LEASEHOLD ASSETS (NT$ ‘000)
2002 2001 NT$ NT$ Land 2,582,508 2,564,397 Buildings and improvements 2,192,252 1,918,451 Equipment 844,720 686,175 Transportation equipment 109,999 112,148 Miscellaneous equipment 336,825 309,087 Leasehold improvements 535,736 510,597 Unfinished construction and prepayment for equipment
64,934 77,067
Leased assets 2,050 13,150 Total costs 6,669,024 6,191,072 Less: accumulated depreciation (1,646,785) (1,452,056) 5,022,239 4,739,016
56

In December 1999, the Bank purchased land, buildings and parking lots for the proposed branch premises in Neihu for NT$890.7 million. Additional costs were incurred subsequent to the purchase of NT$38.5 million and the architectural consulting fee of this transaction of NT$12.6 million was paid to a related party (see Note 17). The Bank had paid the entire purchase price as of June 30, 2001.
In February 2001, the Bank purchased land, buildings and parking lots for the proposed branch premises in Tuchen for NT$118.9 million. As of September 30, 2001, the Bank had paid the entire purchase price.
Leasehold assets include foreclosed properties and self-owned properties that are leased out. The cost of these leased assets was as follows:
(NT$ ‘000)
2002 2001 NT$ NT$ Cost:
Land 50,552 29,489 Buildings 199,329 185,036 Total cost 249,881 214,525
Less: accumulated depreciation (17,389) (10,929) 232,492 203,596
The lease period of the above assets range from one to ten years and such assets are leased to related parties as disclosed in Note 17.
9. OTHER ASSETS
Other assets as of December 31, 2002 and 2001 consist of the following: (NT$ ‘000)
2002 2001 NT$ NT$ Statutory deposits 395,996 348,154Non-accrual loans, transferred from loans (Note 6) 1,656,423 3,455,967Less: allowance for loan losses, transferred from loans (Note 6) (469,686) (672,263)Foreclosed assets 517,479 1,160,635Less: allowance for decline in market value (50,000) (50,000)Restricted assets 3,200,000 - Deferred tax assets 279,172 226,143Deferred charges 69,605 30,500Others 7,435 7,363 5,606,424 4,506,499
The Bank has NT$3,200 million in certificates of deposit which was accounted as restricted assets at December 31, 3002. In accordance with the rule set by Central Bank of China, the Bank is required to deposit sufficient guaranty for daytime overdraft to Central Bank of China. As of December 31, 2002, the Bank had NT$ 3,200 million in certificates of deposit deposited in the Central Bank of China for this purpose. The interest rate is between 1.625% and 2.249%, and the final due date is December 8, 2003.
57

The Bank holds NT$313.2 million of Fubon Financial shares which was originally accounted as restricted assets at December 31, 2001. However, in accordance with file No.91111467 issued by MOF on April 8, 2002, those shares held should be treated as treasury stocks and recorded as a reduction in shareholders’ equity. Accordingly, the 2001 financial statements as presented herein have been restated for such change.(Note 13).
10. DEPOSITS
Deposits as of December 31, 2002 and 2001 consist of the following: (NT$ ‘000)
2002 2001 NT$ NT$
Checking accounts 2,413,074 2,332,640 Demand deposits 21,655,913 17,573,505 Time deposits 68,350,734 87,403,878 Savings deposits 126,254,077 119,948,586 Remittances payable 167,390 222,631 218,841,188 227,481,240
As of December 31, 2002 and 2001, the Bank issued negotiable certificates of deposits of NT$1,430.2 million, and NT$2,009.9 million, respectively, recorded as time deposits.
11. FINANCIAL BONDS
In order to maintain the risk-based capital ratio, the Bank needs to collect long-term operating capital. For this purpose, the Bank applied to the Bureau of Monetary Affairs, Ministry of Finance for the issuance of financial bonds amounted to NT$10,000 million, and the issuance was authorized at September 4, 2002. The Bank issued financial bonds which both amounted to NT$5,000 million in October and December, 2002, respectively. The interest is paid semiannually and the principal will be paid when the bonds mature. The details were as follows: (NT$ ‘000) Bond type Issue date Maturity date Interest rate Amount NT$ Type A,B,C,K,L,M,P of
the first issuance in 2002 Oct. 14 and 15, 2002
Oct. 14 and 15, 2007
5.35%-floating rate 2,600,000
Type D,E,F,G,J,O of the first issuance in 2002
Oct. 14 and 15, 2002
Oct. 14 and 15, 2007
First computing : 4.20% 1,400,000
After the interests are computed once :5.25% - floating rate
Type H of the first issuance in 2002
Oct. 14, 2002 Oct. 14, 2007 1st computing : 5.80%-1.00 ×floating rate
300,000
2nd computing : 5.80%-1.05 ×floating rate
3rd computing : 5.80%-1.10 ×floating rate
4th computing : 5.80%-1.15 ×floating rate
5th computing : 5.80%-1.20 ×floating rate
58
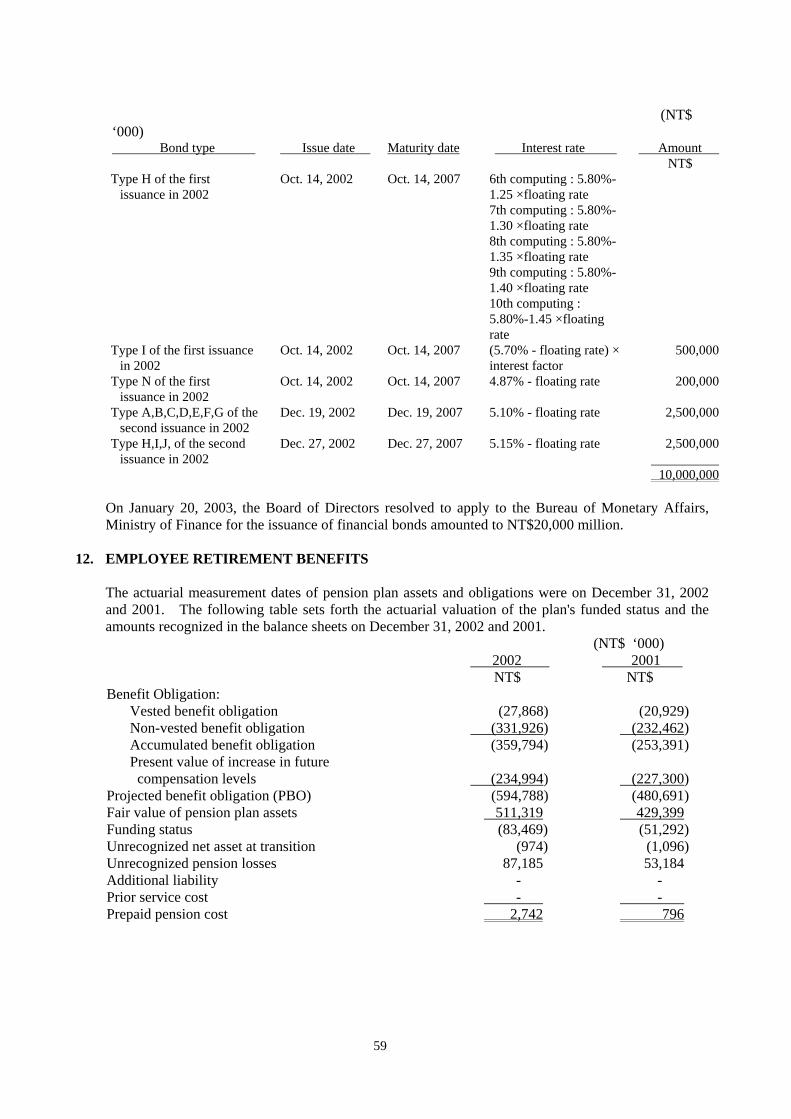
(NT$ ‘000) Bond type Issue date Maturity date Interest rate Amount
NT$ Type H of the first
issuance in 2002 Oct. 14, 2007 6th computing : 5.80%-
1.25 ×floating rate 7th computing : 5.80%-
1.30 ×floating rate
9th computing : 5.80%-1.40 ×floating rate
10th computing : 5.80%-1.45 ×floating rate
Type I of the first issuance in 2002
Oct. 14, 2002 Oct. 14, 2007 (5.70% - floating rate) × interest factor
500,000
Type N of the first issuance in 2002
Oct. 14, 2002 Oct. 14, 2007 4.87% - floating rate 200,000
Type A,B,C,D,E,F,G of the second issuance in 2002
Dec. 19, 2002 Dec. 19, 2007 5.10% - floating rate 2,500,000
Dec. 27, 2002 Dec. 27, 2007 5.15% - floating rate 2,500,000
10,000,000
12. EMPLOYEE RETIREMENT BENEFITS
The actuarial measurement dates of pension plan assets and obligations were on December 31, 2002 and 2001. The following table sets forth the actuarial valuation of the plan's funded status and the amounts recognized in the balance sheets on December 31, 2002 and 2001.
(NT$ ‘000) 2002 2001
NT$ NT$ Benefit Obligation:
Vested benefit obligation (27,868) (20,929) Non-vested benefit obligation )
Oct. 14, 2002
8th computing : 5.80%-1.35 ×floating rate
Type H,I,J, of the second issuance in 2002
On January 20, 2003, the Board of Directors resolved to apply to the Bureau of Monetary Affairs, Ministry of Finance for the issuance of financial bonds amounted to NT$20,000 million.
) (232,462 (331,926Accumulated benefit obligation (359,794) (253,391) Present value of increase in future compensation levels
(234,994)
(227,300)
Projected benefit obligation (PBO) (594,788) (480,691) Fair value of pension plan assets 511,319 429,399 Funding status (83,469) (51,292) Unrecognized net asset at transition (974) (1,096) Unrecognized pension losses 87,185 53,184 Additional liability - - Prior service cost - Prepaid pension cost 2,742 796
-
59

For the years ended December 31, 2002 and 2001, net pension costs of the Bank were as follows: (NT$ ‘000)
2002 2001 NT$ NT$ Service cost 73,741 73,909 Interest cost 21,903 22,716 Expected return on pension plan assets (21,433) (22,148) Amortization on net benefit obligation (122) (122) Amortization on pension loss 205 400
Net pension cost 74,294 74,755
As of December 31, 2002 and 2001, the significant assumptions used in the calculations for the defined benefit plans were as follows:
2002 2001
Discount rate 3.75% 4.75% Annual increase in future compensation levels 3.25% 4.00% Expected long-term rate of return on assets 3.75% 4.75%
The changes of the retirement funds assets in 2002 and 2001 were as follows: (NT$ ‘000)
2002 2001 NT$ NT$ Beginning balance 430,297 350,164 Deposits during the period 76,273 75,139 Interest and investment income during the period 11,158 16,167 Withdrawals during the period (5,031) (11,173) Ending balance 512,697 430,297
As of December 31, 2002, the pension funds assets were primarily invested in the Central Trust of China (78.53%) and ROC listed stocks (21.47%).
13. SHAREHOLDERS’ EQUITY
On October 26, 2001, in connection with the formation of Fubon Financial, the shareholder of the Bank resolved to exchange their shares into shares of Fubon Financial at a ratio of 1.7053 shares of the Bank for 1 share of Fubon Financial. As a result of such exchange, the Bank’s 2,185,736,697 authorized shares (including 27,934,000 shares previously owned as treasury stock) became one hundred percent owned by Fubon Financial at December 19, 2001.
On April 19, 2002, the Board of Directors resolved to appropriate the year 2001 earnings as follows: (a) transfer NT$885.2 million to legal reserve, and recover the special reserve transferred in prior years according to Securities Exchange Law No. 41 of NT$346.4 million; (b) declare cash dividends and employees’ bonuses of NT$2,300 million and NT$21 million, respectively. The declaration date was May 15, 2002.
60

According to file No. 092000457 issued by MOF, the employees’ benefits and the directors’ and supervisors’ compensation of the year 2001 earning are disclosed as follows:
(NT$ ‘000)
Estimated earning Actual earning Appropriation Appropriation
NT$ NT$ Cash dividends distributed to employees 21,000 21,000 Stock dividends distributed to employees - - Directors’ and supervisors’ compensation - - Percentage of the stock dividends distributed to
employees out of the outstanding shares - -
The imputed earnings per share after distributing employees’ cash dividends and directors’ and supervisors’ compensation (NT$)
1.36 1.36
The Board of Directors has not passed the resolution of the earning distribution until the audit report date. The planned datas were declared by Fubon Financial and are all available through the market observation post system. As the Bank became a subsidiary of Fubon Financial on December 19, 2001 the Board of Directors has amended the Articles of Incorporation (“Articles”) on March 22, 2002. The Articles stipulate that the Bank’s net earnings will first be used to pay income tax, and then, cover prior years’ deficits, if any, and 30% of the remaining balance should be transferred to legal reserve before any dividend payments. The remaining balance, after appropriating 1% to 5% for employees’ bonus, can be distributed as dividends according to the resolution of the shareholders’ meeting. Before the Bank became a subsidiary of Fubon Financial, according to the regulations of SFC, the earnings of listed corporations shall not only be set aside as legal reserve but also, according to Securities Exchange Law No. 41, reserve the amount equal to any valuation or contra-account in the stockholders’ equity in the fiscal year (such as unrealized losses of valuation on long-term investment, cumulative translation adjustments, etc.) from the net income and prior unappropriated earnings as special reserve. If the valuation or contra-account in stockholders’ equity belongs to prior periods, the same amount from prior period earnings should be reserved as special reserve and can’t be distributed. If the valuation or contra-account of stockholders’ equity is reversed, the special reserve amount could be distributed.
The cash distribution can’t exceed 15% of authorized share capital unless the legal reserve reaches the amount equal to the authorized share capital. Except the legal reserve, the Bank can keep partial or all of its unappropriated earnings according to the resolution of shareholders’ meeting. The above dividend policy has been approved by the Board of Directors on March 22, 2002.
61

The Bank’s previous outstanding shares purchased by the Bank in order to transfer to employees are recorded as treasury stocks in years prior to 2001. The changes in the treasury stock for the years ended December 31, 2002 and 2001 were as follows:
(unit : thousand shares) Period
Reason
Shares on Jan. 1, 2002
Increase during the year
Decrease during the year
Shares on Dec. 31, 2002
For the year ended Dec. 31, 2002
According to “Rule of purchasing own stocks from Securities Exchange”, purchasing shares in order to transfer to employees
27,934 - 6,360 21,574
Period
Reason
Shares on Jan. 1, 2001
Increase during the year
Decrease during the year
Shares on Dec. 31, 2001
For the year ended Dec. 31, 2001
According to “Rule of purchasing own stocks from Securities Exchange”, purchasing shares in order to transfer to employees
27,784 150 - 27,934
Securities Exchange Law regulates that corporation's purchase of their own stocks cannot be above 10% of the issued shares, and the dollar amount of purchase cannot be more than the retained earnings plus reserve for capital increase and realized capital surplus. The Bank reclaimed treasury stock on September 25, 2000 and November 6, 2000. On the basis of auditors’ report as of June 30, 2000 and September 30, 2000, the upper limits are 173.5 million and 172.5 million shares, respectively, and the upper limits in dollar amounts are NT$4,361.4 million and NT$4,947.9 million, respectively. Up to December 31, 2002 and 2001, the Bank purchased 21.6 million and 27.9 million shares, and the costs were NT$245.3 million and NT$313.2 million, respectively. Since the Bank has become a subsidiary of Fubon Financial on December 19, 2001(Note 1), the previously owned treasury stock of the Bank was exchanged for stock of Fubon Financial and was transferred to the account “other assets-restricted assets” at the treasury stocks’ book value at the same date. However according to file No. 91111467 issued by MOF, the stocks should be regarded as treasury stocks and recorded as a reduction in shareholders’ equity. The financial report for the year 2001 has been restated, accordingly.
According to the ROC Securities and Exchange Law, the treasury stock of the Bank cannot be pledged and cannot have any shareholders’ rights until transferred. In March 2002, the Board of Directors resolved to sell the treasury stock to employees and the SFC had approved the sale. The difference between the selling price and the cost amounted to NT$6.5 million is credited to capital surplus-treasury stock.
62
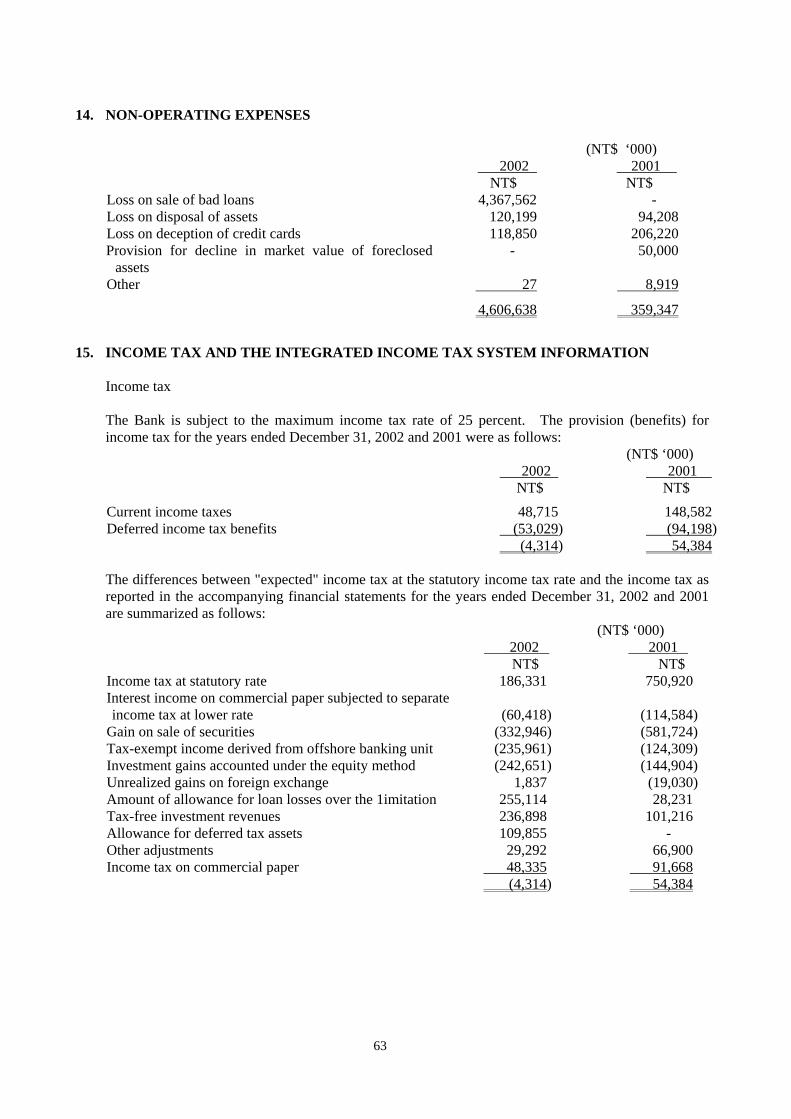
14. NON-OPERATING EXPENSES
(NT$ ‘000) 2002 2001 NT$ NT$ Loss on sale of bad loans 4,367,562 - Loss on disposal of assets 120,199 94,208 Loss on deception of credit cards 118,850 206,220 Provision for decline in market value of foreclosed
assets - 50,000
Other 27 8,919
4,606,638 359,347
15. INCOME TAX AND THE INTEGRATED INCOME TAX SYSTEM INFORMATION
Income tax The Bank is subject to the maximum income tax rate of 25 percent. The provision (benefits) for income tax for the years ended December 31, 2002 and 2001 were as follows:
(NT$ ‘000) 2002 2001 NT$ NT$ Current income taxes 48,715 148,582 Deferred income tax benefits (53,029) (94,198) (4,314) 54,384 The differences between "expected" income tax at the statutory income tax rate and the income tax as reported in the accompanying financial statements for the years ended December 31, 2002 and 2001 are summarized as follows:
(NT$ ‘000) 2002 2001 NT$ NT$ Income tax at statutory rate 186,331 750,920 Interest income on commercial paper subjected to separate income tax at lower rate
(60,418)
(114,584)
Gain on sale of securities (332,946) (581,724) Tax-exempt income derived from offshore banking unit (235,961) (124,309) Investment gains accounted under the equity method (242,651) (144,904) Unrealized gains on foreign exchange 1,837 (19,030) Amount of allowance for loan losses over the 1imitation 255,114 28,231 Tax-free investment revenues 236,898 101,216 Allowance for deferred tax assets 109,855 - Other adjustments 29,292 66,900 Income tax on commercial paper 48,335 91,668 (4,314) 54,384
63

The deferred income tax benefits consisted of the following: (NT$ ‘000)
2002 2001 NT$ NT$ Recovery of decline in market value of long-term
investments 7,573 875
Losses carried forward (83,235) (92,304) Tax credit 22,633 (2,769) (53,029) (94,198)
The income tax effects of temporary differences that gave rise to deferred tax assets as of December 31, 2002 and 2001 were as follows:
(NT$ ‘000) 2002 2001 Deferred tax assets: NT$ NT$
Unrealized losses on decline in market value of long-term investments
30,059
37,632
Tax credit 73,574 96,207 Losses carried forward 290,447 97,357 394,080 231,196 Allowance for deferred tax assets (114,908) (5,053)
279,172 226,143 According to the law of Income tax, the losses could be carried forward 5 years to deduct from income. As of December 31, 2002, the details of the Bank’s losses for past years were as follows: Declared (approved) The extended year Year of the loss occurred amount of losses Deductable amount for the carried losses NT$ NT$ Year 2001 667,855 262,738 Year 2006 Year 2002 1,826,429 878,837 Year 2007 1,141,575 Management believes that it has adequately provided for tax liabilities in the accompanying financial statements, however, the risk remains that relevant authorities could take differing positions with regard to interpretative issues. The effect on the Bank tax returns previously filed could be significant. The National Tax Administration of Taipei has reviewed the Bank’s tax return through 2000 except 1999. As a result of such tax reviews, the tax authorities have assessed additional taxes on the Bank equal to NT$42.3 million related to various matters. Management has appealed such assessments and believes the ultimate outcome of such assessments made, as well as the possible amounts that could be assessed on tax years not yet reviewed, related to such matters, will not have a material effect on the Bank’s financial position or reported operating results.
64
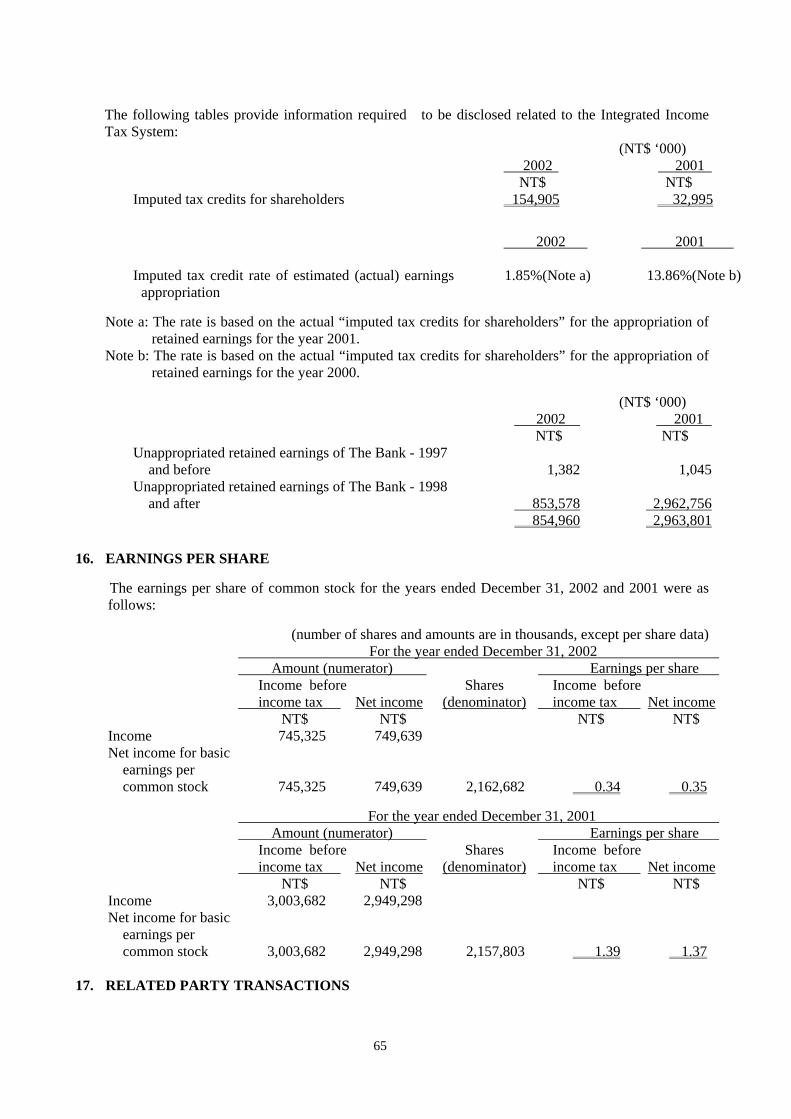
The following tables provide information required to be disclosed related to the Integrated Income Tax System:
(NT$ ‘000) 2002 2001
NT$ NT$ Imputed tax credits for shareholders 154,905 32,995
2002 2001 Imputed tax credit rate of estimated (actual) earnings
appropriation 1.85%(Note a) 13.86%(Note b)
Note a: The rate is based on the actual “imputed tax credits for shareholders” for the appropriation of
retained earnings for the year 2001. Note b: The rate is based on the actual “imputed tax credits for shareholders” for the appropriation of
retained earnings for the year 2000.
(NT$ ‘000) 2002 2001 NT$ NT$ Unappropriated retained earnings of The Bank - 1997
and before 1,382
1,045
Unappropriated retained earnings of The Bank - 1998 and after
853,578
2,962,756
854,960 2,963,801
16. EARNINGS PER SHARE
The earnings per share of common stock for the years ended December 31, 2002 and 2001 were as follows:
(number of shares and amounts are in thousands, except per share data) For the year ended December 31, 2002
Amount (numerator) Earnings per share Income before
income tax Net income
Shares (denominator)
Income before income tax
Net income
NT$ NT$ NT$ NT$ Income 745,325 749,639 Net income for basic
earnings per common stock
745,325
749,639
2,162,682
0.34
0.35
For the year ended December 31, 2001
Amount (numerator) Earnings per share Income before
income tax Net income
Shares (denominator)
Income before income tax
Net income
NT$ NT$ NT$ NT$ Income 3,003,682 2,949,298 Net income for basic
earnings per common stock
3,003,682
2,949,298
2,157,803
1.39
1.37
17. RELATED PARTY TRANSACTIONS
65
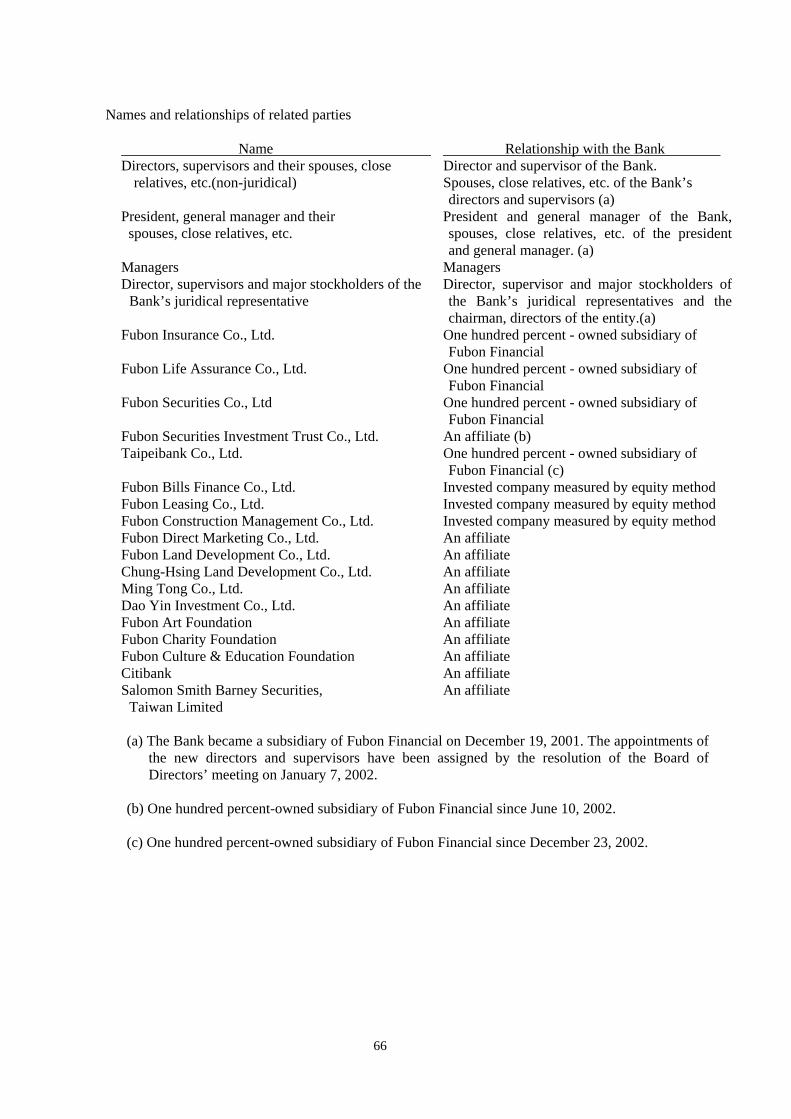
Names and relationships of related parties
Name Relationship with the Bank Directors, supervisors and their spouses, close
relatives, etc.(non-juridical) Director and supervisor of the Bank. Spouses, close relatives, etc. of the Bank’s directors and supervisors (a)
President, general manager and their spouses, close relatives, etc.
President and general manager of the Bank, spouses, close relatives, etc. of the president and general manager. (a)
Managers Managers Director, supervisors and major stockholders of the
Bank’s juridical representative Director, supervisor and major stockholders of the Bank’s juridical representatives and the chairman, directors of the entity.(a)
Fubon Insurance Co., Ltd. One hundred percent - owned subsidiary of Fubon Financial
Fubon Life Assurance Co., Ltd. One hundred percent - owned subsidiary of Fubon Financial
Fubon Securities Co., Ltd One hundred percent - owned subsidiary of Fubon Financial
Fubon Securities Investment Trust Co., Ltd. An affiliate (b) Taipeibank Co., Ltd. One hundred percent - owned subsidiary of
Fubon Financial (c) Fubon Bills Finance Co., Ltd. Invested company measured by equity method Fubon Leasing Co., Ltd. Invested company measured by equity method Fubon Construction Management Co., Ltd. Invested company measured by equity method Fubon Direct Marketing Co., Ltd. An affiliate Fubon Land Development Co., Ltd. An affiliate Chung-Hsing Land Development Co., Ltd. An affiliate Ming Tong Co., Ltd. An affiliate Dao Yin Investment Co., Ltd. An affiliate Fubon Art Foundation An affiliate Fubon Charity Foundation An affiliate Fubon Culture & Education Foundation Citibank
An affiliate An affiliate
Salomon Smith Barney Securities, Taiwan Limited
An affiliate
(a) The Bank became a subsidiary of Fubon Financial on December 19, 2001. The appointments of
the new directors and supervisors have been assigned by the resolution of the Board of Directors’ meeting on January 7, 2002.
(b) One hundred percent-owned subsidiary of Fubon Financial since June 10, 2002. (c) One hundred percent-owned subsidiary of Fubon Financial since December 23, 2002.
66

Significant transactions and account balances with related parties as of and for the years ended December 31, 2002 and 2001 are as follows: Deposits
(NT$ ‘000) For the year ended December 31, 2002 Name
Balance on Dec. 31 of deposits
Interest rate range
NT$ Other (Each related party does not account for
more than 10% of total deposits)
5,602,676
2.56%
0~7.5%
Percentage
(NT$ ‘000)
For the year ended December 31, 2001
Name Balance on
Dec. 31 Percentage of deposits
Interest rate range
NT$ Other (Each related party does not account for
more than 10% of total deposits)
8,190,679
3.60%
0~13.00%
The interest rate paid on deposits held by the Bank’s directors, supervisors, and managers up to the maximum of NT$480 thousand was according to the two-year time saving deposits interest rate plus 5% per annum and fixed rate of 13% per annum for the years ended December 31, 2002 and 2001, respectively. The part of deposit exceeding NT$480 thousand will earn interest calculated at the demand savings rate.
The interest rates and other terms provided to the other related parties are the same as those offered to the general public.
Loans
(NT$ ‘000) December 31, 2002 Name
Balance on Dec. 31
Percentage of loans
Interest rate range
NT$ Other (Each related party does not account
for more than 10% of total loans)
825,609
0.57%
2.15~8.25%
(NT$ ‘000) December 31, 2002 Name
Balance on Dec. 31
Percentage of loans
Interest rate range
NT$ Other (Each related party does not account
for more than 10% of total loans)
419,464
0.30%
3.70~8.43%
67
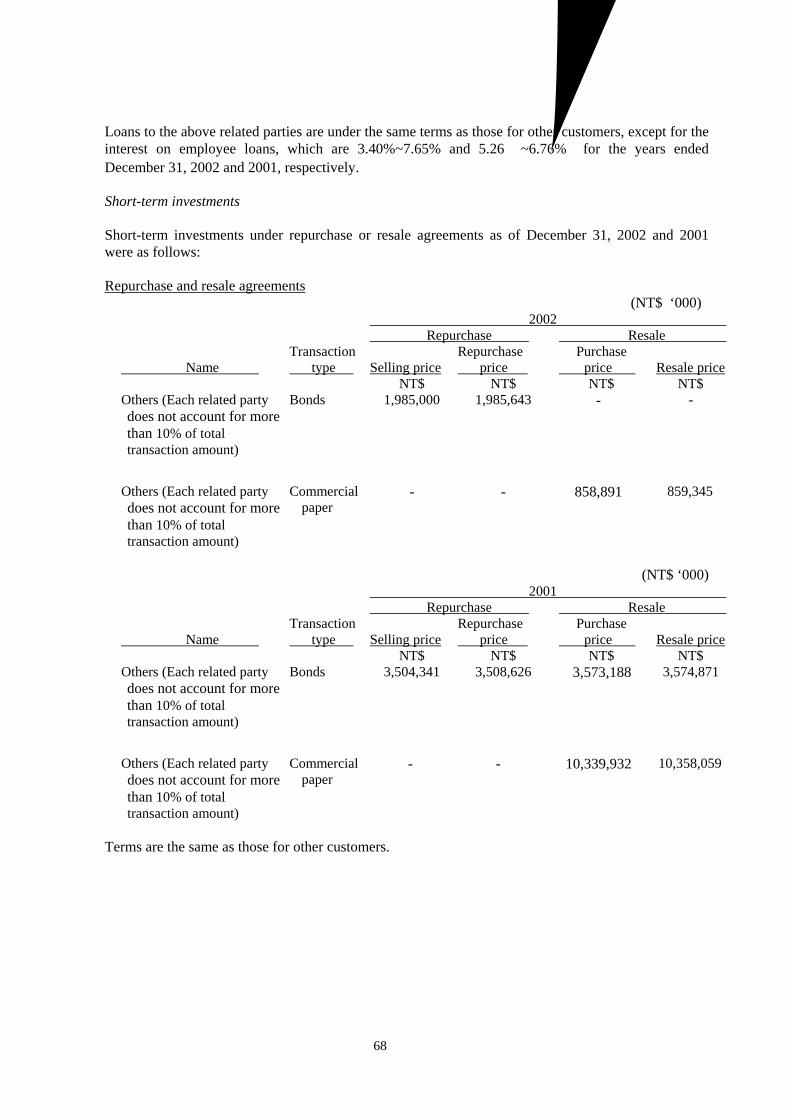
Loans to the above related parties are under the same terms as those for other customers, except for the interest on employee loans, which are 3.40%~7.65% and 5.26%~6.76% for the years ended December 31, 2002 and 2001, respectively. Short-term investments Short-term investments under repurchase or resale agreements as of December 31, 2002 and 2001 were as follows:
Repurchase and resale agreements (NT$ ‘000)
2002 Repurchase Resale
Name Transaction type
Selling price
Repurchase price
Purchase price
Resale price
NT$ NT$ NT$ NT$ Others (Each related party does not account for more than 10% of total transaction amount)
Bonds 1,985,000 1,985,643 - -
Others (Each related party does not account for more than 10% of total transaction amount)
Commercial paper
- - 858,891 859,345
(NT$ ‘000)
2001 Repurchase Resale
Name Transaction type
Selling price
Repurchase price
Purchase price
Resale price
NT$ NT$ NT$ NT$ Others (Each related party does not account for more than 10% of total transaction amount)
Bonds 3,504,341 3,508,626 3,573,188 3,574,871
Others (Each related party does not account for more than 10% of total transaction amount)
Commercial paper
- - 10,339,932 10,358,059
Terms are the same as those for other customers.
68

Purchase or sale agreements (NT$ ‘000)
2002
Name Transaction type
Purchase transaction price
Sale transaction
price NT$
Others (Each related party does not account for more than 10% of total transaction amount)
Commercial paper
3,927,397 -
Others (Each related party does not account for more than 10% of total transaction amount)
Bonds 46,014,309
NT$
38,684,875
(NT$ ‘000)
2001
Name Transaction
type
Purchase Transaction
price
Sale transaction
price NT$ NT$ Salomon Smith Barney Securities, Taiwan Limited Bonds
Others (Each related party does not account for more than 10% of total transaction amount)
Balance on
36,678,892 -
Others (Each related party does not account for more than 10% of total transaction amount)
Commercial paper
3,670,299 -
Bonds 37,749,715 61,938,940
Terms are the same as those for other customers.
Due from and due to related parties
The Bank’s due from related parties as of and related interest revenue for the years ended December 31, 2002 and 2001 were as follows:
(NT$ ‘000) Highest balance for
the year of Name 2002 Dec 31, 2002 Maximum limit Interest rate % Interest revenue
NT$ NT$ NT$ NT$ Fubon Bills Finance
Co., Ltd. 1,800,000 1,200,000 2,200,000 14,804
NT$ NT$ NT$ NT$
Citibank 50,000 50,000 2,000,000 1.43 29 US$ US$ US$ US$
Citibank 284,279 - 479,000 2.00~2.19 2,144
1.40~2.43
69

(NT$ ‘000) Highest balance for
the year of Balance on Name 2002 Dec 31, 2002 Maximum limit Interest rate % Interest revenue
NT$ NT$ NT$ NT$ Taipeibank Co., Ltd. 2,000,000 1,000,000 2,000,000 1.55~1.93 1,506
US$ US$ US$ US$
Taipeibank Co., Ltd. 18,000 - 48,000 1.45~1.99 130
EUR$ EUR$ EUR$ 2,000 (Note) 3.11 1 2,000
Balance on
Note: The due from banks between the Bank and Taipeibank Co., Ltd., the common limitation is US$48 million.
(NT$ ‘000) Highest balance for the year of
Name 2001 Dec. 31, 2001 Maximum limit Interest rate % Interest revenue NT$ NT$ NT$ NT$
Fubon Bills Finance Co., Ltd.
1,800,000 2,200,000 2.40~5.05 51,739
NT$ NT$ NT$ NT$
Citibank 600,000 - 2,000,000 2.42~3.45 164 US$ US$ US$ US$
Citibank 323,238 284,279 479,000 1.87~6.71 6,297
2,160,000
The Board of Directors of the Bank approved the above transactions. Terms are the same as those for other customers.
The Bank’s due to related parties as of December 31, 2002 was as follows: (US$ ‘000)
Highest balance for the year of Balance on
Name 2002 Dec. 31, 2002 Interest rate % Interest expense US$ US$ US$ Taipeibank Co., Ltd. 15,000 - 1.71~1.83 43
Citibank
US$ US$ US$
8,900 1.39~1.86 38 5,000
Long-term investment transaction
In September 2001, the Board of Directors resolved to purchase 51.8 million shares of Fubon Bills Finance Co., Ltd. From September 2001 through November 2001 and June 2002, the Bank acquired the stocks from Ming Tong Co., Ltd., the major stockholders and managers of the Bank. The total investment at the end of 2001 and 2002 amounted to NT$645.3 million at NT$12.45 per share and NT$78 thousand at NT$12,975 per share, respectively. The transaction price per share is similar to the net worth per share of Fubon Bills Finance Co., Ltd. on the basis of its audited financial statements for the six months ended June 30, 2001.
Leases
Operating leases
70

(NT$ ‘000)
The Bank leases the office premises of some branches from related parties as follows:
Rental expenses Name Lease period 2002 2001 NT$ NT$ Chung-Hsing Land Development Co., Ltd. 2∼5 years 56,874
2∼5 years 70,625 Dao Yin Investment Co., Ltd. Fubon Securities Co., Ltd. 548
5 years 5,394
As of December 31, 2002 and 2001, the Bank paid related parties rent deposits, which were NT$5.3 million and NT$4.4 million, respectively. The rent was paid on a monthly or quarterly basis.
(NT$ ‘000)
70,655 Ming Tong Co., Ltd. 5∼10 years 21,644 25,767 Fubon Insurance Co., Ltd. 66,072
5 years 8,264 8,010 5 years 1,500
Fubon Life Assurance Co., Ltd. -
The Bank has entered into certain operating leases for security deposit counters with Fubon Securities Co., Ltd. The rent for the years ended December 31, 2002 and 2001 amounted to NT$117.9 million and NT$92.2 million, respectively.
The Bank leases properties to related parties as follows:
Rent revenue
Name Address Lease period 2002 2001 NT$ NT$
Fubon Securities Co., Ltd. B1, No. 476, Chung-Cheng Road, Tao-Yuan City
06/01/1997 to05/31/2002
650 1,560
07/31/2007
Fubon Securities Co., Ltd. B1, No. 476, Chung-Cheng Road, Tao-Yuan City
06/01/2002 to05/31/2007
1,040 -
Fubon Direct Marketing Co., Ltd.
F4, No. 62, Rui-Hu Street, Taipei City
08/01/2002 to 1,466 -
Rent revenues are collected monthly.
Capital leases The Bank leases stamp machines, card-made machines and computer equipment, etc. from Fubon Leasing Co., Ltd. for a period of three years. At the end of the third year, the Bank owns the leased machine and equipment without any additional obligation. The leased assets and payables are calculated at an interest rate of 13.65%. The depreciation and interest expenses are recognized every period when paying the rental fees. The depreciation expense is calculated under the straight-line method. During November 2001, the Bank cancelled the capital leasing contact of packaging equipment, and the Bank recognized a loss of NT$2,673 thousand for breaching the contract. As of December 31, 2002 and 2001, the leased assets are as follows:
(NT$ ‘000) 2002 2001
NT$ NT$ Lease assets in total 2,050 13,150
71

As of December 31, 2002, the total yearly rent payable in the future is as follows:
(NT$ ‘000) Fiscal year Amount NT$ Year 2003 827 Year 2004 69
The Bank signed contracts with Fubon Land Development Co., Ltd., for the architectural consulting to assure the constructional quality and stage of the new building in Neihu. The total consulting fee is NT$12.6 million, and the Bank had paid the balance as of June 30, 2001. Derivative financial instruments Trading contracts of derivatives held or issued between the Bank and related parties, as of December 31, 2002 and 2001 were as follows:
2002 2001 Name Financial instruments Amount Limitation Amount Limitation
Swap foreign currency transaction contracts
US$ 240,000
US$ 393,238
US$ 579,000
Interest rate swap contracts of assets
US$ -
US$ 4,000
-
Citibank Interest rate swap contracts 3,500,000
US$ 160,000
-
Citibank Spot foreign currency transaction contracts 2,340
JPY$ 35,538 US$
20,426
US$ 240,000
US$ 240,000
US$ 240,000
- -
Fubon Securities Co., Ltd.
Interest rate swap contracts of assets
US$ 5,000
- - -
Taipeibank Co., Ltd.
Spot foreign currency transaction contracts
US$ 3,000 160,000
- -
Citibank US$
20,000 Citibank
55,000 NT$ -
HKD$
US$
Insurance
The spot foreign currency transaction contracts held or issued between the Bank and Citibank, the common limitation is US$240 million.
The Bank has various insurance policies with Fubon Insurance Co., Ltd. The insurance coverage for electronic equipment, buildings, office facilities and comprehensive insurance amounted to NT$2,908.6 million and NT$2,828.9 million as of December 31, 2002 and 2001, respectively. In addition, the Bank purchased insurance to cover liability on safe-deposit with coverage of NT$100 million and paid the premiums of NT$7.5 million and NT$6.0 million for the years ended December 31, 2002 and 2001, respectively. Furthermore, the insurance premiums paid for liabilities of transportation vehicles and public accident were NT$3.2 million and NT$2.8 million for the years ended December 31, 2002 and 2001, respectively.
72

Other Transactions
(NT$ ‘000)
As of December 31, 2002 and 2001, the Bank has an employee safety insurance policy with Fubon Life Assurance Co., Ltd. The premiums paid for the years ended December 31, 2002 and 2001 were NT$15.0 million and NT$10.8 million, respectively.
For the years ended December 31, 2002 and 2001, the Bank received fees from Fubon Securities Investment Trust Co., Ltd. for safe custody NT$102.1 million and NT$87.9 million and sale of fund NT$60.0 million and NT$25.9 million, respectively. The Bank entrusted Fubon Securities Co., Ltd. as its proxy for stock-related procedures. The fees paid were NT$600 thousand and NT$8.5 million for the years ended December 31, 2002 and 2001, respectively. The Bank hired Fubon Construction Management Co., Ltd. for the valuation of properties held as collateral. The fees paid were NT$4.2 million and NT$5.7 million for the years ended December 31, 2002 and 2001, respectively. The Bank hired Fubon Direct Marketing Co., Ltd. to perform marketing services and has paid NT$3.5 million for the year ended December 31, 2001. Donations The Bank donated NT$36.4 million and NT$20.2 million to Fubon Charity Foundation for the years ended December 31, 2002 and 2001, respectively. The Bank donated NT$3.1 million and NT$1 million to Fubon Art Foundation for the years ended December 31, 2002 and 2001, respectively. The Bank donated NT$0.4 million and NT$1 million to Fubon Culture & Education Foundation for the years ended December 31, 2002 and 2001, respectively.
18. CONTINGENT LIABILITIES AND COMMITMENTS
(1) Guarantees and letters of credit As of December 31, 2002 and 2001, the Bank has the following credit related off-balance sheet liabilities and commitments:
2002 2001 NT$ NT$ Guarantees issued 11,803,608 14,332,990 Unused customer liabilities under letters of credit 2,067,824 2,291,216 Loan commitments
10,075,505
47,719,975 41,235,309 Credit card commitments 251,580,554 121,904,300 Commercial paper, financial guarantees and standby letters
of credit commitments 6,578,724
8,874,803
Guaranteed notes outside the Bank 1,316,100 1,062,300 Forward commitments to repurchase bonds and securities 6,082,744 Contracted for the resale of bonds and securities 7,827,977 2,514,107
The Bank anticipates that not all of the above commitments will be utilized before the agreed-upon expiration or other termination clauses. The amount of unused commitment does not necessarily represent future funding requirements. For that reason, the nominal amount of the contract does not
73

represent the amount of the Bank’s exposure to credit risk. The amount is potentially subject to credit risk arising from the possible inability of counterparts to meet the terms of contracts and the material deterioration in the collateral against such commitments. Before entering into loan commitments, commercial paper arrangement, financial guarantees or letters of credits, the Bank evaluated the credit standing of counterparts. Certain counterparts were required to maintain collateral (in the form of cash, inventory or marketable securities) for all or part of the exposures prior to the approval and authorization process. The Bank has the right to dispose the collateral in case of default. Loan commitments with related collateral values (as determined by Fubon Bank) equal to, or exceeding such commitment amounts are 58.87% and 66.59% of all loan commitments as of December 31, 2002 and 2001, respectively.
Before entering into loan commitments the Bank’s credit card holders were not required to maintain collateral for the lines of credit committed by the Bank. The Bank evaluates the present credit-worthiness of the cardholders regularly, and would adjust their credit lines if there were a material deterioration in the credit-worthiness of the cardholders. For the years ended December 31, 2002 and 2001, the majority of the Bank’s credit commitments expired within one year and were in the 3.15%~13.91% and 4.89%~12.19% interest rates range, respectively. The interest rate for the credit card receivables at December 31, 2002 and 2001 were both up to 19.69%. The Bank’s commitments such as financial guarantees and letters of credit were conditional commitments to guarantee performance to third parties. These guarantee agreements primarily have expiration periods of up to one year and whereby the expiration dates were not concentrated in any specific period.
(2) Operating leases:
The Bank has entered into certain operating leases for its headquarters, branches and Trust Department. The significant provisions of the contracts as of December 31, 2002 were as follows:
The lease periods range from one to fifteen years. Rent payments are made monthly except for Ming Shan Branch and Trust Department which rent payments are made quarterly.
As of December 31, 2002, the estimated future lease payments under the lease contracts
were as follows: (NT$ ‘000)
Fiscal year Amount NT$
Future minimum lease payments due in years after 2007 amount to NT$134.3 million, of which the net present value is NT$115.8 million.
2003 242,133 2004 160,145 2005 133,568 2006 80,411 2007 34,030
74
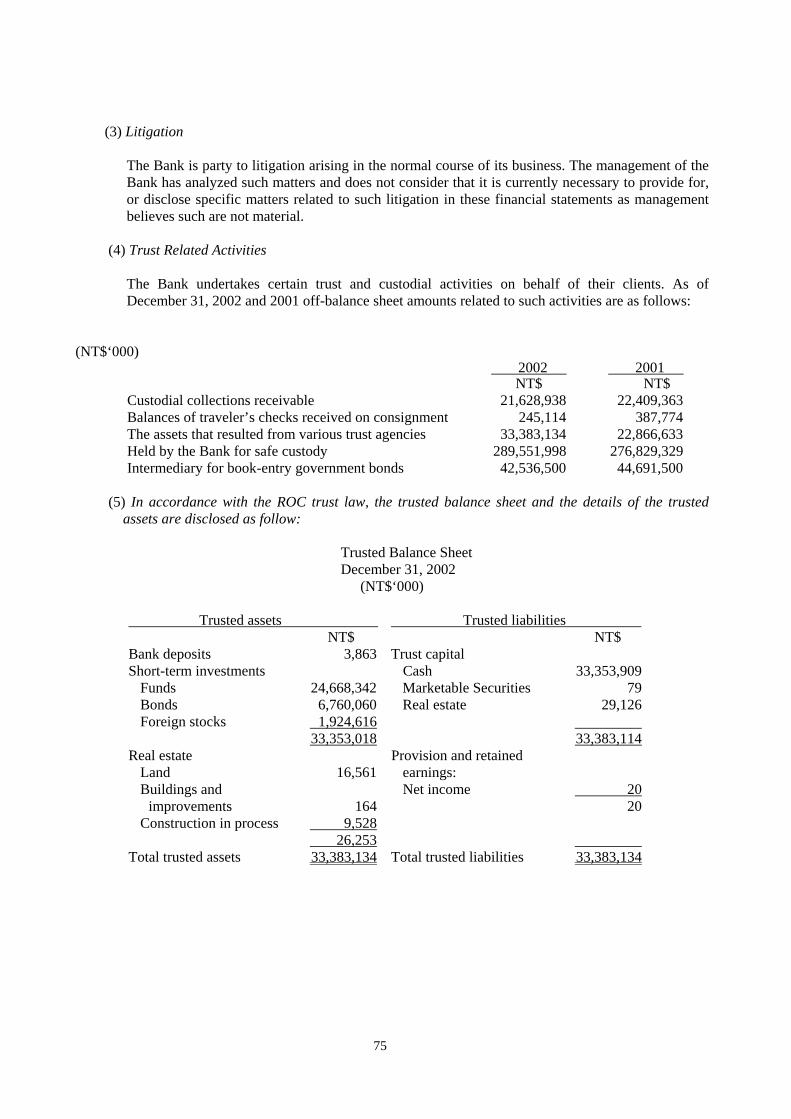
(3) Litigation
The Bank is party to litigation arising in the normal course of its business. The management of the Bank has analyzed such matters and does not consider that it is currently necessary to provide for, or disclose specific matters related to such litigation in these financial statements as management believes such are not material.
(4) Trust Related Activities
The Bank undertakes certain trust and custodial activities on behalf of their clients. As of December 31, 2002 and 2001 off-balance sheet amounts related to such activities are as follows:
(NT$‘000)
2002 NT$ Custodial collections receivable 21,628,938 22,409,363 Balances of traveler’s checks received on consignment 245,114 387,774 The assets that resulted from various trust agencies 33,383,134 22,866,633 Held by the Bank for safe custody 289,551,998 276,829,329 Intermediary for book-entry government bonds 42,536,500 44,691,500
2001 NT$
(5) In accordance with the ROC trust law, the trusted balance sheet and the details of the trusted
assets are disclosed as follow:
Trusted Balance Sheet December 31, 2002 (NT$‘000) Trusted assets Trusted liabilities
NT$ NT$ Bank deposits 3,863 Trust capital Short-term investments
Cash 33,353,909
Funds 24,668,342 Marketable Securities 79 Bonds 6,760,060 Real estate 29,126 Foreign stocks 1,924,616
33,353,018 33,383,114 Real estate
Buildings and
Provision and retained Land 16,561 earnings:
Net income 20 improvements 164 20
Construction in process 9,528 26,253
Total trusted assets 33,383,134 Total trusted liabilities 33,383,134
75

Trusted Assets December 31, 2002 (NT$‘000) Items Amount
NT$
Bank deposits 3,863 Short-term investments
Funds 24,668,342 Bonds 6,760,060 Foreign stocks 1,924,616
33,353,018 Real estate
164
Land 16,561 Buildings and improvements Construction in process 9,528 26,253
Total 33,383,134 19. OTHER
(1) Financial Instruments
A. Derivatives Financial Instruments Pursuant to the "Appointed Bank Regulations" established by the Central Bank of China, the Bank is eligible to engage in forward and swap foreign currency transactions and interest rate swap transactions on behalf of its customers and for its own hedging purposes. The maximum maturity period per contract is one year. The primary objective of holding forward contracts for hedging purposes is to limit exchange rate and interest rate exposures related to assets and liabilities denominated in foreign currencies and foreign currency commitments, and bearing fixed interest rates. In order to be highly effective in achieving offsetting changes in fair market value attributable to the hedged risk, the Bank designates derivative instruments negatively correlated to the proportionate changes in the fair market value of hedged item as hedging tools. Moreover, the positions are monitored on a timely basis.
(a) Derivatives financial instruments held or issued on behalf of customers
a) Notional amount and credit risk amount
(NT$‘000)
2002 2001 Financial instruments
Notional amount
Credit risk amount amount
Credit risk amount
NT$ NT$ NT$ NT$ Total Forward contracts 121,384 4,166 702,402 13,575
Notional
76

b) The Bank expects to engage in approximately NT$1,106 million (unaudited) notional amount of derivative financial instrument contracts on behalf of customers for the year ended December 31, 2003.
The Bank’s exposure to credit risk from financial instruments is measured based on guidelines set by the MOF. The credit risk amount, accounting for potential market risk and credit risk, and measured at fair market value, represents the possibility that an accounting loss to the Bank may occur as a direct result of the counterparts’ failure to meet their contractual obligations. To limit credit exposure arising from such transactions, the Bank evaluates the credit standing of the counterparts in accordance with the Bank’s policies and procedures of credit monitoring and approval.
c) For the years ended December 31, 2002 and 2001, the Bank incurred transactional
exchange gain amounted to NT$37.3 million and NT$1.4 million, respectively, for forward transactions.
d) The amounts of assets and liabilities recorded by the Bank related to derivative financial
instruments entered into on behalf of clients as of December 31, 2002 and 2001 were as follows:
(NT$‘000)
2002 2001 Category Book value Book value
NT$ NT$ Currency bought:
Forward proceeds receivable-foreign currencies 3,535 17,846 Forward exchange settlement payable 232 12,162
-
Currency sold: Forward proceeds receivable 1,522 Forward exchange settlement payable-foreign currencies 98 4,283
(b) Derivative financial instruments held or issued for hedging purposes
a) Nominal amount, and credit risk
(NT$‘000) 2002 2001
Financial instruments Notional amount Credit risk amount Notional amount Credit risk amount NT$ NT$
29,474
- Non-delivery deposit forward (NDF) contracts
1,043
208
NT$ NT$ Foreign exchange swap contracts
5,392,513
17,802
14,141,038
Interest rate swap contracts of assets
3,885,580
3,712
763,503
175
Interest rate swap contracts
14,500,000
14,500
-
-
Forward contracts 812,809 1,665 - 105,021
210
77

The Bank’s exposure to credit risk from financial instruments is measured based on guidelines set by the MOF. The credit risk amount, accounting for potential market risk and credit risk, and measured at fair market value, represents the possibility that an accounting loss to the Bank may occur as a direct result of the counterparts’ failure to meet their contractual obligations. To limit credit exposure arising from such transactions, the Bank evaluates the credit standing of the counterparts in accordance with the Bank’s policies and procedures of credit monitoring and approval. The Bank only maintains its transactions with the counterparts who are well-known financial institutions with excellent credit standing. Consequently, the Bank does not anticipate any significant credit risk.
b) The exchange rate risk and interest rate risk exposure derived from future foreign currency
fluctuations and interest rate changes are expected to be offset by the effects of such changes on hedged transactions. Hence, the market price risk is not expected to be material.
c) The Bank expects to engage in approximately NT$15,555 million (unaudited) and NT$19,129
million (unaudited) notional amount of derivative financial instrument contracts on behalf of customers for the years ended December 31, 2003 and 2004, respectively.
The Bank is engaged in interest rate swap contracts of assets. The Bank gives up the increase of bond price in the future to exchange a fixed interest rate for a floating rate. The Bank’s expected future net cash flows were US$5.0 million in 2003, US$13million and NT$25 million in 2004 and US$93 million in 2007.
The Bank forecasted its working capital is adequate to meet its operation needs. On that account, there is no significant need for cash. In addition, the exchange rate was fixed for the foreign exchange swap contracts and the Bank does not anticipate any significant cash flow risk.
d) For the years ended December 31, 2002 and 2001, the Bank had interest income for hedging
purpose derivative transactions amounted to NT$133.7 million and NT$94.6 million, respectively, and interest expense amounted to NT$39.0 million and NT$74.1 million, respectively.
e) The amounts of assets and liabilities recorded by the Bank related to derivative financial
instruments entered for hedging purpose derivative transactions as of December 31, 2002 and 2001 were as follows:
(NT$‘000)
2002 2001 Category Book value Book value NT$ NT$ Currency bought:
Forward proceeds receivable-foreign currencies 2,046,086 21,028 Forward exchange settlement payable 1,466,309 -
Currency sold: Forward exchange settlement payable-foreign currencies 2,234,462 173,329 Forward proceeds receivable 1,685,280 -
78
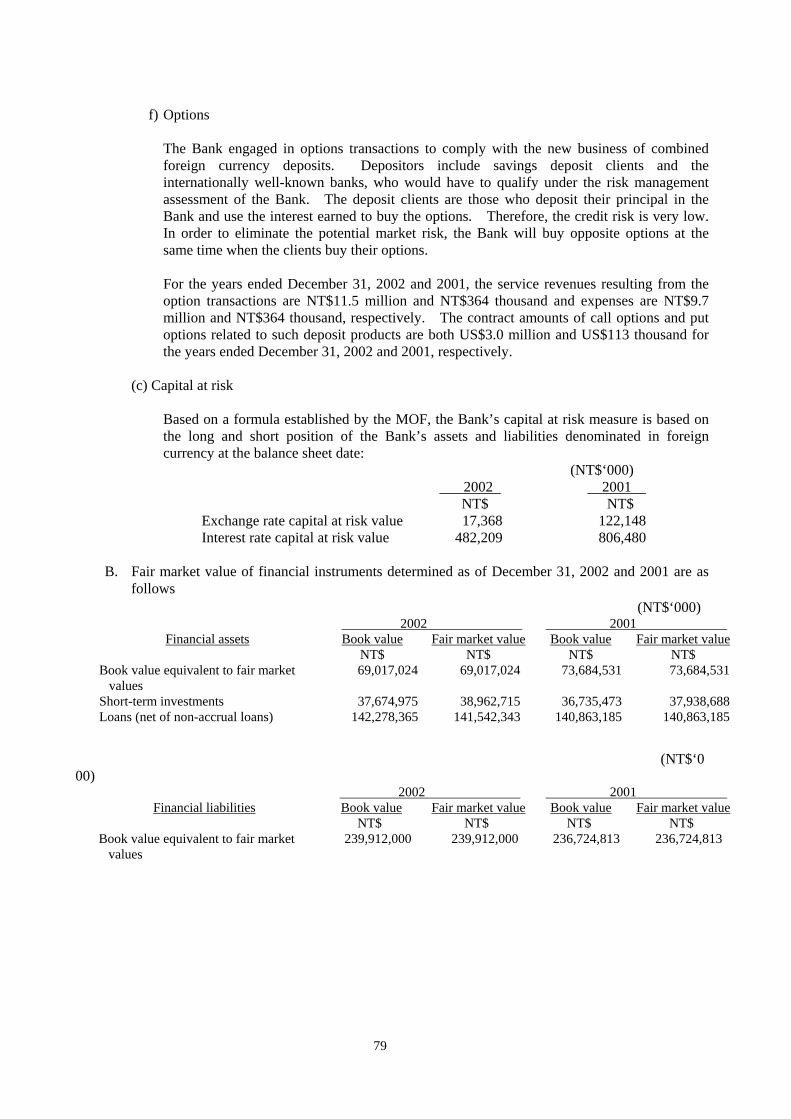
f) Options The Bank engaged in options transactions to comply with the new business of combined foreign currency deposits. Depositors include savings deposit clients and the internationally well-known banks, who would have to qualify under the risk management assessment of the Bank. The deposit clients are those who deposit their principal in the Bank and use the interest earned to buy the options. Therefore, the credit risk is very low. In order to eliminate the potential market risk, the Bank will buy opposite options at the same time when the clients buy their options. For the years ended December 31, 2002 and 2001, the service revenues resulting from the option transactions are NT$11.5 million and NT$364 thousand and expenses are NT$9.7 million and NT$364 thousand, respectively. The contract amounts of call options and put options related to such deposit products are both US$3.0 million and US$113 thousand for the years ended December 31, 2002 and 2001, respectively.
(c) Capital at risk Based on a formula established by the MOF, the Bank’s capital at risk measure is based on the long and short position of the Bank’s assets and liabilities denominated in foreign currency at the balance sheet date:
(NT$‘000) 2002 2001
NT$ NT$ Exchange rate capital at risk value 17,368 122,148 Interest rate capital at risk value 482,209 806,480
B. Fair market value of financial instruments determined as of December 31, 2002 and 2001 are as
follows: (NT$‘000)
2002 2001 Financial assets Book value Fair market value Book value Fair market value
NT$ NT$ NT$ NT$ Book value equivalent to fair market
values Short-term investments 37,938,688
69,017,024 69,017,024 73,684,531 73,684,531
37,674,975 38,962,715 36,735,473 Loans (net of non-accrual loans) 142,278,365 141,542,343 140,863,185 140,863,185
(NT$‘000)
2002 2001 Financial liabilities Book value Fair market value Book value Fair market value
NT$ NT$ NT$ NT$ Book value equivalent to fair market
values 239,912,000 239,912,000 236,724,813 236,724,813
79

Short-term investments
Loans
Long-term debt investments:
The market rates of long-term debt investments could not be obtained. As a result, the Bank has estimated their fair value based on the issuers credit strength, and the overall terms and conditions of the debt.
A significant portion of Fubon Bank’s deposit liabilities is made with floating interest rates and the maturities for most deposit liabilities were less than one year. As a result, management believes the book value is a reasonable estimate of fair value.
It is the policy of the Bank to disclose fair value information on those financial assets or liabilities for which published market information is readily available, and where the fair value is materially different from recorded amounts. Sufficient market experience does not exist for purchases and sales of loans and other financial assets or liabilities for which published market information is not readily available. Accordingly, fair values cannot be reliably determined in all circumstances. In the opinion of management, the reported recoverable amounts of financial assets and liabilities not required to be reported at fair value in the accompanying balance sheet are generally the most valid and useful reporting values under the circumstances. The methods and assumptions for estimating fair values are as follows:
The fair market value was based on either the end-of-month average quoted closing price of the reported accounting period or the latest settlement price at the end of the fiscal year. The fair market value of open-ended mutual funds was measured by the net asset value of the mutual funds on the balance sheet date. If a quoted market price was not available, a reasonable estimate of fair market value was based on financing or other data.
Receivables Due to the short-term nature of accounts receivable, after accounting of provisions for uncollectable amounts, the net book value is considered a reasonable estimate of fair value.
The fair market values of loans were estimated based on certain characteristics of banking industry. On that account, the book value was a reasonable estimate of fair market value, taking into account of the current credit-worthiness of the borrowers. The fair market values of fixed-rate loans with medium to long-term maturity were estimated by discounting the future cash flows using the current rates.
Deposits
80

C. The following information is disclosed for the Bank as of and for the years ended December 31, 2002 and 2001 in accordance with the SFAS No. 28.
(a) The movements in the allowance for loan and receivable losses were disclosed in Note 6.
(b) The maturity analysis of material assets and liabilities as of December 31, 2002 and 2001 were as follows:
(NT$‘000)
2002
Within
3 month 3~6 month 6~12 month Over 12 month Total Assets: NT$ NT$ NT$
8,282,457 - 20,918,106 - 21,465,309
Short-term investments 604,219 435,041Loans (net of non-accrual loans ) 6,144,051
NT$ NT$ Due from Central Bank of China - 2,190,000 10,472,457
Due from banks 547,203 - 15,547,380 21,088,335 37,674,975
18,236,625 5,573,905 113,949,669 143,904,250 Long-term debt
investments 320,305 69,560 - 580,056 969,921 55,022,416 15,647,490 8,198,946 135,618,060 214,486,912 Liabilities:
Due to banks 316,048 1,565,988
1,149,940 100,000 - Deposits 67,567,436 73,304,846 67,695,622 10,273,284 218,841,188
68,717,376 73,620,894 10,273,284 220,407,176
67,795,622
(NT$‘
000) 2001
Within
3 month 3~6 month 6~12 month Over 12 month Total Assets: NT$ NT$ NT$ NT$ NT$
Due from Central Bank of China 945,000 11,404,277 245,000
Due from banks - - 12,594,277
32,442,693 389,143 10,000 32,841,836Short-term investments 3,783,626 666,901 32,136,517 36,735,473Loans (net of non-accrual loans ) 20,403,428 6,165,504 14,116,678 100,893,439 141,579,049
Long-term debt investments - - - 1,297,755 1,297,755
57,574,747 18,107,353 15,038,579 134,327,711 225,048,390 Liabilities:
Due to banks 521,788 200,000 100,000 - 821,788Deposits 70,786,209 75,832,881 74,175,732 6,686,418 227,481,240
71,307,997 76,032,881 74,275,732 6,686,418 228,303,028
148,429
81

(c) As of December 31, 2002 and 2001, the interest bearing assets, interest bearing liabilities and the average interest rates were as follows:
(NT$‘0
00) 2002 2001
Average amount
Average interest Rate%(Annual rate)
Average amount
Average interest Rate%(Annual rate)
Assets: NT$ NT$
Due from Central Bank of China (Note)
17,975,771 2.47 13,327,242 1.32
Due from banks 622,515 1.02 417,238 2.25 Call loans to banks 20,324,004 2.10 35,076,891 4.10 Short-term investments 41,248,379 8.34 35,473,140 10.80
Loans 121,859,356 5.13 136,620,598 6.69
(NT$‘0
00) 2002 2001
Average amount
Average interest Rate%(Annual rate)
Average amount
Average interest Rate%(Annual rate)
NT$ NT$ Liabilities:
Due to banks 313,646 3.03 318,550 4.16 Call loans from banks 2,300,393 1.82 781,110 3.17 Demand deposits 79,312,586 1.25 56,289,981 2.92 Staff demand saving deposits 881,541 6.43 829,046
10.39 Time deposits 59,826,345 2.60 79,106,676 4.43 Foreign currency time deposits
15,011,009 1.89 15,787,888 4.46
Time saving deposits 61,709,412 3.15 65,261,788 4.88
Note: Including certificates of deposits issued by Central Bank of China, recorded as cash and restricted
assets.
(d) Risk-Based Capital Ratio
The Bank’s risk-based capital ratio were as follows at December 31, 2002 and 2001:
2002 2001 13.89% (Note a) 11.47% (Note b)
Note a: The ratio was based on the audited financial statements as of December 31, 2002. Note b: The ratio was based on its unaudited financial statements as of December 31, 2001.
(e) The Bank has not written-off loans without taking appropriate legal action.
82

20. ADDITIONAL DISCLOSURE ITEMS
(1) Information related to significant transactions
1) Loans to others:
See disclosure regarding loans granted by the Bank in Note 6.
2) Financial guarantees for others:
See disclosure regarding financial guarantees for other granted by the Bank in Note 18. 3) Securities held as of December 31, 2002 (number of shares and amounts are in thousands) are
as follows:
Security The end of year 2002 NoteHolding company Category Name
Relationship with the issuer
Recording entry Shares Cost % Fair market
value
The Bank Stock Fubon Construction Management Co., Ltd.
Invested company measured by equity method
Long-term investments
4,273 46,204 30.00 42,003 -
〃 〃 Fubon Bills Finance Co., Ltd.
〃 〃 453,373 5,893,401 100.00 5,920,192 -
〃 〃 Fubon Leasing Co., Ltd. 〃 838,094 〃 99,990 99.99 731,188 - 〃 〃 Fubon Future Co., Ltd. 〃 〃 19,500 217,877 30.00 217,580 - 〃 〃 Fu-Yin Insurance Agent
Co., Ltd. 〃 〃 190 33,478 95.00 33,478 -
〃 〃 Fubon Insurance Agent Co., Ltd.
〃 〃 198 2,153 99.00 2,153 -
〃 〃 Taipei Forex Inc. - 〃 80 800 0.40 1,163 Note 1
〃 〃 Fubon Securities Finance Co., Ltd.
An affiliate 〃 35,715 337,011 5.67 426,431 Note 1
〃 〃 Pacific Tele Communication Taiwan Co., Ltd.
- 〃 2,449 24,486 1.77 21,425 Note 1
〃 〃 Taiwan Aerospace Corp. - 〃 6,553 65,528 1.25 54,192 Note 1
〃 〃 Fubon Venture Capital Co., Ltd.
An affiliate 〃 2,500 25,000 5.00 23,050 Note 1
〃 〃 Apex Venture Capital Co., Ltd.
- 〃 5,000 50,000 4.67 47,900 Note 1
〃 〃 Taiwan International Mercantile Exchange Corporation
- 〃 900 9,000 0.45 10,485 Note 1
〃 〃 Tai Mall Development Company
- 〃 4,160 49,920 1.24 35,069 Note 1
〃 〃 Taiwan High Speed Rail Co., Ltd.
- 〃 50,694 500,000 1.01 489,704 Note 1
〃 〃 Pacific Venture Capital Co., Ltd.
- 〃 4,000 41,500 3.33 41,440 Note 1
〃 〃 Financial Information Service Co., Ltd.
- 〃 4,550 45,500 1.14 64,337 Note 1
〃 〃 Primus Technology Fund - 〃 2,000 24,000 3.77 17,540 Note 1
〃 〃 Hsin Yu Cogeneration Co., Ltd.
- 〃 814 10,005 0.33 6,235 Note 1
83
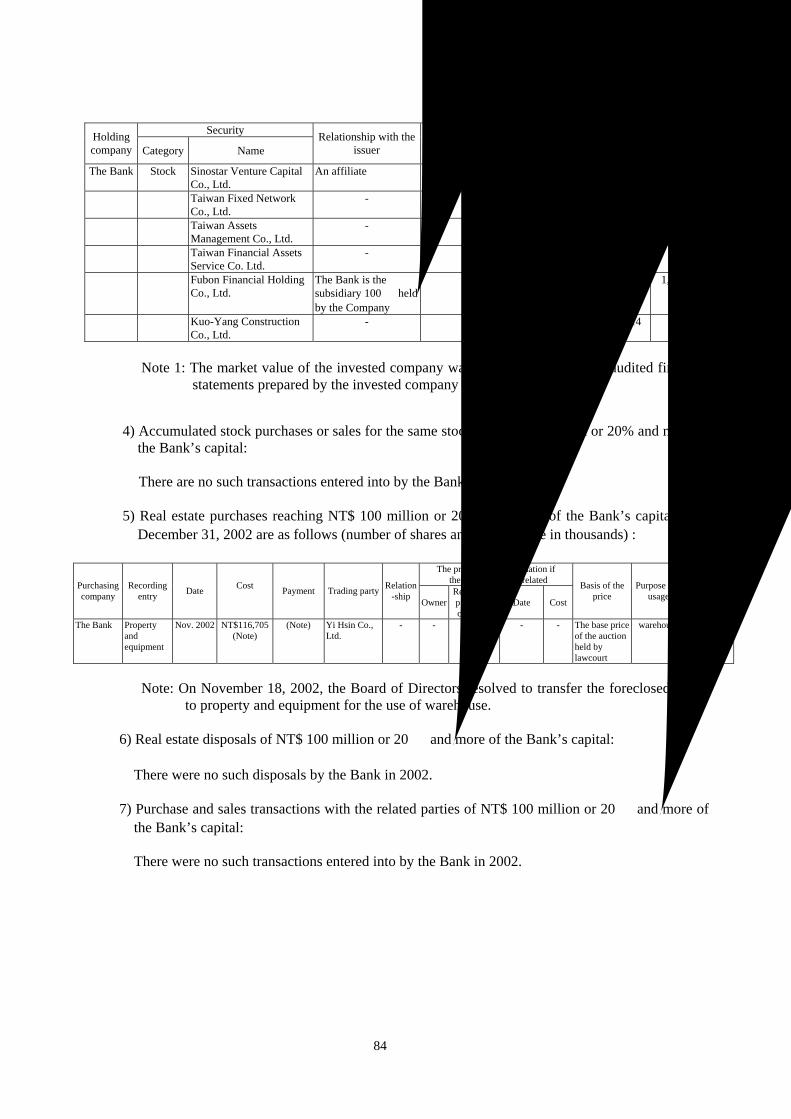
Security The end of year 2002 NoteHolding
company Category Name Relationship with the
issuer Recording
entry Shares Cost % Fair market value
The Bank Stock Sinostar Venture Capital Co., Ltd.
An affiliate Long-term investments
2,000 20,000 4.17 19,180 Note 1
〃 〃 Taiwan Fixed Network Co., Ltd.
- 〃 20,000 200,000 0.22 205,600 Note 1
〃 〃 Taiwan Assets Management Co., Ltd.
- 〃 20,000 200,000 1.14 206,400 Note 1
〃 〃 Taiwan Financial Assets Service Co. Ltd.
- 〃 5,000 50,000 2.94 50,750 Note1
〃 〃 Fubon Financial Holding Co., Ltd.
The Bank is the subsidiary 100% held by the Company
〃 41,654 1,164,336 0.50 1,156,718 -
〃 〃 Kuo-Yang Construction Co., Ltd.
- 〃 422 21,717 0.14 1,404 -
Note 1: The market value of the invested company was calculated based on unaudited financial
statements prepared by the invested company itself.
4) Accumulated stock purchases or sales for the same stock of NT$100 million or 20% and more of
the Bank’s capital:
There are no such transactions entered into by the Bank in 2002.
5) Real estate purchases reaching NT$ 100 million or 20% and more of the Bank’s capital as of December 31, 2002 are as follows (number of shares and amounts are in thousands) :
The prior trading information if the trading party is related Purchasing
company Recording
entry Date Cost Payment Trading party Relation
-shipOwner
Relationship with the company
Date Cost
Basis of the price
Purpose and usage
Other rights or/and
obligation
The Bank Property and equipment
Nov. 2002
NT$116,705 (Note)
(Note) Yi Hsin Co., Ltd.
- - - - - The base price of the auction held by lawcourt
warehouse None
Note: On November 18, 2002, the Board of Directors resolved to transfer the foreclosed assets
to property and equipment for the use of warehouse. 6) Real estate disposals of NT$ 100 million or 20% and more of the Bank’s capital:
There were no such disposals by the Bank in 2002.
7) Purchase and sales transactions with the related parties of NT$ 100 million or 20% and more of the Bank’s capital:
There were no such transactions entered into by the Bank in 2002.
84

8) Receivables from the related parties of NT$ 100 million or 20% and more of the Bank’s capital:
There were no such balances due the Bank at December 31, 2002.
9) Financial derivatives:
See information related to the Bank’s financial derivative transactions for 2002 in Note 19.
(2) Information on the Bank’s invested companies
The Bank has the ability to exercise significant influences or control directly or indirectly over the following entities at December 31, 2002 (number of shares and amounts are in thousands):
Original invested amount December 31, 2002 Investor Investee Investee’s
address Operating
item End of year 2002
End of year 2001
Shares Percentage (%)
Book value Investee’s year 2002
income
Investee’s year 2002 gain/loss
recognition
Note
The Bank Fubon Bills Finance Co., Ltd.
6F,169, Jen Ai Road, Sec.4, Taipei, Taiwan
Bond and stock underwriter, guarantee, and endorsement
3,910,329 3,900,291 453,373 100.00 5,893,401 914,775 924,719 Subsidiary of the Bank
The Bank Fubon Leasing Co., Ltd.
3F,169, Jen Ai Road, Sec.4, Taipei, Taiwan
Sales, maintenance and leases of machine and equipment
999,900 999,900 99,990 99.99 838,094 1,203 1,203 Subsidiary of the Bank
The Bank Fubon Construction Management Co., Ltd.
21F,169, Jen Ai Road, Sec.4, Taipei, Taiwan
m
Investigation, consultation,
anagement and real estate evaluation of construction plans
30,000 30,000 4,273 30.00 46,204 3,957 1,187 -
The Bank Fubon Future Co., Ltd.
2F, 9, Xiang Yang Road, Taipei, Taiwan
Future underwriter
196,170 196,170 19,500 30.00 217,877 43,684 13,529 -
The Bank Fu-Yin Insurance Agent Co., Ltd.
6F,169, Jen Ai Road, Sec.4, Taipei, Taiwan
Life insurance agent
1,900 1,900 190 95.00 33,478 31,461 29,888 Subsidiary of the Bank
The Bank Fubon Insurance Agent Co., Ltd.
3F,169, Jen Ai Road, Sec.4, Taipei, Taiwan
Property insurance agent
1,980 1,980 198 99.00 2,153 76 76 Subsidiary of the Bank
At December 31, 2002 the shares owned in other entities by these Bank investors were as follows:
A. Fubon Leasing Co., Ltd.
(A) Loans to others:
At December 31, 2002 there were no such loans. (B) Financial guarantees for others:
At December 31, 2002 there were no such guarantees.
85
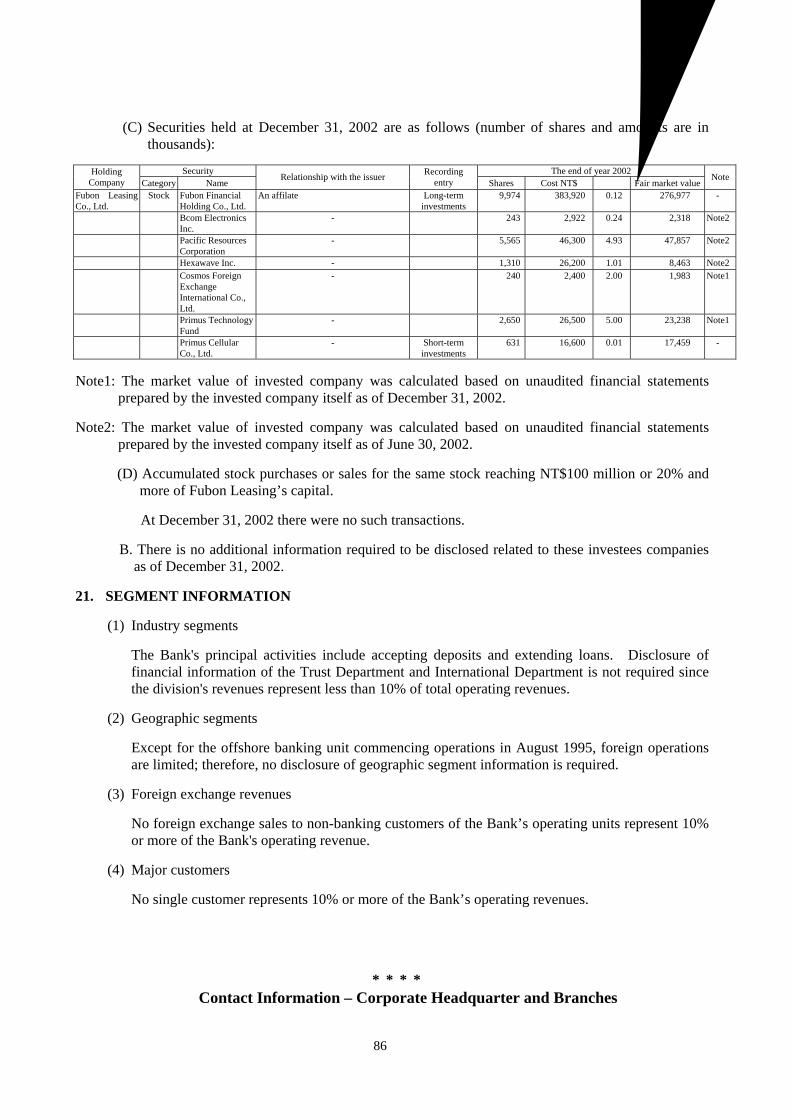
(C) Securities held at December 31, 2002 are as follows (number of shares and amounts are in
thousands):
Security The end of year 2002 Holding Company Category Name
Relationship with the issuer Recording entry Shares Cost NT$ % Fair market value
Note
Fubon Leasing Co., Ltd.
Stock Fubon Financial Holding Co., Ltd.
An affilate Long-term investments
9,974 383,920 0.12 276,977 -
〃 〃 Bcom Electronics Inc.
- 〃 243 2,922 0.24 2,318 Note2
〃 〃 Pacific Resources Corporation
- 〃 5,565 46,300 4.93 47,857 Note2
〃 〃 Hexawave Inc. - 〃 1,310 26,200 1.01 8,463 Note2〃 〃 Cosmos Foreign
Exchange International Co., Ltd.
- 〃 240 2,400 2.00 1,983 Note1
〃 〃 Primus Technology Fund
- 〃 2,650 26,500 5.00 23,238 Note1
〃 〃 Primus Cellular Co., Ltd.
- Short-term investments
631 16,600 0.01 17,459 -
Note1: The market value of invested company was calculated based on unaudited financial statements
prepared by the invested company itself as of December 31, 2002. Note2: The market value of invested company was calculated based on unaudited financial statements
prepared by the invested company itself as of June 30, 2002.
(D) Accumulated stock purchases or sales for the same stock reaching NT$100 million or 20% and more of Fubon Leasing’s capital.
At December 31, 2002 there were no such transactions.
B. There is no additional information required to be disclosed related to these investees companies
as of December 31, 2002.
21. SEGMENT INFORMATION
(1) Industry segments
The Bank's principal activities include accepting deposits and extending loans. Disclosure of financial information of the Trust Department and International Department is not required since the division's revenues represent less than 10% of total operating revenues.
(2) Geographic segments
Except for the offshore banking unit commencing operations in August 1995, foreign operations are limited; therefore, no disclosure of geographic segment information is required.
(3) Foreign exchange revenues
No foreign exchange sales to non-banking customers of the Bank’s operating units represent 10% or more of the Bank's operating revenue.
(4) Major customers No single customer represents 10% or more of the Bank’s operating revenues.
* * * * Contact Information – Corporate Headquarter and Branches
86
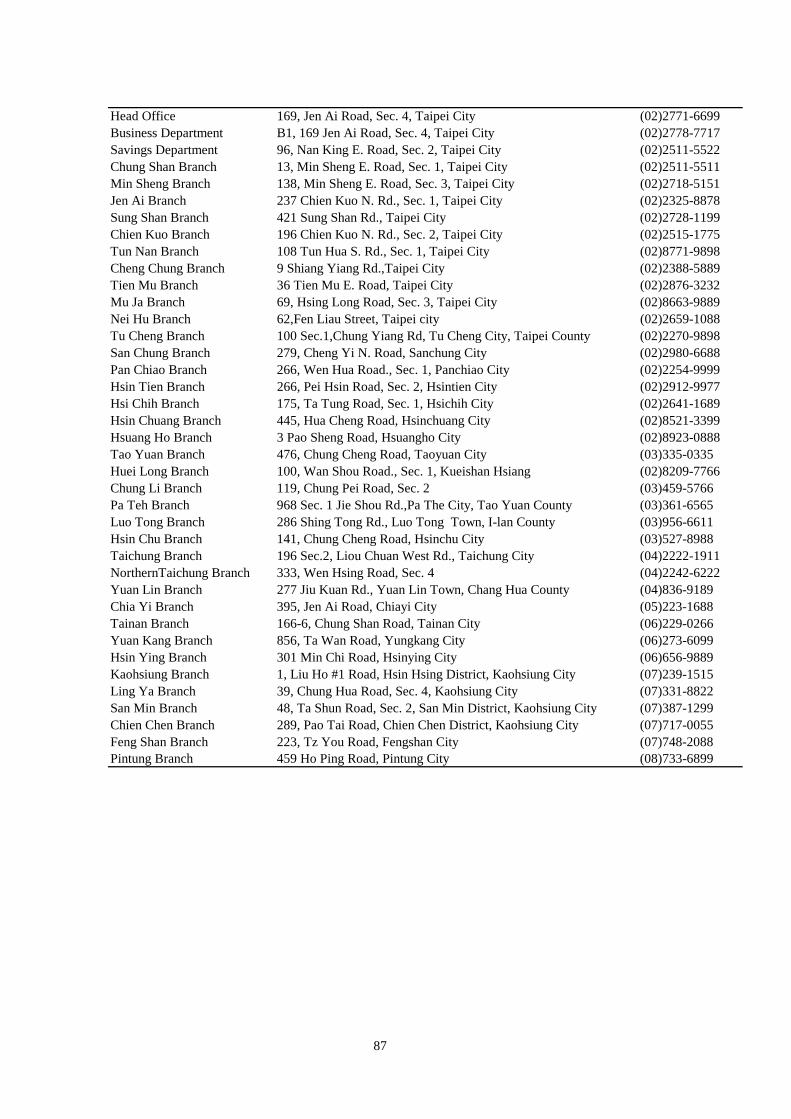
87
Head Office 169, Jen Ai Road, Sec. 4, Taipei City (02)2771-6699Business Department B1, 169 Jen Ai Road, Sec. 4, Taipei City (02)2778-7717Savings Department 96, Nan King E. Road, Sec. 2, Taipei City (02)2511-5522Chung Shan Branch 13, Min Sheng E. Road, Sec. 1, Taipei City (02)2511-5511Min Sheng Branch 138, Min Sheng E. Road, Sec. 3, Taipei City (02)2718-5151Jen Ai Branch 237 Chien Kuo N. Rd., Sec. 1, Taipei City (02)2325-8878Sung Shan Branch 421 Sung Shan Rd., Taipei City (02)2728-1199Chien Kuo Branch 196 Chien Kuo N. Rd., Sec. 2, Taipei City (02)2515-1775Tun Nan Branch 108 Tun Hua S. Rd., Sec. 1, Taipei City (02)8771-9898Cheng Chung Branch 9 Shiang Yiang Rd.,Taipei City (02)2388-5889Tien Mu Branch 36 Tien Mu E. Road, Taipei City (02)2876-3232Mu Ja Branch 69, Hsing Long Road, Sec. 3, Taipei City (02)8663-9889Nei Hu Branch 62,Fen Liau Street, Taipei city (02)2659-1088Tu Cheng Branch 100 Sec.1,Chung Yiang Rd, Tu Cheng City, Taipei County (02)2270-9898San Chung Branch 279, Cheng Yi N. Road, Sanchung City (02)2980-6688Pan Chiao Branch 266, Wen Hua Road., Sec. 1, Panchiao City (02)2254-9999Hsin Tien Branch 266, Pei Hsin Road, Sec. 2, Hsintien City (02)2912-9977Hsi Chih Branch 175, Ta Tung Road, Sec. 1, Hsichih City (02)2641-1689Hsin Chuang Branch 445, Hua Cheng Road, Hsinchuang City (02)8521-3399Hsuang Ho Branch 3 Pao Sheng Road, Hsuangho City (02)8923-0888Tao Yuan Branch 476, Chung Cheng Road, Taoyuan City (03)335-0335Huei Long Branch 100, Wan Shou Road., Sec. 1, Kueishan Hsiang (02)8209-7766Chung Li Branch 119, Chung Pei Road, Sec. 2 (03)459-5766Pa Teh Branch 968 Sec. 1 Jie Shou Rd.,Pa The City, Tao Yuan County (03)361-6565Luo Tong Branch 286 Shing Tong Rd., Luo Tong Town, I-lan County (03)956-6611Hsin Chu Branch 141, Chung Cheng Road, Hsinchu City (03)527-8988Taichung Branch 196 Sec.2, Liou Chuan West Rd., Taichung City (04)2222-1911NorthernTaichung Branch 333, Wen Hsing Road, Sec. 4 (04)2242-6222Yuan Lin Branch 277 Jiu Kuan Rd., Yuan Lin Town, Chang Hua County (04)836-9189Chia Yi Branch 395, Jen Ai Road, Chiayi City (05)223-1688Tainan Branch 166-6, Chung Shan Road, Tainan City (06)229-0266Yuan Kang Branch 856, Ta Wan Road, Yungkang City (06)273-6099Hsin Ying Branch 301 Min Chi Road, Hsinying City (06)656-9889Kaohsiung Branch 1, Liu Ho #1 Road, Hsin Hsing District, Kaohsiung City (07)239-1515Ling Ya Branch 39, Chung Hua Road, Sec. 4, Kaohsiung City (07)331-8822San Min Branch 48, Ta Shun Road, Sec. 2, San Min District, Kaohsiung City (07)387-1299Chien Chen Branch 289, Pao Tai Road, Chien Chen District, Kaohsiung City (07)717-0055Feng Shan Branch 223, Tz You Road, Fengshan City (07)748-2088Pintung Branch 459 Ho Ping Road, Pintung City (08)733-6899