restructuring on retrospect - energy
TRANSCRIPT
National Conference of State Legislatures
i
Restructuring inRetrospect
ByMatthew H. Brown
William T. Pound, Executive Director
1560 Broadway, Suite 700Denver, Colorado 80202
(303) 830-2200
444 North Capitol Street, N.W.Washington, D.C. 20001
(202) 624-5400
October 2001
National Conference of State Legislatures
ii Restructuring in Retrospect
The National Conference of State Legislatures serves the legislatorsand staffs of the nation’s 50 states, its commonwealths, andterritories. NCSL is a bipartisan organization with three objectives:
• To improve the quality and effectiveness of state legislatures,• To foster interstate communication and cooperation,• To ensure states a strong cohesive voice in the federal system.
The Conference operates from offices in Denver, Colorado, andWashington, D.C.
Printed on recycled paper
©2001 by the National Conference of State Legislatures.All rights reserved.
ISBN 1-58024-259-X

National Conference of State Legislatures
iii
List of Figures and Tables ............................................................................ iv
Acknowledgments ........................................................................................ v
About the Author ........................................................................................ vi
Executive Summary .................................................................................... vii
Introduction ............................................................................................... 1
Why Restructuring? ...................................................................................... 3Retail Rates Were High Due to Several Factors .................................... 4Why Did Restructuring Appear Attractive? ........................................ 7Did Advocates of Restructuring Get What They Wanted? ..............10
The Early Experience .................................................................................14What Savings Did Restructuring Laws Deliver? ...............................14Restructuring Laws Delivered Immediate Savings Through Legislative Fiat, Not Through Competition ...................17Some Customers Received Some Savings in Some Markets for a While ...............................................................21
The Road Ahead ........................................................................................28Factors to Consider ............................................................................28Lessons from California .....................................................................30What Can State Legislators Control? ................................................32Conclusions ........................................................................................37
CONTENTS
iii

National Conference of State Legislatures
iv Restructuring in Retrospect
AppendicesA. Rate Caps, Freezes and Reductions Established in State Electric Industry Restructuring Legislation ........................................................39
B. Suggested Questions for Legislatures to Consider Regarding Electric Industry Restructuring ............................45
Notes ..........................................................................................................49
Figures and Tables
Figures1. Residential Average Rates—1997 kilowatt-hours ...................... 42. Nonutility Capacity by State as a Result of
Each State’s Total Capacity ....................................................... 63. New York Reserve Margins from the Late 1980s
to the Early 1990s .................................................................... 74. Natural Gas Prices Through March 2000 ................................. 85. Mid-Columbia Heavy Load Hour Firm Prices .......................... 96. Six Reasons for Restructuring ....................................................107. Sample Electric Bill ....................................................................128. Natural Gas Prices: January 1998 to January 2000 ...............139. Savings for Residential Customers ............................................1710. Legislated Rate Reductions by State .........................................1811. PECO and Competitors’ Rates .................................................2312. PECO and Competitors’ Rates Through Spring 2001 ...........2713. PX Day-Ahead Electricity Prices ...............................................35
Tables1. PECO Customers Switching as of October 2000 ...................232. California Customers Switching as of October 2000 ..............243. Massachusetts Customers Switching as of August 2001 .........244. Industrial Customers Switching as of Fall 2000 ......................265. Percent of PECO Customers Switching as of July 2001 .........276. Elements of Electricity Markets ................................................33
iv
National Conference of State Legislatures
v
ACKNOWLEDGMENTS
v
This report was prepared with the financial support through agrant from the U.S. Department of Energy and Oak RidgeNational Laboratory. The author is grateful for the assistance ofnumerous people who assisted in providing information for thisreport and in its review. This document was developed at therequest of the National Conference of State Legislatures’ (NCSL)Advisory Council on Energy, which is the advisory council forNCSL’s state energy activities and is composed of legislators,legislative staff and other governmental, for-profit and not-for-profit entities with an interest in energy issues.
The author relied on crucial advice and support from JoelEisenberg, Oak Ridge National Laboratory, as well as criticalresearch support from Christie Rewey of NCSL.
In addition, several others provided comments, including KevinMcCarthy, Connecticut legislative staff; Mike Oldak, EdisonElectric Institute; Delegate Carol Petzold, Maryland House ofDelegates; Samantha Slater, Electric Power Supply Association;and Richard Sedano, Regulatory Assistance Project. Leann Stelzerof NCSL edited the report and helped to make a complicatedsubject a bit easier to understand. Finally, Scott Liddell of NCSLformatted the document for publication.

National Conference of State Legislatures
vi Restructuring in Retrospect
ABOUT THE AUTHOR
vi
Matthew Brown is the director of the NCSL Energy Project.He has worked for more than a dozen years on state energy policyissues, ranging from electricity issues to energy and transporta-tion issues. He has testified before legislatures in more than 30states, largely on electric industry regulatory issues, and has writ-ten numerous publications on the topic. He holds a bachelor’sdegree from Brown University and an MBA from New YorkUniversity.

National Conference of State Legislatures
vii
EXECUTIVE SUMMARY
vii
When California first proposed to open its retail electricity mar-ket to competition and to replace its state-regulated system, re-tail electricity rates were high, utilities were faced with an over-capacity of power generation, natural gas prices were low andtechnology seemed to be forcing electricity prices inexorablydownward. Twenty-five states eventually passed legislation toopen their power markets to competition, and approximatelyhalf of those had actually opened their markets by early 2001.Although it is still early in many states’ transition toward retailcompetition, it is nonetheless helpful to look back at the origi-nal motives for restructuring, and to investigate—in retrospect—some of the initial successes or problems with restructuring ofretail power markets.
The year 2000 was a watershed year, however. Natural gas pricesskyrocketed for a while and it became clear that, because fewpower plants had been built for close to a decade, the surplus ofelectricity generation capacity was almost nonexistent. Electric-ity prices jumped throughout the western United States, as wellas in a great deal of the eastern half of the country. Almost daily,headlines described an ongoing electricity crisis in Californiathat was expected to last well into 2001. California’s crisis andthe problems in other parts of the country prompted a reexami-nation of the success and potential for retail customers—espe-cially the smallest customers—to benefit quickly from competi-tive markets.
National Conference of State Legislatures
viii Restructuring in Retrospect
Residential customers and other small electricity users can ex-pect some savings from restructuring, as some limited experi-ence demonstrates. However, the savings are likely to be small.Further, marketers are likely to have difficulty realizing a profitfrom serving the smaller customers. The cost to acquire a newcustomer ranges from $40 up to $200 or $300. With the lowmargins and low usage that characterize residential and smallcommercial customer markets, it takes time for marketers to earna return on their initial investment in securing the new cus-tomer. All these factors have meant that residential customermarkets have been slow to develop.
Industrial customers, on the other hand, have switched provid-ers much more quickly than have the smaller electricity users.Data suggest that the largest industrial customers—those withgreatest electricity usage—have the most to gain from choosinga new provider, that the marketers who serve them have the mostto gain from doing so, and that these markets generally havebeen much more active than have markets for the smallest elec-tricity users. In some cases, even those markets have proveddifficult because wholesale electricity suppliers have been un-able to offer power at the stable rates that would enable retailsellers to offer their own supplies at rates that beat those of theold regulated utility provider. It is clear, therefore, that whole-sale markets for electricity must work well before retail mar-kets—even for the largest customers—will be active.
State governments and the federal government fulfill differentroles in the effort to make the retail and wholesale markets work.It is important, however, that state policymakers understand whatpart of the electric industry they can control directly, what thefederal government controls and what state governments can in-fluence, but not control.
National Conference of State Legislatures
ix
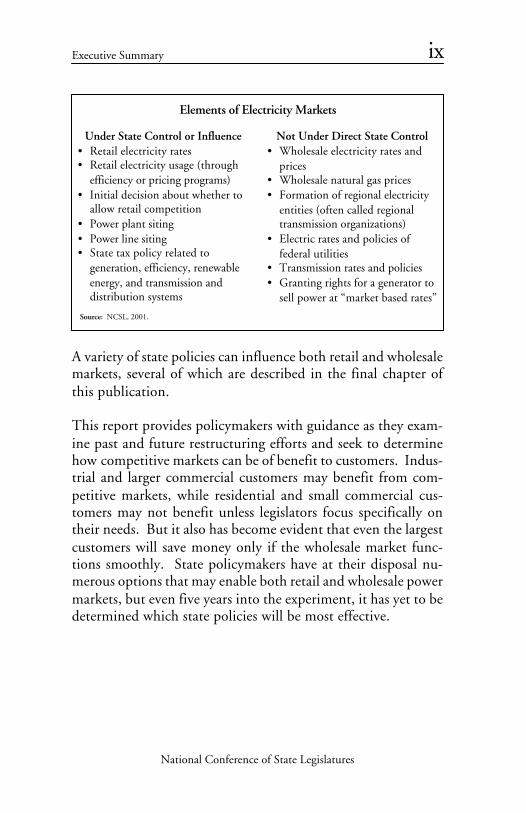
Not Under Direct State Control• Wholesale electricity rates and
prices• Wholesale natural gas prices• Formation of regional electricity
entities (often called regionaltransmission organizations)
• Electric rates and policies offederal utilities
• Transmission rates and policies• Granting rights for a generator to
sell power at “market based rates”
Under State Control or Influence• Retail electricity rates• Retail electricity usage (through
efficiency or pricing programs)• Initial decision about whether to
allow retail competition• Power plant siting• Power line siting• State tax policy related to
generation, efficiency, renewableenergy, and transmission anddistribution systems
Elements of Electricity Markets
Source: NCSL, 2001.
A variety of state policies can influence both retail and wholesalemarkets, several of which are described in the final chapter ofthis publication.
This report provides policymakers with guidance as they exam-ine past and future restructuring efforts and seek to determinehow competitive markets can be of benefit to customers. Indus-trial and larger commercial customers may benefit from com-petitive markets, while residential and small commercial cus-tomers may not benefit unless legislators focus specifically ontheir needs. But it also has become evident that even the largestcustomers will save money only if the wholesale market func-tions smoothly. State policymakers have at their disposal nu-merous options that may enable both retail and wholesale powermarkets, but even five years into the experiment, it has yet to bedetermined which state policies will be most effective.
Executive Summary

National Conference of State Legislatures
x Restructuring in Retrospect
National Conference of State Legislatures
1
INTRODUCTION
1
It is unusual to hear anyone in the United States say that com-petition and free markets are bad or unproductive. Indeed, theU.S. economy is based on the idea that competition can delivera great variety of products, services and innovations at reason-able prices for many types of consumers. Therefore, it seemed tomake sense to many observers when the federal government andmany state legislators and regulators began the process of dis-mantling the regulations and monopoly structures that had longgoverned the trucking, airline, securities, cable and telephoneindustries. The idea was that deregulation would produce com-petition, and that competition would, in turn, bring a widevariety of new products and services to the consuming public.Furthermore, these new products and services would be avail-able at prices lower than were available under regulation. Re-duced regulation and increased competition have arguablybrought an array of new products and services to many consum-ers. However, in the electric industry, it is still too early todetermine the success of efforts to restructure the market.
This report reviews the history of the 1990s movement to re-structure the nation’s electric industry and pinpoints some ofthe pitfalls and the potential savings that could result from theeffort. It concludes the following.
1. The rationale for retail electricity restructuring rested on acombination of factors—including, in part, overcapacity and
National Conference of State Legislatures
2 Restructuring in Retrospect
steadily declining wholesale prices—that do not currentlyexist but that may recur in the next two to five years.
2. The initial attraction of restructuring was that it would pro-vide relief from high retail rates and allow customers to payprices closer to the inexpensive wholesale market rates. Forthe most part, that has not happened in any sustained way.
3. Under retail restructuring, customers have switched to newproviders slowly. Large commercial and industrial custom-ers switched at a much faster pace than residential custom-ers.
4. In some areas, restructuring appears to have resulted in lowerelectricity prices for some customers. Many legislated ratereductions that occurred as a result of negotiated restructur-ing laws most likely would have happened even if the mar-ket had remained regulated.
5. The potential for future savings relies on the proper struc-ture and functioning of wholesale markets. Such function-ing wholesale markets promote adequate generation and trans-mission system investments, greater efficiency and invest-ments in new technologies, and the resolution of marketpower issues.
This report first reviews the rationale for and history of the U.S.electricity industry restructuring effort, then discusses the earlyresults of these initiatives.
National Conference of State Legislatures
3Introduction
3
WHY RESTRUCTURING?
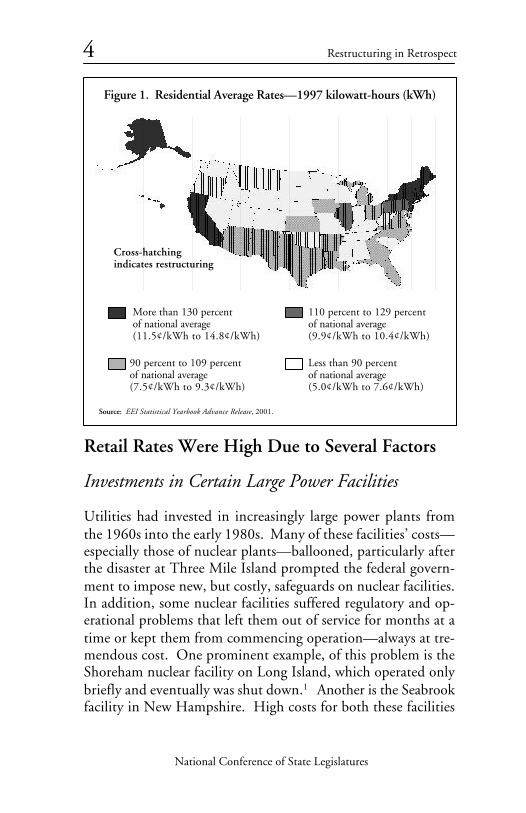
The electricity business was known by the early 1990s as thenation’s last highly regulated industry. The 1980s and 1990ssaw states and the federal government lift many regulations gov-erning the airline, trucking, telecommunications and other in-dustries. In states like California, Massachusetts, New Hamp-shire and New York, state policymakers began to ask whether itmade sense to deregulate the business of generating electricity.High electricity prices fueled much of the ensuing debate. Inthe early and mid-1990s, electricity prices in California and sev-eral other states were well above the national average, largely dueto investments made by utilities in those states. It is worthnoting that nearly all those investments were made with theapproval of the state utility commissions, and sometimes at thebehest of those regulators, legislatures or even the U.S. Con-gress. Although observers have tried to assign blame for highelectricity rates to either the commissions, the utilities them-selves, the legislatures or others, the truth is that the blame canbe spread among many. Figure 1 illustrates electric rates through-out the country in 1997, at the height of state interest in retailrestructuring.
National Conference of State Legislatures
4 Restructuring in Retrospect
Retail Rates Were High Due to Several Factors
Investments in Certain Large Power Facilities
Utilities had invested in increasingly large power plants fromthe 1960s into the early 1980s. Many of these facilities’ costs—especially those of nuclear plants—ballooned, particularly afterthe disaster at Three Mile Island prompted the federal govern-ment to impose new, but costly, safeguards on nuclear facilities.In addition, some nuclear facilities suffered regulatory and op-erational problems that left them out of service for months at atime or kept them from commencing operation—always at tre-mendous cost. One prominent example, of this problem is theShoreham nuclear facility on Long Island, which operated onlybriefly and eventually was shut down.1 Another is the Seabrookfacility in New Hampshire. High costs for both these facilities
Figure 1. Residential Average Rates—1997 kilowatt-hours (kWh)
More than 130 percentof national average(11.5¢/kWh to 14.8¢/kWh)
Source: EEI Statistical Yearbook Advance Release, 2001.
110 percent to 129 percentof national average(9.9¢/kWh to 10.4¢/kWh)
90 percent to 109 percentof national average(7.5¢/kWh to 9.3¢/kWh)
Less than 90 percentof national average(5.0¢/kWh to 7.6¢/kWh)
Cross-hatchingindicates restructuring

National Conference of State Legislatures
5Why Restructuring?
were largely responsible for higher than average electricity ratesof the Long Island Lighting Company (LILCO) and Public Ser-vice New Hampshire (PSNH).
Contracts that Utilities Signed with IndependentGenerators
The U.S. Congress passed the Public Utilities Regulatory Poli-cies Act of 1978 (PURPA) in an effort to diversify the nation’smix of fuels used to generate power. Because the marketplacerelied on independent generation companies to sell power andon utilities to buy that power, PURPA also encouraged a newbreed of power generator known alternatively as an independentpower producer (IPP), non-utility generator (NUG), qualifyingfacility (QF) or various other names. These companies signedlong-term contracts to supply power to utilities through con-tractually specified rates. Because IPPs generally relied on projectfinancing from banks, they required long-term power sales agree-ments to support their financing. Often, the prices were fixedfor the first 10 years or so of the contract, then were allowed tofloat with wholesale market prices. To further help these smallpower generators raise the money they needed to build theirplants, some contracts were front-loaded, meaning that the util-ity paid a particularly high price for power during the early yearsof the power sales agreement and later paid a lower price.
The pricing for these long-term contracts was based on the bestestimate at the time of future energy prices. Many of thesecontracts were signed during the 1980s—a time of rising energyprices—under the assumption that energy prices would con-tinue to rise. As a result, many utilities signed contracts withgenerators to supply them power for more than 10 cents perkilowatt-hour (kWh). Numerous states enacted similar stateversions of PURPA, sometimes known as mini-PURPA. In NewYork, a law once was in force that specified that all such con-tracts would be for at least 6 cents per kilowatt-hour. New Hamp-shire utilities signed contracts based on the utilities’ own high-

National Conference of State Legislatures
6 Restructuring in Retrospect
cost generation, which was as much as 12 cents per kilowatt-hour or more. Figure 2 shows the penetration of non-utilitygeneration. A comparison with figure 1 demonstrates the simi-larity between states with high levels of non-utility generationand states with high rates.
When wholesale electricity rates fell in the 1990s, these con-tracts appeared to be unwise investments. At the time they weresigned, however—and given the expectation at the time of highenergy prices—they appeared to be reasonable.
Contracts Utilities Signed with Other Utilities
In a few cases, utilities signed high-rate contracts for power sup-ply with other utilities. Vermont utilities, for example, signed acontract with Hydro Quebec, a large Canadian utility, to buyhydroelectric power over a 30-year period. Like the contractswith non-utility generators, the contract with Hydro Quebecwas set to reflect electricity prices that were expected to rise, andcost less than new generation options that were available at thetime. When wholesale prices in the rest of the country and New
Figure 2. Nonutility Capacity by State as a Result ofEach State’s Total Capacity
20 percent and more10 percent to 19.9 percent
5 percent to 9.9 percent
2 percent to 4.9 percent
Less than 2 percentU.S. Average = 8 percent
Source: NCSL, 2001.

National Conference of State Legislatures
7England began to fall in the late 1990s, Vermont’s long-termcontract with Hydro Quebec seemed overpriced.
Why Did Restructuring Appear Attractive?
By the early to mid-1990s, retail electricity rates had absorbed—and reflected—many of the high costs described in the previ-ous section. By then, however, the wholesale electricity worldhad begun to change. With the success of many energy effi-ciency programs and a slower economy, it became clear that therewas, in fact, more generationon-line in much of thecountry than appeared nec-essary. By the mid-1990s,reserve margins in some parts of the country reached 20 percentto as much as 25 percent and more, as figure 3 demonstrates forNew York. Many analysts suggest that margins of approximately15 percent are sufficient to maintain a reliable system. Thisoversupply put downward pressure on wholesale electricity prices,while retail prices stayed high.
Why Restructuring?
Figure 3. New York State Reserve Marginsfrom the Late 1980s to the Early 1990s
1991 1992 1993 1994 1995 1996 1997 1998 1999
10
20
30
40
Perc
ent
0
Year
Source: New York State Energy Research and Development Authority, 2001.
Reserve margins represent a safety marginof generating capacity above what theindustry would expect to need in an averageyear.
National Conference of State Legislatures
8 Restructuring in Retrospect
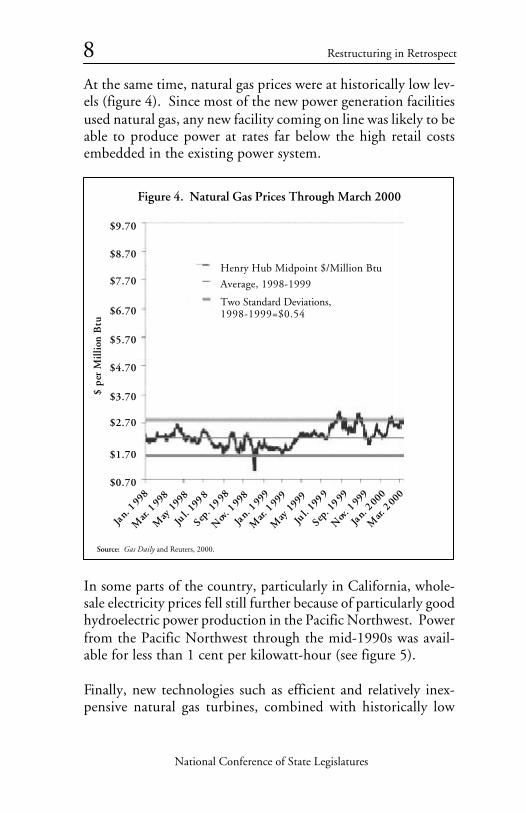
Figure 4. Natural Gas Prices Through March 2000
Henry Hub Midpoint $/Million Btu
Average, 1998-1999
Two Standard Deviations,1998-1999=$0.54
$0.70
$1.70
$4.70
$6.70
$3.70
$2.70
$7.70
$8.70
$9.70
$5.70
$ pe
r M
illio
n B
tu
Jan.
1 998
Mar.
199
8
May
1998
Jul. 1
998
Mar.
199
9
May
1999
Jan.
1 999
Nov.
199
8
Sep.
1998
Jul. 1
999
Sep.
1999
Nov.
199
9
Jan.
2 000
Mar.
200
0
Source: Gas Daily and Reuters, 2000.
At the same time, natural gas prices were at historically low lev-els (figure 4). Since most of the new power generation facilitiesused natural gas, any new facility coming on line was likely to beable to produce power at rates far below the high retail costsembedded in the existing power system.
In some parts of the country, particularly in California, whole-sale electricity prices fell still further because of particularly goodhydroelectric power production in the Pacific Northwest. Powerfrom the Pacific Northwest through the mid-1990s was avail-able for less than 1 cent per kilowatt-hour (see figure 5).
Finally, new technologies such as efficient and relatively inex-pensive natural gas turbines, combined with historically low

National Conference of State Legislatures
9Why Restructuring?
1996
1997
1998
1999
2000
Figu
re 5
. M
id-C
olum
bia
Hea
vy L
oad
Hou
r Fi
rm P
rice
s
Dollars per Megawatt-hour
1
10
10
0
1,0
00
10
,00
0
Jan.
lM
arch
lM
ay 1
July
1Se
pt. 1
Sour
ce:
Nor
thw
est P
ower
Pla
nnin
g C
ounc
il, 2
000.
Nov
. 1

National Conference of State Legislatures
10 Restructuring in Retrospect
natural gas prices, were becoming available. Any new generatorprobably would be able to produce power more cheaply thanthe average of the existing generation system, at least in the statesthat traditionally had experienced high electricity prices.
When large consumers looked at low wholesale electricity pricesand high retail prices, they began to seek ways to bypass thehigh retail rates and gain access to low-cost wholesale power. Insome cases large power users even went “off the system” to buildtheir own small power plants to serve their electrical needs.Restructuring the electric industry seemed to them to be a vi-able option (figure 6).
Did Advocates of Restructuring Get What TheyWanted?
Advocates of restructuring wanted access to less expensive whole-sale rates that reflected only marginal costs and to bypass retailrates that reflected the average of the utilities’ costs. Their desireto gain access to those wholesale rates was driven by the fact thatthe short-term—or spot—wholesale rates were a great deal lowerthan the average wholesale prices built into the retail rates.
When most states enacted restructuring laws, they took whathad been a “bundled” rate, and unbundled it. Customers previ-
Figure 6. Six Reasons for Restructuring
1. High retail prices and low wholesale prices.2. Oversupply of power on the market.3. New, inexpensive gas generating technologies.4. Low gas prices.5. Laws and regulations that required customers to pay retail rates (that
are an average of all the utilities’ costs, including older, more expensivepower plants) and forbade direct access to cheaper wholesale marketprices.
6. The threat that some large customers would leave the system to gener-ate power for their own use.

National Conference of State Legislatures
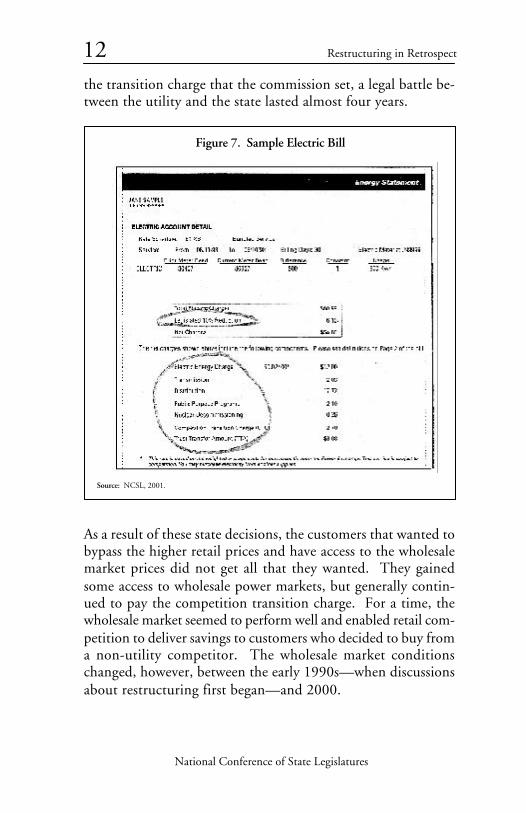
11ously saw only one charge on their electric bill that encompassedthe cost of energy, the cost of transmitting the energy, the cost ofdelivering the energy, and a number of other utility activitiessuch as energy efficiency, research and development, and renew-able energy. Now the unbundled bill separates each of thoseactivities into different cost components so customers can seethe charge for each function.
Another new component on many energy bills is a “competitivetransition charge.” This is a fee that every customer pays to helpthe utility recover the costs of its previous investments that itwill be unable to recover in a competitive market. The transi-tion charge represents the difference between the wholesaleprice—that so many large customers would have liked to pay—and the former retail rate. Recall that the retail rates generallyreflect an average of all the utilities’ costs, including their mostexpensive and their least expensive power plants. Wholesale ratesat the time often reflected only the marginal and least expensiveelements. Rather than remove the high-cost elements from ratesand give customers an immediate break from the high costs,state regulation and legislation simply added those elements intothe total rate under a new line item called the transition charge.
In a competitive market, a customer’s bill would have lookedlike figure 7, with unbundled charges—including a transitioncharge—shown separately.
States have several reasons for using a transition charge. Utili-ties—that would have had to bear the brunt of the financialliability had states not imposed these transition charges—ar-gued that regulators previously had approved all their major in-vestments. In some cases, the regulators had actively encour-aged the utilities to make many of the investments in powerfacilities. To not impose a transition charge and compensate theutilities for those investments would have been politically diffi-cult and certainly subject to legal challenge. In New Hamp-shire, for instance, where the utilities disagreed with the level of
Why Restructuring?
National Conference of State Legislatures
12 Restructuring in Retrospect
the transition charge that the commission set, a legal battle be-tween the utility and the state lasted almost four years.
As a result of these state decisions, the customers that wanted tobypass the higher retail prices and have access to the wholesalemarket prices did not get all that they wanted. They gainedsome access to wholesale power markets, but generally contin-ued to pay the competition transition charge. For a time, thewholesale market seemed to perform well and enabled retail com-petition to deliver savings to customers who decided to buy froma non-utility competitor. The wholesale market conditionschanged, however, between the early 1990s—when discussionsabout restructuring first began—and 2000.
Figure 7. Sample Electric Bill
Source: NCSL, 2001.

National Conference of State Legislatures
13Why Restructuring?
By early 2001, capacity margins in most of the country hadshrunk—in some places to dangerously low levels; in anticipa-tion of retail competition, utilities had stopped building whilethe nonregulated power generation business was in its infancy.The price of natural gas had risen to more than triple its prior-year levels, driven by global energy markets, increased domesticdemand and less than average storage of gas (figure 8). As aresult, wholesale market prices were rising and becoming in-creasingly volatile. All these factors contributed to the earlyexperiences with retail competition, described in the next chap-ter.
Figure 8. Natural Gas Prices: January 1998 to January 2000
Henry Hub Midpoint $/Million Btu
Average, 1998-1999
Two Standard Deviations,1998-1999=$0.54
$0.70
$1.70
$4.70
$6.70
$3.70
$2.70
$7.70
$8.70
$9.70
$5.70
$ pe
r M
illio
n B
tu
Jan.
199
8
Mar
ch 1
998
May
199
8
July
199
8
Mar
ch 1
999
May
199
9
Jan.
199
9
Nov
. 199
8
Sep.
199
8
July
199
9
Sep.
199
9
Nov
. 200
0
Nov
. 199
9
Jan.
200
0
Mar
ch 2
000
May
200
0
July
200
0
Sep.
200
0
Source: Gas Daily and Reuters, 2000.

National Conference of State Legislatures
14 Restructuring in Retrospect
THE EARLY EXPERIENCE
What Savings Did Restructuring Laws Deliver?
In most states, the transition to competition still is in its earlystages. A few trends are becoming clear, however.
• The economics of the electricity business did not encouragesmall electricity customers to switch to new providers.
• In many cases, restructuring laws delivered savings throughlegislative fiat, not through competition.
• For a while, at least, some customers have received somesavings that resulted from limited access to competitive mar-kets, and larger customers appear to have garnered more sav-ings than smaller customers. Because the industry remainsin transition, it is difficult to ascertain at this point howmuch savings competitive markets ultimately will deliver tocustomers.
The Economics of the Electricity Business
Even outside the electricity business, analysts refer to a 5 per-cent rule, in which 5 percent of the customers buy 95 percent ofan industry’s output of—for example, beer, airplane tickets, tele-communications services, and so forth. Although the 5 percentfigure may be neither precise nor accurate, the analogy holds in
14

National Conference of State Legislatures
15the electricity business; the largest customers buy much of theelectricity and account as a customer class for a disproportionateamount of the power companies’ revenues. Residential and smallcommercial customers do not account for significant utility prof-its.
This basic fact about the electricity business has had major im-plications for the progress of retail competition. Three facts haveemerged from states’ early attempts to bring competition to thebusiness.
1. In the electricity business, as in other similar businesses, thecost is high for securing each new customer.
2. Individual residential customers do not, as a rule, use a largeamount of electricity compared to larger industrial custom-ers; this means that individual residential customers may beless attractive prospects for power marketers than individualindustrial customers.
3. The savings for residential customers usually are small.
The Cost of Securing CustomersExact information that details how much it costs power market-ers to convince new customers to buy electricity from them gen-erally is proprietary to the power marketing companies. Suchinformation about how much it costs to secure a new customertoday, in an emerging market, also can be an unreliable predic-tor of how much it might cost in an established electricity mar-ket. That said, however, indications are that the cost of securingindividual residential customers is high.
Interviews with power marketers reveal that costs to secure eachcustomer range from $50 to $200 or more.
In the cellular telephone market—a somewhat analogous indus-try—the New York Times reports that the cost of marketing to
The Early Experience
National Conference of State Legislatures
16 Restructuring in Retrospect
cellular telephone customers is approximately $300 per customer.The New York Times also reports that cell phone companies nowplace a high priority on keeping the customers they have andnot losing them to competitors.
The costs to secure each customer would require power market-ers to earn enough profit on each kilowatt-hour they sell to makea reasonable return on their investments. Since most individualresidential customers do not use a great deal of electricity, how-ever, the returns on the investment in securing each customerare small.
The Return from Serving Individual Residential CustomersMarketers report to NCSL that a typical profit margin per kilo-watt-hour for most residential customers might be 1 cent. Inother words, a 150,000 kilowatt-hour per month user wouldyield a monthly profit of $1,500 per month (less with a lowerprofit margin). An 800 kilowatt-hour per month user wouldyield a profit of $8 per month. Most residential customers fallinto the lower range; many industrial customers will yield a muchhigher profit.
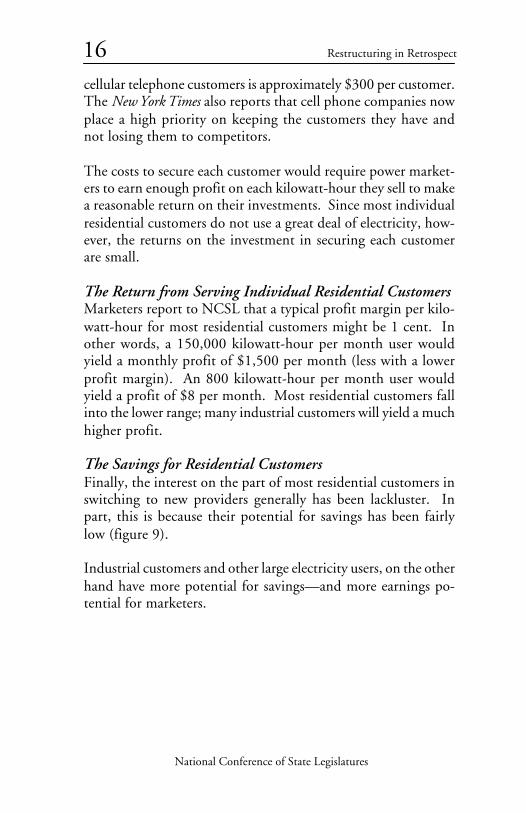
The Savings for Residential CustomersFinally, the interest on the part of most residential customers inswitching to new providers generally has been lackluster. Inpart, this is because their potential for savings has been fairlylow (figure 9).
Industrial customers and other large electricity users, on the otherhand have more potential for savings—and more earnings po-tential for marketers.

National Conference of State Legislatures
17
Restructuring Laws Delivered ImmediateSavings Through Legislative Fiat, Not ThroughCompetition
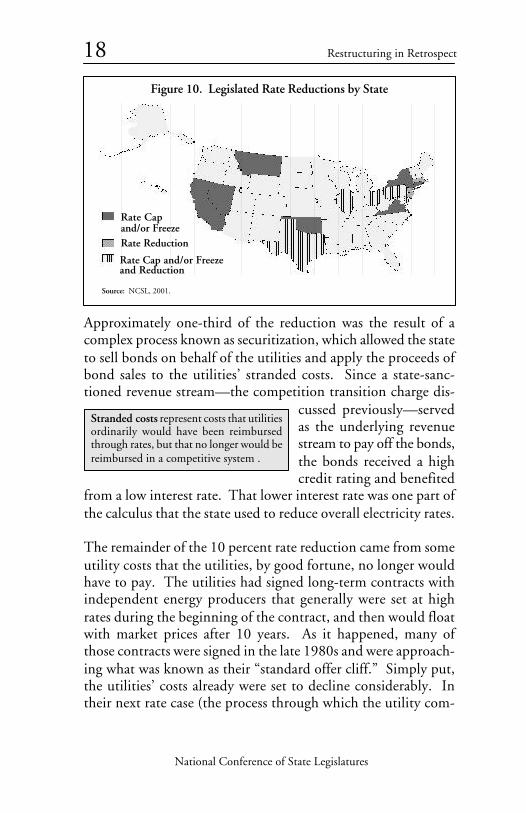
Many restructuring laws delivered a set of mandated rate reduc-tions, rate caps and rate freezes. As suggested below, many ofthese rate reductions were simply legislative means to achieve—in the very near term—what ultimately would have been achievedunder the ordinary regulatory process. Savings that resulteddirectly from competition would have been an additional ben-efit for consumers. Many of the early rate cuts that occurredcame about not because of competition but because of legisla-tion. California’s 10 percent rate reduction is an example ofthis. Figure 10 and appendix A describe where those rate capsor freezes were in place.
California mandated a 10 percent reduction in electricity ratesfor all residential customers. This rate reduction became effec-tive on Jan. 1, 1998. The California Public Utilities Commis-sion delayed the start of competition until March 31 of thatyear, but the rate reduction appeared on customers’ bills in Janu-ary. The rate reduction was not the result of competition, but,rather, the result of some clever financing arrangements and goodluck.
A Typical Residential Customer’s Bill: ............................................ $70.00 (Source: Energy Information Administration)
40 Percent of Typical Bill Is for Power Delivery .............................. $28.00
Portion of Bill Subject to Competition .......................................... $42.00
Typical Savings Are from 2 percent to 10 percent ......................................$.84 to $4.20 savings per month
Figure 9. Savings for Residential Customers
Source: NCSL, 2001.
The Early Experience
National Conference of State Legislatures
18 Restructuring in Retrospect
Approximately one-third of the reduction was the result of acomplex process known as securitization, which allowed the stateto sell bonds on behalf of the utilities and apply the proceeds ofbond sales to the utilities’ stranded costs. Since a state-sanc-tioned revenue stream—the competition transition charge dis-
cussed previously—servedas the underlying revenuestream to pay off the bonds,the bonds received a highcredit rating and benefited
from a low interest rate. That lower interest rate was one part ofthe calculus that the state used to reduce overall electricity rates.
The remainder of the 10 percent rate reduction came from someutility costs that the utilities, by good fortune, no longer wouldhave to pay. The utilities had signed long-term contracts withindependent energy producers that generally were set at highrates during the beginning of the contract, and then would floatwith market prices after 10 years. As it happened, many ofthose contracts were signed in the late 1980s and were approach-ing what was known as their “standard offer cliff.” Simply put,the utilities’ costs already were set to decline considerably. Intheir next rate case (the process through which the utility com-
Figure 10. Legislated Rate Reductions by State
Rate Capand/or FreezeRate Reduction
Rate Cap and/or Freezeand Reduction
Source: NCSL, 2001.
Stranded costs represent costs that utilitiesordinarily would have been reimbursedthrough rates, but that no longer would bereimbursed in a competitive system .

National Conference of State Legislatures
19mission sets rates for the utility), the utilities’ rates would havebeen adjusted downward to account for this decrease in theircosts.
Another source of funds for the legislated rate reductions in Cali-fornia and elsewhere came from asset sales that were far abovebook value. Power plants—particularly those located near largepopulation centers, gas lines and electricity transmission lines—sold for more than most analysts expected. In some cases, theysold for double or more the value at which they were listed onthe companies’ accounting books. In many cases, the gains onthese asset sales flowed to consumers to the extent that regula-tors wanted them to, and reduced the amount that consumerspaid as a transition cost charge.
Massachusetts also reduced rates by 10 percent. Again, how-ever, its rate reduction was not the direct result of competition.Massachusetts’ regulators set the price for power—known as thestandard offer price—at 2.8 cents per kilowatt-hour that ini-tially was below the wholesale price of 3.5 cents per kilowatt-hour. The utilities kept track of any losses from selling power atthis low rate, and subsequently would recover the losses—througha standard cost charge—from the same customers who receivedthe discount.
In all these cases, however, customers did receive an immediatebenefit from the law that was intended to establish competition.However, the benefit did not flow from competition. In thesecases, too, the rate charged to customers that did not switch wasan important factor in determining how many customers ulti-mately switched providers.
The Early Experience

National Conference of State Legislatures
20 Restructuring in Retrospect
The Overall Trend Has Been to Cap or Freeze RetailRates and to Leave Wholesale Power Rates toFluctuate
The advantage of the rate cap or freeze is that it protects custom-ers—especially smaller customers that may not have the resourcesto monitor electricity prices, the ability to reduce their electric-ity use or the means to search out alternative sources of sup-ply—from rising energy prices. It further can protect customersthat use relatively little power and that may be less attractivecustomers for retail marketers. Consumer advocates—who typi-cally advocate for residential and smaller consumers—feel thatrate freezes and caps are an essential component of a competitivemarket, at least until well-functioning competition can be shownto be effective.
Others, however, consider rate freezes and caps for retail cus-tomers an element of “partial deregulation,” which allows thereal market price of electricity to fluctuate but does not allowthose market prices to flow through to retail customers. Thissituation was most marked in California, where wholesale elec-tricity prices skyrocketed to many times their prior-year levels;retail prices, however, were not allowed to increase. In the end,utilities lost money on every kilowatt-hour they sold, and one—Pacific Gas & Electric—declared bankruptcy.
Critics of the regulated rate freezes and caps argue that electric-ity supply would have been less strained had customers’ ratesreflected the actual wholesale cost of electricity. Higher pricesmight have convinced people to reduce their electricity usage orto seek alternative sources of electricity, which would eventuallyhave put downward pressure on electricity prices. They arguethat this would have further helped to develop the competitivemarket that, in California and elsewhere, had been slow to de-velop.

National Conference of State Legislatures
21As a consequence, some argue that the best way to achieve arelationship between supply and demand would be to installreal-time meters in every customer’s home and business, thusgiving them the ability to shift their usage to off-peak hoursshould electricity prices be-come volatile. It is not yetclear whether real-timemeters are cost effective forall classes of customers in allsituations.
Consumer advocates argue that this approach, particularly ifcombined with lifting of rate caps or freezes, would leave manyconsumers in a difficult financial situation. Many small con-sumers are unlikely to switch providers and many are equallyunlikely to be able to adjust their habits quickly enough to re-spond to a one-day notice of an upcoming price spike. Howmuch could the average low-income customer whose main en-ergy usage comes from lighting and refrigeration adjust his orher usage?
Some Customers Received Some Savings inSome Markets for a While
Although wholesale electricity prices remained low in the late1990s, some particularly large electricity customers were able tosave money through deals they struck with power marketers.Most residential and small commercial customers were not di-rectly exposed to retail competition. As a result, little empiricalevidence is available to suggest how residential customers wouldhave fared had retail competition been successful. The follow-ing sections address the experiences of residential and small com-mercial customers and larger customers, in turn.
With a few exceptions, retail markets nationwide have been quietfor most residential customers, with few marketers selling prod-ucts and few small consumers buying. This means that only a
The Early Experience
Real-time meters enable customers tosee—and power companies to chargefor—the cost of power as it changes fromminute to minute. Most customers cur-rently pay an average electricity rate.
National Conference of State Legislatures
22 Restructuring in Retrospect
very few customers have sampled a competitive product. Para-doxically, one of the most important factors in how quickly de-regulation takes hold is how regulators set the price for custom-ers that do not choose a competitive provider. This regulatedrate, if set high, allows competitors to beat the rate and still earna profit. If set low, it often makes it difficult for competitors toboth beat the price and earn a profit. This rate is alternatelycalled a “default price,” a “price to compare” or a “price to beat.”The following section illustrates the importance of this regu-lated price in the “deregulated” market for three states.
Residential and Small Commercial Customers
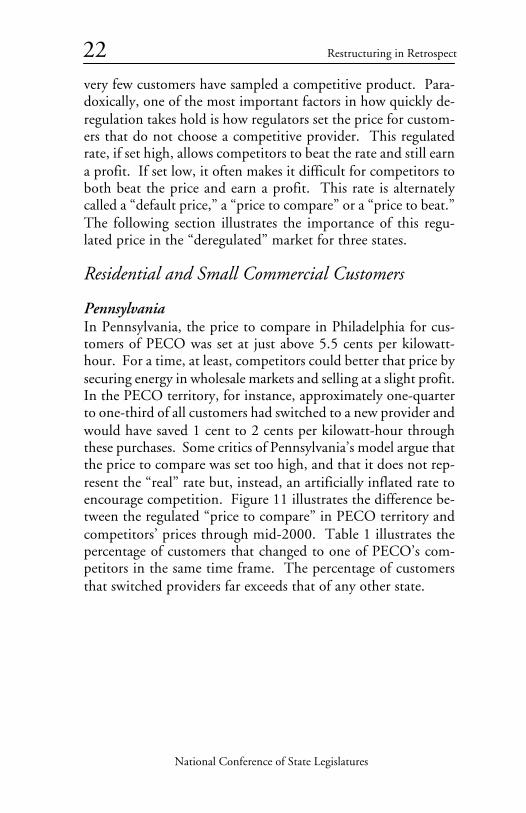
PennsylvaniaIn Pennsylvania, the price to compare in Philadelphia for cus-tomers of PECO was set at just above 5.5 cents per kilowatt-hour. For a time, at least, competitors could better that price bysecuring energy in wholesale markets and selling at a slight profit.In the PECO territory, for instance, approximately one-quarterto one-third of all customers had switched to a new provider andwould have saved 1 cent to 2 cents per kilowatt-hour throughthese purchases. Some critics of Pennsylvania’s model argue thatthe price to compare was set too high, and that it does not rep-resent the “real” rate but, instead, an artificially inflated rate toencourage competition. Figure 11 illustrates the difference be-tween the regulated “price to compare” in PECO territory andcompetitors’ prices through mid-2000. Table 1 illustrates thepercentage of customers that changed to one of PECO’s com-petitors in the same time frame. The percentage of customersthat switched providers far exceeds that of any other state.

National Conference of State Legislatures
23
CaliforniaAn example from California shows a pattern of customers choos-ing a premium product instead of a price-discounted product.In the first year or so of the competitive market, Californiansflocked to “green” products—electricity products that were pro-duced from wind, geothermal, solar or some other renewableresource. In general, however, these were more expensive thanthe non-green product offered through the utility. Subsequently,the California Energy Commission offered a subsidy for greenproducts that lowered their cost to the equivalent of the non-green product offered through the utility. With this new price,almost 100 percent of the relatively small number of residentialcustomers who chose a competitive power supplier chose thegreen product. Aside from green product offerings, few market-ers could compete with the utility’s regulated, capped retail ratesin California. As a result, competitive power suppliers could notoffer any additional savings to residential customers. Table 2illustrates that the general pattern in California reflected the rest
The Early Experience
Figure 11. PECO and Competitors’ RatesC
ents
per
Kilo
wat
t-ho
ur
3
4
5
6
7
August December April August December1999 1999 2000 2000 2000
Source: NCSL, 2001.
Allegheny Energy
Exelon Energy
PECO’s priceto compare
Table 1. PECO Customers Switching as of October 2000
Residential
15.18 percent
Commercial
32.13 percent
Source: Pennsylvania Office of Consumer Advocate, 2001.
National Conference of State Legislatures
24 Restructuring in Retrospect
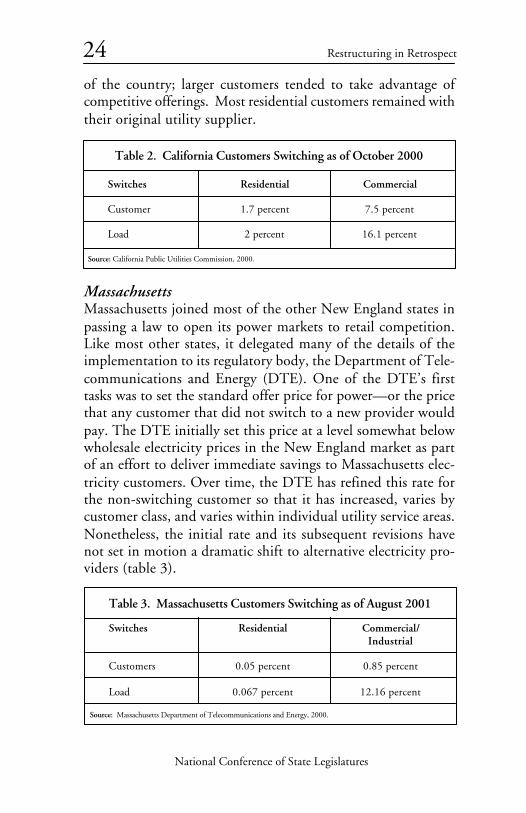
of the country; larger customers tended to take advantage ofcompetitive offerings. Most residential customers remained withtheir original utility supplier.
MassachusettsMassachusetts joined most of the other New England states inpassing a law to open its power markets to retail competition.Like most other states, it delegated many of the details of theimplementation to its regulatory body, the Department of Tele-communications and Energy (DTE). One of the DTE’s firsttasks was to set the standard offer price for power—or the pricethat any customer that did not switch to a new provider wouldpay. The DTE initially set this price at a level somewhat belowwholesale electricity prices in the New England market as partof an effort to deliver immediate savings to Massachusetts elec-tricity customers. Over time, the DTE has refined this rate forthe non-switching customer so that it has increased, varies bycustomer class, and varies within individual utility service areas.Nonetheless, the initial rate and its subsequent revisions havenot set in motion a dramatic shift to alternative electricity pro-viders (table 3).
Table 3. Massachusetts Customers Switching as of August 2001
Switches
Customers
Load
Residential
0.05 percent
0.067 percent
Commercial/Industrial
0.85 percent
12.16 percent
Source: Massachusetts Department of Telecommunications and Energy, 2000.
Table 2. California Customers Switching as of October 2000
Switches
Customer
Load
Residential
1.7 percent
2 percent
Commercial
7.5 percent
16.1 percent
Source: California Public Utilities Commission, 2000.

National Conference of State Legislatures
25The exception to this pattern has been buyers’ groups, or aggre-gated groups of customers, that together solicit bids to servetheir electricity needs. For instance, in the nation’s largest-everenergy aggregation contract to date, Green Mountain Energywas selected to serve an aggregated group of more than 400,000electricity customers in Ohio. In Rhode Island, the League ofCities and Towns negotiated a long-term contract to serve theelectricity needs of its members.
It is still too early to tell how much savings the competitivemarket will deliver to residential and small commercial custom-ers. Some critics argue that not only is it too early, but thatconsiderable time will elapse before most residential customersbenefit from competition.
Commercial and Industrial Customers
A far larger proportion of commercial and industrial customershave switched to alternative providers throughout the UnitedStates than have small commercial and residential customers (fig-ures 11, 12 and 13 above illustrate this trend). This indicatesthat these customers were receiving enough savings by shoppingfor power to make it worth their time and effort to make theswitch.
Information about the contracts set up between the large cus-tomers and electricity suppliers (known as bilateral contracts) isdifficult to obtain, so little real information is available aboutindustrial customers’ savings.
Lawrence Berkeley National Laboratory in California gatheredanecdotal evidence of large commercial and industrial custom-ers’ savings attributed to purchasing electricity in competitivemarkets. Their study, based on press releases and interviewswith energy managers in large companies, indicated that, dur-ing the late 1990s, most large customers estimated they weresaving between 1 percent and 5 percent (in California), between
The Early Experience
National Conference of State Legislatures
26 Restructuring in Retrospect
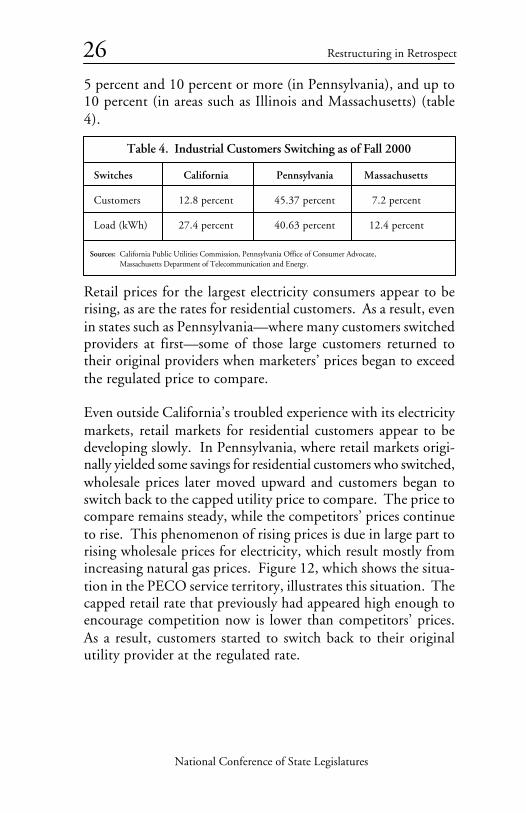
5 percent and 10 percent or more (in Pennsylvania), and up to10 percent (in areas such as Illinois and Massachusetts) (table4).
Retail prices for the largest electricity consumers appear to berising, as are the rates for residential customers. As a result, evenin states such as Pennsylvania—where many customers switchedproviders at first—some of those large customers returned totheir original providers when marketers’ prices began to exceedthe regulated price to compare.
Even outside California’s troubled experience with its electricitymarkets, retail markets for residential customers appear to bedeveloping slowly. In Pennsylvania, where retail markets origi-nally yielded some savings for residential customers who switched,wholesale prices later moved upward and customers began toswitch back to the capped utility price to compare. The price tocompare remains steady, while the competitors’ prices continueto rise. This phenomenon of rising prices is due in large part torising wholesale prices for electricity, which result mostly fromincreasing natural gas prices. Figure 12, which shows the situa-tion in the PECO service territory, illustrates this situation. Thecapped retail rate that previously had appeared high enough toencourage competition now is lower than competitors’ prices.As a result, customers started to switch back to their originalutility provider at the regulated rate.
Table 4. Industrial Customers Switching as of Fall 2000
Switches
Customers
Load (kWh)
California
12.8 percent
27.4 percent
Pennsylvania
45.37 percent
40.63 percent
Sources: California Public Utilities Commission, Pennsylvania Office of Consumer Advocate,Massachusetts Department of Telecommunication and Energy.
Massachusetts
7.2 percent
12.4 percent

National Conference of State Legislatures
27
Figure 12. PECO and Competitors’ Rates Through Spring 2001C
ents
per
Kilo
wat
t-ho
ur
4
6
8
July Oct. Jan. April July Oct. Jan. March 1999 1999 2000 2000 2000 2001 2001 2001
Source: NCSL, 2001.
Allegheny Energy
Exelon EnergyPECO’s priceto compare
The Early Experience
Table 5. Percent of PECO Customers Switching as of July 2001
Residential
12.5 percent*
Residential
13.7 percent
Commercial
5.0 percent
Commercial
6.0 percent
Industrial
4.7 percent
Industrial
7.0 percent
Source: California Public Utilities Commission, 2000.
Load Switching
* The right to serve an additional 16.4 percent of PECO customers was assigned to a competitive producer througha 2001 competitive auction.
Table 5 further indicates that it was often the largest customersamong the industrial class that switched in the greatest num-bers.

National Conference of State Legislatures
28 Restructuring in Retrospect
THE ROAD AHEAD
The potential for any kind of structural or legal changes to theelectric industry is preconditioned on wholesale power marketsthat function well. In other words, without sufficient genera-tion, adequate means to deliver power through transmission lines,and an institutional structure to support power generation andtransmission, retail market deregulation stands little chance ofproviding consumers with stable and affordable electricity rates.
Factors to Consider
Policymakers will want to consider a number of factors that arenew to the electric industry, including the following.
Current Lack of Coordinated Planning or Oversightof Power Markets
Many state or regional efforts to at least monitor power marketsfell by the wayside during the mid-1990s. Beginning in late2000, more than a dozen states began concerted efforts to de-sign some kind of state energy policy through either a legislativeor executive branch initiative. Many observers suggest that sometype of coordinated body could monitor the power market andmake recommendations about where new transmission systeminvestments should be made, what upgrades to the generationsystem should be made, and what role distributed resources and
28

National Conference of State Legislatures
29energy efficiency should have in decisions about new generationand new transmission.
Dependence on Natural Gas
Almost every major new power generating facility in the countrywill use natural gas—the exceptions being a small number ofcoal- and wind-powered facilities. The new risks to the electricsystem will increasingly come from the natural gas market. Howvolatile will natural gas prices be? How much storage capacityfor natural gas is in place to insulate companies and consumersfrom natural gas price fluctuations? When supplies of naturalgas run short during a cold winter, will electricity generatorshave the flexibility to switch to other fuels if the available gasmust be used for home heating? How robust is the currentdelivery system for natural gas?
Market Power
In newly competitive power markets, some observers express con-cern that a small number of companies could manipulate prices,or that they could—at certain times of day or year—charge pricessignificantly higher than a truly competitive market or a regu-lated market would allow. The assertions that such manipula-tion or overcharging has actually happened are difficult to sub-stantiate, although many organizations are examining this pos-sibility.
State policymakers will increasingly want to pay attention tomarket power concerns, even though it may mean finding waysto influence regional organizations and regional power markets.Electric power markets have been regional markets for a longtime; however, the pace of the transition to regional markets willrequire more cooperation among states. One area that statepolicymakers may wish to consider is how the regional organiza-tions that manage the power system can use a variety of differentresources to meet electric power system needs, including not
The Road Ahead
National Conference of State Legislatures
30 Restructuring in Retrospect
only large generators but also small, distributed generators andcustomers’ energy efficiency measures.
Transmission and Generation Siting
For the moment, states have full control over siting generationand transmission facilities. As power markets rapidly becomemore regional, these facilities become more difficult to site. Whyshould Kentucky residents bear the burden of power plants builtto serve load in Ohio, for instance? Why should transmissionlines be built through one state to deliver power to serve an-other? Although there are legitimate answers to these questions,they nonetheless arise in multiple situations.
Some of the issues that states may need to address also arose inCalifornia during 2000-2001. (Although the focus of this re-port is not on California, another NCSL publication—California’sPower Crisis: What Happened? What Can We Learn?—discussesthese factors in detail.)
Lessons from California
Many of the problems California encountered in 2000 and 2001resulted from difficulties with its wholesale power market. These,in turn, created problems for the retail power market. A few ofthe most prominent lessons from California’s experience follow.
1. California did not build sufficient generation to meet itsneeds and relied on imports from other states that also hadbuilt little new generation. In a regulated market, such atight supply and demand balance may result in rollingbrownouts and blackouts. In California’s competitive mar-ket, it also yielded some price volatility and rate increasesthat thus far had not been seen in electricity markets.
California’s problems were the consequence not only of ashortage of summer power supply, but also of an unmanaged

National Conference of State Legislatures
31The Road Ahead
winter power supply. Blackouts occurred in California dur-ing the winter months when the apparent supply of elec-tricity should have been more then adequate. However, manypower plants were off line for maintenance or did not sellinto the market for other reasons. It remains a matter ofdebate as to how and why winter shortages occurred in Cali-fornia, but it is clear that no combination of market partici-pants or government agencies under the current market struc-ture had the full obligation, authority or ability to keep thelights on.
2. California’s wholesale and retail markets were disconnected,such that price swings due to supply constrictions and in-creasing natural gas prices in the wholesale market were notreflected on retail customers’ electricity bills. As a result,demand was unresponsive to the gyrations in the wholesalemarket. Some critics argued that it was unfair to make con-sumers respond to market prices. Nonetheless, it was a real-ity that the California electric system—both the utilitiesand the state—paid prices for power that they could notrecover in retail rates.
3. The utilities remained the primary suppliers for California’selectricity customers, but the utilities were restricted in howthey could participate in the wholesale market. For instance,although most wholesale buyers outside California tried tosecure power through a mixture of long-term contracts, someshort-term contracts and some of their own generation,California’s utilities could, for the most part, purchase poweronly on the spot mar-ket. This lack of flex-ibility hampered thefunctioning of thewholesale market.
4. To some degree, a lack of adequate transmission capacityworsened California’s problems. Although enough capacity
The spot market is an instantaneous powermarket in which electricity trades for im-mediate sale. Spot markets tend to be morevolatile than long-term or forward markets.

National Conference of State Legislatures
32 Restructuring in Retrospect
was available to move power into the state, transmission con-straints kept power from moving between the northern andsouthern parts of the state and reduced the efficiency of thewholesale market. Transmission constraints can be worse insome other areas of the country and are the subject of heateddebate.
5. It is difficult to prove that any single company has exercisedany kind of market power or price manipulation, althoughmany parties have tried to assess blame on one another. Whatis clear is that, although demand for power rose to someextent in California, prices rose at a far greater rate. Noconclusions are drawn here about market power, but it isclear that, to some degree, the wholesale market in Califor-nia was producing unexpected results.
What Can State Legislators Control?
State policymakers face a dilemma with electric industry mar-kets; they are the first line of defense—the first people that thepublic contacts—when things go awry. Yet, state policymakersdo not exert control over every facet of the market. Statepolicymakers will want to be well aware of what they do and donot control, especially since a concerted public policy effort hasbegun to move toward less direct regulation and more competi-tion. State policymakers can control some elements of electric-ity markets but have little direct control over other elements ofthe markets. (Another NCSL document, The Electric Industry:State and Federal Jurisdiction, discusses in more detail what isunder state and federal control.)
In general, state policymakers can look to the following itemsthat are under their control—and others that are not under theirdirect control (table 6). This division between what is and whatis not under the direct control of states may help statepolicymakers to think of policies that they may pursue in theirown states to influence the course of the electric industry. Alaska,

National Conference of State Legislatures
33Hawaii and part of Texas are subject to different rules and gener-ally are less subject to federal authority. State policymakers maybe able to consider not only what they do and do not controldirectly, but also how they may use what they do control toinfluence the areas that they do not control.
Many of the problems with retail competition link directly todifficulties in wholesale power markets. These problems includea lack of adequate generation or transmission capacity and a still-developing set of rules governing who builds and pays for eachof these. The federal government controls the price and policiesfor transmission lines and, in states that have restructured, canexercise a general authority over pricing and policies for genera-tion.
States have more direct authority over whether a power plant orline is built, through siting authority. They also have influenceover how much power consumers use, through energy efficiencyprograms. Through these authorities, states actually wield con-siderable influence over how well the wholesale markets work.
The Road Ahead
Not Under Direct State Control• Wholesale electricity rates and
prices• Wholesale natural gas prices• Formation of regional electricity
entitites (often called regionaltransmission organizations)
• Electric rates and policies offederal utilities
• Transmission rates and policies• Granting rights for a generator to
sell power at “market based rates”
Under State Control or Influence• Retail electricity rates• Retail electricity usage (through
efficiency or pricing programs)• Initial decision about whether to
allow retail competition• Power plant siting• Power line siting• State tax policy related to
generation, efficiency, renewableenergy, and transmission anddistribution systems
Table 6. Elements of Electricity Markets
Source: NCSL, 2001.
National Conference of State Legislatures
34 Restructuring in Retrospect
Linking Retail Demand with Wholesale Supply
One element of state authority that warrants considerable atten-tion and discussion is the idea of creating a link between elec-tricity demand and wholesale electricity supply and prices. Mostcustomers do not adjust their electricity usage—as they might,for instance, for gasoline—if wholesale supplies constrict or pricesincrease. Indeed, it may not be desirable for all customers to feelthe effects of wholesale price fluctuations.
A number of policy measures, some of which are under directcontrol of the states, may offer a way to allow at least some cus-tomers to adjust their demand for electricity when wholesaleprices and supplies tighten. Some analysts refer to this as bring-ing a “demand response” to the market. One method of bring-ing some element of demand responsiveness into the power marketis to install a special meter on customers’ premises. When whole-sale prices increase, the meter reflects increases in real time.
Instead of installing real-time meters on every business and homeat great cost, another alternative would be to target a few cus-tomers for demand reduction and to compensate them for re-ducing their power demand. This could be effective becauseprice spikes affect only a small number of hours during the yearand because small reductions in demand—often as little as 5percent of total demand during a few hours—can significantlyreduce the strain on the power system.
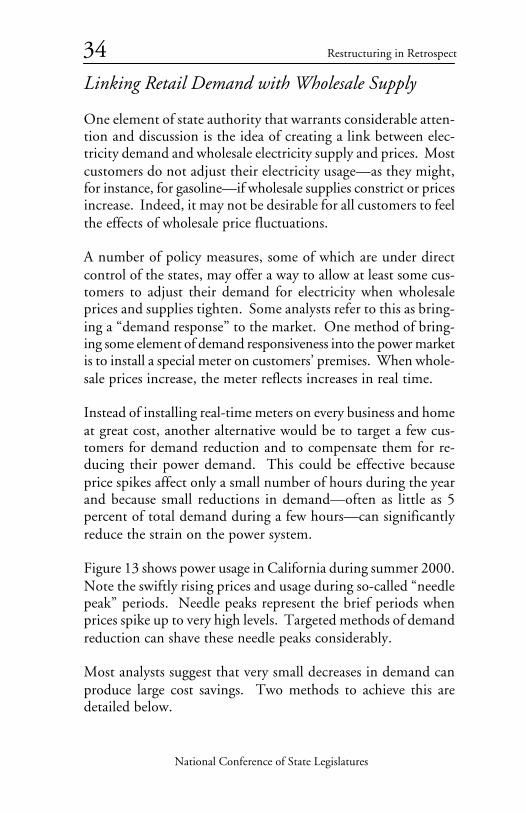
Figure 13 shows power usage in California during summer 2000.Note the swiftly rising prices and usage during so-called “needlepeak” periods. Needle peaks represent the brief periods whenprices spike up to very high levels. Targeted methods of demandreduction can shave these needle peaks considerably.
Most analysts suggest that very small decreases in demand canproduce large cost savings. Two methods to achieve this aredetailed below.

National Conference of State Legislatures
35The Road Ahead
Dollars per Megawatt-Hour
0
10
0
20
0
30
0
40
0
50
0
600
70
0
80
0
Jun
e
July
A
ug.
Se
pt.
O
ct.
N
ov.
Dec
.
J
an.
Feb
.
M
arch
A
pri
l
M
ay
Jun
e
J
uly
19
99
19
99
19
99
19
99
19
99
1
99
9
1
99
9
2
00
0
2
00
0
20
00
2
00
0
2
00
0
2
00
0
2
00
0
$2
50
Cap
$7
50
Cap
$5
00
Cap
$2
50
Cap
PX
SP
15
zon
al p
rice
sSC
E a
nd
SD
G&
E p
urc
has
e d
ay-a
hea
d e
lect
rici
ty a
t th
e SP
15
pri
ce
Sour
ce: C
alifo
rnia
Pow
er E
xcha
nge,
200
0.
Figu
re 1
3. P
X D
ay-A
head
Ele
ctri
city
Pri
ces

National Conference of State Legislatures
36 Restructuring in Retrospect
• Demand Bidding. Customers or their agents would be ableto bid into the wholesale market to reduce their demand forpower at certain times of day. These bids would compete ona price basis against bids to supply power during the sametime. The market would decide which among the portfolioof demand and supply bids would be accepted.
• Demand Participation. A customer could set up a contractwith its utility or electricity provider through which, whenthe electric system requires additional capacity, the customerwould reduce usage. The utility then could sell these kilo-watt-hours on the open market at the available price. Thecustomer and the utility would split the proceeds of thatsale according to some prearranged formula.
Another example comes from Washington, D.C., and Maryland.Customers receive a small discount on their electric bill and givetheir utility the right to install a small device on their air condi-tioner. The device, when activated, allows the utility to turn offthe customer’s air conditioner for a few minutes each hour dur-ing high-use periods. The short time that the air conditioner isturned off does not affect the customer’s comfort in most cases,and the combination of many air conditioners being turned offhelps the electric system meet its demand for power.
Some fundamental changes in the electric industry structure haveoccurred that alter the traditional role of the regulated electricutility. Increased opportunities for specialization in areas likepower generation ownership and operation, wholesale electric-ity market trading, transmission system ownership, transmis-sion system management, distribution system management, bill-ing, and more led many utility companies to divest or out-sourcetraditional electric company functions. One specialization ofsome note is ownership of nuclear units. Six companies havemade clear their intent to acquire operating nuclear units fromother, less committed, owners and to improve overall perfor-mance.

National Conference of State Legislatures
37 The Road Ahead
An outcome of this trend is that in many parts of the UnitedStates no one company can solve a public policy problem in theutility sector. A comprehensive view is beneficial in decidingwhich from among several system investments can best addressgrowth. Power lines, large generation, small generation and effi-ciency all interact to address power system needs. Yet, theseinvestments are, in many cases, controlled by different compa-nies. With a fragmented industry, some states now are examin-ing ways to develop a policy and planning process that inte-grates these many activities.
Conclusions
The early years of restructuring have produced a mixture of re-sults and these results reflect a market in transition. It appearsfair to say that competition could produce a broader array ofinnovations and products than regulation, and that it could doso while also keeping electricity costs stable and affordable forconsumers. To date, most of the benefits of retail competitionfor electricity remain theoretical. Achieving the benefits prob-ably will be more difficult than expected by even the strongestadvocates of retail competition. It also seems apparent that itwill be difficult to achieve the conditions under which retailcompetition could produce this broad array of products at lowercost. Appendix B contains some questions that state policymakersmay wish to consider as they determine a path for their states.
Many retail competition advocates promoted the idea of retailelectric competition with the promise that that it would lowerrates for everyone. That has, however, proved difficult to deliver,not so much because retail competition could not ultimatelymake the electric system more efficient, but because prices un-der competition remain subject to many of the same forces thataffect prices under regulation. When natural gas prices increasedin 2000, wholesale electricity prices increased as well. Retailmarkets, without the benefits of well-functioning wholesalemarkets, proved less efficient than many had hoped and made it
National Conference of State Legislatures
38 Restructuring in Retrospect
difficult to achieve real savings from retail market competition.The question that perhaps remains unanswered is not whetherretail competition will lower rates for all consumers, but whethercompetition will make electricity rates lower than they other-wise would have been under regulation. The answer to thatquestion remains elusive.

National Conference of State Legislatures
39
Stat
e
Ari
zona
Cal
iforn
ia
Con
nect
icut
Del
awar
e
Illin
ois
Mas
sach
uset
ts
Mar
ylan
d
Mon
tana
Nev
ada
New
Jer
sey
AP
PE
ND
IX A
. R
ATE C
AP
S, F
RE
EZ
ES
AN
D R
ED
UC
TIO
NS
EST
AB
LISH
ED
IN S
TAT
E E
LEC
TR
IC
IND
UST
RY R
EST
RU
CT
UR
ING
LE
GIS
LAT
ION
Cap 4 4 4 4 4 4 4 4 4
Free
ze
Tran
siti
on p
erio
d
1996
rat
es t
hrou
gh 2
004
nonr
esid
enti
al
Red
ucti
on
10%
20%
sm
all c
usto
mer
s
7.5%
res
iden
tial
20%
res
iden
tial
(C
omE
d, I
ll. P
ower
);5%
res
iden
tial
(C
ILC
O)
10%
-15%
3%-7
.5%
res
iden
tial
10%
39

National Conference of State Legislatures
40 Restructuring in Retrospect
Stat
e
New
Yor
k
Con
Ed
(NY
)
Cen
tral
Hud
son
Gas
&E
lect
ric
(NY
)
Cap 4
Free
zeR
educ
tion
25%
imm
edia
te r
ate
decr
ease
for
larg
e in
dust
rial
cust
omer
s, t
o re
mai
n fix
ed fo
r fiv
e ye
ars.
10%
rat
e de
crea
se fo
r al
l oth
er c
usto
mer
s, p
hase
d in
over
five
yea
rs.
Bas
e el
ectr
ic r
ates
will
be
froz
en a
t 19
93 le
vels
thro
ugh
June
30,
200
1, fo
r al
l cus
tom
ers.
(B
ase
rate
sdo
not
ref
lect
cha
nges
in fu
el c
osts
.)
5% p
er y
ear
rate
red
ucti
ons
for
larg
e in
dust
rial
cust
omer
s; c
usto
mer
s m
ay c
hoos
e to
con
tinu
e to
buy
elec
tric
ity
from
Cen
tral
Hud
son
and
rece
ive
adi
scou
nt u
ntil
mid
-200
1, o
r th
ey m
ay s
elec
t an
ene
rgy
serv
ices
com
pany
(E
SCO
) w
hose
pri
ce w
ill b
ede
term
ined
by
the
mar
ket.
AP
PE
ND
IX A
. R
ATE C
AP
S, F
RE
EZ
ES
AN
D R
ED
UC
TIO
NS
EST
AB
LISH
ED
IN S
TAT
E E
LEC
TR
IC
IND
UST
RY R
EST
RU
CT
UR
ING
LE
GIS
LAT
ION
(C
ON
TIN
UE
D)

National Conference of State Legislatures
41
Stat
e
Ora
nge
and
Roc
klan
d (N
Y)
Roc
hest
er (
NY
)
Cap
O&
R’s
rate
s fo
r th
e sa
le a
ndde
liver
y of
ele
ctri
city
will
be
set
by t
he P
SC u
ntil
May
1,
1999
. The
PSC
will
cont
inue
to
regu
late
del
iver
yra
tes
afte
r th
at t
ime.
Pri
ces
for
the
gene
rati
on p
orti
on o
fel
ectr
icit
y af
ter
May
1,
1999
, will
be
set
by t
heco
mpe
titi
ve m
arke
t.
RG
&E
rat
es fo
r sa
le a
ndde
liver
y of
ele
ctri
city
are
set
unti
l mid
-200
2. T
he P
SCw
ill r
egul
ate
the
utili
ty’s
rate
s fo
r de
liver
y af
ter
2002
.P
rice
s fo
r el
ectr
icit
yge
nera
tion
aft
er 2
002
will
be d
eter
min
ed b
y th
eco
mpe
titi
ve m
arke
t.
Free
zeR
educ
tion
1995
-199
6: 4
% a
vera
ge r
esid
enti
al, 4
%-1
4%
com
mer
cial
and
indu
stri
al19
97: 1
% r
esid
enti
al19
98: 1
% a
ddit
iona
l for
res
iden
tial
1997
: 8.
5% la
rge
indu
stri
al
For
cus
tom
ers t
hat
part
icip
ate
in P
ower
Pic
k by
choo
sing
to b
uy e
lect
rici
ty fr
om a
n en
ergy
serv
ices
com
pany
(E
SCO
): L
arge
indu
stri
al c
usto
mer
s m
ayha
ve a
ddit
iona
l rat
e be
nefit
s in
the
ran
ge o
f 3.5
%Sm
alle
r cu
stom
ers
may
hav
e ad
diti
onal
rat
e be
nefit
sin
the
ran
ge o
f 2%
7.5%
res
iden
tial
, sm
all c
omm
erci
al8%
oth
er c
omm
erci
al, m
ost
indu
stir
al11
.2%
larg
e in
dust
rial
All
phas
ed in
ove
r fiv
e ye
ars
5% fo
r fiv
e ye
ars,
for
indu
stri
al a
nd la
rge
com
mer
cial
user
s w
ith
mor
e th
an 5
00 k
W o
f loa
d ca
paci
ty
AP
PE
ND
IX A
. R
ATE C
AP
S, F
RE
EZ
ES
AN
D R
ED
UC
TIO
NS
EST
AB
LISH
ED
IN S
TAT
E E
LEC
TR
IC
IND
UST
RY R
EST
RU
CT
UR
ING
LE
GIS
LAT
ION
(C
ON
TIN
UE
D)
Appendices
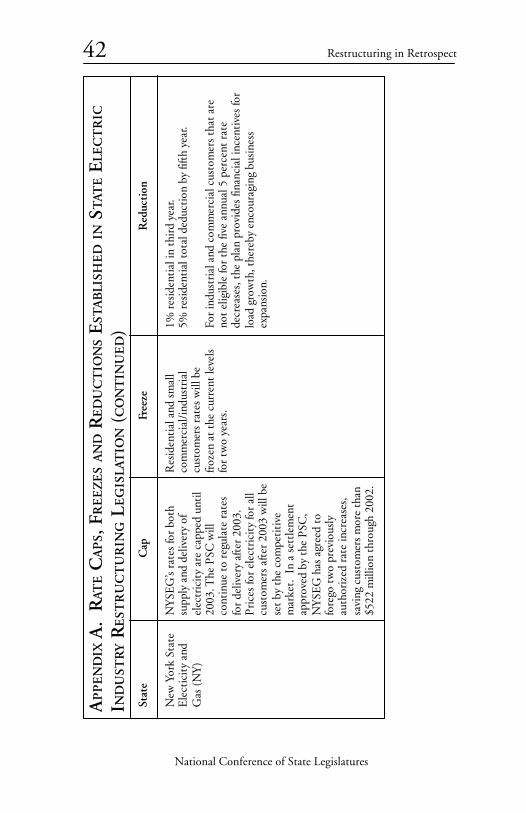
National Conference of State Legislatures
42 Restructuring in Retrospect
Stat
e
New
Yor
k St
ate
Ele
ctic
ity
and
Gas
(N
Y)
Cap
NY
SEG
’s ra
tes
for
both
supp
ly a
nd d
eliv
ery
ofel
ectr
icit
y ar
e ca
pped
unt
il20
03. T
he P
SC w
illco
ntin
ue t
o re
gula
te r
ates
for
deliv
ery
afte
r 20
03.
Pri
ces
for
elec
tric
ity
for
all
cust
omer
s af
ter
2003
will
be
set
by t
he c
ompe
titi
vem
arke
t. I
n a
sett
lem
ent
appr
oved
by
the
PSC
,N
YSE
G h
as a
gree
d to
fore
go t
wo
prev
ious
lyau
thor
ized
rat
e in
crea
ses,
savi
ng c
usto
mer
s m
ore
than
$522
mill
ion
thro
ugh
2002
.
Free
ze
Res
iden
tial
and
sm
all
com
mer
cial
/ind
ustr
ial
cust
omer
s ra
tes
will
be
froz
en a
t th
e cu
rren
t le
vels
for
two
year
s.
Red
ucti
on
1% r
esid
enti
al in
thi
rd y
ear.
5% r
esid
enti
al t
otal
ded
ucti
on b
y fif
th y
ear.
For
indu
stri
al a
nd c
omm
erci
al c
usto
mer
s th
at a
reno
t el
igib
le fo
r th
e fiv
e an
nual
5 p
erce
nt r
ate
decr
ease
s, t
he p
lan
prov
ides
fina
ncia
l inc
enti
ves
for
load
gro
wth
, the
reby
enc
oura
ging
bus
ines
sex
pans
ion.
AP
PE
ND
IX A
. R
ATE C
AP
S, F
RE
EZ
ES
AN
D R
ED
UC
TIO
NS
EST
AB
LISH
ED
IN S
TAT
E E
LEC
TR
IC
IND
UST
RY R
EST
RU
CT
UR
ING
LE
GIS
LAT
ION
(C
ON
TIN
UE
D)

National Conference of State Legislatures
43
Stat
e
Nia
gara
Moh
awk
(NY
)
Ohi
o
Okl
ahom
a
Penn
sylv
ania
Cap
Nia
gara
Moh
awk
rate
s fo
rel
ectr
icit
y an
d it
s de
liver
yar
e se
t un
til S
ept.
1, 2
001.
In 2
001
and
2002
, Nia
gara
Moh
awk
may
req
uest
limit
ed r
ate
incr
ease
s, b
utth
e P
SC m
ust
revi
ew a
ndap
prov
e an
y re
ques
t.
4 4 4
Free
ze
Five
yea
rs
Red
ucti
on
4.3%
ove
rall
aver
age.
3.2
% a
vera
ge fo
r re
side
ntia
lan
d co
mm
erci
al o
ver
thre
e ye
ars.
13%
indu
stir
al
5% r
esid
enti
al
Alle
ghen
y17
% fo
r D
uque
sne
cust
omer
s2.
5% fo
r G
PU
(M
et-E
d) c
usto
mer
s3.
0% fo
r G
PU
(Pe
nele
c) c
usto
mer
s8%
all
cuso
mer
s 19
996%
for
2000
PE
CO
cus
tom
ers
4% fo
r P
A P
ower
& L
ight
cus
tom
ers
2.5%
Wes
t Pe
nn
AP
PE
ND
IX A
. R
ATE C
AP
S, F
RE
EZ
ES
AN
D R
ED
UC
TIO
NS
EST
AB
LISH
ED
IN S
TAT
E E
LEC
TR
IC
IND
UST
RY R
EST
RU
CT
UR
ING
LE
GIS
LAT
ION
(C
ON
TIN
UE
D)
Appendices
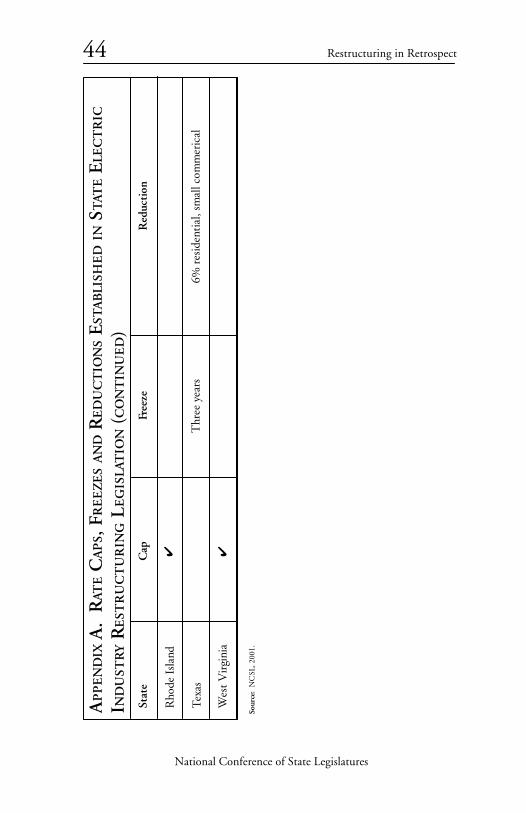
National Conference of State Legislatures
44 Restructuring in Retrospect
Stat
e
Rho
de I
slan
d
Tex
as
Wes
t V
irgi
nia
Cap 4 4
Free
ze
Thr
ee y
ears
Red
ucti
on
6% r
esid
enti
al, s
mal
l com
mer
ical
AP
PE
ND
IX A
. R
ATE C
AP
S, F
RE
EZ
ES
AN
D R
ED
UC
TIO
NS
EST
AB
LISH
ED
IN S
TAT
E E
LEC
TR
IC
IND
UST
RY R
EST
RU
CT
UR
ING
LE
GIS
LAT
ION
(C
ON
TIN
UE
D)
Sour
ce:
NC
SL, 2
001.
National Conference of State Legislatures
45
APPENDIX B. SUGGESTED
QUESTIONS FOR LEGISLATURES
TO CONSIDER REGARDING
ELECTRIC INDUSTRY
RESTRUCTURING
What Is the Goal of Restructuring in Your State?
1. Immediate Reductions in Electric Rates for All Cus-tomers.
a. How will you accomplish those rate reductions? Ifthrough legislative or regulatory order, would these ratereductions have occurred under regulation anyway?
b. Who will pay for the immediate rate reduction, if it isoffered?
2. Competition and switching among residential andsmall commercial customers.
a. What prices will be charged to customers who do notswitch and what enticements will be offered to encour-age people to switch?
45

National Conference of State Legislatures
46 Restructuring in Retrospect
b. If residential customers do not represent big profit-cen-ters for power marketers, how will you attempt to makethe residential market more attractive for marketers?
c. How long a transition period do you intend to provide?d. How will you protect those customers who have not
switched providers during the transition?
3. Protection of residential and small commercial cus-tomers while allowing or encouraging larger cus-tomers to switch providers.
a. How will the rates for the non-choosing customers bedetermined?
b. What products will the non-choosing customers be of-fered, assuming some type of regulation of residentialmarkets continues?
c. How will rates for the non-choosing—but eligible-to-choose large customers—be determined?
4. Promotion of environmental benefits through re-tail sales of “green” electricity.
a. Will you require some type of standard “green” productinformation disclosure by providers?
5. Long-term efficiencies but a slow transition to amarket in which significant numbers of customershave switched.
a. How long will your transition period be?b. What will be your measure of success during the transi-
tion?c. How will you continue to regulate the business while it
is in the transition to competition?

National Conference of State Legislatures
47
What Is the State of Wholesale ElectricityMarkets in Your State and Your Region?
1. Is there, in your state and the region:
a. Adequate generation capacity?b. Adequate transmission capacity?c. A clearly defined set of rules governing generation plan-
ning, transmission access, transmission planning, trans-mission expenditures and investments?
d. An effective demand response program in place that tiesdemand in the retail market in some way to conditionsin the wholesale power market?
2. To what risks is your state exposed from the fuelsthat feed the generation mix in the state and re-gion?
a. If gas will serve as a feedstock for new generation, is thereadequate pipeline capacity into the region?
b. Which fuels currently, and in the future, determine theprice of generation in the region? How will the price ofnatural gas, coal, oil or other fuels bear on electricityprices in your state?
Appendices

National Conference of State Legislatures
48 Restructuring in Retrospect

National Conference of State Legislatures
49
NOTES
1. Nuclear facilities have, in recent years, been operatingmuch more reliably and for a greater percentage of the hours ina year, according to an article in Global Energy Business 2, no. 6,November/December 2000.
2. William Golove, Rodrigo Prudencio, Ryan Wiser andCharles Goldman, Electricity Restructuring and Value-Added Ser-vices: Beyond the Hype (Lawrence Berkeley National Laboratory,August 2000).
49

National Conference of State Legislatures
50 Restructuring in Retrospect