2006:217 civ master's thesis1028633/fulltext01.pdf · as the world’s largest automation...
TRANSCRIPT

2006:217 CIV
M A S T E R ' S T H E S I S
Cutting Logistics Costs with a CentralizedDistribution Model for ABB’s Distribution
of LV Products in Asia Pacific
Anna Fröderberg
Luleå University of Technology
MSc Programmes in Engineering Industrial Business Administration
Department of Business Administration and Social SciencesDivision of Industrial Logistics
2006:217 CIV - ISSN: 1402-1617 - ISRN: LTU-EX--06/217--SE

Preface
PREFACE This master’s thesis has been written during the fall of 2005 as a final part of my university degree MSc in Industrial Management and Engineering, Lulea University of Technology, division of Industrial Logistics. The thesis has been conducted at ABB’s Logistics Centre Asia Pacific, located in Singapore. Fulfilling this study was made possible thanks to the support from a range of people that I would like to thank. I owe the biggest thanks to my supervisors at ABB Singapore, Isabel Chong and Heri Setiabudi. Their guidance and knowledge about logistics have helped me many times during the study. I would also like to thank Isabel for giving me the opportunity to write my thesis at the Logistics Centre. I am grateful for the experience of working in Singapore and the chance to expand my knowledge about logistics. I would also like to thank my supervisor Anders Sörqvist at Lulea University of Technology who has assisted me with his practical knowledge. Anna Ivarsson, your comments about my report have been utmost helpful. Finally, I would like to give my appreciation to all the people I have meet in Singapore that has made my stay here such a memorable time. It has been an interesting period here at ABB Singapore and I have had the opportunity to apply my education on an important issue in the industry. I am very pleased with the result and it is my hope that this report will contribute to an improved logistics performance at ABB. Singapore, December 2005. Anna Fröderberg

Abstract
ABSTRACT As the world’s largest automation supplier, ABB has built a value chain geared to the singular goal of achieving results for the customer. Every day ABB ships more than 1,000,000 automation products. Hence, logistics plays an important part for ABB to gain a substantial competitive edge in the global market place. The company must be able to deliver their products at shortest time possible to meet customer demands. If ABB wants to increase their market share and enhance its performance they must determine their competitive priorities. Both pricing and availability of the products are closely linked with the distribution channel. If the distribution channel is efficient then the products will be available in right quantities at the right time to customers. If the distribution channel is also cost efficient then the price of the products can be lowered. The objective of this study is to understand how the different logistics costs affect ABB’s distribution model and to find the most optimum model to support the Asia Pacific region in order to prevent a sub optimization. Today ABB have a decentralized distribution and the sales units keep their own stock to support local requirements. The total logistics costs constitute of 17.5 percent of the transfer price. A centralized distribution model will create a saving of X MUSD and lower the total logistics cost to 12.6 percent of the transfer price. In order to fulfil the purpose the author has done a broad literature review about distribution and cost models. The evaluation of today’s distribution model is based on information from a survey sent to concerned production and sales units during October 2005. The simulations for the regional distribution centre are based on parameters from the situation today. The conclusion of the thesis is that ABB will benefit from a centralized distribution model. Using a model with a regional distribution centre will not just save costs, it will also increase the service level by providing the customers with higher product availability. However, local stocking have its benefits since ABB will be close to customer location and can, if the right products are available, offer a faster delivery than a regional distribution centre. The disadvantage with a longer lead time can be avoided by using investing in new IT infrastructure or use existing technologies for order handling and use direct distribution to large end customers.

Sammanfattning
SAMMANFATTNING ABB är världens största leverantör av automationsprodukter och företaget skickar dagligen över 1,000,000 produkter. Det gör att logistiken spelar en avgörande roll för att nå konkurrensfördelar på marknaden. ABB måste kunna leverera sina produkter med korta ledtider för att möta kundernas krav. Konkurrensfördelar som är relaterade till distributionsmodellen är priset på produkten och produktillgängligheten. Om distributionsmodellen är effektiv kommer rätt produkter att vara på rätt plats enligt kunderna önskemål. Om distributionen också är kostnadseffektiv kan även priset på produkten sänkas. Syftet med denna studie är att förstå hur de olika logistikkostnaderna påverkar ABBs distributionsmodell och att finna den mest optimala modellen för att försörja Asia Pacific regionen. Idag har ABB en decentraliserad distributionsmodell med en total logistikkostnad på 17.5 procent i relation till transfer priset. En centraliserad distributionsmodell kommer att generera en besparing på X MUSD och sänka den totala logistikkostnaden till 12.6 procent av transfer priset. För att uppnå syftet har författaren genomfört en litteraturstudie inom ämnet distributions- och kostnadsmodeller. Utvärderingen av dagens distributionsmodell är baserad på information från en enkät skickad till berörda fabriker och säljbolag under oktober 2005. Simuleringarna för det regionala distributionscentret är baserat på parametrar från dagens situation. Slutsatsen är att ABB borde centralisera sin distributionsmodell. Att ha ett regionalt distributionscenter kommer inte bara att sänka kostnaden, det kommer också att öka servicenivån genom en högre produkttillgänglighet. Dock kommer ABB att vara närmare sina kunder om de har kvar lagren hos säljbolagen och de kan, om rätt produkter är tillgängliga, erbjuda en snabbare ledtid än regionalt distributionscenter. Nackdelen med utökad ledtid kan hanteras genom att investera in ny IT infrastruktur för orderhantering samt genom direkt distribution till kunderna.

Abbreviations
ABBREVIATIONS ATAP Automation Technology Automation Products AS-IS AS the situation IS today BA Business Area BU Business Unit DDU Delivered Duty Unpaid KPI Key Performance Indicator LCA Logistics Centre Asia LV products Low voltage products PU Production Unit RDC Regional distribution centre SU Sales unit SECRL ABB Cewe-Control, Västerås, Sweden ITSCE ABB Sace, Bergamo, Italy NOCRL ABB Control, Skien, Norway FRENT ABB Entrelec, Chassieu, France DEBJE Busch-Jager, Lüdenscheid, Germany DESTO ABB Stotz, Heidleberg, Germany FICON ABB OY, Vaasa, Finland

Table of Contents
1 INTRODUCTION .......................................................................................................................... 1
1.1 PROBLEM BACKGROUND .......................................................................................................... 1 1.2 PROBLEM DEFINITION............................................................................................................... 1 1.3 SPECIFYING THE PURPOSE ....................................................................................................... 2 1.4 EXCLUSIONS............................................................................................................................ 2 1.5 READING DIRECTIVES............................................................................................................... 3
2 RESEARCH METHODOLGY....................................................................................................... 4
2.1 RESEARCH ALIGNMENT............................................................................................................ 4 2.2 RESEARCH APPROACH............................................................................................................. 4 2.3 DATA COLLECTION METHODS................................................................................................... 4 2.4 VALIDITY AND RELIABILITY........................................................................................................ 5 2.5 COURSE OF ACTION................................................................................................................. 6
3 ABB FACTS................................................................................................................................. 8
3.1 ABB GROUP ........................................................................................................................... 8 3.1.1 Brief history .................................................................................................................... 8 3.1.2 ABB today ...................................................................................................................... 8
3.2 AUTOMATION PRODUCTS ......................................................................................................... 9 3.3 ABB SINGAPORE ................................................................................................................... 10
3.3.1 Logistic Centre Asia..................................................................................................... 10 3.4 LOW VOLTAGE PRODUCTS ..................................................................................................... 11
4 THEORETICAL FRAME OF REFERENCE............................................................................... 12
4.1 THE TOTAL COST CONCEPT ................................................................................................... 12 4.1.1 The Total Cost Model................................................................................................... 12
4.2 CUSTOMER SERVICE.............................................................................................................. 12 4.2.1 Availability .................................................................................................................... 13 4.2.2 Order cycle................................................................................................................... 14 4.3.2 Communication ............................................................................................................ 14
4.3 DISTRIBUTION ACTIVITIES AND COSTS .................................................................................... 14 4.3.1 Warehousing................................................................................................................ 14 4.3.2 Inventories ................................................................................................................... 14 4.3.3 Transport...................................................................................................................... 16 4.3.4 Order Processing ......................................................................................................... 17 4.3.5 Lot Quantity Costs ....................................................................................................... 18
4.4 DISTRIBUTION........................................................................................................................ 18 4.4.1 Intermediaries .............................................................................................................. 18 4.4.2 Centralized Distribution................................................................................................ 19 4.4.3 Product Characteristics................................................................................................ 20
4.5 MEASURING LOGISTICS.......................................................................................................... 21 4.5.1 Measuring distribution models ..................................................................................... 22
5 RESULTS FROM EMPIRICAL RESEARCH ............................................................................. 23
5.1 THE SALES ORGANISATION ..................................................................................................... 23 5.1.1 LV Products ................................................................................................................. 24 5.1.2 Customer Service ........................................................................................................ 25 5.1.3 Warehouse................................................................................................................... 25 5.1.4 Inventories ................................................................................................................... 25 5.1.5 Transport...................................................................................................................... 26 5.1.6 Order handling ............................................................................................................. 27 5.1.7 Measuring Logistics ..................................................................................................... 28
5.2 TOTAL COST MODEL.............................................................................................................. 28 5.2.1 Flows............................................................................................................................ 29

Table of Contents
5.2.2 Warehouse Costs ........................................................................................................ 30 5.2.3 Inventory Carrying Costs ............................................................................................. 31 5.2.4 Transportation Costs.................................................................................................... 32 5.2.5 Order handling Costs................................................................................................... 33 5.2.6 Lot quantity Costs ........................................................................................................ 34 5.2.7 Performance measurement ......................................................................................... 34 5.2.8 Total Logistics Costs.................................................................................................... 36
5.3 REGIONAL DISTRIBUTION CENTRE .......................................................................................... 37 5.3.1 Flows............................................................................................................................ 37 5.3.2 Warehouse costs ......................................................................................................... 38 5.3.3 Inventory carrying costs............................................................................................... 38 5.3.4 Transportation costs .................................................................................................... 39 5.3.5 Order processing cost.................................................................................................. 40 5.3.6 Lot quantity costs ......................................................................................................... 41 5.3.7 Performance ................................................................................................................ 41 5.3.8 Total logistics costs...................................................................................................... 41
6 ANALYSIS.................................................................................................................................. 43
6.1 WAREHOUSE COSTS.............................................................................................................. 43 6.2 INVENTORY CARRYING COSTS................................................................................................ 44 6.3 TRANSPORTATION COSTS ...................................................................................................... 46 6.4 ORDER HANDLING COSTS ...................................................................................................... 47 6.5 LOT QUANTITY COSTS ........................................................................................................... 48 6.6 PERFORMANCE...................................................................................................................... 49 6.7 REGIONAL DISTRIBUTION CENTRE .......................................................................................... 51
7 CONCLUSIONS ......................................................................................................................... 52
7.1 TOTAL LOGISTICS COSTS ....................................................................................................... 52 7.2 RECOMMENDATIONS .............................................................................................................. 53 7.3 CRITICAL VIEWPOINT ............................................................................................................. 55
REFERENCES .............................................................................................................................. 57 APPENDIX 1 – LOCATION OF SALES UNITS/PRODUCTION UNITS APPENDIX 2 – SURVEY TO SALES UNITS APPENDIX 3 – SURVEY TO PRODUCTION UNITS APPENDIX 4 – TRANSPORTATION COSTS, AS-IS APPENDIX 5 – TOTAL CYCLE TIME, AS-IS APPENDIX 6 – ON TIME DELIVERY, AS-IS APPENDIX 7 – TOTAL LOGISTICS COSTS, AS-IS APPENDIX 8 – WAREHOUSE COSTS AND ICC, RDC APPENDIX 9 – IMPORT COSTS, RDC APPENDIX 10 – EXPORT COSTS, RDC APPENDIX 11 – ORDER HANDLING COSTS, RDC APPENDIX 12 – TOTAL LOGISTICS COSTS, RDC

Introduction
1
1 INTRODUCTION This chapter will introduce the reader to the subject of distribution models and present reasons for ABB Singapore’s need to investigate if a centralized distribution model would be to prefer. This discussion leads to the purpose of the thesis and the exclusions. Finally the structure of the thesis is presented.
1.1 Problem background The need for having goods physically moved between the place where they are produced and the places where they are consumed, have rapidly increased during the last decade. The exchange process has become a cornerstone of economic activity, and channels of distribution develop when many exchanges take place between producers and consumers. (Lambert el al, 1999) The scope and role of logistics have changed over the years and more recently logistics has become more prominent and is recognised as a critical factor of competitive advantage, instead of having a supportive role to functional areas as marketing and production. The growing importance of logistics arises from companies going global to access new markets. (Sum et al, 2001) In today’s market, with rising oil prices, it has become important to continuously review the company’s logistics performance. A major concern for companies is to which extent a channel of distribution creates an efficient flow of products from producer to consumers. The manufacture’s objective is to obtain optimum performance of the vital functions in the channel of distribution; warehousing, transportation and physical handling. (Lambert et al, 1999) Due to the dynamic nature of business environment, companies must frequently evaluate and monitor the performance of their distributions channels. When performance goals are not met, other possible channel alternatives must be evaluated and changes must be implemented. Lambert et al (1999) claims that distribution channels are recognized as one of the least managed areas in companies.
1.2 Problem definition Suppose a customer is going to build an industrial project that needs a 24/7 support and continuity to avoid a plant down situation. The customer will try to estimate the cost of buying such a product, the reliability of the product and the availability of after sales support. In today’s environment it is no longer enough to evaluate the cost merely based on buying the quality product at the lowest cost. To ensure the running of the business there are far more to take in account, including faster delivery times and the availability of the products from the supplier. As the world’s largest automation supplier, ABB has built a value chain geared to the singular goal of achieving results for the customer. Every day more than 1,000,000 automation products are shipped meeting customers need for motion, measurement, power, protection control and optimization. Logistics plays an important part for ABB to gain a substantial competitive edge in the global market place. The company have to be close to customer location wherever it may be to give the assurance to the customer that they will always be there for them. If a customer is in need of their support ABB wants to be sure they can deliver the products at shortest time possible to meet their demands. ABB’s objective is to increase market shares in Asia Pacific and that can among others

Introduction
2
be achieved by improved logistics performance. To reach these objectives ABB has to focus on developing an efficient value chain, hence the importance of the distribution model in Asia Pacific. In today’s competitive market ABB also need to focus on stable service levels in order to keep their position and to expand. ABB have sales units in 12 countries in Asia Pacific and they keep their own stock to support the local requirements. The sales units are required to keep minimum stock of various products in the warehouses in order to lower the costs. But due to the request of short delivery times, long lead times from the manufacturers and the level of competitiveness of similar products available in the market, the sales units are struggling with their inventory levels. Every product that is stocked is at risk at becoming obsolete. When large quantities are stocked there is an increased risk for the material becoming of no use. Cost for shortage and delays occur when products can not be delivered to customer. Besides the actual cost of not being able to deliver, failing to maintain a stable service level can have the impact of loosing a customer. Thus, poor delivery performance implies that both existing and future customers are lost. Since ABB wants to expand its market share in Asia Pacific it is important that they always are able to deliver their products according to customer requirement. A decentralized distribution model, like the one ABB is having in Asia Pacific, can lead to increased cost and less efficiency performance of the sales units. One way to cut logistic costs and improve delivery performance can be to use a regional distribution centre. A centralized distribution model can lead to better delivery performance, better customer service and less inventory carrying and transportation cost. (Lambert et al, 1999) At this point ABB has not done a thorough evaluation of the costs and performance of the distribution model. Since ABB lacks a holistic view over the costs and performance, a study to investigate the current distribution model is needed.
1.3 Specifying the purpose The objective of this study is to understand how the different logistics costs affect ABB’s distribution model and to find the most optimum model to support the Asia Pacific region, in order to prevent a sub optimization. The study will give ABB a recommendation how the company should move forward and enhance its performance regarding their distribution model. The objective can be summarized in two major points
• To conduct a study for the current distribution model • To conduct a feasibility study to see if converting the decentralized model to a
centralized model with the needs of a regional distribution centre would be to prefer
The regional distribution centre will hereafter be referred to as RDC.
1.4 Exclusions The scope of the study will be limited to Low voltage products. The area of LV products covers four of Automation Technologies Automation Products (ATAP) business units.

Introduction
3
This study will include the distribution costs/performance from seven incoming factories sited in Europe to the costs/performance at seven sales units in Asia Pacific. For location of factories and sales units, see appendix 1. The sales units in Korea and Japan were formed in 2004 and are excluded from the study due to lack of data. The sales unit in New Zealand was formed in 2003 and sat up its local stock in 2004 and is excluded since the figures would be misleading. The sales units in China and Hong Kong are also excluded from this study due to the volume and growth of their business. Vietnam and Indonesia will become sales units in 2006. The definition for the total logistics costs in this study is illustrated in figure 1. As shown in the figure the inventory carrying cost and warehouse cost for the producers are excluded in this study. They are excluded since they are assumed not to differ significantly with a centralized distribution model and since the accurate cost for LV products shipped to Asia Pacific are difficult to obtain from the producers.
Figure 1. Exclusions.
1.5 Reading directives The structure of the report is to some extent similar to the authors work procedure. The disposition of the master’s thesis can be divided into three main parts, presented in figure 2.
Figure 2. The disposition of the report. The first three chapters of the report are connected since they provide the reader with the background of the problem, company and the course of action. The first part of the thesis is the base of the report. The second part of the thesis is the main part and includes the theoretical frame of reference, results from the empirical research and the analysis. All chapters in the thesis leads to the third part, conclusion. In the last chapter the reader will be provided with recommendations on how ABB should proceed to enhance its distribution model. All figures stated in this report is from full year 2004, if not otherwise is stated. All costs are expressed in USD. This report is printed in two versions, one official and one confidential. Figures and information of confidential nature will be replaced by an X in the official version.
Introduction
Method Company Info
Conclusion
Theory Empirical research
Analysis
1 2 3
PU
Warehouse/ICC
LABB
Warehouse/ICC Transportation Transportation

Research Methodology
4
2 RESEARCH METHODOLGY To ensure a high quality study, well-established and scientific methods have been used by the author. This chapter aims at giving the reader an understanding of the methods that have been applied and the course of action.
2.1 Research Alignment According to Lekvall & Wahlbin (2001) the alignment of a research must be adapted to the aim of the purpose. The purpose of a research can be classified into two directions; explanatory and descriptive. When using the explanatory approach the author studies a problem in order to explain the relationship between variables. In a descriptive study the researcher does not draw conclusions from the collected data, but only describes the material. The difference between an explanatory and descriptive study can be subtle, a descriptive study must to some extent provide explanation and vice versa. The purpose of this thesis is to conduct a study for the current distribution model and to conduct a feasibility study to see if converting the decentralised model to a centralised model would be to prefer. In order to fulfil this purpose logistics costs must be analyzed and distributed among the sales companies. This method requires detailed information regarding the cost drivers and underlying factors. In order to investigate the different logistics costs the author searched for relationship between different parameters affected by creating a distribution centre. The author also drew conclusions from the evaluation of the result of the sales companies. Therefore, both explanatory and descriptive alignment will be used jointly in this thesis.
2.2 Research Approach There are two ways, with several differences, of research approaches; quantitative and qualitative. The approach should be determined with regard to the purpose of the study. (Lekvall & Whalbin, 2001). In a qualitative approach the researcher collects, analyse and interpret data that is soft; i. e. can not easily be quantified and expressed in numbers. The researcher present plain text, in an order, that provides meaning of the studied problem. Quantitative data is expressed in terms of numbers and figures that are analyzed with mathematical and/or statistical methods. According to Lekvall & Whalbin (2001) most studies tend to be of qualitative nature, but exceptions exist. To fulfil the purpose of this study both qualitative and quantitative have been used. The result of the cost evaluation has a quantitative approach and is presented in hard data, numbers and figures, while qualitative studies was conducted to analyse the costs. A qualitative study was also necessary to understand how the different cost drivers are linked. Understanding how soft aspect like customer service will be affected also required a qualitative approach. This implies that the study has a quantitative approach with qualitative features.
2.3 Data Collection Methods When performing a study like this thesis, amounts of data can be collected. In order to screen the data it is important to distinguish between essential and non-essential data. Data can be collected and categorised in two different ways; primary and secondary data. Primary data consist of data the researcher gathers through observations, surveys

Research Methodology
5
and interviews. Secondary data, on the other hand, consists of data that has been collected in another context; it has been produced by someone else. Secondary data can be found, for example, in books, journals and on internet. It is important that the researcher understands that secondary data is collected with another purpose than the actual research. (Wiedersheim-Paul & Eriksson, 1999) The methods used to gather data should be carefully selected for each individual study. In order to fulfil this study, primary and secondary data are used jointly in this thesis. Primary data has been collected through interviews and surveys with employees at ABB Singapore, the sales units in Asia Pacific and European factories. Secondary data was found in libraries and on ABB’s internal web pages. Source of the information will be from past history data, full year 2004. The literature used in the theoretical frame of references was mainly found on LIBRIS, a national system for searching literature at libraries in Sweden. Articles and journals has been found by searching the databases Emerald and Elite using keywords such as “distribution model”, “logistics” and “performance measurement”.
2.4 Validity and Reliability Validity and reliability are important aspects since analysis based on incorrect data provides false conclusion and will mislead the reader. According to Lekvall & Whalbin (2001) it is important to reflect upon possible errors in the collected data in order to achieve a trustworthy study. Validity is whether the method of measurement actually measures what it is intend to measure. Validity can be divided into internal and external validity. The internal validity is how well the research results correspond to what is being studied. External validity concerns the ability to generalize from the results. (Wiedersheim-Paul & Eriksson, 1999) Reliability concerns whether the method of measurement gives a stabile and reliable result. For example, will the measure yield the same result if it was measured again? The study excludes lot quantity costs but that will affect the result of the model. A centralized distribution model will lower the lot quantity costs since discounts will be given when purchasing larger volumes. If the capital binding for the production units would be included in the study the total saving with a RDC would be less, due to the increased lead time with ocean shipments. The author has not taken into consideration costs for damage and humidity problems during ocean shipments. When closing the sales units’ warehouses they can have difficulties of finding usage of the space, which has not been taken into consideration by the author. Further, the author has not investigated how the procedure for invoicing will affect the model. It is assumed that the information gathered through books and articles is reliable and trustworthy. Data collected from internal web pages is also assumed to be up to date. To assure high validity and reliability regarding primary data, all data need to be defined to make them easy to compare. In order to minimize the errors and assure that the respondents interpreted the questions in the survey equally everyone received the same survey. To assure high validity and reliability the answers from the survey some of the answers have been verified with the help of information from similar surveys. The information given by the respondents have also been verified through telephone conferences.

Research Methodology
6
Respondents at ABB Singapore have also reviewed the report repeatedly during the study to ensure that the author have perceived the information correctly. Interviews and telephone conferences have been booked in advance so the respondent could dedicate time and to avoid stressful situations.
2.5 Course of Action The structure of this report is shaped in a manner that easily will communicate how the purpose is defined, approached and solved. The thesis assignment was to do research, analysis and present the final result in a written report within 20 weeks. Figure 3 outline the authors’ way of conduct.
Figure 3.The authors course of action. The purpose has been defined together with the mentor at Luleå University of Technology respectively ABB Singapore. The author approached the study by dividing the purpose into four phases, see figure 4.
Figure 4. The four phases.
Thorough literature studies have been conducted in order to outline the theoretical frame of references and to understand the first phase. With the theoretical frame of reference
Phase 2
Phase 3
Phase 4
Phase 1
What are the cost elements involved in distributing goods from factories to final consumption?
How is the current distribution model working and how effective is it?
How would a distribution model with a RDC work?
What is the most optimum cost / performance model of distributing goods?
Lite
ratu
re S
tudi
es
Model AS-IS
Model with a RDC
Model AS-IS
Model with a RDC
Qua
litat
ive
Em
piric
al
Res
earc
h Q
uant
ativ
e
Em
piric
al R
esea
rch
Con
clus
ion
Analysis
Writing the report

Research Methodology
7
in mind the author has done the empirical research. The theoretical frame of reference has continuously been used during the study in order to keep a discussion around the problem. Both phase two and three is found in the empirical research. The empirical research is based on input from the literature study, respondents at ABB and the surveys sent to the sales and production units. The second phase, how the current distribution model is working is mainly outlined from respondents at ABB and the survey. In phase three the author conducted a feasibility study for the need of a RDC and she identified the major costs involved to set-up and operate a RDC. The analysis has been conducted with the theoretical frame of reference and empirical research in mind and with consideration of the purpose. In the analysis the current cost structure is being reviewed and compared to the estimated cost of a centralised model. Alongside with reviewing the cost structure the author has also taken in consideration the performance of the distribution models. Finally, a recommendation of which model would be more effective and efficient to support the regional customers needs is given. The recommendation is based on the analysis of the two different distribution models and represents the fourth and final phase of the study. In order to ensemble a critical evaluation of the result the validity and reliability of the authors work is discussed at the end of the report. The author reflects over the study and points out several sources of error that eventually can have affected the result.

ABB Facts
8
3 ABB FACTS This chapter will introduce the reader to the ABB Group and ABB in Singapore. A brief background and explanation of the organisation in which this study is conducted will also be given.
3.1 ABB Group ABB is a leader in power and automation technologies that enable utility and industry customers to improve performances while lowering environmental impacts. The company’s goal is to “create value for all their stakeholders by meeting the needs of theirs customers, employees and the communities where they do business”.
3.1.1 Brief history ABB was formed 1988 as a merge from the Swedish company Asea and the Swiss company Brown Boveri et Cie, BBC. Asea was formed 1980 by a fusion of two Swedish companies and BBC was formed in 1891. In the beginning Asea was focusing on producing generators, transformers and motors while BBC's business idea was to manufacture generators. Until the fusion with Asea, steam turbines were the most important product for BBC. The fusion between Asea and BBC was introduced in 1987 but they didn’t merge until the turn of year 1987. After the merge the company had about 160,000 employees.
3.1.2 ABB today Today ABB operates in over 100 countries and they have about 102,000 employees. The revenues for 2004 were 20,721 MUSD. ABB Ltd shares are traded on the stock exchanges in New York, Stockholm, Frankfurt and London/Zurich. ABB’s head office is located in Zurich. During the time of this study the ABB group was divided into three divisions; automation technologies, power technologies and down stream business. ABB Power Technologies serves electric, gas and water utilities to as well industrial and commercial customers. ABB Automation Technologies delivers solutions for control, motion, protection and plant integration to process and utility industries. ABB Downstream business supplies process technologies and construction services to the oil and gas industries. Every division constitutes of different Business Areas (BA) and every business area consists of different business units (BU), for an organizational chart see figure 5. BU’s shall develop the different parts of the common product range of the BA with special focus on development, investments and production allocations but also on marketing support. The manufacturing facilities are organized under the BU’s. This study is performed under the division Automation Technologies and Business Area Automation Products (ATAP). Business units included in the study are Breakers & Switches, Control Products, Enclosures & DIN Rail Products and Wiring Accessories. The BU Low Voltage System is specialized towards system solutions and provides the whole Low Voltage range and mainly caters to projects.

ABB Facts
9
Figure 5.Organizational chart.
3.2 Automation Products The Business Area Automation Products employees about 27,000 people worldwide and have 110 manufacturing sites in 50 countries. The BA is the market leader in most of its business and during 2003 the sales reached 4.3 billion USD. ATAP serves customers with building blocks to improve plant performance, including motors, drives, instrumentation, low voltage devices and power electronics. Sales of ATAP Products and Systems via local ABB sales companies or channel partners cover over 100 countries of the world. For a figure of the BA’s transformation, see figure 6. ATAP is facing a logistic challenge since more than 1,000,000 products are shipped daily to end customers around the globe. The BA’s mission is to create exceptional growth
• without destroying price structures • with innovation in marketing and products • with strategic acquisitions
Figure 6. The transformation of ATAP over the last four years.
Drives, Motors and Power Electronics
Low Voltage products & Instruments
Low-Voltage
Instrumentation
Electrical Machines
Drives and Power Electronics
2003: Two BA’s in original AT division
2002: Four BA’s in two divisions
2004: One single BA in a simplified AT Division
Automation Products
Automation TechnologiesPower Technologies
ABB Group
Down Stream Business
ATMA ATAP ATPA
3 Business Areas
10 Business Units
3 Divisions
1. BU 3101 LV Systems 5. BU 3121 Wiring Accessories 9. BU 4130 Machines 2. BU 3106 Breakers& Switches 6. BU 3128 Instrumentation 10. BU 4141 LV Motors 3. BU 3111 Control Products 7. BU 4120 LV Drives 4. BU 3118 Enclosures & DIN Rail Products 8. BU 4128 PE & MV Drives

ABB Facts
10
3.3 ABB Singapore ABB Singapore is a part of the ABB group with its head office at Ayer Rajha Crescent in Singapore. The company was locally established 1971 and are currently having about 700 employees. They support the ABB group with the range of system and products within each industry and market. ABB Singapore is also the centre for engineering, products and spares distribution within the Asia Pacific Region. ABB Singapore have one feeder factory that manufactures Wiring Accessories, located in Jakarta.
3.3.1 Logistic Centre Asia Logistic Centre Asia (LCA) is located in Singapore and has been in operation for the past five years. Their responsibilities are to manage the distribution logistics for ABB products in the Asia Pacific region and to provide logistic support to the region. Their current services include among others order management, transportation planning and control and IT Infrastructure. LCA is also operating a regional distribution centre, located in Singapore, for LV Drives. The product lines that are being handled by LCA is LV Motors, Spare parts, Robots and AC Drives. LCA’s vision is “to be a world class logistic centre for ABB Products” and their mission is “to give ABB and her customers a competitive advantage by ensuring timely delivery of our products at the lowest possible cost”. For an organizational chart of LCA, see figure 7.
Figure 7. LCA Organization.
Logistics Manager (14)
Biz Development
Operations (11)
Customer Service (9)
Logitics IT (2)

ABB Facts
11
3.4 Low Voltage Products The Business Area ATAP cover the full range of Low Voltage Products, hereafter referred to as LV products. Belonging to the range of LV products are products with 1,000 voltages and below, for a picture of some of the products included in the LV product range, see figure 8.
Figure 8. A selection of the major production lines belonging to LV products. The products are foremost aimed at three different applications, industry, machine building and distribution. Products belonging to the different business units included in this study are illustrated in figure 9. Business Unit Product Line Production Unit Breakers & Switches Air Circuit Breaker (ACB) ITSCE 3105 Moulded Case Circuit Breaker ITSCE Load Break Switch FICON Fuse Switch FICON Enclosures and safety switch FICON Control Products Contactors FRENT/SECRL/DESTO 3111 (3108+3109) Soft starters SECRL Pilot devices SECRL Manual Motor Starters DESTO Relays, Sensors, Timer, PLC FRENT/DESTO Terminal block FRENT Electronic products DESTO Enclosures & DIN Rail Products Miniature Circuit Breakers (MCB) DESTO 3118 Residual Current Devices (RCD) DESTO/ITSCE Accessories DESTO MDRC DESTO/ITSCE EIB DESTO Consumer Unit ITSCE/IDIIM Distribution Board ITSCE Multi-purpose Enclosure ITSCE Busbar Assemblies IDIIM Electrical Energy Meters ITSCE/DESTO Surge Arrestors FRENT Wiring Accessories Electrical Wiring Accessories (EWA) SGIND 3121 Dimmers, Speed Controller DEBJE Infrared Control System DEBJE Industrial Plugs and Sockets DEBJE/CEWE Figure 9. Business units/Product lines/Production unit.

Theoretical Frame of Reference
12
4 THEORETICAL FRAME OF REFERENCE This chapter will provide the reader with a summary of the theoretical frame of reference that has been used while conducting this study.
4.1 The Total Cost Concept For a company the goal with the distribution model is to improve overall efficiency by reallocation functions, and therefore costs among its members. The level of customer service offered by the manufacturer, for example, will have a significant impact on other members in the distribution channel. A manufacturer whose product availability is poor and whose order cycle time is inconsistent may force wholesalers to carry more inventory as safety stock in order to keep an acceptable service level to end customers. Lambert et al (1999) stress the importance that customer service solely do not provide customer satisfaction since customer satisfaction represents the customers overall assements of all elements in the marketing mix (right product, at the right price, with proper promotion available at the right price). The additional values can be achieved through improvements in customer service. Customer service is the output of the logistics system. In order to achieve a set level of customer service a number of trade-offs must be evaluated in terms of their impact on service levels. This evaluation should be conducted with respect to the total cost model.
4.1.1 The Total Cost Model The total cost concept is a key to effectively reduce the total cost of logistics activities rather than focusing on minimising each activity in isolation. (Lambert et al, 1999) The total concept is important seeing logistics decision will affect different areas of the organisation. Attempt to reduce individual costs in one area may be offset by increased costs in other areas; a trade off situation, see figure 10. The figure implies that measures that increase the cost for one activity can be motivated if the total cost decreases. The Total Cost Model by Lambert et al (1999) presents five major logistics costs categories that are driven by a number of key logistics activities required to facilitate the flow of a product from the point of origin to the point of consumption. According to the authors the activities included in the cost model depends on the outline of the logistics organisation. In some situations some components of the model needs to be removed whereas in other situations further components need to be added. Apart from providing understanding how different areas could be affected by changes within the organisation, the total cost model provides a structure to identify activities that support the logistics process.
4.2 Customer Service Customer service represent the output of the logistics system, it is a measure of the effectiveness of the logistics system in creating time and place utility for a product, including after sales support. The level of customer service not only determines whether existing customers will remain customers, but also how many potential customers the company can attract. Thus, the customer service level a company provides has a direct impact on its market share; its total logistics cost and ultimately its profitability. (Lambert et al, 1999) The cost associated with customer service is the cost of lost sales, since

Theoretical Frame of Reference
13
measuring this cost is very difficult companies should strive to minimize the total cost of the other cost components at a given service level.
Figure 10. The Total Cost Model (Lambert et al, 1999) In most companies customer service is defined as a performance measurement such as the ability to ship 95 percent of the orders received within 48 hours. Customer service can be used to differentiate the product or influence the market price, if customers are willing to pay more for better service. Management should establish customer service levels after studying customers need. Industrial companies must identify potential users and determine how these consumers will make their purchase decision. (ibid.) Customer service is a complex subject and is usually measured in terms of
• level of product availability • speed and consistency of the customer’s order cycle • communication that takes place between seller and customer
4.2.1 Availability The most important measure of customer service is inventory availability within a specified order cycle time. Availability is usually expressed in terms of
• Number of items out of stock compared to the total number of items in inventory • Items shipped as a percentage of the number of items ordered • Number of orders shipped complete as a percentage of total orders received.
Place/ Customer
service
Order Processing
Cost
Transportation costs
Warehousing costs
Inventory carrying costs
Lot quantity costs
Product
Promotion
Price LO
GIS
TICS
MAR
KETIN
G

Theoretical Frame of Reference
14
4.2.2 Order cycle The order cycle is the time that elapses between the customer’s order placement and the time the product is received. The ability to consistently achieve the targeted order cycle time influences the amount of inventory held throughout the distribution channel. Most customers prefer consistent service to fast service, since the former allows them to plan inventory levels to a greater extent than is possible with a fast but highly variable order cycle.
4.3.2 Communication In order to achieve the increased demands of reliable customer service the information flow between supplier and customer has become a focus area for companies. Communication refers to the company’s ability to frequently supply information regarding such factors as order status, order tracking, back order status, order confirmation and product shortages etc. The use of automated information systems usually results in fewer errors in shipping, picking, labelling and documentation.
4.3 Distribution Activities and Costs Logistics activities generate costs that need to be considered while computing the total logistics cost. Activities and costs that will be described in this section are found in Lamberts total logistics cost model that is explained in section 4.1.
4.3.1 Warehousing Warehousing plays a vital role in providing a desired level of customer service at the lowest possible total cost. Warehousing is used for storing inventories during all phases in the logistics process (from raw materials to finished goods). Warehouses can be used to support manufacturing, to mix products from multiple producers to a single customer, to subdivide a larger shipment to many customers etcetera. Warehousing costs compromise costs that change with the number of warehouse facilities and include fixed cost such as rent, heat, personnel, depreciation in investments and necessary equipment. Costs such as labour have a fixed and a variable component, for example if the product flows in the warehouse increases additional labour might be needed. Most warehousing costs will not change with the level of inventory stocked but rather with the number of stocking locations. This implies that warehousing cost exist independently from the levels of inventory.
4.3.2 Inventories According to Lambert et al (1999) inventories represent the largest single investment in assets for most companies. During recent years most customers in the industry have been accustomed to high level of product availability resulting in higher inventory levels for companies. Because capital invested in inventories must compete with other investments opportunities inventory management has become very important. When determining the right inventory levels several conflicting aspects need to be evaluated. Full knowledge of the cost of different inventory levels and how to they will affect the total logistics cost and delivery service needs to be taken in consideration. The pros and cons of high respective low inventory levels must be considered and most important of all, the inventory levels must be in line with the company’s competitive strategy. High levels of inventories enable for fast delivery to customer and avoid stock

Theoretical Frame of Reference
15
outs and cost for loss sales, but it is often a costly option. As opposed to high inventory levels, the primary reason for keeping levels low is the capital invested in the goods, an opportunity cost on which a company forego the opportunity to invest the capital elsewhere. Inventory carrying costs (ICC) is the costs associated with the quantity of inventory stored, it includes a number of different cost components and generally represents one of the highest costs of logistics. (Lambert et al, 1999) Inventory carrying costs should include only those costs that vary with the quantity of inventories and is categorized into following groups
1. Capital costs. Holding inventories ties up capital that could be used for other types of investments. Consequently, the company’s opportunity cost of capital, the rate of return that could be realized from some other use of the money, should be used in order to reflect the true cost. The company must consider what rate of return it is sacrificing on the cash invested in inventory.
2. Inventory service costs. Inventory service costs consist of taxes and insurances
that emerge due to holding inventories. Insurances are used as a mean to avoid financial loss in case of an accident. In general taxes vary directly with inventory levels. Insurance rates are not strictly proportional with inventory levels since insurance is usually purchased to cover a certain value of product for a specified time.
3. Storage space costs. Storage space cost is the variable cost incurred due to e.g.
replenishing and dispatching from inventory, heating and renting.
4. Inventory risk costs. This cost varies from company to company but usually include costs for obsolesces, damage and shrinkage.
Inventory levels constantly vary depending on customer demand and how often they are replenished. Inventory turnover rate is a good measure of inventory performance, a high ratio is to prefer since it indicates that inventories move through the company quickly. (Lambert et al, 1999) Inventory Turnover Rate = Annual sales value [Times/year] [1] Average inventory value
The throughput time is also of interest when measuring inventory performance. The ratio expresses the time required for goods to move through a certain section. Throughput time = 365 [Days] [2]
Inventory turnover rate If a company is experiencing a low inventory turnover rate and long throughput time the ICC is high, for an illustration of the relationship between ICC and inventory turns, see figure 11.

Theoretical Frame of Reference
16
Figure 11. The relationship between ICC and inventory turns. (Lambert et al, 1999) 4.3.2.1 ABC Analysis The number of items held in inventory at a company is often very large, but management should pay extra attention and control on only a small percentage of the items. ABC analysis is the process of dividing items into three classes according to their dollar usage, management focus should be on the items with highest value. This method is equivalent of creating a Pareto chart. A items typically represent about 20 percent of the items but account for 80 percent of the dollar usage. Class B item account for 30 percent of the items but only account for 15 percent of the dollar usage. Finally, 50 percent of the items fall in class C, representing a mere 5 percent of the dollar usage. (Krajewski et al, 2002) The goal of ABC analysis is to identify inventory levels of class A items and enable management to control them tightly. Class A items should be able to be delivered with a short delivery time and have a high stock availability. Since inventory cost for class C items are lower, much looser control is appropriate. For class C items longer delivery times and a lower stock availability is motivated. (ibid)
4.3.3 Transport A product produced at one point has little value to the prospective customer unless it is moved to the point where it will be consumed, transportation achieves this movement. The movement creates place utility but transportation is also a factor in time utility since it determines how fast and consistently a product moves from one point to another. The activity of transporting goods drive the transportation cost and the cost vary depending on weights, volumes, distance and the point of origin and destination. Transportation costs for e.g. raw material with low value per tonnage can account for a large part of the total logistics costs. For other products, e.g. high tech equipment, with high value per tonnage, the transportation cost constitute only a small part of the total logistics cost. Cost associated with transportation can be identified in total and by segment, i.e. inbound, outbound, by mode, by customer etc. (Lambert et al, 1999) Nowadays most companies have outsourced the transportation services to a third part in order to focus on its core competence. Transportation cost and delivery service is closely connected and aiming for decreased transportation cost might imply a lowered delivery service. A lowered service level can eventually lead to increased cost incurred by larger safety stocks or loss of sales. According to Gunasekaran et al (2001) the cost
ICC
Inventory turns

Theoretical Frame of Reference
17
for transportation should be treated as a metric of high priority when trying to reduce the total delivery cost. 4.3.3.1 INCO Terms The INCO terms represent a set of international rules for interpretation of delivery terms used in trade contracts. Thus, uncertainties of different interpretations of such terms can be avoided. The INCO terms were established by the International Chamber of Commerce in 1953 and are regularly updated. The scope of the INCO terms is limited to matters relating to the rights and obligation of the parties with respect to the delivery of the goods. There are in total 13 INCO terms and they are grouped in four categories, see figure 12.
Applicable for sea transport only
Applicable for all modes of transport
Departure term EXW Shipment term, main carriage unpaid FAS / FOB FCA Shipment term, main carriage paid CFR / CIF CPT / CIP Delivery term DES / DEQ DAF / DDU / DDP
Figure 12. INCO terms. From EXW down to DDP the point of transfer in the transport moves from the sellers premises to the buyers place. For the first three groups the risk of loss or damage during transportation are with the buyer of the goods, whereas for the fourth group all risks up to delivery are with the seller of the goods. (P&O Nedlloyd, http://www.ponl.com)
4.3.4 Order Processing According to Lambert et al (1999) the order processing system is the nerve of the logistic system since it sets the logistic process in motion. The customer order cycle compromises all activities, and all time elapsed, from a customer’s placement of an order to the receipt of the product. The speed and quality of the information flows has a direct impact on cost and efficiency of the entire operation. The total order cycle time usually involves activities mentioned in figure 13. The order handling process is usually facilitated through an ERP system that is aimed at ease the interface between different departments involved in the order cycle. (Krajewski & Ritzman, 2002)
Figure 13. Total order cycle time from a customer’s perspective. (Lambert et al, 1999) Order processing costs include the cost of order transmittal, order entry, order processing and other related handling costs. The cost for the information system is also
1. Order placment 6. Order delivery 5. Order shipped
2. Order received
3.Order processed
4. Order completion

Theoretical Frame of Reference
18
included in this order processing costs. When establishing these costs, only those costs that will change with the decision being made should be included. (Lambert et al, 1999)
4.3.5 Lot Quantity Costs Lot quantity costs are production and purchasing related costs that will change as a result of a change in the logistics system. Production lot quantity cost usually includes production preparation costs and capacity costs due to changeover and materials handling. The lot quantity costs associated with purchasing are the costs of buying in various quantities.
4.4 Distribution A channel of distribution is defined as the collection of organization units, either internal or external to the manufacturer, which performs the function involved in product marketing. (Lambert et al, 1999) The marketing functions include for example buying, selling, transporting, storing, financing and bearing market risk. Any organizational unit that perform one or more of the marketing activities is a member of the channel of distribution. Some channel members perform single marketing functions, for example, forwarders transport products and warehouses store them. While other, such as wholesalers perform multiple activities. Channel structures affect the control over the performance of functions; the speed of delivery, communication and the cost of the operations. While a direct manufacturer-to-user channel gives management greater control over the performance distribution cost are generally higher than for other channels. It is necessary for companies using that channel structure to have substantial sales volumes or market concentrations. (ibid)
4.4.1 Intermediaries Marketing channels develop because intermediaries, for example distributors, can make the marketing process more efficient by reducing the number of market contacts, see figure 14. Intermediaries provide possession, time and place utility. They create possession utility through the process of exchange and provide time utility by holding inventory available for sale. Finally, they provide place utility by physically moving goods to the market. The assortment of goods and services held by a producer and the assortment demanded by the customer often differs, the intermediaries can provide the customers with a broader range of products from multiple producers.

Theoretical Frame of Reference
19
Figure 14. The number of market contacts with and without an intermediary. According to Lambert et al (1999) the use of an intermediary can reduce following costs
• Selling cost (fewer marker contacts are required) • Transportation cost (fewer but larger volume shipments) • Inventory carrying costs (if the intermediary takes ownership) • Storage costs • Order processing costs
4.4.2 Centralized Distribution Large scale benefits have during recent years lead to a centralization of distribution models and warehouses. By having only a few stock points at centralized locations the increase in volume gives greater prerequisite to develop efficient warehouse operations. Another type of large scale benefits is that less capital binding is needed to achieve a certain service level than in a decentralized distribution model. Mattson (2002) argues that a centralized structure leads to decreased cost and also increased customer service levels and he pinpoints at following
• Economies of scale. With fewer stock points the material flows will get larger at the centralized warehouse. The prerequisite to invest in efficient automated technology to handle the goods becomes greater and investments in automatic processes pay off faster. When handling all warehouse operations at the same place savings in for example personnel can be done.
Producer
Customer
Intermediary
13 market contacts
Producer
Customer
30 market contacts

Theoretical Frame of Reference
20
• The fewer stock points in the distribution model the less stock is required to maintain a certain service level. The relation between service level and stock size is illustrated in figure 15.
• Savings in learning. Fast introduction of new components and less scrapping
costs when replacing old articles. • Reduction of the bullwhip effect. The bullwhip effect is directly correlated to the
number of stocking points in the supply chain. Estimates indicate the bullwhip effect is amplified to the double for every level of warehouse.
• Reduced risk for material shortage and obsolete material. Wrong dimensions of
the stock is reduced and risk for shortage of material can be minimised, i.e. if a local stock can not supply its market (they do not have enough stock to satisfy the market demand) while another market is not in need of the product.
• The product flows through a centralized warehouse is much easier to control.
The safety stock can be decreased and thereby the cost of tied capital in inventory, since the demand from the customers is never 100 percent correlated.
• Decreased cost for transportation. The cost for transportation increase when
the number of stock points increases.
Figure 15. Service level and stock size. A decentralized distribution model is to prefer for products that require fast deliveries. It is also important for products that require after-sales services and for companies that need to be close to customer location. A low degree of centralization is to prefer when having high costs for transportation in relationship to the value of the product. However, the main reason for a multiple stock points is to be close to customer location and provide fast deliveries.
4.4.3 Product Characteristics The characteristics of the products are an important consideration when designing a channel of distribution. Factors that ought to be analysed are the products value; technicality; degree of market acceptance; degree of substitutability; the product’s bulk;
Service level
Stock size
100 %
Centrazlied distributionmodel
Decentrazlied distributionmodel

Theoretical Frame of Reference
21
degree of market concentration; seasonality and width and depth of the product line. The product’s value influences its inventory carrying cost and the desirability of premium transportation. High value products may be shipped by air freight to minimize in-transit inventories and inventory carrying costs can be reduced by holding inventories at a central location. (Lambert et al, 1999)
4.5 Measuring Logistics The aim by logistics is to improve delivery performance and at the same time reduce cost. In order to realise what type of improvements are feasible it is important to obtain insight and knowledge regarding the present situation in the company. (Aronsson et al, 2003). The first step to realise feasible improvements is to map the flows and costs within the company. Consequently the mapping should facilitate the development of performance measurement that can determine the company’s present performance. The actual mapping must be customized for every company according to how the information is structured and available within the company. More resources will be consumed when conducting a detailed mapping, hence it is important to only focus on the vital part necessary for the study. According to Tangen (2004), performance measurement is defined as the process of quantifying the efficiency and effectiveness of action. A performance measurement should be derived from the companies’ strategic objectives; otherwise the performance measurement may support activities that have opposite effect of those implied in the strategy. Further Tangen states that it is important to remember that strategies usually changes over a time and therefore the performance measurement should continuously be renewed. There is a need for flexibility in the performance measurement to ensure that they are coherent with the objectives of the company. Moreover, it is important that the performance measurement is appropriately balanced and is not solely conducted on a financial basis. The performance measurement system must consist of different types of measures that encompass all important aspects agreed as representing the success of the company. Since the performance measure influence the behavior of the employees it is important to have a proper set of measurements. According to Tangen (2004) it is not rare that an improvement in one area leads to deterioration in another and that can result in a decline in overall performances. A performance measurement must therefore guard against sub-optimization to ensure that employee behavior is consistent with corporate goals. It is also important to focus on a limited number of performances since more measurement demands more analysis and it is a waste of collected data if they are ignored. The resources to gather and analyze large number of data could offset the expected benefits. According to Chow (1994), logistics performance may be viewed as a part of the large notion of organizational performance. When measuring logistics performance, effectiveness and efficiency must be distinguished. Effectiveness can be defined “as the extent to which an objective has been achieved” while efficiency is defined as “the degree to which resources have been used economically”. That means that efficiency is “doing things right” while effectiveness is “doing the right thing”. Logistics is a broad area and the objective for management must be to find a set of measures that capture most of the performance dimensions considered to be important. The use of e.g. two

Theoretical Frame of Reference
22
measures of performance can be justified for researcher whose study only addresses customer satisfaction or cost efficiency.
4.5.1 Measuring distribution models The design of a company’s distribution channel is often a result of old decision that rarely is updated. Thus, Storhagen (1997) argues that the distribution channel should continuously be evaluated. When conducting the evaluation several aspects must be considered
• Volumes. Map the flows, in volumes, and calculate the future volumes based on the companies forecasts. How does the trend look like for delivery sizes, shipment frequencies etc?
• Product flow. Where are the present and future customers located? How many customer and stock points exist?
• Types of products. How many product variation exist and what character do they have; weight; volume etc?
• Cost. How large are the cost for transportation and warehousing? • Variation. How is the variation on flow; is it stable or depends on season? • Customer service. What is the level of service aimed at? What do the
customers need and what do competitors offer? Measuring distribution models performance is difficult since some aspects of channel performance may be difficult to quantify, making a unified index of performance difficult to achieve. One measure of channel performance is the extent to which the company’s target market is being satisfied, given the companies goals. Examples of measurement of distribution model effectiveness that consider customer satisfaction are
• is the product available in desired quantities? • is the product available when needed? • is the product delivered in time?
Companies should set objectives for the distribution model and then measure actual performance against planned performance. (Lambert et al, 1999)

Results from Empirical Research
23
5 RESULTS FROM EMPIRICAL RESEARCH This chapter will provide the reader with a summary of the theoretical frame of reference that has been used while conducting this study.
5.1 The sales organisation Every business area, in this case ATAP, consists of several sales units. ATAP have sales units located in 12 countries in Asia Pacific. Some of the sales units have been excluded in the study due to reasons stated in section 1.5. Outside Western Europe the sales organisation is split into six territories under the responsibilities of five territorial managers. Their main task is to manage, develop and expand the local BA products sales organisation in the territory. Further, their task is to ensure appropriate local know-how and resources to reach the targets sat by the management. The sales units are strategically located around Asia Pacific in order to be as close to customer location as possible. They are each individually shaped and equipped to supply a specific market with LV products. The function of the sales unit, apart from sales involves marketing, order placement and provide the customers with know-how and after sales support. The sales units differ in size depending on the size of the market they are covering, in Singapore the sales teams consist of 14 persons and they are specialised towards different segments. The sales units are also equipped with local warehouses in order to be able to reduce the time from order placement to despatch. The production units sell their products to the local sales units around the world, and the sales units then resell them to end customers. Hence, it is the sales units that are in contact with the end customers. For a schematic view over the sales organisation, see figure 16.
Figure 16. ABB’s sales organisation.
The sales unit in Singapore has both local and overseas end customers. The local end customers purchase all products that are being offered while the overseas end customers only purchase products from Wiring Accessories, since one of the feeder factories for the business unit is handled by the sales unit in Singapore (the factory is located in Jakarta). The definition of end customer in this study is an external non-ABB customer. As illustrated in the figure above end customer and end user is not necessary
Production U
nits
Sales Units
Distributors
Large OEM
Large panel builders
Industry; end users
OEM Panel builders

Results from Empirical Research
24
the same. Locally the sales units have sales to a few segments that will be explained below.
• Distributors. The distributors are important for ABB since they make it possible to offer a high availability of the products. Availability is important for the market of LV products and it would be difficult for ATAP to build this distribution network themselves.
• Channel partners. The largest customers together with the distributors.
• Panel builders. Panel builders assemble components into a system. The panel
builders often supply products to OEM customers. • Original Equipment Manufacturer, OEM. OEM customer use ABB’s products in
their own constructions, for example in elevators and robots. Long term deals are negotiated with the large OEM customers and they purchase ABB products for a lower price than purchasing from distributors.
• Internal customers. The sales unit in Singapore has internal customer that
purchase Wiring Accessories, as mentioned above. Some of ABB’s main competitors on the Asian market are Schneider Electric (Germany), Siemens (Germany), Soco Mec (France) and Mitsubishi (Japan). Most of the companies compete with ABB in different product ranges, but Schneider cover the same range of LV Products as ABB. In Singapore ABB has an estimate 10 percent market share, the major actor on the market is Schneider with almost a 50 percent market share. Regarding the price level ABB is considered a midrange option between Siemens and Schneider. Schneider is the cheapest offer and they are carrying a large inventory in Singapore and can therefore promise a faster delivery than ABB. According to the sales department in Singapore the price is most important for the customer closely followed by a fast delivery. The sales units report that all their major competitors are keeping regional stocking in the region. For overall market shares for LV products see figure 17.
Figure 17. Overall market share for LV Products 2003, please note that it is not only for the Asian market.
5.1.1 LV Products The Business Area ATAP consists of 10 business units of which four consists of LV products. The business units and their major production units are listed in figure 18. (For a list of product lines belonging to the business units, see section 3.4). One production unit can manufacture different products belonging to different business units.
SchneiderLegrand ABB Siemens GE
13.6%12.0%
9.0%9.0%
6.2%

Results from Empirical Research
25
LV products are considered being high tech electrical equipment and the value of the products differs depending on the product. LV products constitutes of several products line of different width. The demand during the year is stable and do not fluctuate. Business Unit Production Unit Breakers & Switches ITSCE FICON Control Products SECRL FRENT DESTO Enclosures & DIN Rail Products DESTO ITSCE FRENT SGIND (IDIIM) Wiring Accessories DEBJE SECRL (CEWE) SGIND
Figure 18. Business units and production units.
5.1.2 Customer Service The overall purpose of the supply process is to cost efficient produce and deliver LV products to customers in accordance with their requirements. ABB has to ensure that a high level of delivery performance is maintained and that favourable conditions for the distribution to customers are built. According to the ABB logistics handbook (an internal guideline aimed at assisting production and sales unit in logistics matters) the most important level of customer value is an increased connection between the sales units and the customers, that can be achieved by a jointly learning relationship process. ABB encourage their sales units to try to shorten order lead times and in stock-availability. They should always monitor feed back from customers and provide action when improvement is needed. It is also important for customers to be updated about information such as inventory status, expected delivery dates, back orders etc. The target for on time delivery to customers requested date for all ABB sales units is 96 percent. The aim for the production units is to have a 100 percent acknowledge on time delivery.
5.1.3 Warehouse The size of the warehouses and the product assortment the sales units are offering in the regions differs depending on the market they are present on. The warehouse for LV products in Singapore used to be outsourced to a third party, DHL, due to capacity limitations, but when the new office was built the warehouse function was taken back again. The sales units operate and own their local warehouse. Thus, the warehouse operations are not outsourced. According to the Logistic handbook, a proper analysis of the goods to be stored in the warehouse is necessary. For example fast moving inventory should be positioned in more accessible levels and FIFO (First In First Out) should always be respected in the storing system. The warehouse management needs also to be in contact with marketing, sales and manufacturing to determine the likely growth in number of line items and the expected growth in sales.
5.1.4 Inventories ATAP encourages the sales units to classify the products according to the Pareto principle (ABC analysis) in order to identify the few items that represent the most of their sales. The efforts in managing these items will help the sales units to control the majority of their inventories.

Results from Empirical Research
26
According to the Logistic handbook the setting of inventory control parameters requires
• Periodic inventory review. Inventories have to be reviewed at fixed time intervals to make it possible to identify slow-moving and obsolete products.
• Management of safety stock. The amount of inventory to be carried out depends on the lead times of the items and the defined safety stock. A reorder point is “demand over the lead time plus safety stock”, thus a longer order cycle requires a greater investment in inventory.
• Frequent system finetunning. The planning system parameters should be updated at least every month. Actual lead times should be used to ensure that reorder points and reorder quantities are correct.
Sales units are to analyse the stock per producer every quarter for slow moving products. Slow moving products are standard products with more than three months consumption in stock and not older than 12 months. Slow moving material should be sent back to the producer to get a credit note, price reduction for returned material should be 15% of original transfer price. No credit will be given for products older than 12 months. The definition for dead stock is items that have not been sold for more than 12 months. All sales units in Asia Pacific do not use ABC classification to monitor their stock levels. Last year the sales unit in Singapore and Australia did a thorough ABC classification of their stock with the assistance from LCA. Before this planning the sales units kept all items in stock and the ordering points were not determined by any statistical methods. LCA assisted the sales units to determine what items and in what quantities they should be stocked. The stock items were classified into four categories A, B, C and D. D items are considered being dead stock with sales 0-1 months during a year. C items are considered being slow moving stock with sales 2-3 months during a year. A and B items are considered being fast moving stock with sales of 8 and more respectively 4-7 months a year. Only items with a high turnaround should be kept in stock and therefore only A and B items ought to be in stock. After the ABC classification the warehouses in Singapore and Australia did a big “cleaning” and C and D items not older than one year was returned to the producers. The sales units should conduct this planning twice a year in order to update their stock levels. The stock levels in both Singapore and Australia have decreased since the planning was implemented. Some of the sales units, like Australia and India, stock products from a third party that are sold jointly with LV products. The sales units also keep other ABB products than LV products in stock.
5.1.5 Transport All production and sales units negotiate and co-ordinate their own transport solutions in order to obtain the best possible physical distribution of goods to their customers. The department that contracts the forwarders differ between the countries. In Singapore the Supply Chain team negotiate the contracts. ABB have global contracts with several of the major forwarders but local forwarders may be used for specific markets. Being cost effective is important but not at the cost of delivery performance. All transport solutions are outsourced to a third party and the aim is to build long and mutual relationships, where both ABB and the transport forwarder are working jointly to ensure

Results from Empirical Research
27
that the goods reached the customers in the right time, at the right place and in the right quantities. Shipments from the production units are generally sent by air, but ocean shipments are also used. The INCO terms that is being used differs depending on country and what terms have been negotiated. The most frequently used terms are DDU, CIF and for sea freight FOB. Shipments from the sales units to end customer is generally sent by air and land. In some cases products are being shipped from the production units direct to end customers in case of emergency, but this situation is trying to be avoided. Vietnam, currently handled by the sales unit in Singapore, always has direct shipments since freight cost and transit time will be lower. When the goods arrive by air to Singapore it has to stay in customs for maximum 24 hours, depending on when the flight arrives. If the flight arrives in the morning the goods is usually forwarded to ABB’s premises during the day. If the goods arrive by sea the customs usually takes about 2 - 3 days. If all documents are in order, which they usually are, the clearing process is fast. The transit time out of Singapore is the same as into the country, around 24 hours for air shipments. From the sales unit in Singapore goods destined for overseas customer are being consolidated in order to lower the freight costs.
5.1.6 Order handling The purpose of the order handling process is to register and confirm orders and supervise the orders until they are despatched. The activities required to be carried out, and the shape of the order handling process, varies depending on what market the sales unit is serving. Each market has its own legalisations and requirements, some more time consuming and complicated than others. It is therefore difficult to establish common routines applicable to all sales units. As a consequence it is difficult to provide an accurate schematic view over the order handling process and the process has therefore been simplified in this study. All sales units carry out all order handling locally without support from LCA. The order handling process in this study is based on interviews with the sales unit in Singapore. There exists no common tool to facilitate the sharing of information or to ease the order handling process between customers and the sales units in Singapore, all orders are placed via telephone, email or fax. After receiving the order customer service places a sales order in the ERP system SAP R/3. If the requested product is available in stock, customer service arrange for the items to be despatched at once. A picking slip will be issued to the warehouse that will facilitate the delivery of the goods to the customer. If there is no stock, or the stock needs replenishment, the order will be forward to the purchasing department. The purchaser then place an order in the ERP system and the order is sent by EDI to the feeder factories. Orders to the factories are sent several times a day depending on customers need, but the purchasing department tries to consolidate small orders. If a sales order contains products from 7 different factories the purchasing department have to split the order into 7 different purchase orders (P.O). The customer can also receive several order acknowledgements due to the splitting order process. The process of splitting the

Results from Empirical Research
28
orders implies that a small order can be as time consuming and generate the same amount of work, if not more, compared to a large order. When the goods arrives at the sales units premises the warehouse have to conduct a “goods receive” (G.R) where they physically check the goods and after customer service issue a “goods issue” (G.I) in SAP. Thereafter the invoice to the production unit will be forwarded to finance and an invoice to the customer will be issued. Due to the process of splitting the P.O’s several of the steps in the order cycle have to be duplicated. For a schematic figure of the order cycle, see figure 19. The figures in the brackets are the number of times the step may be duplicated.
Figure 19. The order cycle.
5.1.7 Measuring Logistics How the production and sales units measure their performances is individual. In order to establish a common ground for the sales and production unit to work jointly to achieve a better performance towards end customer, Partnership Performance Criteria (PPC) has been formed. PPC is “a mechanism to identify key internal service driven metric and improve performance”, it is a process to assess and improve the performance in the internal supply chain. The purpose of PPC is to monitor key performance criteria, provide a platform for logistic based discussion and to be a driver for performance improvement. Data is monthly collected both for the producers’ performance towards the sales units and the sales units’ performance towards end customer. The performance is then analysed and scored according to a scoring table. The score is based upon:
• Total Cycle Time. Measure how well the supplier confirms delivery times in accordance with previous agreements and commitments.
• On time delivery. Measures how the supplier manages to deliver on original confirmed date.
• Quality. Measure the number of defects products or components. • Ease of doing business. Measures how easy it is to work with the supplier.
PPC has been in operation for several years within ABB and was implemented in Asia Pacific in the beginning of 2005. So far only the sales units in Singapore and Australia are connected to the PPC database. The majority of the sales units are not yet reporting in the PPC database, hence the metrics above are not available in database for the time frame of this study (full year 2004). Therefore production and sales units have been requested to submit total cycle time and on time delivery information.
5.2 Total Cost Model The total cost model is based on information form surveys, sent to production and sales units during October 2005. The surveys can be found in appendix 2 and 3.
EC - Send Order
SU (SAP) - Create S.O (1) - Check stock - Create P.O (7)
SU - Goods receive (7) - Goods issue (7) - Payment to PU (7) - Verification (7) - Invoice EC (1)
PU

Results from Empirical Research
29
5.2.1 Flows ABB’s distribution model in Asia Pacific is today decentralized and the sales units have local warehouses in order to supply local demand. ABB’s distribution model for LV products in Asia Pacific has today 44 market contacts and the flows are illustrated in figure 20.
Figure 20. The distribution model, AS-IS. The total yearly volume of LV products shipped from the Europe factories to Asia Pacific is nearly X million kilos. The volume that is being shipped from production unit to sales unit is illustrated in table 1.
MY SG AU TH TW PH IN Total
DEBJE
DESTO
FICON
FRENT
ITSCE
NOCRL
SECRL
Total
Table 1. Volumes in kilograms. As noted in table 1, the largest sales units in terms of volume are India, Australia, Thailand and Singapore. The major exporters of LV products to Asia Pacific are ITSCE, DESTO and FRENT. The figure for the volume shipped to Taiwan from FICON could not be obtained since the products are shipped with the INCO term FCA. FICON were also selling their products direct to distributors in Australia until last year, hence the volume for 2004 is zero. The total sales for LV products to end customers in Asia Pacific were during 2004 X MUSD and the sales per country and BU is illustrated in table 2. The transfer price per
DEBJE
DESTO
FICON
ITSCE
NOCRL
SECRL
AU
IN
MY
PH
SG
TW
TH
FRENT

Results from Empirical Research
30
individual country is obtained by calculating the margin using the total sales for both production and sales units.
MY SG AU TH TW PH IN Total
Breakers & Switches
Control Products
Enclosures & DIN Rail Products
Wiring Accessories
Total Sales
Transfer price (TP)
Table 2. Total sales per BU and SU (USD). As expected the largest sales unit in terms of total sales is also India, Singapore, Australia and Thailand. Combined their sales constitute of 83 percent of the total sales in Asia Pacific, see figure 21. The largest business unit is Breaker & Switches with almost half of the sales while Wiring Accessories only have 6 percent of the total sales. The sales for Wiring Accessories is included in the sales for Enclosures & DIN Rail Products for Philippines due to a small volume.
Total Sales per SU
MYSGAUTHTWPHIN
Total Sales per BU
Breakers &Sw itches
Control Products
Enclosures & DINRail Products
WiringAccessories
Figure 21. Total Sales per SU and BU.
5.2.2 Warehouse Costs The warehouse cost in this study is the fixed cost for operating the local warehouses. The fixed costs cover such costs as rent, heat, personnel and necessary equipment. Variable costs such as extra labor are not included. Warehouse costs for each sales unit can be found in table 3.
MY SG AU TH TW PH IN Total
Total warehouse costs
Warehouse costs / TP 1.50% 1.29% 3.83% 2.85% 0.31% 0.91% 0.34% 1.72%
Warehouse space 327 1,600 7
300 170 240 750 3,394
Cost per square meter
Warehouse cost per kilo 0.37 0.54 0.85 0.60 0.05 0.25 0.09 0.45
Table 3. Warehouse costs per SU (USD).

Results from Empirical Research
31
The warehouse space for LV products in Australia is only 7 square meter but the warehouse is 9 meters high, therefore the high costs per square meter. If excluding the warehouse costs for Australia the average cost per square meter would be X USD. The total warehouse cost for all countries in percentage of the transfer price is 1.72 percent. Taiwan and India have the lowest warehouse costs while Australia has the highest.
5.2.3 Inventory Carrying Costs With respect to the definition of the total logistics cost in this study only the ICC for the sales units is included. Costs related to the inventories are illustrated in table 4. The ICC for the production units are assumed not to differ significantly with a centralized distribution model. As concluded in section 4.3.2 the ICC consists of 4 different costs.
1. Capital costs. The interest rate in this study is obtained from the controller in Singapore and the rate is for investments in USD. The same interest rate is used for all countries in the region.
2. Inventory service costs. This cost is assumed to be negligible since the insurance
is global for ABB.
3. Storage space costs. Storage space cost is the variable cost incurred due to e.g. replenishing and dispatching from inventory, heating and renting. This cost is assumed to be small and therefore negligible.
4. Inventory risk costs. This cost is defined as the inventory write off in this study
and include costs for obsolesces, damage and shrinkage with the major cost component being obsolete goods.
MY SG AU TH TW PH IN Total
Inventory value
Inventory value / TP 13.71% 10.82% 30.03% 10.53% 5.22% 14.88% 7.39% 13.73%
Inventory turnover 11 15 5 15 29 11 21 11
Throughput time 32 25 70 24 12 35 17 32
Inventory write off
Interest 4.38% 4.38% 4.38% 4.38% 4.38% 4.38% 4.38% 4.38%
Capital cost
ICC
ICC / TP 2.04% 2.46% 4.35% 1.07% 3.41% 9.22% 1.55% 2.65%
ICC / Inventory value 14.88% 22.77% 14.48% 10.16% 65.36% 61.96% 21.02% 19.31%
Table 4. ICC per SU (USD). According to the definitions above the ICC in this study constitute of capital costs and inventory risk costs. The highest ICC has Australia and Singapore, due to their high inventory levels and write offs. When looking at the quote between the ICC and inventory value Taiwan and Philippines have a very high percentage due to their large write offs compared to the inventory value. Philippines have a write off that constitute of more than half of the inventory value. The combined ICC in percentage to the transfer price is 2.65 percent.

Results from Empirical Research
32
The cost driver for the ICC is naturally the inventory levels and the write off. The combined inventory value for the sales units are over X MUSD. The inventory write off in Australia was during 2004 zero and the figure of X USD was not written off until the beginning of 2005. However the decision was approved in November 2004 and the figure is therefore used in this study. For other countries with no write off during 2004 the figure for provision for stock obsolescence based on the ABB Accounting and Reporting Guidelines policy is used. Included in these countries are Malaysia, Thailand and India. The A&RG policy gives every year each sales unit a provision to cover for stock obsolesces.
5.2.4 Transportation Costs The transportation cost for this study is defined as freight charges incurred from production unit to sales unit and for sales unit to end customer. The major cost component for this activity is the actual physical distribution of the goods, not the personnel costs for administrating the transport and contract freight forwarders. Hence, the cost driver for the transportation activity is the volume being shipped and the destination. Therefore the production and sales unit have been requested to submit the freight charges. The cost for the insurance of goods in transit is included. The majority of the production units use the INCO term DDU (Delivered Duty Unpaid). When shipping goods with DDU the production unit is responsible for most of the expenses to deliver the goods to the final destination (the sales units premises), excluding cost for taxes, duties and other official charges payable upon importation. For a complete list of INCO terms used, see appendix 4. All production units use air shipment to transport LV products to Asia Pacific but ITSCE also uses ocean shipment. Ocean freight from ITSCE is used to all sales units except for Philippines. The cost for ocean shipment is low and is included in the total transportation cost for ITSCE given in table 5. Detailed transportation costs can be found in appendix 4.
DEBJE DESTO FICON FRENT ITSCE NOCRL SECRL Total
Transportation Costs
Volume
Ave. cost per kg
TP (total sales)
Transp. Costs / TP 7.17% 3.44% 6.14% 7.56% 9.38% 1.47% 14.53% 7.30%
Table 5. Transportation costs per PU (USD).
The cost for transportation differs between the production units and depends much on the INCO term being used. For example NOCRL uses Ex-Works and FCA for several of the sales units and the total transportation cost is therefore small. Those INCO terms make the sales unit responsible for transportation to its own premises, hence the production unit does not have any freight charges. In order to calculate the average cost per kilo for NOCRL only the volume to Malaysia and Thailand is included since these countries receives shipment with the INCO term CPT. The total transportation costs in percentage of the transfer price for the production units in 7.30%. The sales units have been requested to submit their costs for tax & duties and clearance fee & handling charges. Since most production unit ship their products with DDU the

Results from Empirical Research
33
sales units must bear those costs. The local transportation cost for the sales units is for inbound transportation and for Singapore the outbound costs are included. The costs for the sales units are illustrated in table 6. Since Australia only could provide the information for total transportation costs (including taxes and duties and clearance fee and handling charges) 5 percent of the transfer price has been deducted from the total transportation costs in order to get the inbound transportation cost and costs for clearance fee and handling charges. 5 percent is the tariff Australia pays for LV products and the figure is obtained from APEC Tariff database for Australia by using the HS codes for LV products. The costs for clearance fee & handling charges are therefore included in the cost for inbound transportation for Australia.
MY SG AU TH TW PH IN Total Clearance fee & Handling Charges
Tax & Duties
Inbound transportation costs
Total transportation costs
Average cost per kg
Total transportation costs / TP 36.18% 1.80% 7.35% 19.85% 11.02% 8.73% 7.92% 4.30%
Table 6.Transportation costs per SU (USD). Malaysia reported negligible costs for clearance fee and handling charges and the cost for tax and duties in India is included in clearance fee and handling charges. Singapore does not pay tax and duties since the country has a waiver on import duties. The transportation costs for Breakers & Switches in India is considerably higher than the transportation costs for the other business units. The reason is according to India that they handle a large volume of Breakers & Switches that are heavy weight items. The total transportation cost for all countries in percentage of the transfer price is 4.30 percent. Tax and duties are not included in the total transportation costs since the cost is reflected in the price of the products toward end customer, hence it is not an ABB cost. Due to infrastructure limitations in SAP the total volume shipped from the sales units to end customer was not possible to obtain. When compiling the average costs per kilo it is assumed that the volume shipped from production unit to sales unit is the same as the volume shipped to end customer.
5.2.5 Order handling Costs According to the empirical research in section 4.3.4 the order handling activity compromise of all activities from receiving an order until it is despatched. The cost drivers for order handling are the costs that arise due to human resources, the number of orders being handled and the utilization of the ERP system. The cost for the ERP system is assumed to be a fixed cost and therefore the order handling costs in this study constitutes only of the cost for personnel administrating the orders. That is in line with Lambert el al (1999) argument that only costs that will change with the decision being made should be included.

Results from Empirical Research
34
With respect to the definition of the total logistics costs in this study the order handling process is only examined for the sales units. As illustrated in table 7 the administrative cost per order varies between the countries with India being the lowest with X USD per order and Thailand the highest with X USD per order. Please note that these costs are per order and not per order line. One order can constitute different number of order lines and the time spent on different orders varies greatly. The total order handling costs in percentage of the transfer price is 1.51%.
MY SG AU TH TW PH IN Total
Administrative costs
Adm. Costs / TP 0.82% 0.66% 2.30% 3.29% 2.75% 1.86% 0.54% 1.51%
Number of orders (S.O) 1,279 4,647 33,479 752 474 320 22,000 63,161
Table 7. Order handling costs per SU (USD).
5.2.6 Lot quantity Costs Since the definition of the total logistics costs in this study do not include the lot quantity costs for production (production preparation costs and capacity costs etc.) these costs are going to be neglected. The lot quantity cost that will be affected by a centralized distribution model is the costs of buying in various quantities. However, these costs will not be handled in this study.
5.2.7 Performance measurement The lead times from the production units have been requested to be submitted as the “Total Cycle Time, Ex-works”. It is the lead time from the order is received from the sales unit until the goods is ready for despatch. In order to comprehend the total cycle time from sales unit order until the goods arrive in the local warehouse, the production units have also submitted their transit times for forwarders. The transit time includes time at customs clearance. These two lead times add up to be the total cycle time by DDU, as illustrated in figure 22. The total cycle time Ex-works is the same for all countries since it includes only the order handling and manufacturing time at the production unit.
Figure 22. Definition lead times.
Order handling at SU Order handling and Production at PU
Customs Clearance Customs to SU
Transit Time of Forwarder
Total Cycle Time by DDU
Total Cycle Time, Ex-work
Total Cycle Time Customer to Customer

Results from Empirical Research
35
The average total cycle time from the production units by Ex-Works is 5.2 days and the average transit time for forwarders is also 5.2 days. According to the figure above the total cycle time by DDU is then 10.4 days. All total cycle times from production units can be found in appendix 5. Most of the information about total cycle time and on time delivery are estimated by the sales units due to lack of performance measurement. The figures are not to be seen as exact figures but only as indicators about the situation today. In this study the total cycle time (TCT) is divided into two categories, stock and non-stock items. Stock items are defined as items purchased and kept in the local warehouse for future use. For figures of the total cycle time, see table 8. The sales units have also been requested to submit the acceptable total cycle time and they are given in the brackets. The acceptable total cycle time are to reflect customer requirements for lead times in the local markets.
MY SG AU TH TW PH IN
Breakers & Switches 14 (7) 6 (5) 2 (1) 1.5 (2) 5 (5) 3 (-) 5 (5)
Control Products 14 (7) 6 (5) 2 (1) 1.5 (2) 5 (5) 3 (-) 5 (5)
Enclosures & DIN Rail Products 14 (7) 6 (5) 2 (1) 1.5 (2) 5 (5) 3 (-) 5 (5)
Wiring Accessories 14 (7) 6 (5) - 1.5 (2) 0 0 5 (5)
MY SG AU TH TW PH IN
Breakers & Switches 60 (30) 13 (5) 49 (20) 33 (21) 45 (30) 35 (25) 20 (15)
Control Products 60 (30) 4 (5) 21 (20) 41 (21) 30 (30) 35 (25) 25 (15)
Enclosures & DIN Rail Products 60 (30) 3 (5) 65 (20) 41 (21) 60 (30) 55 (25) 20 (10)
Wiring Accessories 60 (30) - 18 (20) 60 (21) 0 0 20 (15)
Average 60 6.7 38.3 43.8 45.0 41.7 21.3
Table 8. Total cycle time for stock items (above) and non-stock items (working days). The sales unit in Singapore has both local and overseas customer and the average transit time for forwarders is difficult to determine, the total cycle time is therefore calculated to be Ex-works (until the goods is ready for despatch). The on time delivery (OTD) for the sales units are only per customers requested date instead of per confirmed date. For this study the requested date is more of interest since it reflects how well the sales units can satisfy customer requirements. The production units have submitted their on time delivery both per requested and confirmed date. The on time delivery for ITSCE, DEBJE and NOCRL is for Ex-Works and does not include the reliability of the forwarders. The definition for on time delivery can be found in appendix 6, together with the raw data from the production and sales units. The on time delivery for DESTO is obtained from the PPC database and is based on the ranking from Singapore during April to October 2005. The on time delivery is illustrated in figure 23. The production units on time delivery for requested date are considerably lower than for the confirmed date. That is since the sales units, while placing the orders, do not always take into consideration the production units lead time to manufacture the products.

Results from Empirical Research
36
OTD Confirmed date
0%
20%
40%
60%
80%
100%
120%
AU MY IN TW PH TH SG
NOCRL
DESTO
DEBJE
FRENT
FICON
ITSCE (Breakers)
ITSCE (Enclosures)
SECRL
OTD requested date
0%
20%
40%
60%
80%
100%
120%
AU MY IN TW PH TH SG
NOCRL
DEBJE
FRENT
FICON
ITSCE (Breakers)
ITSCE (Enclosures)
SECRL
OTD SU
0%
20%
40%
60%
80%
100%
120%
MY SG AU TH TW PH IN
OTD requested dateOTD confirmed date
Figure 23. On time delivery for requested and confirmed date per PU (above) and SU.
5.2.8 Total Logistics Costs The total logistics cost according to the definition given in section 1.4 is X MUSD and constitutes of 17.47 percent of the transfer price. The total costs are presented in table 9 and the total logistics cost model can be found in appendix 7.
Total Costs % of TP SU 10.17% PU 7.30%
Logistics Costs 2004 17.47% Table 9. The total logistics costs for 2004 (USD). The total logistics costs for the distribution of LV products in Asia Pacific is almost one fifth of the transfer price. The distribution of the logistics costs for the sales units are illustrated in figure 24. The transportation costs or the ICC are the largest costs for all sales units. When observing the figure to the right where the inventory value is included, the inventory value constitute of a higher percentage of the total costs than the transportation cost. The inventory value are not to be included in the total logistics costs, it is illustrated in order to give the reader an understanding of the size of the value in comparison to the other logistics costs.

Results from Empirical Research
37
0%
20%
40%
60%
80%
100%
MY SG AU TH TW PH IN
Total Logistics Costs
Administrative costs
Transportation costs
ICC
Warehouse costs
0%10%20%30%40%50%60%70%80%90%
100%
MY SG AU TH TW PH IN
Total Logistics Costs (incl. Inventory value)
Administrative costs
Transportation costsInventory value
ICC
Warehouse costs
Figure 24.The distribution of the logistics costs per SU, with and without inventory value.
5.3 Regional Distribution Centre The location of the regional distribution centre in this study is Singapore and it is operated by Logistics Centre Asia, LCA.
5.3.1 Flows With the new distribution model all shipments from the production units are consolidated and sent to the regional distribution centre in Singapore. The regional distribution centre will hereafter be referred to as RDC. The replenishment for the warehouse in Singapore will be by incoming ocean shipments from all production units in Europe. Air shipment will also be used in urgent cases and for non-stock items. The products will be shipped by air from the RDC in order to shorten lead times. Large end customers such as distributors will receive direct shipments from the RDC. End customers will place their orders to the local sales units that will place an order to the RDC. The RDC will then execute the despatch to the sales units in Asia Pacific from the warehouse in Singapore and the sales units will then forward the goods to end customers within their market. LCA will be responsible for replenishment and monitoring the inventory levels. The number of market contact in the distribution model with a RDC will be 14, excluding the contacts for direct shipments, see figure 25.
Figure 25. The two different product flows with a RDC.
DEBJE
DESTO
FICON
FRENT
ITSCE
NOCRL
RDC - Australia - India - Malaysia - Philippines - Singapore - Taiwan - Thailand
SECRL
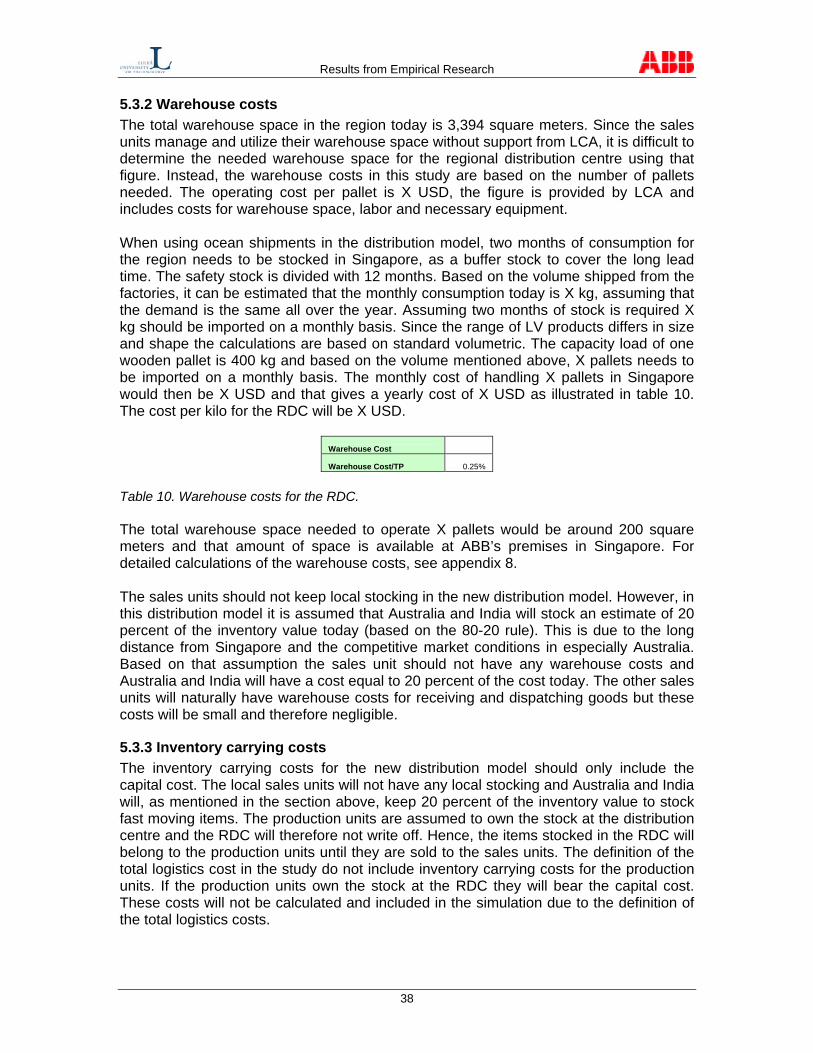
Results from Empirical Research
38
5.3.2 Warehouse costs The total warehouse space in the region today is 3,394 square meters. Since the sales units manage and utilize their warehouse space without support from LCA, it is difficult to determine the needed warehouse space for the regional distribution centre using that figure. Instead, the warehouse costs in this study are based on the number of pallets needed. The operating cost per pallet is X USD, the figure is provided by LCA and includes costs for warehouse space, labor and necessary equipment. When using ocean shipments in the distribution model, two months of consumption for the region needs to be stocked in Singapore, as a buffer stock to cover the long lead time. The safety stock is divided with 12 months. Based on the volume shipped from the factories, it can be estimated that the monthly consumption today is X kg, assuming that the demand is the same all over the year. Assuming two months of stock is required X kg should be imported on a monthly basis. Since the range of LV products differs in size and shape the calculations are based on standard volumetric. The capacity load of one wooden pallet is 400 kg and based on the volume mentioned above, X pallets needs to be imported on a monthly basis. The monthly cost of handling X pallets in Singapore would then be X USD and that gives a yearly cost of X USD as illustrated in table 10. The cost per kilo for the RDC will be X USD.
Warehouse Cost
Warehouse Cost/TP 0.25%
Table 10. Warehouse costs for the RDC. The total warehouse space needed to operate X pallets would be around 200 square meters and that amount of space is available at ABB’s premises in Singapore. For detailed calculations of the warehouse costs, see appendix 8. The sales units should not keep local stocking in the new distribution model. However, in this distribution model it is assumed that Australia and India will stock an estimate of 20 percent of the inventory value today (based on the 80-20 rule). This is due to the long distance from Singapore and the competitive market conditions in especially Australia. Based on that assumption the sales unit should not have any warehouse costs and Australia and India will have a cost equal to 20 percent of the cost today. The other sales units will naturally have warehouse costs for receiving and dispatching goods but these costs will be small and therefore negligible.
5.3.3 Inventory carrying costs The inventory carrying costs for the new distribution model should only include the capital cost. The local sales units will not have any local stocking and Australia and India will, as mentioned in the section above, keep 20 percent of the inventory value to stock fast moving items. The production units are assumed to own the stock at the distribution centre and the RDC will therefore not write off. Hence, the items stocked in the RDC will belong to the production units until they are sold to the sales units. The definition of the total logistics cost in the study do not include inventory carrying costs for the production units. If the production units own the stock at the RDC they will bear the capital cost. These costs will not be calculated and included in the simulation due to the definition of the total logistics costs.

Results from Empirical Research
39
The average inventory value in the RDC is based on the yearly consumption in the region and two months of buffer stock. The average inventory volume will then be X kg. That is equal to X USD based on the average value per kg that is imported today, see table 11. The same interest as used in evaluation of today’s model is used to calculate the capital cost, for detailed calculations see appendix 8.
RDC AU IN Total
Inventory value (USD)
Inventory write off -
Interest - 4.38% 4.38% 4.38%
Capital Cost -
ICC -
ICC / TP - 0.05% 0.02% 0.49%
Table 11. ICC for the new distribution model. The cost for inventories in transit will increase due to the longer lead time for ocean shipments. This is a cost that will be carried by the production units and is not included in the study.
5.3.4 Transportation costs As mentioned above the main mode of transportation in the distribution model will be by ocean freight. All costs for ocean freight from the production units to the RDC in Singapore are obtained from the department of supply chain. The monthly import volume being used in the calculations is the monthly consumption and two months of buffer stock for each production unit. All calculations for import are based on volumetric instead of weight, since the volume for LV products are more likely to be a restriction than the weight. Both 20 and 40 feet standard Full Container Loads (FCL) have been used in the calculations. All costs are calculated per FCL except for DEBJE whereas the small volume makes Less than Container Load (LCL) more beneficial. It is estimated that only 75 percent of the total container volume will be utilized. The import cost is based on monthly ocean shipments from the production units to Singapore and will be an estimate of X USD per year. All costs for ocean freight are by DDU and include pre-carriage costs such as transporting the items to the seaport and all handling charges at the port. They also include the main freight charges from port to port and finally on-carriage costs, such as handling and transportation costs form the port in Singapore to ABB’s premises. Detailed costs for ocean shipment can be found in appendix 9. The export costs from the RDC to the sales units are based on air shipments in order to enable faster lead times. The rates for air freight are obtained from LCA. The number of shipments used in the calculations per month is equal to the average number of shipments to sales units from production units during 2004. The total export cost is X USD. The cost is by DDU and includes all origin and destination charges and cost for transportation. For further details about export costs, see appendix 10.

Results from Empirical Research
40
In order to make the total logistics costs for 2004 and the new distribution model comparable the inbound transportation cost must be considered. The sales units will not have any costs for clearance fee and handling charges since the export from the RDC will be shipped by DDU. The total transportation costs for sales unit with the new distribution model are illustrated in table 12. The total transportation costs for Australia includes costs for clearance fee & handling charges since they could not be separated.
MY SG AU TH TW PH IN Total
Transportation costs
Transportation costs / TP 0.22% 0.15% 7.35% 0.37% 0.22% 0.55% 5.92% 3.09%
Table 12. Transportation costs for sales units (USD).
5.3.5 Order processing cost The administrative cost of handling order for the regional distribution centre is based as a percentage of the transfer price. The costs are an estimate of 2 percent of the transfer price and include all administrative costs such as handling incoming/outgoing shipments, sales orders and purchasing orders. Hence, the cost includes all operating cost for running the distribution centre and also the IT infrastructure. The figure is given by LCA. With a RDC the sales units do not have to perform some of the previous tasks of the order handling process. The number of times each step in the order handling process has to be duplicated is illustrated in figure 26. The figures in the brackets are the number of times each step has to be duplicated for one order.
Figure 26.The order handling process with a RDC. The main bottleneck in the process has been the splitting of orders into different production units and with a distribution model the sales units only have to place one purchase order to the RDC. The RDC have to perform several of the former tasks of the sales units. But, due to economy of scale the tasks do not have to be duplicated and orders sent to the production units can be consolidated. The order handling cost for the sales units are based on the time saving that occurs when several of the tasks do not have to be duplicated. The calculations are based on the time for an order with an average of five order lines and that gives a total cycle time of 42 minutes. That is only the effective time and do not include waiting time. All orders are also assumed to be correct. The calculation for savings in order handling for the sales units can be found in appendix 11. The total order handling cost will be X USD, equal to 1.45 percent of the transfer price. The total order processing cost is illustrated in table 13.
End Customer - Send P.O
Sales Unit - Goods receive (1) - Goods Issue (1) - Payment to PU (1) - Invoice to EC (1)
RDC
Sales Unit - Create S.O (1) - Create P.O (1)

Results from Empirical Research
41
Order handling costs at SU
Order handling cost / TP 1.45%
Table 13. Order processing cost for the RDC (USD).
5.3.6 Lot quantity costs As stated in section 5.2.6 the lot quantity costs will not be handled in this study.
5.3.7 Performance The new lead times are calculated based on same day despatch from the RDC and the time for order handling the sales units are estimated to be one day. So combined should the order handling at both sales unit and RDC and despatch be around two days, depending on when the orders arrive. The lead times for air shipments are by DDU and are based on actual lead times given by forwarders. The lead time for despatch and average transit time for forwarders to reach end customer from the sales unit’s location is estimated to be around two days. The total cycle time, from receiving customer order until arrival at customer location, is given in table 14. The long time for air shipment by DDU to India is due to their complicated customs procedure. The average lead time for direct distribution is 3.3 days and for non-direct distribution 5.0 days.
DIRECT DISTRIBUTION MY SG AU TH TW PH IN
Order handling at SU 1 1 1 1 1 1 1
Order handling/despatch/air by DDU 1 - 3 2 2 3 5
TCT 2 1 4 3 3 4 6
NON-DIRECT DISTRIBUTION MY SG AU TH TW PH IN
Order handling at SU 1 1 1 1 1 1 1
Order handling/despatch/air by DDU 1 - 3 2 2 3 5
Despatch at SU & transit time forwarder 2 - 2 2 2 2 2
TCT 4 1 6 5 5 6 8
Table 14. Total cycle time for stock items (working days). Non-stock items are to be sent from the production units direct to the sales units or end customers by air shipment. The average lead time from production unit to sales unit is today 10.5 days and the lead time for non-stock items is assumed to be the same. The total cycle time by DDU from production units to the RDC by ocean shipment will be about 26 working days.
5.3.8 Total logistics costs The total logistics cost for the new distribution model, according to the definition in section 1.4, is X MUSD and constitutes of 12.62 percent of the transfer price. Included in that figure are all costs for operation the RDC. The total costs are presented in table 15 and further details about the logistics costs can be found in appendix 12.

Results from Empirical Research
42
Total Costs % of TP SU 4.78% RDC 7.02% PU 0.82% Total Logistics Costs 12.62%
Table 15. The total logistics costs for the new distribution model (USD). The distribution of the logistics costs for the regional distribution centre and the sales units are illustrated in figure 27. As seen in the figure the costs for transportation is the highest cost component for both the regional distribution centre and the sales units. The regional distribution centre also has costs for order handling and operating the warehouse.
RDC Costs
4%
28%
68%
Warehouse Cost s
Order handling Cost s
Transport (Export )
SU Costs
1%
4%
65%
30%
ICC (Capital Cost)Warehouse CostsTransportat ion CostsOrder handling Costs
Table 27.The distribution of the logistics costs.

Analysis
43
6 ANALYSIS In this chapter the author will analyse and draw conclusions from the empirical results using the theoretical frame of reference. The result will be analysed based on the different logistics costs and then based on the distribution models performance. Many products equivalent to the LV range ABB is offering are today available in the Asian Pacific market by ABB’s competitors. Thus, it is important for ABB to determine its competitive priorities in order to increase their market shares and enhance its performance. ABB can compete for example by selling products at a low price, offer high availability or to have the best quality products. Both pricing and availability of the products are closely linked with the distribution channel. If the distribution channel is efficient then the products will be available in right quantities at the right time to customers. If the distribution channel is also cost efficient then the price of the products can be lowered. Lambert et al (1999) argues that a direct manufacturer to user channel gives the management a greater control over the performance but the logistics costs are generally higher. This would not apply for ABB since the RDC will be owned and operated by ABB and not outsourced. A centralized distribution model would instead give ABB a tighter control over the logistics costs and performance than today. The advantage of a decentralized distribution model is faster lead times since the products are closer to the customers. The model can also be to prefer for products that needs after sales support. But a centralized model will only remove the local stocking and not the market expertise, ABB will still be close to the customer and provide them with after-sales support and know-how at the sales units. The stock will be located further away from end customer with a RDC and therefore focus must be on shortening the total cycle time as much as possible. The number of market contacts will be reduced by the new distribution model by 30 and the model will be simplified. The number of market contacts for the sales units will also be lowered since the RDC will have direct distribution to major end customers.
6.1 Warehouse Costs According to Lambert et al (1999) the warehouse cost exists independently from the levels of inventory but will change with the number of stock locations. This will be the case for ABB since the number of warehouse locations will drop from 7 to only 3 locations (Singapore, Australia and India). When evaluating the warehouse costs it is difficult to look at the average cost per square metre since the warehouse space is managed differently, it is therefore better for ABB to look at the average cost per kilo. When studying that figure it can be concluded that the lowest costs for operating a warehouse is in Taiwan and India, while the most expensive country in the study is Australia. Even though Australia is the most expensive country it is still recommended that they keep a small stock of fast moving products in order to supply the local market. The costs for operating the warehouse in Australia will be considerably lower than the cost of losing a customer.

Analysis
44
The average cost per kilo for operating the warehouse in Singapore for LV products is today X USD while the average cost for the RDC will be X USD. This can be explained by economy of scale since the volume handled in Singapore will increase. When handling the total volume for the whole region at one place the prerequisites to invest in more efficient warehouse operations increases. The cost for operating the warehouse is based on historical data and is assumed to be realistic since the Logistic Centre in Singapore already runs a distribution centre for other product lines. The definition for the warehouse cost is the same for both models and is therefore comparable. The saving that can be done by reducing the number of warehouse locations is over X USD, equal to 1.55% of the transfer price. If the flows in the distribution channel will increase, ABB Singapore still have the warehouse space to cover for the extra volume, but the variable costs for personnel will increase. There is no need to outsource the warehouse function as long as the space is available at ABB’s premises and ABB can operate the warehouse at the lowest cost. However if ABB decides to centralize the distribution model it is recommended that they evaluate the possibility to outsource the warehouse operation. If the warehouse operation will be lowered by outsourcing the option should be considered. The study has not taken into consideration the costs that can occur if the sales units can not find new usage of the old warehouse space for LV products.
6.2 Inventory Carrying Costs According to Lambert et al (1999) inventories represent the single largest investment in assets for most companies and ABB is not different. Reducing the inventory levels can therefore lead to a saving for ABB. Customers that purchase LV products are accustomed to high product availability and that have resulted in high inventory levels for several of the sales units in Asia Pacific. But it is important to bear in mind that reducing the inventory levels can have the impact of reduced customer service. When ABB determines the inventory levels they must have knowledge of the costs of different inventory levels and how the levels will affect the total logistics costs and delivery service. High levels of inventories usually enable fast deliveries to customer and avoid stock outs, while low levels of inventories keep the capital cost low. Today most of ABB’s sales units have high inventory levels without offering a high service level. That is a costly option with both high ICC and costs for loss of sales. The performance of the distribution model will be discussed in section 6.6. Using a RDC will also decrease the risk for material shortage, obsolete material and wrong dimensions of the stock. Material shortage and a poor service level will have the impact of losing a customer. The costs for loss of sales is hard to compile but can be reduced by a centralized distribution model. ICC Lambert et al (1999) argues that ICC generally represents one of the highest costs of logistics and that is the case for ABB. If looking at the distribution of costs for the sales units ICC constitute of over one fourth of the total logistics costs (26 percent). This implies that lowering the inventory values will create a large saving for ABB. When looking at the new model the ICC is only 1 percent of the total logistics costs for the sales units, a saving of over X MUSD, equal to 2.58% of the transfer price. However the

Analysis
45
ICC for the production units will be higher with a centralized model since they are assumed to own the stock in the distribution centre. The ICC for inventories in transit will also increase due to the longer lead time with ocean shipments. However, these costs are not included in the study and are therefore not compared. The ICC is according to several researches at least 25 percent of the inventory value for most companies (Lambert et al, 1999). However, it is difficult to benchmark ABB’s performance since the ICC are compiled differently, in this study the cost for inventory service and storage costs are assumed to be negligible. These costs are assumed to be negligible since they are low and most of the sales units have a figure around 10 percent of the inventory value which is considerably less that 25 percent. ICC in relation to the inventory value is over 60 percent for both Taiwan and Philippines due to their large write off compared to the inventory value. Inventory value As noted in the empirical research Australia have the highest inventory levels of the sales units. One of the reasons is that Australia does not have any distributors and therefore have to carry all inventories in their local warehouse. Without distributors it is hard to create a high availability of ABB products on the market. With a RDC the lead time will be longer and same day deliveries, as the Australian market requires, will not be possible. Today the combined inventory value for the sales units are over X MUSD and using a model with a distribution centre the total value will be X MUSD. According to the logistics handbook all sales units should aim at having an inventory holding of not more than 5 percent of the transfer price. The majority of the sales units in Asia Pacific are far off that goal today with an average inventory holding of 13 percent of the transfer price, ranging from 5 percent in Taiwan to 30 percent in Australia. A centralized distribution model could lower that value since less inventory holdings are required to cover the demands in the region. Inventory performance In order to measure the inventory performance “inventory turnover rate” and “through put time” can be used. The inventory turnover rate indicates how quickly the inventories move through the company. In average the inventories moves 15 times a year for the sales units, ranging from 5 in Australia to 30 in Taiwan. The through put time express the time that is required for inventories to move through the warehouse. A high ratio for the inventory turnover rate is to prefer which indicates that the through put time is low. If the inventories moves 15 times a year, that gives a throughput time of 24 days. In reality the through put time is as high as 70 days for Australia and 35 respectively 32 days for Philippines and Malaysia. The inventory performance at ABB shows that there is a need for improvement. ABB’s sales units have low inventory turnover rate and long through put time and therefore the ICC is high, this is illustrated in Lambert et al figures in section 4.3.2. ABC analysis Today it is only Australia and Singapore that use ABC classification in an attempt to reduce the inventory levels. Australia started using the ABC classification last year and have reduced the inventory levels marginally and for Singapore the classification has lead to lowered inventory levels. Since the majority of the sales units are not actively working with ABC classification it can be assumed that all products stocked in the region

Analysis
46
are not needed. In the simulations the same volume that is being imported to the region today is used for the new distribution model and that is an exaggeration. In reality the volumes to cover the demands for the region will be smaller. With a RDC the inventory levels can be lowered by using ABC classification and the inventories will be managed more tightly than today leading to reduced capital costs. This is in line with Mattsons (2002) argument that fewer stock points in the distribution model require less stock to maintain a certain service level. Safety stock The simulation is based on two months of safety stock in Singapore. That is assumed to be realistic since the extra lead time to reach Singapore will be around 20 to 25 days, if the transportation mode will be shifted to ocean. The safety stock will cover the ups and downs in demand in the region and compensate for the longer lead time. The quantity of the safety stock must however be monitored and regularly updated based on the consumption in the region.
6.3 Transportation Costs According to Lambert et al (1999) the transportation costs for high tech electrical equipment, with a high value per tonnage, constitute of only a small part of the total logistics costs. LV products can be considered as high value product but the transportation cost is the largest component of the total logistics costs. The total transportation cost, for both sales units and production units, are 66 percent of the total logistics costs in today’s model. Since the transportation function constitutes of the highest cost it is important to put focus on savings in that area. As in most companies the transportation function is outsourced in ABB. Since the transportation activity and delivery service are closely linked, ABB must be careful not to lower the cost for transportation at a risk for of lower service. It does not matter if the production unit can produce and deliver the products on time, if the forwarder fails to deliver the products in time ABB will be responsible. A lowered service level will only lead to higher costs in terms of increased safety stock and loss of sales. However, shifting the transportation mode from air shipment to ocean shipment in the distribution model does not mean a lowered service level. Ocean shipments are a more beneficial transportation mode when it comes to savings but the distribution channel will be less flexible due to increased lead time. Import In the new distribution model all shipments from the factories are sent to the distribution centre in Singapore by ocean. Air shipment is the most expensive mode of transportation and shifting transportation mode will create a yearly saving of X MUSD for the production units. The total cost for transportation for the production units can be lowered from 7.30 percent to 0.82 percent of the transfer price. The total transportation cost, for both production and sales units, in today’s distribution model is X MUSD compared to X MUSD with a centralized model. That is a saving of X MUSD, equal to 3 percent of the transfer price. The costs for ocean shipments are based on monthly shipments from the European production units to Singapore. If ABB are to create a new distribution model the number of shipments per month must be further evaluated in order to optimize the model. The costs for ocean shipments will not differ significantly with more frequent shipments since

Analysis
47
the quantity per shipment will still be large. The production units are recommended to send all shipments by DDU. The costs occurred due to damage and humidity problems during ocean shipments have not been taken into consideration. Further, all products are not suitable for ocean shipments, i.e. high value products should be sent by air to minimise the capital binding. Export All exports from the distribution centre in Singapore will be by air freight in order to enable faster lead times towards end customer. Today the production units have limitations since they do not have daily shipments to the sales units, and these limitations will also restrict the RDC. The simulation for the export cost is based on the average number of shipments from the production units, and that implies that large volumes will be shipped with every shipment. It is therefore recommended that the RDC have more frequent shipments to the sales units. The service level to the sales units will increase but not impact on the freight charges since the volume per shipment will still be large. The destination charges will increase since that sum is per shipment. However, that cost will be negligible compared to increased service level ABB can provide its customers. It is recommended that all shipments will be sent by DDU. Direct shipments One of the services the RDC should offer is direct shipments to large end customers. Meaning that upon request from sales units or end customer the goods is delivered direct to end customer without using the sales units as an intermediate. It will benefit the sales units from a cost saving perspective since it minimizes the cost for local transportation, warehousing and handling costs. The cost for inbound transportation for the centralized distribution model is assumed to be the same as in the model today. But as argued above the costs will be lower due to the direct distribution. Direct distribution will also minimize the transit time and lower the lead time to end customer. The simulations for the centralized distribution model do not consider the cost for direct distribution to the sales units/end customers from the production units. Direct distribution by air should be used in urgent cases and for non-stock items that can not be shipped by ocean due to the long lead time. This is excluded in the study since the ration between stock and non-stock items is unknown.
6.4 Order Handling Costs The order cycle, or the total cycle time as it is referred to in this study, consist of all activities from customers’ placement of an order until the goods is received. It is important to focus on shorten the lead times for order handling in order to shorten the total cycle time. The average administrative cost per order is X USD. At the RDC the average cost per order would be X USD, see appendix 11. However, these costs are difficult to compare since the cost for the sales units only includes administrative costs in terms of personnel and not the ERP system and in the case of the RDC the figure is compiled using the total operational costs (including space, information systems, personnel etcetera). With a RDC the sales units do not have to duplicate several of the tasks included in the order handling process and the potential savings in the order handling costs is based on

Analysis
48
that. The calculated saving is the least amount that will be saved. In reality the saving will be much larger since all orders are not correct and the waiting time is excluded. The calculations are also based on correct orders and in reality most orders are not correct and needs human interference. The saving that can be made with a centralized distribution model is X USD, equal to 0.06 percent of the transfer price. The procedure for invoicing is excluded in the study. The regulations for invoicing in different countries vary and therefore it may not be possible for the RDC to handle the invoicing. New IT infrastructure With the centralized distribution model end customers will place an order at the sales units who will register and forward the orders to the RDC. This is a time consuming process with potential for improvements. One way to handle the disadvantage of longer lead times to end customer from the RDC can be to invest in new IT infrastructure or use existing technologies as parts online. With new IT infrastructure large end customers will place their orders direct to the distribution centre. If these customers also receive direct shipments the total cycle time can be reduced further. Thus, ABB’s end customers will receive better service and shorter lead times than today. If using new IT infrastructure the cost for order handling at the sales units will also decrease significant. Some of ABB’s customers will suffer longer lead times with a centralized model since it will not be cost efficient with direct distribution and new IT infrastructure for all customers. However, offering the same service level for all customers is a costly option and the balance between costs and service level for different customer is a decision ABB has to make. It is recommended that ABB in first place focus on a high stable service level for the vital few customers. Lambert et al (1999) argues that the speed and quality of the information flow has a direct impact on cost and efficiency of the entire process. Investing in new IT infrastructure will not just ease the interface between ABB and its customers it will also improve the quality of the information flow. ABB must be able to supply reliable information regarding order status, order tracking and order conformation and so on. An automated information system also usually results in fewer errors in the order process.
6.5 Lot Quantity Costs The lot quantity costs have not been investigated in this study but will be affected by a centralized model. As stated in section 5.2.6 it is the cost of purchasing in various quantities that will be affected. At the RDC orders sent to the production units can be consolidated and larger quantities can be purchased. One of the benefits with a RDC is that larger quantities will be purchased at discounted prices and that will be reflected in the price towards end customer. The minimum order quantities some of the production units have are the order quantities where the sales units will experience a discount. Buying products in a lower quantity is possible but will be more costly. When these minimum order quantities are far in excess of the sales units demand, they have to buy the products at a higher price and that will affect the price level towards end customer.

Analysis
49
6.6 Performance There are some issues with reliability of the performance measurement in the study and the figures for lead time and on time delivery from the sales units have in several cases been estimated. Therefore it is important not to see them as exact figures. However, this is not the case for all sales units and since Australia and Singapore is reporting in the PPC database their figures are assumed to be accurate. The figures for total cycle time and on time delivery is something the sales units ought to measure frequently. If the sales units are not aware of their actual lead times and on time delivery, it will be difficult for them to make a serious commitment to their customers. These figures should be measured on a frequent basis and there should not be any need for estimation. On time delivery It is always an issue on how to measure how well the end customers are being satisfied, one thing to look at is the on time delivery for requested date. The performance measurement takes into consideration if the right products are available in right quantities when requested by customer. The end customer must always be in focus since they are the reason for the supply chains existence. End customer do not care why ABB can not deliver (i.e. the production are suffering from delays, or the material is not available in stock) and that makes the on time delivery for customers requested date an important key performance indicator. The level of on time delivery from the production units has a significant impact on the level of performance for the sales units. If a production unit has a poor performance then the sales units must carry extra safety stock to maintain its service level towards end customer. The production units have an average on time delivery of 85 percent for confirmed date and 56 percent for requested date. And then the sales units have an average on time delivery of 84 percent for stock items and 71 percent for non-stock items. When observing the chart for the on time delivery for the production units the majority have a high on time delivery, especially for confirmed date. As mentioned in section 5.2.7 the on time delivery for several of the production units are per Ex-Works and do not include the reliability of the forwarders. That makes it difficult to compare and analyse the figures since they are not equal. However, assuming the confirmed date corresponds to the actual lead time to manufacture the products then it would be easy for the sales units to plan the replenishment of their stock. This is since the lead times to manufacture the products are known to the sales units. This is not the case for ABB today where the sales units struggle with high inventory levels and it is difficult to determine where the problem lies, at the production or sales units end. It is important for ABB to decide the level of customer service since it will determine not only if existing customer will remain customers but also how many potential customer they can attract. According to the logistic handbook for the division ATAP the sales units should aim at having a 96 percent on time delivery for requested date. The sales units in Asia Pacific are far away from reaching that goal today and the performance towards end customer can be enhanced by a RDC. The production units should have an on time delivery of 100 percent for confirmed date according to the handbook, also a goal they are far away from. Total cycle time The total cycle time for stock items is the same for all business units as expected, since all items should already be in stock ready for despatch. The total cycle time for non-

Analysis
50
stock items differ between the business units due to different lead times for manufacturing. It is hard to generalize the manufacturing times since the LV range is wide and constitute of so many different products. The sales units have also submitted the acceptable total cycle time for stock items and it was only Australia and Thailand that replied that their customers are expecting same or next day despatch. The other sales units replied that around 5 working days would be acceptable for their customers. If this is the case then the total cycle time with a RDC would be fully acceptable by the customers. The average total cycle time would then be 3.3 working days with direct distribution and 5.0 working days for non-direct distribution. It is only Australia, Thailand and Philippines that today have a total cycle time of less than 5 working days. This shows that the total cycle time with a RDC would not increase the lead times significant from today. Even though the RDC would not lower the performance of the distribution today, ABB should continuously strive to minimise the total cycle time and the RDC should aim at same day despatch. Today the total cycle time by DDU from the production units is an average of 10.4 days, according to the information given by the manufactures. The production units should according to the logistics handbook strive for a total cycle time of 2-8 working days. The figure for the total cycle time for non stock items is an average of 36.7 working days according to the sales units. These two figures should in reality be more close to each other, unless the sales units take a very long time to process end customers orders and forward the goods to end customers. The definition for the total cycle time by DDU for the production units excludes order handling at the sales units and the time to forward the goods from the sales unit to end customer (only in the cases when direct distribution is not used). Reduced lead times can cut down costs for inventories for both sales and production units. One example for that is when Australia purchased one product from ITSCE that is only shipped by ocean and in full container loads (FCL). The lead time for Australia was in this case 9 months and that forced them to have a high stock level. The benefit with a RDC is that the production units can consolidate their shipments and at the same time increase the frequency of shipments. Key performance Indicators The problem for ABB is not the lack of performance measurement since the PPC database is available, the problem is to make the sales units participate and frequently measure its performance. The benefits with the PPC are that the different performance measurements are coherent with ABB’s strategic objectives and they are unified for all production and sales units. That makes the figures comprisable and easy to use for internal benchmarking in order to learn from the best. The PPC database measures non financial performance such as total cycle time, on time delivery, quality and ease of doing business. It is recommended that all sales units start reporting in the PPC database in order to visualize the performance. It would be interesting to further investigate the level of customer service ABB is offering today. How high product availability is ABB offering, how often do the sales units have stock outs, what are the order fulfilment rate?

Analysis
51
6.7 Regional Distribution Centre The location of the RDC in this study is in Singapore. Singapore would be a good location since they today operate a distribution centre for other product lines. Hence, the expertise is already available. Singapore also has a favourable working climate for distribution with efficient infrastructure and customs and the country also has a waiver of import duties on re-export. However, the operational costs can be more expensive than in other Asian countries. To start at once with a distribution centre for all LV products would be a big operation. It is therefore recommended that ABB start with a few product lines. When the distribution model is well established and the pilot project is working properly, ABB should continue in a larger scale and embark on other product lines. In order to find a suitable pilot project ABB must decide in what areas they want to compete with high product availability on the Asian market. The focus must be in the interest of the customer and it is therefore better to operate the RDC per product line and not per business unit or production unit. It is not important for the customer if the product availability is per manufacturer or per business unit. Since a business unit consist of different product lines it is recommended that ABB start the implementation with a product line belonging to one production unit. The product lines that are chosen should also have a substantial volume in order to benefit from savings due to economy of scale.

Conclusions
52
7 CONCLUSIONS This chapter will present a comparison of the two total logistics costs and give ABB a recommendation on how they should proceed in order to enhance the distribution model. Finally the author will give a critical viewpoint of the thesis.
7.1 Total Logistics Costs The total cost model is as explained in the theoretical frame of reference a model whereas the different logistics costs are evaluated in order to optimize the output of the logistics system, the customer service. The combined saving for sales and production units will be X MUSD with a centralized distribution model. The total operating costs for the RDC will be X MUSD and the total saving with the new distribution model is then X MUSD. This is equal to a saving of 4.86 percent of the transfer price, from 17.47 to 12.61 percent. Hence, the total costs for the centralized distribution model is lower even tough new costs have emerged due to the RDC. Attempt to reduce individual costs in one may be offset by increased costs in other areas: a trade off situation. Increased cost in one area can be motivated if the total costs decreases. In the case for ABB a centralized distribution model will reduce the costs in all areas, as illustrated in table 23. Hence, a centralized distribution model will decrease costs and increase the service level for ABB. As shown in table 23 the total logistics costs can be reduced by almost 28 percent using a distribution centre. 2004 New Model Saving USD Saving % Saving of TP SALES UNITS Warehouse Costs 90% -1.55% Transportation Costs 28% -1.21% Inventory Carrying Cost 97% -2.58% Order handling Costs 3.5% -0.06% Total 53% -5.39% RDC Warehouse Costs +0.25% Operation Costs +2.0% Transportation Costs +4.77% Total +7.02% PRODUCTION UNITS Transportation Costs 88.8% -6.48% TOTAL LOGISTICS COSTS 27.8% -4.86% Table 23. Savings with a RDC (USD). Researchers from Accenture have conducted a study of the total logistics costs in different areas. The study showed that an average company in the semiconductor industry have a total cost of 10.4 percent of their sales while the best in class have cost of 5.80 percent. With today’s distribution model ABB have a total cost of 11.1 percent which makes ABB an average company. With a centralized distribution model the total logistics costs will be lowered to 7.9 percent of total sales. That is still not a best in class result but when the new distribution model is well established the costs could be lowered

Conclusions
53
further. It is hard to benchmark data like the total logistics costs since the costs may be compiled differently. The service level of the study mentioned above is also not given. Since the total logistics costs for ABB’s distribution model for LV products is close to one fifth of the transfer price there is potential for savings by improved logistics. One way to lower the logistics costs is by using a centralized distribution model, as this study has shown. Figure 28 illustrates the benefits and disadvantages for ABB by having a RDC in Singapore. BENEFITS
• better control over logistics costs and performance than today • less inventories are required to support the region • decreased risk for material shortage, obsolete material and wrong dimensions of the
stock • costs for warehouse, inventories, transportation and order handling will be lowered for the
sales units • transportation costs for the production units will be lowered • direct distribution from the RDC will minimize transit time and lower lead time to end
customer • direct distribution will also lower the costs for handling, warehouse and transportation for
the sales units • the RDC can consolidate orders and purchase larger quantities at a discounted price • Singapore has a waiver of import duties for re-export
DISADVANTAGES
• longer distance to end customers and therefore longer lead times • if using ocean shipment the ICC will increase for the production units due to longer lead
times • the distribution model will be less flexible due to the longer lead time when using ocean
shipment
Figure 28. Benefits and disadvantages by having a RDC. If ABB do not realise the RDC they must focus on the sales units’ logistics performance. As the situation is today logistics is not a priority area and that must change since large savings can be done by improved logistics. With a centralized distribution model a potential saving of X MUSD can be made and the saving will probably be even large in reality. It is difficult to compare the costs for the two different models but it is clear that the costs and efficiency of the distribution model will be enhanced by a RDC. It is therefore my conclusion that ABB should centralize the distribution model for LV products.
7.2 Recommendations • The RDC should start in a small scale with a pilot project in order to establish the
distribution model. When the model is working well they should embark on other product lines. ABB must also investigate what product lines would be suitable for a pilot project. In order to find a suitable pilot project ABB must decide in what areas they want to compete with high product availability in the Asian market.

Conclusions
54
• ABB should continuously strive to minimise the total cycle time and the RDC should aim at same day despatch.
• It is recommended that all sales units start reporting in the PPC database in
order to visualize their performance. Total cycle time and on time delivery should be measured frequently so the sales units can make a serious commitment to its customers.
• One of the services the RDC should offer is direct shipments to the largest end
customers. It will benefit the sales units from a cost saving perspective since it minimises the cost for local transportation, warehousing and handling costs. Direct distribution will also minimise the transit time and lower lead time to customer.
• It is recommended that the transportation mode for import will be shifted from air
to ocean in order to minimise costs. All shipments should be sent by DDU. All export should be sent by air to enable a fast delivery. The number of shipments per month, both for import and export, must be further evaluated to optimize the model. It is recommended that the RDC have more frequent shipments than in the simulation in order to increase the service level.
• India and Australia ought to have a small stock of fast moving items in order to
supply the local market. This is due to the competitive market and distance to Singapore.
• Third party products should be stored and purchased by the sales units since
they are for local demand.
• An issue that needs further investigation is the ownership of the stock. In this study the production units are assumed to own the stock, but further investigations needs to be conducted to see if that is the most optimum alternative.
• If the RDC will be in a large scale and cover the full range of LV products, ABB
are recommended to invest in new IT infrastructure or use existing technology. With new IT infrastructure large end customers will place their orders direct to the distribution centre and if these customers also receive direct shipments the total cycle time can be reduced further. Thus, ABB’s end customers will receive better service and shorter lead times than today. Investing in new IT infrastructure will not just ease the interface between ABB and its customers it will also improve the quality of the information flow.
• If ABB decides to centralize the distribution model further studies needs to be
conducted in order to determine how the distribution model will be operated.
• If ABB decides to continue with a decentralized distribution model, focus must be on the sales units’ logistics performance. The sales units must take part in the PPC reporting. They must also work according to the guidelines for inventory management, as described in the logistics handbook, in order to come to terms

Conclusions
55
with their high inventory levels. For example they must actively work with ABC analysis and review the inventories to identify slow moving and obsolete material. A summary of the guidelines can be found in section 5.1.4.
• ABB should continuously strive to improve its logistics performance and manage
the trade-offs between customer service and logistics costs.
7.3 Critical Viewpoint While conducting this study it was important to structure the amount of information, in particular the surveys, based on how the information is available in ABB. Using the total cost model, in order to evaluate the total logistics costs, was useful since it helped me to structure and identify the different activities and costs. All production and sales units were approached at the same time. It would have been to prefer that all units were approached one at a time in order to personally assist them in finding the different logistics costs/performance. However, due to time constraint that task was not possible. To make sure that all units would give their utmost support in responding to the survey the study was initially presented by the management team. The survey was divided per business units and it would have been better to split it per product line in order to find the most optimum line for a possible pilot project. But the costs per product line would be too hard to obtain from the units and the study would then not yield the same accuracy as today. It was difficult to obtain reliable information for the performance part of this study, most of the information is estimated and may not reflect the true performance of the distribution model. The result would have been more realistic if I would have been given raw data for lead times and on time delivery and compiled the figures myself. This was the case for some of the countries. However, that task would be time consuming in comparison of the winning. If the sales units would have participated in the PPC the study would have been easier to conduct and more reliable. Unfortunately, due to time constraint, the performance of the distribution model could not be investigated further. The problem with the data collection was further amplified due to different accounting cultures within ABB. The figures for costs and performance are not to be seen as exact figures, only as indications as the situation is today. In many cases it can be a best case scenario. All figures have been provided by production and sales units and they have been verified by telephone conversations and emails. Both cost models have been verified by LCA as being realistic. Therefore, I conclude that the study has a high validity and reliability enough to serve the purpose. The strength with this study is that evaluation of the distribution model is not just conducted on a cost basis, but also from a performance perspective. The issues costs versus performance are closely related and the ration between them must carefully be considered. The comparison of two different logistics costs is only valuable if the same delivery service is obtained. During the study I have strived to be objective but I acknowledge that there is a risk that my own values have been included in the thesis. However, the author has no personal interest in the conclusion of the study and she has no interest in guiding ABB in any

Conclusions
56
direction. That increases the credibility of the study. The results have been confirmed by the findings in the literature studies and that gives a high credibility in the conclusions. I have during the study consistently aimed at tracing costs thoroughly to provide a sufficient enough cost model that will fulfil the purpose. In order to determine whether the data is sufficient enough I have looked at the purpose and its context. The objective is to perform a study for the current distribution model and to see if converting the distribution model would be beneficial. This implies that the study will be at a high aggregated level in order for the management team to make a decision on how ABB should move forward. So, in the context of this study I consider the cost model accurate enough and I believe that the conclusions fulfil the purpose. The result can be used as a basis for decision making about the enhancement in the distribution model.

References
57
REFERENCES Literature Aronsson H.,Ekdahl B., Oskarsson B., (2003). Modern logistik – for okad lonsamhet, Lund, Sweden: Liber AB Eriksson L., Wiedersheim-Paul F., (1999). Att utreda och forska och rapporter. Malmo, Sweden: Liber ekonomi Krajewski L., Ritzman L., (2002). Operations management: strategy and analysis, Sixth edition, Upper Saddle River, New Jersey, USA: Prentice Hall Lambert D., Stock J., (1999). Strategic Logistics Management, Third edition, Singapore: Irwin McGraw-Hill Lekvall P., Wahlbin C., (2001). Information for marknadsforingsbeslut, Fjarde upplagan. Goteborg, Sweden: IHM Publishing Mattson S-A., (2002). Logistik i forsorjningskedjor, Lund, Sweden: Studentlitteratur Storhagen N.G., (1997). Materialadminstration och Logistik – grunder och mojligheter, Malmo, Sweden: Liber Ekonomi
Articles Chow G., Trevor D.H., Henriksson L.E., (1994) Logistics performance: Definition and Measurment. International Journal of Physical Distribution & Logistics Management, Vol 24. No.1-1994 pp. 17-28 Gunasekaran A., Patel C., Tirtiroglu E., (2001) Performance meaure and metrics in a supply chain environment. International Journal of Operations & Production Management, Vol 21. No ½. pp. 71-87 Tangen S., (2004). Performance meausrment: from philospohy to practice. International Journal of Productivity and Performance Management , Vol 53. No 8. pp 726-737 Sum C., Teo C., Ng K., (2001). Strategic logistics management in Singapore. International Journal of Operations & Production Management. Volume 21. No 9. pp. 1239- 1260
Internet ABB Internal webpages, September – December 2005 http://www.ponl.com, P&O Nedlloyd, September 2005

References
58
Respondents Chong, Isabel, Regional Logistics Manager, Singapore, September – December 2005 Chia, Eng Joo, Manager Department for Supply Chain, Singapore, November 2005 Ng, Lionel, Sales LV Products, Singapore, September 2005 Ng, MuiKian, Supervisor Customer Service, Singapore, September – December 2005 Setiabudi, Heri, Business Developer, Singapore, September – December 2005 SeokPeng Law, Purchaser, Singapore, September – December 2005

LOCATION OF SALES UNITS Appendix 1
Philippines
Singapore
Malaysia
Thailand
Taiwan
Australia
India

LOCATION OF PRODUCTION UNITS Appendix 1
CHCMC ABB Schweiz AG Schaffhausen, Switzerland DEBJE Busch-Jaeger Elektro GmbH Lüdenscheid, Germany DESTO ABB Stotz Heidleberg, Germany FICON ABB OY Vaasa, Finland FRENT ABB Entrelec Chassieu, France ITSCE ABB Sace Bergamo, Italy NOCRL ABB Control Skien, Norway SECRL ABB Cewe-Control Vasteras, Sweden
ITSCE
FRENT
NOCRL
DEBJE
DESTO
SECRL
FICON

SURVEY TO SALES UNITS Appendix 2
Assumptions/Conditions
i Time frame: Jan '04 to December '04
ii Absolute costs per year based on the volume stated
iii Applicable to LV products only
- BU 3106 Breakers & Switches
- BU 3111 (3108+3109) Control Products
- BU 3118 (3116+3126) Enclosures & DIN Rail Products
- BU 3121 Wiring Accessories
General Country
1 Total sales
- for Breakers & Switches USD
- for Control Products USD
- for Enclosures & DIN Rail Products USD
- for Wiring Accessories USD
2 Total Volume shipped to customer
- for Breakers & Switches Kg
- for Control Products Kg
- for Enclosures & DIN Rail Products Kg
- for Wiring Accessories Kg
Warehouse and Inventory Carrying Cost
3 Warehouse cost / storage cost
- for Breakers & Switches USD
- for Control Products USD
- for Enclosures & DIN Rail Products USD
- for Wiring Accessories USD
4 Warehouse space for LV products m²
5 Average Inventory Holding for Finished Goods (Estimated)
- for Breakers & Switches USD
- for Control Products USD
- for Enclosures & DIN Rail Products USD
- for Wiring Accessories USD
6 Estimated average Inventory write-off per year
- for Breakers & Switches USD
- for Control Products USD
- for Enclosures & DIN Rail Products USD
- for Wiring Accessories USD
7 What is your inventory write off policy? 8 Adminstrative cost of processing orders USD
Inbound Landed Cost
9 Clearance Fees & Handling Charges USD
10 Tax & Duties USD
11 Tax & Duties % of TP
12 Local transportation cost
- for Breakers & Switches USD
- for Control Products USD
- for Enclosures & DIN Rail Products USD
- for Wiring Accessories USD Lead time Defintion stock item: Items purchased and kept in the local warehouse for
future sale
13 What is the average total cycle time for stock items?
- for Breakers & Switches w.days
- for Control Products w.days
- for Enclosures & DIN Rail Products w.days
- for Wiring Accessories w.days
14 What is the average total cycle time for non-stock items?
- for Breakers & Switches w.days
- for Control Products w.days
- for Enclosures & DIN Rail Products w.days

SURVEY TO SALES UNITS Appendix 2
- for Wiring Accessories w.days
15 What is the acceptble total cycle time for stock items?
- for Breakers & Switches w.days
- for Control Products w.days
- for Enclosures & DIN Rail Products w.days
- for Wiring Accessories w.days
16 What is the acceptble total cycle time for non-stock items?
- for Breakers & Switches w.days
- for Control Products w.days
- for Enclosures & DIN Rail Products w.days
- for Wiring Accessories w.days
17 On time delivery to the customers requested delivery date for stock items
- for Breakers & Switches %
- for Control Products %
- for Enclosures & DIN Rail Products %
- for Wiring Accessories %
18 On time delivery to the customers requested delivery date for non-stock items
- for Breakers & Switches %
- for Control Products %
- for Enclosures & DIN Rail Products %
- for Wiring Accessories %
Open Questions
1 What is the biggest cost component in your distribution today?
2 What are the major products line you have in stock?
3 Do you stock any third party LV products?
4 Do your competitors hold regional/local stocking? If yes, please specify.
5 How is the market outlook?
- for Breakers & Switches
- for Control Products
- for Enclosures & DIN Rail Products
- for Wiring Accessories
6 Any other comments?

SURVEY TO PRODUCTION UNITS Appendix 3
Assumptions/Conditions
Time frame: Jan '04 to December '04
Applicable to LV products only
- BU 3106 Breakers & Switches
- BU 3111 (3108+3109) Control Products
- BU 3118 (3116+3126) Enclosures & DIN Rail Products
- BU 3121 Wiring Accessories
Total Remarks (if any)
Total sales for export to APAC USD
- for Breakers & Switches USD
- for Control Products USD
- for Enclosure & DIN Rail Products USD
- for Wiring Accessories USD
AU MY IN TW PH TH SG Remarks (if any)
Volume
- for Breakers & Switches Kgs
- for Control Products Kgs
- for Enclosure & DIN Rail Products Kgs
- for Wiring Accessories Kgs
Freight Charges for air shipment
- for Breakers & Switches USD
- for Control Products USD
- for Enclosure & DIN Rail Products USD
- for Wiring Accessories USD
Freight Charges for ocean shipment
- for Breakers & Switches USD
- for Control Products USD
- for Enclosure & DIN Rail Products USD
- for Wiring Accessories USD
Shipping (INCO) terms DDU/Ex-W etc.
Total Cycle Time, EXW
- for Breakers & Switches w.days
- for Control Products w.days
- for Enclosure & DIN Rail Products w.days
- for Wiring Accessories w.days

SURVEY TO PRODUCTION UNITS Appendix 3
Transit time for forwarder to LABB
- for Breakers & Switches w.days
- for Control Products w.days
- for Enclosure & DIN Rail Products w.days
- for Wiring Accessories w.days
On time delivery to the LABB's confirmed delivery date
- for Breakers & Switches %
- for Control Products %
- for Enclosure & DIN Rail Products %
- for Wiring Accessories %
On time delivery to the LABB's requested delivery date
- for Breakers & Switches %
- for Control Products %
- for Enclosure & DIN Rail Products %
- for Wiring Accessories %
Open Questions:
What are the product lines currently in production and distributed from your factory? Please specify per BU.
What is the Average production Time for LV products? (Please specify for each product line if it differs)
Any other comments?

TRANSPORTATION COSTS, AS-IS Appendix 4
INCO terms for production units.
MY SG AU TH TW PH IN DEBJE DDU DDU DDU - - DDU DDU DESTO DDU DDU CPT CPT DDU DDU DDU FICON FCA - - FCA - - - FRENT DDU DDU CPT CPT DDU DDU DDU ITSCE DDU/FOB DDU DDU DDU/FOB DDU DDU DDU
NOCRL EX-W CPT - FCA - CPT FCA SECRL DDU DDU DDU DDU DDU DDU DDU
Transportation costs for air and ocean freight.
AIR MY SG AU TH TW PH IN Total DEBJE DESTO FICON FRENT ITSCE ITSCE (ocean) NOCRL SECRL Total

TOTAL CYCLE TIME, AS-IS Appendix 5
Total cycle time by Ex-Works for production units.
DEBJE DESTO FICON FRENT ITSCE NOCRL SECRL Average TCT, Ex-Works 2 6 4.5 7.7 6 3 7 5.2
Transit time forwarder.
MY SG AU TH TW PH IN DEBJE 4 4 4 4 - - 4 DESTO 4 4 4 4 3 4 3 FICON 9 4.5 FCA 8 FCA 9 9 FRENT 6 6 7 7 4 6 4 ITSCE 2.9 3.3 4.7 2.9 2.7 4 3.9 NOCRL - - - - - - - SECRL 7 7 7 7 7 7 7 Average 5.5 4.8 5.3 5.5 4.2 6.0 5.2
Total cycle time by DDU.
MY SG AU TH TW PH IN
DEBJE 6 10 8.5 11.7 11 DESTO 6 10 8.5 11.7 9 7 10 FICON 11 10.5 FCA 15.7 FCA 12 16 FRENT 8 12 11.5 14.7 10 9 11 ITSCE 4.9 9.3 9.2 10.6 8.7 7 10.9 NOCRL - - - - - - - SECRL 9 13 11.5 14.7 13 10 14 Average 7.5 10.8 9.8 13.2 10.2 9.0 12.2

ON TIME DELIVERY, AS-IS Appendix 6
Definition on time delivery
On time delivery for confirmed date for production units
AU MY IN TW PH TH SG NOCRL 86% 52% - 90% - 48% 100% DESTO 83% 83% 83% 83% 83% 83% 83% DEBJE 95% 95% 95% - - 95% 95% FRENT 88% 84% 83% 76% 82% 77% 86% FICON - 91% 96% 65% 100% 99% 93% ITSCE (Breakers) 100% 100% 99% 100% 99% 100% 99% ITSCE (Enclosures) 81% 68% 60% 80% 80% 75% 85% SECRL 85% 85% 85% 85% 85% 85% 85%
On time delivery for requested date for production units
AU MY IN TW PH TH SG NOCRL 81% 52% - 90% - 48% 100% DESTO - - - - - - - DEBJE 90% 90% 90% - - 90% 90% FRENT 25% 12% 18% 36% 35% 50% 19% FICON - 42% 67% 45% 50% 77% 46% ITSCE (Breakers) 91% 81% 75% 92% 92% 95% 87% ITSCE (Enclosures) 61% 40% 38% 45% 75% 30% 53% SECRL 60% 60% 60% 60% 60% 60% 60%
Time
Ordering point Requested Date
Confirmed Date
Actual Delivery Date
Requested delivery time
Confirmed delivery time
Actual delivery time
LATE ON TIME / Confirmed date
ON TIME / Requested date

ON TIME DELIVERY, AS-IS Appendix 6
On time delivery for stock items per requested date for sales units
MY SG AU TH TW PH IN Breakers & Switches 90% 92% 63% 90% 98% 80% 95% Control Products 90% 88% 62% 90% 98% 80% 90% Enclosures & DIN Rail Products 90% 83% 60% 90% 70% 80% 90% Wiring Accessories 90% 86% - 90% - - 95% Average 90% 87% 62% 90% 89% 80% 93%
On time delivery for non-stock items per requested date for sales units
MY SG AU TH TW PH IN Breakers & Switches 70% 100% 29% 80% 98% 50% 95% Control Products 70% 100% 59% 40% 70% 50% 92% Enclosures & DIN Rail Products 70% 92% 47% 80% 50% 50% 90% Wiring Accessories 70% 94% - 80% - - 95%

TOTAL LOGISTICS COSTS, AS-IS Appendix 7
Total costs for sales units
MY SG AU TH TW PH IN Total
Total Sales
TP
Total Warehouse Costs
Warehouse Costs / TP 1.50% 1.29% 3.83% 2.85% 0.31% 0.91% 0.34% 1.72%
Inventory value
Inventory value / TP 13.71% 10.82% 30.03% 10.53% 5.35% 14.88% 7.39% 13.73%
Inventory turnover 11 15 5 15 29 11 21 11
Throughput time 32 25 70 24 12 35 17 32
Inventory write off
Interest 4.38% 4.38% 4.38% 4.38% 4.38% 4.38% 4.38%
Capital costs
ICC
ICC / Inventory value 14.88% 22.77% 14.48% 10.16% 63.90% 61.96% 21.02% 19.30%
ICC / TP 2.04% 2.46% 4.35% 1.07% 3.42% 9.22% 1.55% 2.65%
Clearance fee & Handling Charges
Tax & Duties
Tax & Duties % of TP
Outbound transportation costs
Total transportation costs
Total transportation costs / TP 0.22% 1.80% 7.35% 2.19% 0.65% 1.58% 7.92% 4.30%
Administrative costs
Adm. costs / TP 0.82% 0.66% 2.30% 3.29% 2.75% 1.86% 0.54% 1.51%
TOTAL COSTS
TOTAL COSTS / TP 4.58% 6.21% 17.83% 9.40% 7.13% 13.57% 10.34% 10.17%
Total costs for production units
DEBJE DESTO FICON FRENT ITSCE NOCRL SECRL Total
Transportation Costs
Transportation Costs / TP 7.17% 3.44% 6.14% 7.56% 9.38% 1.47% 14.53% 7.30%
Total logistics costs
Total Costs % of TP
SU 10.17%
PU 7.30%
Logistics Costs 2004 17.47%

WAREHOUSE COSTS AND ICC, RDC Appendix 8
Assumptions for Warehouse costs
1. Based on the volume shipped from the factories it can be estimated that the monthly consumption is X kg. Assuming 2 months of buffer per 12 months stock is required X kg should be imported on a monthly basis.
Yearly consumption: X kg 2 months of stock: X kg Monthly consumptin: X kg
2. Based on the condition above we can calculate the number of pallets needed. The capacity load for 1 wooden pallet is 400 kg. The total number of pallets needed on a monthly basis is then X.
3. The operating cost is X USD per pallet. (Rent for warehouse space, labor costs etc)
4. The monthly cost for operating the warehouse will then be X USD and yearly cost X USD.
5. The dimensions of a wooden pallet is 1.2 * 0.8 * 1.5 meter (equal to 1.44 m3 or 0.96
sqm).
6. In the warehouse in SG an estimate of three pallets can be placed above each other and the total warehouse space needed is then about 200 m2.
7. Warehouse cost per sqm: X USD
Warehouse cost per kg: X USD Warehouse costs/TP: 0.25 % Assumptions for ICC costs
1. The inventory value for the RDC is based on 2 months of buffer stock per 12 months. Total yearly volume: X kg
2 months of stock: X kg Average inventory volume: X kg Average inventory value: X USD
2. The RDC should not write off since the production units will own the stock.
3. It is assumed that the sales units do not have any local stocking. Except for Australia and India, they are assumed to have 20 % of the stock value today due to the competitive market and the distance from Singapore. They should only stock fast moving items and write off is not necessary.
4. The same interest as in the AS-IS model is used for the region.

IMPORT COSTS, RDC Appendix 9
Assumptions for Import Costs
1. The calculations are based on monthly shipments with 2 months of buffer stock at the RDC.
2. Dimensions for FCL 20 foot is 33 m3 and for 40 foot 67 m3. It is assumed that 75 percent
of the container volume will be utilized. The volume used in the calculations is 25 m3 for 20 foot and 50 m3 for 40 foot. Calculations for DEBJE are LCL due to the small volume.
3. Exchange rates being used is 1 EUR = 1.15 USD and 1 SEK = 0.12 USD 1 USD = 1.69
SGD.
SECRL FICON FRENT DESTO DEBJE ITSCE NOCRL
Yearly Volume (kg)
2 months of stock (kg)
Volume per shipment (kg)
Number of pallets
Volume (m3)
FCL (20)
FCL (40)
Total volume (m3)
Location PU Vasteras Vaasa Chassieu Heidleberg Ludenscheid Bergamo Skien
Port Gothenburg Helsinki Fos Hamburg Hamburg Genoa Oslo
Destination Singapore Singapore Singapore Singapore Singapore Singapore Singapore
Inland transport
Main Freight Sea (Port to Port)
Fuel (FAF)
CAF (6.20 % of value)
Destination Charges in SG
TOTAL Monthly Cost
TOTAL Yearly Cost
Price per Kg 0.15 0.10 0.12 0.10 0.51 0.09 0.12
Freight Charges 2004
Saving in USD
Saving in percent 88.00% 90.20% 90.45% 89.07% 70.98% 89.13% -498.45%

ORDER HANDLING COSTS, RDC Appendix 11
Export costs per month for the RDC
MY SG AU TH TW PH IN
Freight charges per kg
Monthly export volume
Fuel and Security
Origin charges / shipment in SG
Freight charges
Freight charges
Total export costs DDU
Ave. cost per kg
Ave. Cost per shipment
Shipments per month
Export costs per year for the RDC Total monthly cost: X4 USD Total yearly cost: X USD Total yearly cost/TP: 4.77% Export cost per country (USD) X

ORDER HANDLING COSTS, RDC Appendix 11
Assumptions for order handling costs 1. The order handling process is mapped based on ATLV in Singapore.
2. The total order cycle is 42 minutes, assuming all orders are correct. Waiting time is excluded.
3. The potential time saving is based on the order cycle for an order with 5 order lines. 5 order lines are the average number of order lines
per order for Singapore.
4. Total annual work minutes is assumed to be 115,200 minutes. (48 weeks/5 days/8 hours/60 minutes)
5. Average wage for the region is assumed to be X USD.
Activities Current flow Time SG AU IN MY PH TH TW Proposed flow SG AU IN MY PH TH TW
Receive order Orders received by fax, email and phone. Order review. Order unclear - contact EC.
1 1,458 31,223 9,600 1,279 381 727 474 Same process. 1,458 31,223 9,600 1,279 381 727 474
Check stock availability
The inventory levels are checked by order line, the article numbers are manually keyed in. In case of urgency material will be released from other orders.
4 5,832 124,892 38,400 5,116 1,524 2,908 1,896 Same process. 0 0 0 0 0 0 0
Create S.O Create S.O in SAP. 5 23,235 168,445 110,000 6,395 1,600 3,760 2,370 Same process. 7,290 156,115 48,000 6,395 1,905 3,635 2,370
Create P.O Review order. Split order per PU. Check stock. Key in orders in SAP. (Can be up to 7 P.O's.) Largest bottleneck.
15 26,970 15,300 18,000 12,615 3,750 19,245 3,750 The SU place only one order to the DC.
7,290 156,115 48,000 6,395 1,905 3,635 2,370
Send O/A EC can receive up to 7 O/A due to the splitting process.
2 9,294 67,378 44,000 2,558 640 1,504 948 Only one O/A from the DC. 2,916 62,446 19,200 2,558 762 1,454 948
Goods receive (G.R)
Goods received by warehouse. Check part number against packing list. If physical check is ok, give the item a location. Issue G.R in SAP.
5 8,990 5,100 6,000 4,205 1,250 6,415 1,250
The SU will only receive the goods from the DC.
3,645 78,058 24,000 3,198 953 1,818 1,185
Goods issue (G.I) Create an internal delivery order in SAP, based on S.O. Create picking slip and print to warehouse.
4 18,588 134,756 88,000 5,116 1,280 3,008 1,896 The SU only have to conduct one G.I.
2,916 62,446 19,200 2,558 762 1,454 948
Payment to PU Finance check invoice against internal documents. Issue payment.
5 8,990 5,100 6,000 4,205 1,250 6,415 1,250 Only one payment to the DC
7,290 156,115 48,000 6,395 1,905 3,635 2,370
Invoice EC Invoiced issued from SAP. Invoice based on S.O.
1 4,647 33,689 22,000 1,279 320 752 474 Same process. 1,458 31,223 9,600 1,279 381 727 474
Total 42 108,004 585,883 342,000 42,768 11,995 44,734 14,308 34,263 733,741 225,600 30,057 8,954 17,085 11,139

ORDER HANDLING COSTS, RDC Appendix 11
Number of order for LV products 2004
SG AU IN MY PH TH TW P.O from Customer
S.O P.O to factory
Total saving per year for sales units
SG AU IN MY PH TH TW Total Saving per year (minutes)
Saving per year (USD) Order handling costs 2004 Order handling costs RDC

TOTAL LOGISTICS COSTS, RDC Appendix 12
Total costs for sales units
MY SG AU TH TW PH IN Total
Total Sales
TP
Inventory Value
ICC (Capital Cost)
ICC / TP 0 0 0.26% 0 0 0 0.06% 0.07%
Warehouse Costs
Warehouse Costs / TP 0 0 0.77% 0 0 0 0.07% 0.17% Outbound Transportation Costs Outbound Transportation Costs / TP 0.22% 0.15% 7.35% 0.37% 0.22% 0.55% 5.92% 3.09%
Order handling Costs
Order handling Costs / TP 0.59% 0.50% 2.25% 3.22% 2.65% 1.75% 0.21% 1.34%
Total
Total Cost / TP 0.80% 0.66% 10.63% 3.59% 2.87% 2.30% 6.26% 4.67%
Total costs for RDC
Warehouse Costs
Warehouse Costs/TP 0.25%
Order handling Costs
Order handling Costs/TP 2.00%
Transport (Export)
Transport (Export)/TP 4.77%
Total
Total/TP 7.02%
Total costs for production units
DEBJE DESTO FICON FRENT ITSCE NOCRL SECRL Total
Cost for Ocen shipment
Transportation Costs / TP 2.08% 0.38% 0.60% 0.72% 0.94% 8.80% 1.74% 0.82%
Total logistics costs
Total Costs % of TP
SU 4.78%
RDC 7.02%
PU 0.82%
Total Logistics Costs 12.62%