2007 awards global reach. personal...
TRANSCRIPT

COVER
Stephanie EllisCustomer Care Sales SpecialistGlobal Reservations and Customer Care CenterSalt Lake City, Utah
With her extensive knowledge about Marriott, and a friendly smile that almost radiates through thephone, Stephanie will help you select the perfecthotel for your next business trip or family vacation.
2007 AwardsMarriott International, Inc.100 Best Companies to Work For and One of America’s Most Admired Companies (FORTUNE ®)
Best Places to Launch a Career (BusinessWeek)
100 Best Companies for Working Mothers (Working Mother)
Top 50 Companies for Diversity (DiversityInc)
Top 40 Companies for Diversity (Black Enterprise)
Diversity Elite 60 (Hispanic Business)
100% Score on Corporate Equality Index (Human Rights Campaign)
Top Hospitality and Travel Company for Innovative Use of Technology (InformationWeek)
2007 Extra Mile Award (Budget Travel)
Best Hotel Chain Worldwide (Business Traveller Germany)
2007 ENERGY STAR® Sustained Excellence Award (The U.S. Environmental Protection Agency)
World Savers Award for Outstanding CommunityEngagement and Social Responsibility Programs (Condé Nast Traveler)
The Ritz-Carlton Hotel Company, L.L.C.Best Luxury Hotel Chain (Consumer Reports, Luxury Institute and J.D. Power and Associates®)
Customer Service Elite (BusinessWeek)
JW Marriott Hotels & ResortsTop Upscale Hotel Brand (Business Travel News)
Customer Service Elite (BusinessWeek)
Marriott Hotels & ResortsTop Upscale Hotel Brand (Business Travel News)Top Brand for Business Travelers (TripAdvisor®)
Courtyard by MarriottOne of Top Five Hotel Chains (TripAdvisor)
SpringHill Suites by MarriottTop Mid-Priced Hotel Brand (Business Travel News)
Marriott Vacation Club InternationalBest Customer Service Organization in America (American Business Awards)
Marriott RewardsBest Customer Service; Frequent Guest Program–Americas (Freddie Awards)
Marriott International, Inc.Marriott DriveWashington, D.C. 20058Marriott.com
Global Reach. Personal Service.
Marriott International, Inc. 2007 Annual Report

Cert no. SW-COC-002262
Marriott International, Inc. 2007 77
Corporate Information
Corporate HeadquartersMarriott International, Inc.10400 Fernwood RoadBethesda, MD 20817301/380-3000Internet: Marriott.com
Common Stock ListingsThe company’s Class A common stock (tickersymbol: MAR) is listed on the New York StockExchange and other exchanges.
Shareholders of RecordAt January 25, 2008, there were 354,043,159shares of Class A Common Stock outstandingheld by 48,288 shareholders of record.
Investor RelationsFor information, call: 301/380-6500Internet: Marriott.com/investor
Independent Registered Public Accounting FirmErnst & Young LLPMcLean, Virginia
Annual Meeting of ShareholdersMay 2, 2008—10:30 a.m.JW Marriott Hotel1331 Pennsylvania Avenue, NWWashington, DC 20004
Registrar and Transfer AgentShareholder inquiries regarding stock transfers,dividend payments, address changes, enrollmentin the company’s direct investment plan, loststock certificates, or other stock account mattersshould be directed to:
Mellon Investor Services480 Washington Blvd., 29th FloorJersey City, NJ 07310800/311-4816 (U.S. and Canada)+1 201/680-6693 (International)Internet: www.melloninvestor.com
Common Stock Prices and Dividends
DividendsStock Price Declared
High Low Per Share
2006– First quarter .......$35.35 $32.32 $0.0525– Second quarter.. 38.38 34.20 0.0625– Third quarter ...... 38.44 34.30 0.0625– Fourth quarter.... 48.31 37.19 0.0625
2007– First quarter .......$51.50 $44.79 $0.0625– Second quarter.. 52.00 43.90 0.0750– Third quarter ...... 48.85 39.70 0.0750– Fourth quarter.... 45.10 31.34 0.0750
Internet Users: We invite you to learnmore about Marriott’s business and growthopportunities at Marriott.com/investor. Ourinvestor site includes investor presentations,earnings conference calls, press releases,SEC filings, company history, and informa-tion about the company’s governance andBoard of Directors. You may also enroll inour dividend reinvestment plan.
Shareholders may also elect to receivenotices of shareholder meetings, proxymaterials and annual reports electronicallythrough the Internet. If your shares are reg-istered in your own name, and not in “streetname” through a broker or other nominee,simply log in to Investor ServiceDirect, theInternet site maintained by our transferagent, Mellon Investor Services LLC, atwww.melloninvestor.com/isd and the step-by-step instructions will prompt youthrough enrollment.
Telephone NumbersFor reservations or information, call:
Marriott Hotels & Resorts ........... 800/228-9290Renaissance Hotels & Resorts ... 800/468-3571The Ritz-Carlton Hotel
Company, L.L.C. ..................... 800/241-3333JW Marriott Hotels & Resorts ..... 800/228-9290Bulgari Hotels & Resorts ............ 301/547-4900Courtyard ................................... 800/321-2211SpringHill Suites ......................... 888/287-9400Fairfield Inn................................. 800/228-2800Residence Inn ............................ 800/331-3131TownePlace Suites ..................... 800/257-3000Marriott Executive Apartments ... 800/800-5744Marriott ExecuStay ..................... 800/800-5744Marriott Vacation Club................ 866/300-3032The Ritz-Carlton Club................. 800/941-4386Grand Residences by Marriott.... 866/894-7263Horizons by Marriott
Vacation Club .......................... 866/300-3032
Lodging Development Inquiries
TONY CAPUANO
Executive Vice PresidentNorth America Full Service ......... 301/380-3200
DARYL NICKEL
Executive Vice PresidentSelect-Service and Extended-Stay,
North America ......................... 301/380-5237
KEVIN KEARNEY
Executive Vice PresidentEurope, the Middle East
and Africa ............................41-44-723-5100
PAUL FOSKEY
Executive Vice PresidentAsia/Pacific...............................852-2918-6230
CARLTON ERVIN
Senior Vice PresidentCaribbean and Latin America ..... 301/380-2340
STEPHEN MUDGE
Executive Vice PresidentMixed Use Development ............ 301/380-8028
RICHARD HOFFMAN
Executive Vice PresidentMergers, Acquisitions and
Business Development ............ 301/380-1670
SCOTT MELBY
Executive Vice PresidentDevelopment, Planning and
Feasibility................................. 301/380-3200
Internet: www.MarriottDevelopment.com
©Marriott International, Inc. 2008 All rights reserved.
CEO and CFO CertificationsAs required by the New York Stock Exchangelisting rules, our Chief Executive Officer certifiedto the New York Stock Exchange on May 21,2007, that he was not aware of any violation bythe company of the New York Stock Exchangelisting standards as of that date. In addition,our Chief Executive Officer and our ChiefFinancial Officer have provided certificationswith respect to the company’s public disclo-sures as required under Rule 13a-14(a) andRule 13a-14(b) of the Securities Exchange Act,which certifications were either furnished orfiled as Exhibits 31.1, 31.2 and 32 to the com-pany’s Annual Report on Form 10-K for fiscalyear 2007 filed with the Securities andExchange Commission.
Other InformationAny shareholder who would like a copy of thecompany’s Annual Report on Form 10-K for fiscalyear 2007 may obtain one, without charge, byaddressing a request to the Secretary, MarriottInternational, Inc., Department 52/862, MarriottDrive, Washington, DC 20058. The company’scopying costs will be charged if copies ofexhibits to the Annual Report on Form 10-K arerequested. You may also obtain a copy of theAnnual Report on Form 10-K for fiscal year2007, including exhibits, from the company’sWeb site at Marriott.com/investor, clicking on“Corporate Information & SEC Filings.”
With our commitment to preserving the environment and all of its natural resources, this report isprinted with soy ink on recycled, Environmental Choice Certified paper. The FSC certification isgranted by the Forest Stewardship Council for supporting responsible use of forest resources.
Special thanks to the Crystal Gateway Marriott in Arlington, Va., for hosting the photo shoot of our employees featured in this report.

Marriott International.Powered by our Spirit to Serve.®
Like all general managers, Booker Massey knows his hotel inside and out…so your stay is productive and memorable.
Booker Massey, Jr.Regional /General ManagerTownePlace Suites SterlingVirginia
For an online version of this Annual Report, visit www.Marriott.com/investor.

With its expansive views and Asian-influenced menu, Chop Suey atthe Renaissance New York Hotel Times Square is one of the city’smost unique restaurant and bar destinations.
2 | 3 Marriott International, Inc. 2007

Worldwide locations.Breakfast by Chef Loan.
Start your day with something extraordinaryby award-winning Chef Loan Co, whoseMarriott career spans nearly 20 years.
Loan CoAssistant Pastry ChefSan Francisco MarriottCalifornia
To make reservations at this hotel or restaurant, go to www.nycrenaissance.com or www.chopsueynyc.com.

One of eight Marriott International hotels in Russia, The Ritz-Carlton,Moscow lies at the edge of the famed Red Square and serves as a cultural epicenter of one of the world’s great cities.
4 | 5 Marriott International, Inc. 2007

3,000 hotels spanning 19 brands.Warm welcome by Marcelo.
After a long trip, enjoy a friendly greeting,gracious service and signature sightseeingtips by Marcelo Jakubovic.
Marcelo JakubovicDoormanThe Ritz-Carlton, Key BiscayneFlorida
To make reservations at this hotel, visit www.ritzcarlton.com.
3,000 hotels spanning 19 brands.Warm welcome by Marcelo.
Marcelo JakubovicDoormanThe Ritz-Carlton, Key BiscayneFlorida
After a long trip, enjoy a friendly greeting,gracious service and signature sightseeingtips by Marcelo Jakubovic.
To make reservations at this hotel, visit www.ritzcarlton.com.

The Courtyard Fairfax Fair Oaks in Virginia showcases the brand’snew lobby design, which lends itself to both form and function and demonstrates that a moderately priced brand can be stylishand sophisticated.
6 | 7 Marriott International, Inc. 2007

Working toward a cleaner, healthier planet.One hotel at a time.
Together, we can make a difference,whether it’s conserving water and energy,recycling or making other decisions that are good for the environment.
For more information about the Greening ofMarriott, visit www.Marriott.com/environment.
EJ HiltsRegional Director of EnergyWestern Region, U.S.A.
To Our Shareholders
J.W. Marriott, Jr.Chairman andChief Executive Officer
William J. ShawPresident and Chief Operating Officer
14 Marriott International, Inc. 2007
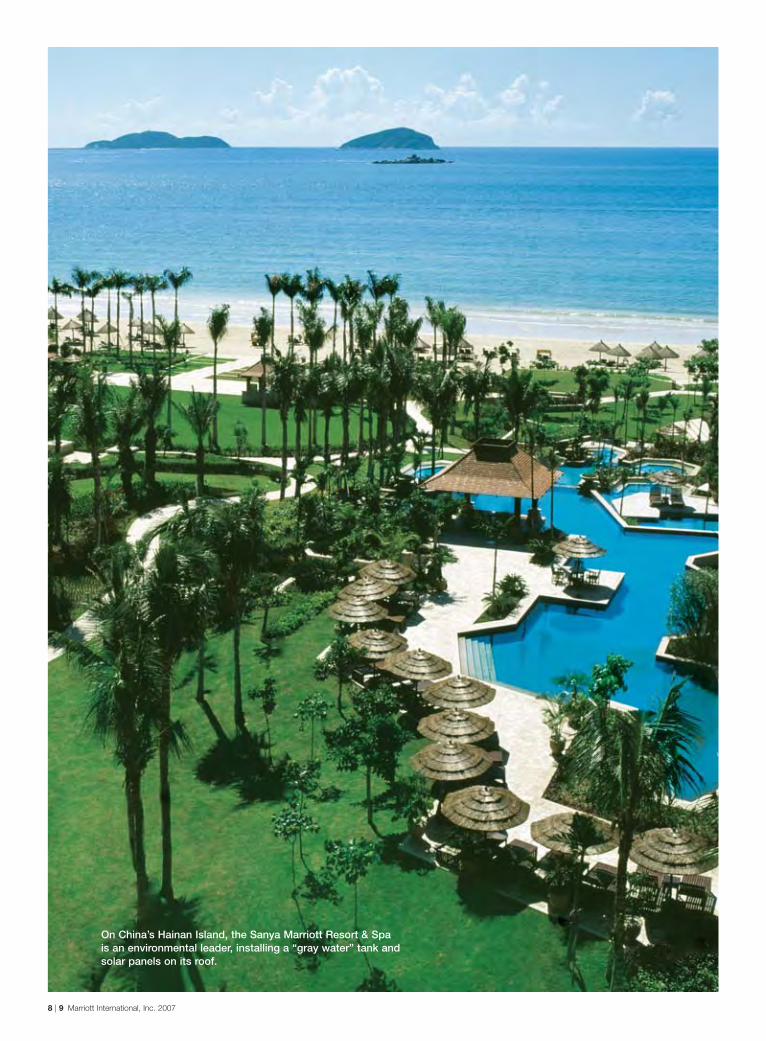
On China’s Hainan Island, the Sanya Marriott Resort & Spa is an environmental leader, installing a “gray water” tank and solar panels on its roof.
8 | 9 Marriott International, Inc. 2007
Everyday ingenuity.Delivered by Tanja…and300,000 employeesworldwide.*
Tanja ZierHousekeeperRenaissance Hamburg HotelGermany
You’ll find an oasis for work or relaxation in our immaculately maintained hotel lobbies and guest rooms.
To learn more about Courtyard’s new lobby, go to www.gocourtyard.com.
* Includes those employed at our 3,000 managed and franchised properties systemwide.
Global reach. Personal service. In pictures,
our Annual Report tells the story of how
Marriott International has become the world’s
leading lodging company—not just through
its diverse portfolio of 3,000 lodging properties,
representing 19 brands in almost 70 countries
and territories—but by training and engaging
the very best employees to deliver exceptional
service. In the end, success depends on the
guest experience and hospitality delivered by
the 300,000 employees at our managed and
franchised hotels worldwide.This legendary service is the foundation of Marriott
International and owes its success to our unique culture,which values opportunity and respects the goals andaspirations of our people. This, combined with a solidmanagement team and our tested business model ofmanaging and franchising hotels owned by others, hasprovided us with a significant competitive advantage. We have stayed true to these pillars even as we continueto innovate. It’s why we are able to report another solidyear in 2007.
Our worldwide systemwide Revenue Per Available Room (RevPAR) rose 6.5 percent in 2007, driven by strongdemand from our best corporate customers and other busi-ness travelers. More than 20 percent of our fee revenuederives from properties located outside North America.
With our owners and franchisees, we added more than200 properties to our system. Full year incentive manage-ment fees totaled a record-breaking $369 million in 2007,up 31 percent over the prior year. We generated diluted
Working toward a cleaner, healthier planet.One hotel at a time.
Together, we can make a difference,whether it’s conserving water and energy,recycling or making other decisions that are good for the environment.
For more information about the Greening ofMarriott, visit www.Marriott.com/environment.
EJ HiltsRegional Director of EnergyWestern Region, U.S.A.
To Our Shareholders
J.W. Marriott, Jr.Chairman andChief Executive Officer
William J. ShawPresident and Chief Operating Officer
14 Marriott International, Inc. 2007
On China’s Hainan Island, the Sanya Marriott Resort & Spa is an environmental leader, installing a “gray water” tank and solar panels on its roof.
8 | 9 Marriott International, Inc. 2007
Everyday ingenuity.Delivered by Tanja…and300,000 employeesworldwide.*
Tanja ZierHousekeeperRenaissance Hamburg HotelGermany
You’ll find an oasis for work or relaxation in our immaculately maintained hotel lobbies and guest rooms.
To learn more about Courtyard’s new lobby, go to www.gocourtyard.com.
* Includes those employed at our 3,000 managed and franchised properties systemwide.
Global reach. Personal service. In pictures,
our Annual Report tells the story of how
Marriott International has become the world’s
leading lodging company—not just through
its diverse portfolio of 3,000 lodging properties,
representing 19 brands in almost 70 countries
and territories—but by training and engaging
the very best employees to deliver exceptional
service. In the end, success depends on the
guest experience and hospitality delivered by
the 300,000 employees at our managed and
franchised hotels worldwide.This legendary service is the foundation of Marriott
International and owes its success to our unique culture,which values opportunity and respects the goals andaspirations of our people. This, combined with a solidmanagement team and our tested business model ofmanaging and franchising hotels owned by others, hasprovided us with a significant competitive advantage. We have stayed true to these pillars even as we continueto innovate. It’s why we are able to report another solidyear in 2007.
Our worldwide systemwide Revenue Per Available Room (RevPAR) rose 6.5 percent in 2007, driven by strongdemand from our best corporate customers and other busi-ness travelers. More than 20 percent of our fee revenuederives from properties located outside North America.
With our owners and franchisees, we added more than200 properties to our system. Full year incentive manage-ment fees totaled a record-breaking $369 million in 2007,up 31 percent over the prior year. We generated diluted

SERVE—Marriott’s Social Responsibility and Community Engagement Initiatives
Shelter and FoodEvery day around the world, guests callMarriott their “home away from home.”That’s why it’s natural for us to help createplaces of refuge for those in need and feedthe hungry, including during times of disaster.
Through Habitat for Humanity® International,our employees at managed and franchisedhotels, along with our customers, have builtmore than 300 homes in 15 countries, includ-ing Costa Rica, Indonesia, Mexico, Thailandand the United States. While the companyand its partners contribute about $200,000annually to the cause, our employees roll uptheir sleeves, work as teams and create safeand affordable homes for others. In fact, ourFairfield Inn brand has made Habitat itssignature community activity.
Whether providing safe-to-donate food oremployee volunteers, our hotels worldwidework with shelters and food banks in theircommunities, most of which in the UnitedStates are affiliates of America’s SecondHarvest—the Nation’s Food Bank Network.Since 1992, Marriott International has con-tributed more than $500,000 to food banks.
Unfortunately, there are times when naturaldisasters and other crises affect the communities where we work and live. Wecontribute to the Disaster Relief Fund ofboth the American Red Cross and theInternational Federation of Red Crossand Red Crescent Societies and provideopportunities for our Marriott Rewardsmembers to contribute as well.
EnvironmentThrough Marriott’s Executive Green Counciland its collaboration with ConservationInternational, the company is workingtoward a greener, healthier planet. We arefocused on these key areas:
• Energy and Water Conservation—Marriott and its guests have reducedwater usage by more than 15 percentover the last five years. The U.S.Environmental Protection Agency (EPA)has presented Marriott with its SustainedExcellence Award.
• Reducing our Carbon Footprint—Manyhotels have reduced greenhouse gasesby replacing existing heating, ventilationand cooling equipment with more efficientsystems. Marriott’s smoke-free policy inNorth America is the most comprehensivein the industry.
• Waste Reduction—More than 96 percent of hotels recycle, and Marriottheadquarters has become waste neutral.
• Wildlife Preservation—Our hotels seekways to minimize their impact on nativehabitats, and tailor activities to protectand preserve wildlife and their natural surroundings.
• Greener Buildings—We are proud that The Inn & Conference Center at the University of Maryland, outside ofWashington, D.C., is LEED-certified by the U.S. Green Building Council. We aredeveloping “green” building guidelines for our hotels by year-end 2009.
For more information visit www.Marriott.com/environment.
Readiness for Hotel CareersAs a growing global employer, having aprepared talent pool is essential. We focuson programs serving young people fromchallenging backgrounds where our assis-tance often provides life-changing alternatives.
Together, The J. Willard and Alice S. MarriottFoundation and Marriott International have committed $550,000 to expand theInternational Tourism Partnership’s YouthCareer Initiative, which combines classroomtraining with on-the-job experience in the hospitality industry for at-risk youth worldwide.
Marriott leaders provide career guidance,mentoring, and internships for students in the Marriott Scholars program, funded by The J. Willard and Alice S. MarriottFoundation, which gives scholarship grantsof up to $9,000 per year to each hospitalityor culinary student selected through theHispanic College Fund and United NegroCollege Fund.
Vitality of ChildrenAnswering the needs of sick andimpoverished children is a heartfelt desire of employees around the world. In NorthAmerica, Marriott’s support is focused on its25-year partnership with Children’s MiracleNetwork (CMN), which provides funds for173 affiliated children’s hospitals across theUnited States and Canada. Marriott hasraised nearly $58 million for CMN.
Our hotels in China and Hong Kong supportSafe Kids China, a fire and burn preventionprogram for school children. In Austria,Egypt, Germany and Switzerland, employeeshave helped renovate homes for neglectedchildren through SOS Children’s Villages.
Embracing Diversity and People with DisabilitiesAs Marriott has grown and expandedglobally, our business has become morediverse. We recognize that an inclusive environment strengthens our company and provides a competitive advantage.
Marriott’s commitment to diversity includesemployees, owners and franchisees,customers and suppliers, and is driven byour Board of Directors. With nearly 450hotels owned or under development byminorities and women, we are well on ourway to achieving our goal of 500 by 2010.After surpassing our goal of $1 billion inspending with diverse suppliers threeyears ahead of schedule, we have set a new goal to spend 15 percent by 2009.
Over 18 years, the Marriott Foundation forPeople with Disabilities has built a highlyreputed program, “Bridges... from schoolto work.®” More than 10,000 young peoplewith disabilities have received job and lifeskills training and been placed in jobs.
Commitment to Human RightsAt Marriott, we support and respect theprotection of human rights within thecompany’s sphere of influence. This includesstanding against such tragedies as human trafficking and the exploitation ofchildren. Marriott actively engages withindustry and nonprofit groups to share bestpractices. For example, we are participatingin the International Business LeadersForum/United Nations World TravelOrganization’s task force to develop humanrights principles for the hotel industry. Weexpect our suppliers to uphold similar highstandards and follow all applicable laws.
For a more in-depth summary, visit www.Marriott.com/socialresponsibility.10 Marriott International, Inc. 2007
The Ritz-Carlton® Hotel Company hasenjoyed more than two decades as an award-winning, luxury hospitalityorganization. The Ritz-Carlton manages70 award-winning hotels and resorts;private condominiums; fractionalownership properties; golf communitieswith exclusive private homes; elegantspas; and highly successful restaurants.The Ritz-Carlton name has becomesynonymous with delivering the finestservice for guests around the globe.
Bulgari Hotels & Resorts,® developed in partnership with jeweler and luxurygoods designer Bulgari SpA, is acollection of sophisticated, intimateluxury properties located in exclusivedestinations. Properties feature Bulgari’sstriking contemporary interpretation of luxury design and cuisine. JoiningBulgari’s first hotel in Milan, the Bulgari Resort in Bali opened fall 2006,featuring comprehensive spa facilities in a spectacular sea-view setting.
JW Marriott® Hotels & Resorts, themost distinctive properties bearing the Marriott name, invites guests toenjoy a new dimension of personalluxury—from designer bedding anddelectable dining to extraordinary spa and golf offerings—enhanced byexquisite environments, approachableelegance and attentive service at nearly40 locations worldwide.
SM
Our Brands
EditionSM is fashioned as the next generation of boutique hotels through the
collaboration of Ian Schrager and Marriott. Edition combines a personal, intimate,
individualized and unique lodging experience on a global scale. The industry’s
first truly global lifestyle hotel brand will combine outstanding innovation and
design with the highest levels of service execution. We expect to have as many
as 20 signed letters of intent by the end of 2008.
The Ritz-Carlton, TokyoJapan
JW Marriott Hotel LimaPeru
Bulgari MilanItaly
Marriott® Hotels & Resorts, the flagshipbrand, inspires your best performanceduring travel, engineering an experiencewith the services and human touchesthat help you achieve and revive. Withmore than 480 properties worldwide,Marriott provides a current approach tothe classic hospitality that has made ita leading choice for travelers for over 70 years.
Nickelodeon® and Marriott team up tocreate family-friendly resorts and spas.These upscale, self-contained resortswill provide something for every familymember. Powered by Nickelodeon’ssignature slime, the resorts will featurestate-of-the-art pools, water parks,entertainment starring Nickelodeon’s mostfamous characters such as Dora theExplorer and SpongeBob SquarePants,spas for adults and kids and opportunitiesfor families to create wonderful memories.
Renaissance® Hotels & Resorts keepsyour life interesting during travel, offeringstylish environments and opportunitiesto explore each unique destinationalong with the attentive service of an upscale hotel. At 140 worldwideRenaissance locations, every momentadds up to an interesting stay thatfulfills your journey.
Renaissance ClubSport,® a new“lifestyle” concept, combines boutique-style ambience of Renaissance Hotels& Resorts with sleek, upscale, full-service fitness clubs. RenaissanceClubSport offers distinctive décor in guest rooms, imaginative dining,attentive service and world-class sports and fitness amenities. The firstRenaissance ClubSport is located inWalnut Creek, Calif.; six more propertiesare under development.
Courtyard by Marriott® offers itsbusiness transient guests a refreshingapproach to business “performance”hotels in the upper-moderate tier.Courtyard provides a smart, intuitiveenvironment that offers choice andcontrol at nearly 770 locations aroundthe world. Properties balance the mix ofservices and design to accommodateguests’ needs to stay connected,productive, and refreshed during their stay.
SpringHill Suites by Marriott® offers a fresh and interesting perspective to the growing segment of travelers in the upper-moderate lifestyle tier. With more than 175 hotels in North America,SpringHill Suites expertly blendssubstance and style through spacious, re-imagined suites, flexible and invitinglobby design, and inspired service andguest amenities.
Fairfield Inn by Marriott® providesbusiness transient guests a successfultrip with award-winning quality andhospitality at a satisfying value. It allows the purpose-driven guest to stay productive. Fairfield Inn & SuitesSM
offers comfortable suites, an exerciseroom, library and additional amenities.There are more than 535 Fairfield Innhotels, with more than 200 Fairfield Inn& Suites locations in the United States.
Courtyard Los Angeles Sherman OaksCalifornia
Orlando Airport MarriottFlorida
Nickelodeon Resorts by Marriott (Rendering)
Renaissance Orlando Resort at SeaWorld®
Florida
Renaissance ClubSport Walnut Creek HotelCalifornia
SpringHill Suites by Marriott (Guest Room)
Fairfield Inn & Suites by Marriott (Guest Room)
Residence Inn by Marriott,® the leadingextended-stay brand, helps guests feelconnected while away from home.Spacious suites with full kitchens andseparate areas for sleeping, working,relaxing and eating offer homelikecomfort and functionality. Guestsexperience a true sense of community as they interact with our friendly staffs,enjoy our enhanced complimentary hotbreakfast, and mingle at our eveningsocial hours at more than 545 hotels.
Moderate-tier, extended-stay guestsfind comfort in being self-sufficient anddoing things their way. To sustain theirlives’ rhythm, TownePlace Suites byMarriott® provides a place to unpack,settle in and connect to the local area.With a casual, residential atmosphereand a productive home office and fullkitchen in every suite, at more than 140hotels, TownePlace Suites is all aboutreal living.
Marriott Executive Apartments® providesupscale accommodations for businessprofessionals on extended stay (30 nightsor more) outside of North America.Offering studios to three-bedroomapartments in more than 15 locations,they combine the privacy and comfortsof residential living with the services and luxuries of a Marriott hotel, such asrestaurants, business centers and healthclubs. Each property features local designelements and state-of-the-art technology.
Marriott ExecuStay,® a leading U.S.corporate apartment provider, offerstemporary housing to travelers whoprefer the spaciousness and privacy of an apartment for extended stays of 30 days or longer. With locations in most major, secondary and tertiary U.S.cities, ExecuStay finds the right solutionfor each traveler and delivers a fullyfurnished, accessorized apartment withas little as one day’s notice.
Marriott Vacation ClubSM (MVC) is the recognized worldwide leader in the vacation ownership industry. The 46 MVC properties around the globe offer a lifetime of memorable vacationsfeaturing one- to three-bedroom villas(depending on location) with living and dining areas, master bedroom and bath, balcony, full kitchen andwasher/dryer. Flexible usage optionsinclude exchange to MVC resorts andtrade for Marriott Rewards® points.
The Ritz-Carlton Club® is a deeded, fractional ownership real estate offering combining the benefits of second home ownership with renowned Ritz-Carlton service. Designed as a private club, Members may access their home Club or other Ritz-Carlton Clubs. Locations: Aspen Highlands and Bachelor Gulch, Colo.; St. Thomas, U.S.V.I.; San Francisco; and Jupiter, Fla., as well as several future properties ranging from Kapalua Bay on Maui to North Lake Tahoe, Calif.
Grand Residences by Marriott® providessecond home options through fractionalreal estate offerings and select privateownership opportunities. Designed forregional second home destinations, thebrand is dedicated to providing carefreeproperty ownership through Marriottmanagement expertise and a variety of amenities and services. Locations:Panama City Beach, Fla.; South LakeTahoe, Calif.; and London, England.
Horizons by Marriott Vacation Club®
provides affordable vacation ownership,while offering a variety of amenities andactivities for the entire family. Each villa includes living and dining areas,balcony, kitchen and washer/dryer.Horizons owners have a flexible usageprogram including exchange to otherMarriott Vacation Club resorts, and theability to trade for Marriott Rewardspoints. Locations: Orlando, Fla., andBranson, Mo.
Residence Inn by Marriott (Guest Room)
TownePlace Suites GaithersburgMaryland
Marriott Executive Apartments—Palm Springs, BeijingChina
Marriott ExecuStay—ColumbusOhio
Horizons by Marriott Vacation Club at BransonMissouri
Grand Residences by Marriott—Mayfair–LondonEngland
The Ritz-Carlton Club, San FranciscoCalifornia
Marriott’s Marbella Beach ResortSpain

Working toward a cleaner, healthier planet.One hotel at a time.
Together, we can make a difference,whether it’s conserving water and energy,recycling or making other decisions that are good for the environment.
For more information about the Greening ofMarriott, visit www.Marriott.com/environment.
EJ HiltsRegional Director of EnergyWestern Region, U.S.A.
To Our Shareholders
J.W. Marriott, Jr.Chairman andChief Executive Officer
William J. ShawPresident and Chief Operating Officer
14 Marriott International, Inc. 2007
On China’s Hainan Island, the Sanya Marriott Resort & Spa is an environmental leader, installing a “gray water” tank and solar panels on its roof.
8 | 9 Marriott International, Inc. 2007
Everyday ingenuity.Delivered by Tanja…and300,000 employeesworldwide.*
Tanja ZierHousekeeperRenaissance Hamburg HotelGermany
You’ll find an oasis for work or relaxation in our immaculately maintained hotel lobbies and guest rooms.
To learn more about Courtyard’s new lobby, go to www.gocourtyard.com.
* Includes those employed at our 3,000 managed and franchised properties systemwide.
Global reach. Personal service. In pictures,
our Annual Report tells the story of how
Marriott International has become the world’s
leading lodging company—not just through
its diverse portfolio of 3,000 lodging properties,
representing 19 brands in almost 70 countries
and territories—but by training and engaging
the very best employees to deliver exceptional
service. In the end, success depends on the
guest experience and hospitality delivered by
the 300,000 employees at our managed and
franchised hotels worldwide.This legendary service is the foundation of Marriott
International and owes its success to our unique culture,which values opportunity and respects the goals andaspirations of our people. This, combined with a solidmanagement team and our tested business model ofmanaging and franchising hotels owned by others, hasprovided us with a significant competitive advantage. We have stayed true to these pillars even as we continueto innovate. It’s why we are able to report another solidyear in 2007.
Our worldwide systemwide Revenue Per Available Room (RevPAR) rose 6.5 percent in 2007, driven by strongdemand from our best corporate customers and other busi-ness travelers. More than 20 percent of our fee revenuederives from properties located outside North America.
With our owners and franchisees, we added more than200 properties to our system. Full year incentive manage-ment fees totaled a record-breaking $369 million in 2007,up 31 percent over the prior year. We generated diluted

earnings per share (EPS) from continuing operations of $1.75 for 2007, an increase of 6 percent, as we and our hotel ownersimproved profit margins in our hotels by more than 1.5 percentagepoints. These strong improvements in hotel-level profitabilityresulted from efficiencies achieved through technology andworkforce effectiveness. Net cash provided by operating activitiestotaled $778 million in 2007.
We’re committed to delivering value to shareholders and in 2007 we returned nearly $1.9 billion to our investors throughshare repurchases and dividends. The company repurchased 41 million shares for $1.8 billion in 2007, and at year-end 2007we had 33 million shares remaining in buybacks authorized byour Board. Return on invested capital for 2007 topped 25 per-cent, nearly double our performance just four years ago.
Building Our BrandsWith the introduction of two new brands in 2007, Marriott’sportfolio encompasses nearly every segment of the lodging andtimeshare industries. At the same time, two of our proven brandswill celebrate milestones in 2008—Marriott Hotels & Resorts willwelcome its 500th hotel, and Courtyard its 800th.
We are very excited about the launch of “Edition,” a newgenre of lifestyle brand that will combine the intimate and uniquelodging experience invented by the visionary pioneer Ian Schragerwith Marriott’s development scale and operational expertise. Weexpect the portfolio to reach more than 100 hotels worldwide,and have signed preliminary agreements on nine hotels in suchworld-class destinations as Paris, Madrid, Costa Rica, Miami,Washington, D.C., Chicago and Los Angeles.
Through a partnership with Nickelodeon, the top kids’entertainment brand, Marriott plans to capture the hearts of our younger customers and the young at heart—their parents.Powered by Nickelodeon’s irreverent and fun entertainment,these upscale resorts will feature state-of-the-art spas, poolsand water parks, and live entertainment starring Nick characters.
Our full-service brands—Marriott Hotels & Resorts and the uniquely stylish Renaissance Hotels & Resorts—aretransforming their public spaces to encourage guests to workand socialize there, incorporating the latest design, technology
and food and beverage offerings. To date, 20 lobbies have beenredesigned, with another 80 anticipated by 2009. Featured inthis report, the Renaissance New York Hotel Times Squareshowcases this new concept, and how our owners are infusingthe brand with a nearly $2 billion investment in new hotelconstruction, conversions and renovations.
Building on the surging global demand for luxury, The Ritz-Carlton Hotel Company, L.L.C. has increased its develop-ment pace with 2007 hotel openings in Beijing, Dallas, Dublin,Vail, Col., Moscow, and Tokyo. The Ritz-Carlton plans to double its portfolio over the next eight years, leveraging its reputationto create new opportunities with The Ritz-Carlton Residences®. The Ritz-Carlton has scored a virtual “sweep” of prestigiousnumber one rankings in recent surveys by J.D. Power andAssociates and Consumer Reports. Our JW Marriott Hotels &Resorts brand, which offers relaxed luxury, will reach 50 hotelsand resorts in 22 countries by July 2009.
In 2007, Residence Inn debuted a breakthrough integratedmarketing campaign, “Master the Long TripSM.” The TV and printads feature “feat performers” who demonstrate the brand’sdramatic support to business travelers on long stays and high-light the new décor, which includes stainless steel appliances,granite kitchen countertops, and more luxurious bedding.
Courtyard is gaining traction from reinvented hotels and new unit growth, and customers will be delighted by the brand’s contemporary new lobby design with its cutting-edgetechnology platform. Courtyard is growing dramatically outsidethe United States, entering new markets such as the CzechRepublic, El Salvador, Japan and Thailand.
Our moderate TownePlace Suites brand is reinventing itself to meet the needs of a growing segment of self-sufficient, value-conscious travelers on extended stays. Warm and functionallobbies with a floor-to-ceiling TowneMap® encourage guests togather and share great places to eat, shop and relax.
SpringHill Suites is evolving to capture the upper-moderatelifestyle category. It continues its rapid growth, with more than175 hotels across the United States and Canada at year-end2007 and more than 120 more in its pipeline, including thosethat combine lodging, retail and residential space.
Marriott International, Inc. 2007 15
2000 2001 2002 2003 2004 2005 2006
RETURN ON INVESTED CAPITAL (ROIC)FROM CONTINUING OPERATIONS
18%
9%
12%
12% 14
% 16%
22%
2007
25%
2000 2001 2002 2003 2004 2005 2006
LODGING ROOMS
(Excludes Ramada International franchised roomsas the brand was sold in 2004, and also excludes
corporate housing rental units.)
382,
599
417,
869
442,
926
465,
141
482,
186
499,
165
513,
832
2007
535,
093
2000 2001 2002 2003 2004 2005 2006
DILUTED EARNINGS PER SHAREFROM CONTINUING OPERATIONS
(Reflects the June 2006, two-for-one stock split.See Footnote No. 1, “Summary of SignificantAccounting Policies,” of our 2006 Form 10-K
for additional information.)
$0.9
6
$0.5
2
$ 0.
72
$0.7
7 $1.0
1 $1.1
7
$1.6
5
2007
$1.7
5

Fairfield Inn and Fairfield Inn & Suites is our fastest-growingbrand, rejuvenated by an aggressive “plant and prune” strategy.The brand expects to expand from more than 535 hotels atyear-end 2007 to 700 hotels over the next three years.
Fueling Our GrowthWhen the JW Marriott Hotel Beijing, designated our 3,000thhotel, opened this year, it symbolized the company’s tremen-dous global growth, especially in Asia. Both the JW MarriottHotel Beijing and The Ritz-Carlton, Beijing look forward towelcoming the world to China for the 2008 Olympic Games. We operate more than 30 hotels in China, and we expect toopen another 24 through 2010. In India, we have six hotels and 18 more scheduled to open through 2010. In Thailand, we have nine hotels and 12 more in our pipeline.
In the Middle East, including Egypt, we operate or franchise 28 hotels, with more than 25 in the pipeline.
The company’s worldwide pipeline of hotels under construc-tion, awaiting conversion or approved for development totalsapproximately 800 hotels and 125,000 rooms. More than 60 percent of our full-service pipeline is outside the UnitedStates. We expect to open 85,000 to 100,000 rooms from 2008 through 2010.
Our timeshare business continues to be a strong source ofrevenue across four brands, from traditional weekly vacationownership to fractional ownership. As the number of affluentU.S. households continues to rise, Marriott expects growth inthis category.
Customer loyalty remains high. Today, over 370,000 time-share owners possess an average of 1.3 weeks. Eighty percentof those owners redeem their investments for a “Marriott experi-ence” at one of our timeshare properties or Marriott-brandedhotels, or exchange them for Marriott Rewards points.
We have entered the Asian timesharing market with our AsiaPacific points program, providing leisure travelers in that rapidlygrowing region with more vacation opportunities. In 2008, weexpect contract sales at new properties to begin in Kauai,Hawaii; Orlando and Singer Island in Florida; and Lake Tahoe,Calif., where our Grand Residences by Marriott and Marriott’sTimber Lodge® were both recently recognized by Condé NastTraveler as among the top 50 ski hotels in North America.
Technology remains one of our strongest competitive advan-tages, especially when combined with our global distribution.Technology powers Marriott Rewards, our award-winning guestloyalty program with over 28 million members, and Marriott.com,one of the world’s top 10 retail Web sites, with $5.2 billion ingross revenue, including referrals to its customer care group.
Marriott.com is customized for nine countries, and is availableon your PDA or Internet-enabled phone.
By the end of 2009, we project that nearly all of our hotels in the United States will have high-definition flat-screen TVs. Ourunique plug-in panel, which is in 40,000 Marriott Hotels & Resortsand Renaissance rooms, enables guests to easily connect theiriPods, digital cameras, camcorders and laptops to the TV.
Connecting with our customers has never been moreimportant, and over the next three years, we are realigning oursales organization so that corporate and group customers canwork with a primary point of contact. This new structure willreduce duplication, enable us to call on more customers andhelp us serve them even better.
We are also in touch with more customers through socialmedia and online video. With nearly 350,000 visits to ourpodcast and blog, “Marriott on the Move,” we can interact withthousands of guests. Plus, people visiting the blog have bookedmore than $3 million in gross sales. We also have videos onYouTube.com, which is a fun way to learn about our company.
Sustaining Our ProgressSustainability means being a good corporate citizen andenvironmental steward, and promoting economic growth,diversity and inclusion in our communities worldwide. Guided by our Board of Directors, we have exceeded our objective to spend $1 billion with diverse suppliers three years ahead of schedule, and are expanding our efforts into the UnitedKingdom and Brazil. Through continued outreach, we now have nearly 450 hotels owned or under development by minorities and women—close to our goal of 500 by 2010.
In partnership with Conservation International, Marriott isramping up its efforts to integrate environmental and sustainablepractices into its business in 2008 in four key areas: supplychain; green buildings; waste, water and energy; and employeeand guest engagement. This strategy builds on the company’sestablished plans to get greener, including an effort to reducegreenhouse gases by nearly 415,000 metric tons by 2010. Atour headquarters building, we have become waste neutralthrough an aggressive recycling and composting program, andby replacing 20 tons of Styrofoam and plastic a year withbiodegradable products.
The Future BeckonsOur ability to grow, innovate and deliver superb service, combinedwith our tested, highly successful business model, positions usto perform well in a wide range of economic scenarios. We’relooking forward to our future—the best is yet to come.
J.W. Marriott, Jr.Chairman andChief Executive Officer
William J. ShawPresident and Chief Operating Officer
16 Marriott International, Inc. 2007

FORWARD-LOOKING STATEMENTSWe make forward-looking statements in Management’sDiscussion and Analysis of Financial Condition and Results ofOperations and elsewhere in this report based on the beliefsand assumptions of our management and on informationcurrently available to us. Forward-looking statements includeinformation about our possible or assumed future results ofoperations which follow under the headings “Business andOverview,” “Liquidity and Capital Resources,” and otherstatements throughout this report preceded by, followed byor that include the words “believes,” “expects,” “anticipates,”“intends,” “plans,” “estimates” or similar expressions.
Forward-looking statements are subject to a number ofrisks and uncertainties that could cause actual results to dif-fer materially from those expressed in these forward-lookingstatements, including the risks and uncertainties describedbelow and other factors we describe from time to time in ourperiodic filings with the SEC. We therefore caution you not torely unduly on any forward-looking statements. The forward-looking statements in this report speak only as of the date of this report, and we undertake no obligation to update orrevise any forward-looking statement, whether as a result ofnew information, future developments or otherwise.
RISKS AND UNCERTAINTIESWe are subject to various risks that could have a negativeeffect on the Company and its financial condition. You shouldunderstand that these risks could cause results to differmaterially from those expressed in forward-looking state-ments contained in this report and in other Company com-munications. Because there is no way to determine inadvance whether, or to what extent, any present uncertaintywill ultimately impact our business, you should give equalweight to each of the following:
Lodging Industry RisksThe lodging industry is highly competitive, which mayimpact our ability to compete successfully with otherhotel and timeshare properties for customers. We gener-ally operate in markets that contain numerous competitors.
Each of our hotel and timeshare brands competes with majorhotel chains in national and international venues and withindependent companies in regional markets. Our ability toremain competitive and to attract and retain business andleisure travelers depends on our success in distinguishing the quality, value, and efficiency of our lodging products andservices from those offered by others. If we are unable tocompete successfully in these areas, this could limit ouroperating margins, diminish our market share, and reduceour earnings.
We are subject to the range of operating riskscommon to the hotel, timeshare, and corporate apart-ment industries. The profitability of the hotels, vacationtimeshare resorts, and corporate apartments that we operateor franchise may be adversely affected by a number of fac-tors, including:
(1) the availability of and demand for hotel rooms, time-share interval, fractional ownership and residentialproducts, and apartments;
(2) international, national, and regional economic andgeopolitical conditions;
(3) the impact of war, actual or threatened terrorist activityand heightened travel security measures instituted inresponse to war, terrorist activity or threats;
(4) the desirability of particular locations and changes intravel patterns;
(5) travelers’ fears of exposure to contagious diseases,such as Avian Flu and Severe Acute RespiratorySyndrome (“SARS”);
(6) the occurrence of natural disasters, such as earth-quakes, tsunamis, and hurricanes;
(7) taxes and government regulations that influence ordetermine wages, prices, interest rates, constructionprocedures, and costs;
(8) the availability and cost of capital to allow us andpotential hotel owners and joint venture partners tofund investments;
(9) regional and national development of competingproperties;
Marriott International, Inc. 2007 17
Risk Factors
Financial ReviewRisk Factors ............................................................................. 17
Management’s Discussion and Analysis of Financial Condition and Results of Operations..................... 21
Financial Statements................................................................ 43
Notes to Financial Statements................................................. 47
Shareholder Return Performance Graph ................................. 69
Quarterly Financial Data........................................................... 70
Selected Historical Financial Data ........................................... 71
Non-GAAP Financial Measure Reconciliation ......................... 72
Management’s Reports............................................................ 73
Reports of Independent Registered Public Accounting Firm ......................................................... 74
Directors and Officers .............................................................. 76
Corporate Information.............................................................. 77

(10) increases in wages and other labor costs, energy,healthcare, insurance, transportation and fuel, andother expenses central to the conduct of our busi-ness, including recent increases in energy costs; and
(11) organized labor activities, which could cause thediversion of business from hotels involved in labornegotiations, loss of group business, and/orincreased labor costs.
Any one or more of these factors could limit or reducethe demand or the prices we are able to obtain for hotelrooms, timeshare units, residential units, and corporateapartments or could increase our costs and thereforereduce the profit of our lodging businesses. Reduceddemand for hotels could also give rise to losses underloans, guarantees, and minority equity investments that wehave made in connection with hotels that we manage. Evenwhere such factors do not reduce demand, our profit mar-gins may suffer if we are unable to fully recover increasedoperating costs from our customers.
The uncertain environment in the lodging industrywill continue to impact our financial results and growth.Both the Company and the lodging industry were hurt byseveral events occurring over the last several years, includingthe global economic downturn, the terrorist attacks on NewYork and Washington in September 2001, the global out-break of SARS in 2003, and military action in Iraq. Althoughby 2007 both the lodging and travel industries had recoveredfrom the depressed levels during those years, recent con-cerns over the possibility of an economic slowdown have leftit unclear whether the recent growth environment will con-tinue. Accordingly, our financial results and growth could beharmed if the industry recovery stalls or is reversed.
Operational RisksOur new branded hotel products may not be successful.We recently announced two new branded hotel products,Nickelodeon Resorts by Marriott® and EditionSM, and maylaunch additional branded hotel products in the future. Wecannot assure that these brands will be accepted by hotelowners, potential franchisees, or the traveling public, that wewill recover the costs we incurred in developing the brands,or that the brands will be successful. In addition, each ofthese new brands involves cooperation and/or consultationwith a third party, including some shared control over prod-uct design and development, sales and marketing and brandstandards. Disagreements between us and these third par-ties regarding areas of consultation or shared control couldslow the development of these new brands and/or impairMarriott’s ability to take actions it believes to be advisable forthe success and profitability of such brands.
Our lodging operations are subject to international,national, and regional conditions. Because we conductour business on a national and international platform, ouractivities are susceptible to changes in the performance ofregional and global economies. In recent years, our businesswas hurt by decreases in travel resulting from recent eco-nomic conditions, the military action in Iraq, and the height-ened travel security measures that have resulted from the
threat of further terrorism. Our future economic performanceis similarly subject to the uncertain economic environment inthe United States and other regions, the resulting unknownpace of business travel, and the occurrence of any futureincidents in the countries where we operate.
Risks relating to natural disasters, contagious disease,terrorist activity, and war could reduce the demand forlodging, which may adversely affect our revenues. Socalled “Acts of God,” such as hurricanes, earthquakes andother natural disasters, and the spread of contagious dis-eases, such as Avian Flu and SARS, in locations where weown, manage or franchise significant properties, and areas ofthe world from which we draw a large number of customerscan cause a decline in the level of business and leisure traveland reduce the demand for lodging. Actual or threatenedwar, terrorist activity, political unrest, civil strife, and othergeopolitical uncertainty can have a similar effect. Any one or more of these events may reduce the overall demand forhotel rooms, timeshare units, and corporate apartments orlimit the prices that we are able to obtain for them, both ofwhich could adversely affect our profits.
We may have disputes with the owners of the hotelsthat we manage or franchise. Consistent with our focuson management and franchising, we own very few of ourlodging properties. The nature of our responsibilities underour management agreements to manage each hotel andenforce the standards required for our brands under bothmanagement and franchise agreements may be subject tointerpretation and may give rise to disagreements in someinstances. We seek to resolve any disagreements in order to develop and maintain positive relations with current andpotential hotel owners and joint venture partners but havenot always been able to do so. Failure to resolve such dis-agreements has in the past resulted in litigation, and coulddo so in the future.
Damage to or other potential losses involvingproperties that we own, manage or franchise may notbe covered by insurance. We have comprehensive prop-erty and liability insurance policies with coverage featuresand insured limits that we believe are customary. Marketforces beyond our control may nonetheless limit the scopeof insurance coverage that we can obtain and our ability toobtain coverage at reasonable rates. Certain types of losses,generally of a catastrophic nature, such as earthquakes,hurricanes and floods, or terrorist acts, may be uninsurableor too expensive to justify obtaining insurance. As a result,we may not be successful in obtaining insurance withoutincreases in cost or decreases in coverage levels. In addi-tion, in the event of a substantial loss, the insurance cover-age we carry may not be sufficient to pay the full marketvalue or replacement cost of our lost investment or that ofhotel owners or in some cases could result in certain lossesbeing totally uninsured. As a result, we could lose some orall of the capital we have invested in a property, as well asthe anticipated future revenue from the property, and wecould remain obligated for guarantees, debt, or other finan-cial obligations related to the property.
18 Marriott International, Inc. 2007

Development and Financing RisksOur growth strategy depends upon third-partyowners/operators, and future arrangements with thesethird parties may be less favorable. Our present growthstrategy for development of additional lodging facilities entailsentering into and maintaining various arrangements withproperty owners. The terms of our management agreements,franchise agreements, and leases for each of our lodgingfacilities are influenced by contract terms offered by our com-petitors, among other things. We cannot assure you that anyof our current arrangements will continue or that we will beable to enter into future collaborations, renew agreements, orenter into new agreements in the future on terms that are asfavorable to us as those that exist today.
Our ability to grow our management and franchisesystems is subject to the range of risks associated withreal estate investments. Our ability to sustain continuedgrowth through management or franchise agreements fornew hotels and the conversion of existing facilities to man-aged or franchised Marriott brands is affected, and maypotentially be limited, by a variety of factors influencing realestate development generally. These include site availability,financing, planning, zoning and other local approvals, andother limitations that may be imposed by market and sub-market factors, such as projected room occupancy, changesin growth in demand compared to projected supply, territorialrestrictions in our management and franchise agreements,costs of construction, and anticipated room rate structure.
We depend on capital to buy and maintain hotels,and hotel owners or we may be unable to access capitalwhen necessary. In order to fund new hotel investments, as well as refurbish and improve existing hotels, both theCompany and current and potential hotel owners must peri-odically spend money. The availability of funds for newinvestments and maintenance of existing hotels depends inlarge measure on capital markets and liquidity factors overwhich we can exert little control. Our ability to recover loanand guarantee advances from hotel operations or from own-ers through the proceeds of hotel sales, refinancing of debtor otherwise may also affect our ability to recycle and raisenew capital. In addition, downgrades of our public debt rat-ings by Standard & Poor’s, Moody’s Investor Service or simi-lar companies could increase our cost of capital.
Further volatility in the credit markets couldadversely impact our ability to sell the loans that ourTimeshare business generates. Our Timeshare businessprovides financing to purchasers of our timeshare and frac-tional properties, and we periodically sell interests in thoseloans in the securities markets. While we do not believe thatrecent volatility in the credit markets will prevent us from con-tinuing to sell those notes on attractive terms, further volatilitycould cause future sale terms to be materially less favorableto us or prevent us from selling our timeshare notes entirely,which in turn would reduce future gains and could result inincreased borrowings to provide capital to replace antici-pated proceeds from such sales.
Our development activities expose us to project cost, completion, and resale risks. We develop new hotel,
timeshare interval, fractional ownership, and residential prop-erties, both directly and through partnerships, joint ventures,and other business structures with third parties. Our involve-ment in the development of properties presents a number ofrisks, including that: (1) construction delays, cost overruns, or so called “Acts of God” such as earthquakes, hurricanes,floods or fires may increase overall project costs or result inproject cancellations; (2) we may be unable to recover devel-opment costs we incur for projects that are not pursued tocompletion; (3) conditions within capital markets may limitour ability, or that of third parties with whom we do business,to raise capital for completion of projects that have com-menced or development of future properties; and (4) proper-ties that we develop could become less attractive due tochanges in mortgage rates, market absorption or oversupply,with the result that we may not be able to sell such proper-ties for a profit or at the prices or selling pace we anticipate.
Development activities that involve our co-investmentwith third parties may result in disputes that couldincrease project costs, impair project operations, orincrease project completion risks. Partnerships, joint ven-tures, and other business structures involving our co-invest-ment with third parties generally include some form of sharedcontrol over the operations of the business and create addi-tional risks, including the possibility that other investors insuch ventures could become bankrupt or otherwise lack thefinancial resources to meet their obligations, or could have or develop business interests, policies or objectives that areinconsistent with ours. Although we actively seek to minimizesuch risks before investing in partnerships, joint ventures orsimilar structures, actions by another investor may presentadditional risks of project delay, increased project costs, oroperational difficulties following project completion.
Risks associated with development and sale of resi-dential properties that are associated with our lodgingand timeshare properties or brands may reduce ourprofits. In certain hotel and timeshare projects we partici-pate, through minority interests and/or licensing fees, in thedevelopment and sale of residential properties associatedwith our brands, including luxury residences, and condo-miniums under our Ritz-Carlton and Marriott brands. Suchprojects pose additional risks beyond those generally associ-ated with our lodging and timeshare businesses, which mayreduce our profits or compromise our brand equity, includingthe following:
3 Decreases in residential real estate and vacation homeprices or demand generally, which have historicallybeen cyclical, could reduce our profits or even result inlosses on residential sales, result in significant carryingcosts if the pace of sales is slower than we anticipate,or make it more difficult to convince future hotel devel-opment partners of the value added by our brands;
3 Increases in interest rates, reductions in mortgageavailability, or increases in the costs of residential own-ership could prevent potential customers from buyingresidential products or reduce the prices they are will-ing to pay; and
Marriott International, Inc. 2007 19

3 Residential construction may be subject to warrantyand liability claims, and the costs of resolving suchclaims may be significant.
Technology, Information Protection, and Privacy RisksA failure to keep pace with developments in technologycould impair our operations or competitive position. Thelodging and timeshare industries continue to demand the useof sophisticated technology and systems, including thoseused for our reservation, revenue management and propertymanagement systems, our Marriott Rewards program, andtechnologies we make available to our guests. These tech-nologies and systems must be refined, updated, and/orreplaced with more advanced systems on a regular basis. If we are unable to do so as quickly as our competitors orwithin budgeted costs and time frames, our business couldsuffer. We also may not achieve the benefits that we antici-pate from any new technology or system, and a failure to do so could result in higher than anticipated costs or couldimpair our operating results.
An increase in the use of third-party Internet reser-vation services could adversely impact our revenues.Some of our hotel rooms are booked through Internet travelintermediaries, such as Expedia.com®, Travelocity.com®,and Priceline.com®, serving both the leisure and, increas-ingly, the corporate travel and group meeting sectors. WhileMarriott’s Look No Further® Best Rate Guarantee hasgreatly reduced the ability of these Internet travel intermedi-aries to undercut the published rates at our hotels, theseintermediaries continue their attempts to commoditize hotelrooms by aggressively marketing to price-sensitive travelersand corporate accounts and increasing the importance ofgeneral indicators of quality (such as “three-star downtownhotel”) at the expense of brand identification. These agen-cies hope that consumers will eventually develop brand loy-alties to their travel services rather than to our lodgingbrands. Although we expect to continue to maintain andeven increase the strength of our brands in the online mar-ketplace, if the amount of sales made through Internetintermediaries increases significantly, our business and prof-itability may be harmed.
Failure to maintain the integrity of internal or cus-tomer data could result in faulty business decisions,damage of reputation and/or subject us to costs, finesor lawsuits. Our businesses require collection and retentionof large volumes of internal and customer data, includingcredit card numbers and other personally identifiable informa-tion of our customers as they are entered into, processed by,summarized by, and reported by our various information sys-tems. We also maintain personally identifiable informationabout our employees. The integrity and protection of thatcustomer, employee, and company data is critical to us. Ifthat data is not accurate or complete we could make faultydecisions. Our customers also have a high expectation thatwe will adequately protect their personal information, and the
regulatory environment surrounding information security andprivacy is increasingly demanding, both in the U.S. and otherinternational jurisdictions in which we operate. A significanttheft, loss or fraudulent use of customer, employee or com-pany data could adversely impact our reputation and couldresult in remedial and other expenses, fines and litigation.
Changes in privacy law could adversely affect ourability to market our products effectively. Our Timesharesegment, and to a lesser extent our other lodging segments,rely on a variety of direct marketing techniques, includingtelemarketing, email marketing, and postal mailings. Any further restrictions in laws such as the Telemarketing SalesRule, CANSPAM Act, and various U.S. state laws, or newfederal laws, regarding marketing and solicitation or interna-tional data protection laws that govern these activities couldadversely affect the continuing effectiveness of telemarket-ing, email, and postal mailing techniques and could forcefurther changes in our marketing strategy. If this occurs, wemay not be able to develop adequate alternative marketingstrategies, which could impact the amount and timing of oursales of timeshare units and other products. We also obtainaccess to potential customers from travel service providersor other companies with whom we have substantial relation-ships and market to some individuals on these lists directlyor by including our marketing message in the other com-pany’s marketing materials. If the acquisition of these listswas prohibited or otherwise restricted, our ability to developnew customers and introduce them to our products couldbe impaired.
Other RisksIf we cannot attract and retain talented associates ourbusiness could suffer. We compete with other companiesboth within and outside of our industry for talented person-nel. If we are not able to recruit, train, develop and retain suf-ficient numbers of talented associates, we could experienceincreased associate turnover, decreased guest satisfaction,low morale, inefficiency or internal control failures. Insufficientnumbers of talented associates could also limit our ability togrow and expand our businesses.
Delaware law and our governing corporate docu-ments contain, and our Board of Directors could imple-ment, anti-takeover provisions that could deter takeoverattempts. Under the Delaware business combination statute,a stockholder holding 15 percent or more of our outstandingvoting stock could not acquire us without Board of Director’sconsent for at least three years after the date the stockholderfirst held 15 percent or more of the voting stock. Our govern-ing corporate documents also, among other things, requiresupermajority votes in connection with mergers and similartransactions. In addition, our Board of Directors could, with-out stockholder approval, implement other anti-takeoverdefenses, such as a stockholder rights plan to replace theexisting stockholder’s rights plan that will expire in March2008 and which we do not presently plan to renew.
20 Marriott International, Inc. 2007

BUSINESS AND OVERVIEWWe are a worldwide operator and franchisor of 2,999 properties(535,093 rooms) and related facilities. The figures in the precedingsentence are as of year-end 2007 and include 21 home and condo-minium projects (1,916 units) for which we manage the relatedowners’ associations. In addition, we provided 2,156 furnished cor-porate housing rental units, which are not included in the totals.
Our operations are grouped into five business segments: NorthAmerican Full-Service Lodging, North American Limited-ServiceLodging, International Lodging, Luxury Lodging, and Timeshare. Weoperate, develop, and franchise under 19 separate brand names in68 countries and territories.
We earn base, incentive, and franchise fees based upon theterms of our management and franchise agreements. Revenues arealso generated from the following sources associated with ourTimeshare segment: (1) selling timeshare interval, fractional owner-ship, and residential properties; (2) operating the resorts and residen-tial properties; and (3) financing customer purchases of timesharingintervals. We earn revenues from the limited number of hotels weown or lease. Finally, we earn fees in association with affinity cardendorsements and the sale of branded residential real estate.
We sell residential real estate in conjunction with luxury hoteldevelopment (Ritz-Carlton-Residential) and Timeshare segmentprojects (Ritz-Carlton Club-Residential and Grand Residences byMarriott-Residential). Our Timeshare segment residential projectsare typically opened over time with limited inventory available at anyone time. Residences developed in conjunction with hotels are typi-cally constructed and sold by hotel owners with limited amounts, ifany, of our capital at risk. While the worldwide residential market isvery large, the luxurious nature of our residential properties, thequality and exclusivity associated with our brands, and the hospital-ity services that we provide, all serve to make our residential proper-ties distinctive.
Generally, lodging demand remained strong through 2007, drivenby continued strength associated with worldwide business travel. Ingeneral, luxury, international, and full-service properties experiencedstronger demand than limited-service properties. Strong demandenabled us to increase rates at the property level, which resulted insolid year-over-year RevPAR increases. Revenue mix improvement isa function of the strong demand environment and results as someless profitable business is limited in favor of more profitable business,such as fewer discounted leisure packages in favor of more corpo-rate business. This strategy of shifting business to higher rated tiers,yielded strong year-over-year average daily rate growth and onlymodest occupancy declines. In addition, group rates continue toincrease as business negotiated in earlier years at lower rates isreplaced with business negotiated at higher rates.
Demand for our brands is strong in many markets around theworld. For our North American comparable properties, RevPARincreases in 2007, as compared to the year-ago period, were par-ticularly strong in Dallas, New York City, Los Angeles, and SanFrancisco. Internationally, 2007 RevPAR increases as compared to the prior year were particularly strong in Central and South EastAsia, South America, the Middle East, and Eastern Europe.
Our approach to improving property-level and above-propertyproductivity has benefited our profitability, as well as that of ownersand franchisees. Driving room rate improvement, benchmarking suc-cessful performance, and leveraging our size have all contributed to
property-level margin improvements and higher incentive manage-ment fees to us. We continue to enhance the appeal of our propri-etary Web site, www.Marriott.com, through functionality and serviceimprovements, and we continue to capture an increasing proportionof property-level reservations via this cost-efficient channel.
Our brands are strong as a result of superior customer servicewith an emphasis on guest and associate satisfaction, the world-wide presence and quality of our brands, our Marriott Rewards loy-alty program, an information-rich and easy-to-use Web site, amulti-channel central reservations system, and desirable propertyamenities. We, along with owners and franchisees, continue toinvest in our brands by means of new, refreshed, and reinventedproperties, new room and public space designs and enhancedamenities and technology offerings.
In 2007, we announced our agreement with the Nickelodeon divi-sion of Viacom, Inc. and Miller Global Properties, LLC to co-develop anew lodging resort brand and concept for travelers seeking fun andadventure, “Nickelodeon Resorts by Marriott.” Also during 2007, weannounced our agreement with Ian Schrager to create a global bou-tique lifestyle hotel brand “Edition” on a large scale.
See the “Risk Factors” of this report for important informationregarding forward-looking statements made in this report and risksand uncertainties that the Company faces.
CONSOLIDATED RESULTSThe following discussion presents an analysis of results of our oper-ations for 2007, 2006, and 2005.
Continuing Operations
Revenues2007 COMPARED TO 2006Revenues increased by $995 million (8 percent) to $12,990 millionin 2007 from $11,995 million in 2006, as a result of strongerdemand for hotel rooms worldwide, which allowed us to increaseroom rates and favorable exchange rates worldwide. Base manage-ment and franchise fees increased by $116 million as a result ofstronger RevPAR and unit growth, as we opened 203 properties(29,200 rooms) throughout 2007. In 2006, we recognized $5 millionof base management fees that were calculated based on prior peri-ods’ results, but not earned and due until 2006, versus no similarfees in 2007. Incentive management fees increased by $88 milliondue to stronger RevPAR and property-level margin improvementsassociated with room rate increases and productivity improvements.Incentive management fees included $17 million and $10 million for2007 and 2006, respectively, that were calculated based on priorperiods’ results, but not earned and due until the periods in whichthey were recognized. Furthermore, incentive management fees for2007 included $13 million and base management fees for 2007included $6 million of business interruption insurance proceedsassociated with hurricanes in prior years compared to $1 million of business interruption insurance proceeds received in 2006.Stronger catering, food and beverage, spa, and other profits alsodrove property-level margins higher. Year-over-year RevPARincreases were driven primarily by rate increases.
Timeshare sales and services revenue increased by $170 million(11 percent) in 2007 over the prior year. The increase largelyreflected development revenue increases over the prior year as some
Marriott International, Inc. 2007 21
Management’s Discussion and Analysis of Financial Condition and Results of Operations

newer projects reached revenue recognition thresholds. In 2006,some projects were in the early stages of development and did notreach revenue recognition thresholds until 2007. The increase in rev-enue also reflects increased services and financing revenue.
Owned, leased, corporate housing and other revenue increasedby $121 million (11 percent). The increase largely reflected strongerRevPAR and the mix of owned and leased properties in 2007, ascompared to 2006, and to a lesser extent, higher fees associatedwith affinity card endorsements and the sale of branded residentialreal estate, offset by the recognition of $19 million of hotel manage-ment and franchise agreement termination fees in 2007, as com-pared to the recognition of $26 million of such fees in 2006.
The $995 million increase in total revenue includes $500 million of increased cost reimbursements revenue, to $8,575 million in 2007from $8,075 million in the prior year. This revenue represents reim-bursements of costs incurred on behalf of managed and franchisedproperties and relates, predominantly, to payroll costs at managedproperties where we are the employer. As we record cost reimburse-ments based upon the costs incurred with no added markup, thisrevenue and related expense have no impact on either our operatingincome or net income. The increase in reimbursed costs is primarilyattributable to wage increases, sales growth, and the growth in thenumber of properties we manage. We added 15 managed proper-ties (4,870 rooms) and 138 franchised properties (15,963 rooms) toour system in 2007, net of properties exiting the system.
2006 COMPARED TO 2005Revenues increased by $866 million (8 percent) to $11,995 millionin 2006 from $11,129 million in 2005, as a result of strongerdemand for hotel rooms worldwide. Base management and fran-chise fees increased by $117 million as a result of stronger RevPARand unit growth. In 2006, we recognized $5 million of base man-agement fees that were calculated based on prior periods’ results,but not earned and due until 2006. Incentive management feesincreased by $80 million due to stronger RevPAR and property-levelmargin improvements associated with room rate increases and pro-ductivity improvements. Incentive management fees include $10million and $14 million for 2006 and 2005, respectively, that werecalculated based on prior periods’ earnings but not earned and dueuntil the periods in which they were recognized. Stronger catering,food and beverage, spa, and other profits also drove property-levelmargins higher. Year-over-year RevPAR increases were driven pri-marily by rate increases. Owned and leased revenue increased sig-nificantly, primarily as a result of our purchase, early in the secondhalf of 2005, of 13 formerly managed properties from CTF HoldingsLtd. (“CTF”). See Footnote No. 8, “Acquisitions and Dispositions,”later in this report for a detailed description of the CTF transaction.As planned, eight of the CTF properties were sold during 2006: oneproperty was sold in the first quarter; five properties were sold in thesecond quarter; and two properties were sold in the third quarter.
Timeshare sales and services revenue increased by $90 million(6 percent) over the prior year. The increase largely reflects $77 mil-lion of revenue in 2006 from note securitization gains. As detailedlater in the “Cumulative Effect of Change in Accounting Principle”narrative, note securitization gains of $69 million for 2005 are notreflected in revenue, but instead are a component of gains andother income. Additionally, financing and services revenue increasedin 2006 versus the prior year, as did villa rental revenue. Partially off-setting these increases, development revenue declined due to proj-ects in the early stages of development that did not reach revenuerecognition thresholds and limited available inventory associatedwith projects that sold out or were nearing sell-out.
The $866 million increase in total revenue includes $404 millionof increased cost reimbursements revenue, to $8,075 million in
2006 from $7,671 million in the prior year. The increase in reim-bursed costs is primarily attributable to the growth in the number ofproperties we manage and to wage increases. We added 13 man-aged properties (4,126 rooms) and 77 franchised properties (11,286rooms) to our system in 2006, net of properties exiting the system.
Operating Income2007 COMPARED TO 2006Operating income increased by $101 million (9 percent) to $1,188million in 2007 from $1,087 million in the prior year. The increase inoperating income reflects stronger combined base management,incentive management, and franchise fees of $204 million, partiallyoffset by higher general, administrative, and other expenses of $91million, lower Timeshare sales and services revenue net of directexpenses of $7 million, and lower owned, leased, corporate hous-ing, and other revenue net of direct expenses of $5 million.
The combined base management, incentive management, andfranchise fees increase of $204 million reflected strong RevPARgrowth, unit growth, and property-level margin improvements andfavorable exchange rates worldwide. In 2006, we recognized $5 mil-lion of base management fees that were calculated based on priorperiods’ results, but not earned and due until 2006, versus no similarfees in 2007. Incentive management fees included $17 million and$10 million for 2007 and 2006, respectively, that were calculatedbased on prior periods’ results, but not earned and due until theperiods in which they were recognized. Furthermore, incentive man-agement fees for 2007 included $13 million and base managementfees included $6 million of business interruption insurance proceedsassociated with hurricanes in prior years compared to $1 million ofbusiness interruption insurance proceeds received in 2006.
As compared to the year-ago period, general, administrative,and other expenses increased by $91 million (13 percent) from$677 million in 2006 to $768 million in 2007. In 2007, we incurred a$35 million charge related to excise taxes associated with the set-tlement of issues raised during the Internal Revenue Service andDepartment of Labor examination of our employee stock ownershipplan (“ESOP”) feature of our Employees’ Profit Sharing, Retirementand Savings Plan and Trust (the “Plan”). See Footnote No. 3,“Income Taxes,” for additional information on the ESOP settlement.Additionally, the increase was attributable to, among other things,increased costs related to our unit growth, development and sys-tems improvements, increased legal expenses, and increased otheradministrative costs. Also unfavorably impacting general, adminis-trative, and other expenses, when compared to the prior year, wereforeign exchange losses totaling $2 million in 2007 as compared toforeign exchange gains of $6 million in 2006 and $1 million of guar-antee charges in 2007 while the year-ago period reflected $6 millionof guarantee reversals. Partially offsetting the aforementionedincreases were $4 million of lower hotel operating agreement per-formance cure payments in 2007 as compared to 2006 and a $9million reversal in 2007 of reserves that were no longer required.Increased legal expenses in 2007 include charges associated withlitigation and other legal matters. Of the $91 million increase in totalgeneral, administrative, and other expenses, an increase of $13 mil-lion was attributable to our Lodging segments and a $78 millionincrease was unallocated.
Timeshare sales and services revenue net of direct expenses of$350 million decreased by $7 million, as compared to the prior year,primarily reflecting flat development revenue net of product costsand marketing and selling costs and $12 million of increased financ-ing revenue net of financing expenses, more than offset by thereversal in 2006 of $15 million reversal of contingency reserves and$4 million of lower services revenue net of services expenses. Flat
22 Marriott International, Inc. 2007

development revenue net of product costs and marketing and sell-ing costs reflected newer projects that reached reportability thresh-olds in 2007, offset by several other projects that were approachingsell-out. The increase in financing revenue net of financing costs pri-marily reflects increased accretion, interest income, and higher notesale gains in 2007, as compared to 2006.
The $5 million decrease in owned, leased, corporate housing,and other revenue net of direct expenses reflected $19 million inhotel management and franchise agreement termination feesreceived in 2007, as compared to $26 million in 2006. Depreciationcharges totaling $8 million were recorded in 2007 associated withone owned property that was reclassified from “held for sale” to“held and used” during 2007 as compared to depreciation chargesrecorded in 2006 of $7 million associated with two properties thatwere reclassified from “held for sale” to “held and used.” Partiallyoffsetting the aforementioned decreases in owned, leased, corpo-rate housing, and other revenue net of direct expenses was thefavorable impact of $4 million associated with both the strongerdemand environment in 2007 and the impact of the sale and pur-chase of several properties.
2006 COMPARED TO 2005Operating income increased by $388 million (56 percent) to $1,087million in 2006 from $699 million in the prior year. The increase in2006 is, in part, due to a combined base management, franchise,and incentive management fee increase of $197 million, reflectingstronger RevPAR growth, unit growth, and property-level marginimprovements. Stronger owned, leased, corporate housing, andother revenue net of direct expenses contributed $17 million of theimprovement in operating income and reflected the strong demandenvironment in 2006 and the impact of the CTF hotel propertiesacquired in 2005. The $17 million improvement in 2006 versus theprior year reflects increased owned and leased results of $20 million,a $12 million increase in hotel management and franchise agreementtermination fees received and $5 million of higher other income, par-tially offset by $20 million of lower land lease income. Also reflectedin the year-over-year change in owned and leased results are depre-ciation charges totaling $7 million recorded in 2006 associated withtwo properties that were reclassified in 2006 from “held for sale” to“held and used.” The depreciation charges totaling $7 million repre-sented the amount that would have been recognized had the twoproperties been continuously classified as “held and used.”
Timeshare sales and services revenue net of direct expensesincreased by $98 million (38 percent) in 2006 and largely reflects$77 million of revenue in 2006 from note securitization gains. Asnoted earlier in the “Revenue” discussion, note securitization gainsof $69 million for 2005 are not reflected in revenue, but instead area component of gains and other income. Also reflected in the $98million favorable variance, development revenue net of expensesincreased by $14 million and financing, services and other revenuenet of expenses increased by $7 million. Increased developmentrevenue net of expenses primarily reflects lower developmentexpenses associated with projects in 2006 in the early stages ofdevelopment that did not reach revenue recognition thresholds andthe timing of expenses associated with Statement of Position 04-2,“Accounting for Real Estate Time-Sharing Transactions” (“SOP 04-2”),implemented in 2006. Increased financing, services and other rev-enue net of expenses reflects a $15 million reversal of marketingrelated contingency reserves in 2006.
As compared to the year-ago period, general, administrative,and other expenses decreased by $76 million (10 percent) to $677million in 2006 from $753 million in 2005. In 2005, we incurred gen-eral, administrative, and other expenses of $94 million primarily due
to the non-cash write-off of deferred contract acquisition costsassociated with the termination of management agreements result-ing from the CTF transaction. We also incurred general, administra-tive, and other expenses of $30 million in 2005 associated with ourbedding incentive program. We implemented the bedding incentiveprogram in the 2005 second quarter to help ensure that guestscould enjoy the comfort and luxury of our new bedding by year-end2005. Further impacting general, administrative, and otherexpenses, 2005 reflected hotel operating agreement performancecure payments of $15 million versus a $6 million similar payment in2006, and 2005 also reflected $9 million of guarantee chargesassociated with three properties versus the reversal of an additional$5 million of guarantee charges in 2006. Additionally, impacting theyear-over-year general, administrative, and other expenses variancewere foreign exchange gains totaling $6 million in 2006 as com-pared to losses of $5 million in 2005. Also impacting the year-over-year change in general, administrative, and other expenses, anadditional $22 million reflects unit growth, systems improvements,higher program and joint venture development expenses, and cus-tomary increases in ordinary costs such as wages and benefits.Development expenses and deferred compensation expenses were higher in 2006 by $15 million and $5 million, respectively. As noted under the heading “New Accounting Standards” in the“Management’s Discussion and Analysis of Financial Condition and Results of Operations,” section of our 2006 Form 10-K, weadopted a new accounting standard in 2006 associated with share-based compensation. This new standard resulted in incrementalgeneral, administrative, and other expenses of $39 million versus2005, primarily impacting the unallocated portion of our general,administrative, and other expenses. Of the $76 million decrease intotal general, administrative, and other expenses, a decrease of$124 million was attributable to our Lodging segments and a $48million increase was unallocated.
Gains and Other Income (Expense)The table below shows our gains and other income for fiscal years2007, 2006, and 2005:
($ in millions) 2007 2006 2005
Timeshare note sale gains $— $ — $ 69Gains on sales of real estate and other 39 26 34Loss on expected land sale — (37) —Other note sale/repayment gains 1 2 25Gains on forgiveness of debt 12 — —Gain on sale/income on redemption of joint
venture and other investments 31 68 7Income from cost method joint ventures 14 15 14
$97 $ 74 $149
2007 COMPARED TO 2006The $12 million gain on forgiveness of debt for 2007 was associ-ated with government incentives. The loans were forgiven in recog-nition of our contribution to job growth and economic development.Gain on sale/income on redemption of joint venture and otherinvestments of $31 million in 2007 reflected an $18 million gainassociated with the sale of stock we held and net gains totaling $13million on the sale of joint venture investments. Gain on sale/incomeon redemption of joint venture and other investments of $68 millionin 2006 comprised $43 million of net gains associated with the saleof joint venture investments and the redemption of preferred stockwe held in one investee which generated a gain of $25 million.
Marriott International, Inc. 2007 23

2006 COMPARED TO 2005Gain on sale/income on redemption of joint venture and otherinvestments of $68 million in 2006 represents $43 million of netgains associated with the sale of joint venture and other invest-ments and $25 million of income associated with the redemption ofpreferred stock we held in one investee. As further explained in theearlier “Revenues” discussion for 2006, Timeshare segment notesale gains of $77 million in 2006 are presented in the “Timesharesales and services” revenue caption.
Interest Expense2007 COMPARED TO 2006Interest expense increased by $60 million (48 percent) to $184 mil-lion for 2007 from $124 million in 2006. Of the $60 million increaseover 2006, $78 million was due to: $26 million of higher interestreflecting a higher outstanding commercial paper balance, primarilydue to increased share repurchases and the ESOP settlement pay-ments, and related interest rates; $25 million of interest associatedwith our Series H Senior Notes issuance which occurred late in2006 and our Series I and Series J Senior Notes issuances whichoccurred in 2007; a charge of $13 million in 2007 related to theESOP settlement; charges totaling $53 million and $46 million in2007 and 2006, respectively, relating to interest on accumulatedcash inflows in advance of our cash outflows for various programsthat we operate on the owners’ behalf including Marriott Rewards,gift certificates, and self-insurance programs; interest totaling $5million associated with other additional debt; and the write off of $2 million of deferred financing costs associated with the refinanc-ing of our revolving credit agreement in 2007. See Footnote No. 3,“Income Taxes,” for additional information on the ESOP settlement.The increase in interest on the programs we operate on behalf ofthe owners over the year-ago period is attributable to higher liabilitybalances and higher interest rates. Partially offsetting the $78 millioninterest expense increases over 2006 was an $18 million favorablevariance to last year for higher capitalized interest associated withconstruction projects.
2006 COMPARED TO 2005Interest expense increased by $18 million (17 percent) to $124 mil-lion in 2006 from $106 million in 2005. Included within interestexpense for 2006 and 2005 are charges totaling $46 million and$29 million, respectively, relating to interest on accumulated cashinflows, in advance of our cash outflows for various programs thatwe operate on the owners’ behalf. The increase in interest on theseprograms over 2005 is related to higher liability balances and higherinterest rates. Interest expense also increased in 2006, due to ourJune 2005 Series F Notes issuance, our June 2006 Series H Notesissuance, and higher commercial paper balances coupled withhigher rates. Partially offsetting these increases were interestexpense declines associated with the payoff, at maturity, of bothour Series D Notes in April 2005 and Series B Notes in November2005, and the exchange of our Series C and Series E Notes forlower interest rate Series G Notes in 2005.
Interest Income, Provision for Loan Losses, andIncome Tax2007 COMPARED TO 2006Interest income, before the provision for loan losses, decreased by$11 million (22 percent) to $38 million in 2007 from $49 million in2006, primarily reflecting lower interest income associated withloans that have been repaid to us, partially offset by the impactassociated with new loan fundings.
Loan loss provisions increased by $20 million versus the prioryear primarily reflecting a $12 million charge associated with oneproperty and a $5 million charge to write off our remaining exposureassociated with our investment in a Delta Airlines, Inc. (“Delta”)lease versus loan loss reversals of $3 million in 2006. For additionalinformation regarding the Delta lease investment write-off, see the“Investment in Leveraged Lease” caption later in this report.
Our tax provision increased by $61 million (16 percent) from atax provision of $380 million in 2006 to a tax provision of $441 mil-lion in 2007 and reflected higher pretax income from our Lodgingsegments as well as a higher tax rate in 2007, primarily reflectingboth increased taxes associated with our international operationsand a less favorable mix of taxable earnings between countries.Increased taxes also reflect a charge for a German legislative taxchange in 2007, which had a one-time impact and $6 million oftaxes in 2007 associated with additional interest on the ESOP set-tlement. See Footnote No. 3, “Income Taxes,” for additional infor-mation on the ESOP settlement.
2006 COMPARED TO 2005Interest income, before the provision for loan losses, decreased by$30 million (38 percent) to $49 million in 2006 from $79 million in2005, primarily reflecting the impact of loans repaid to us in 2005.Loan loss provisions decreased by $31 million versus the prior yearreflecting the reversal of loan loss provisions totaling $3 million in2006 compared to a charge of $17 million in 2005 due to theimpairment of our Delta lease, see the “Investment in LeveragedLease” caption later in this report for additional information and an$11 million loan loss provision in 2005 associated with one property.
Our tax provision totaled $380 million in 2006 compared to a taxprovision of $284 million in 2005. The difference of $96 million isattributable to higher taxes in 2006 associated with higher pretaxincome from our lodging operations.
Equity in Earnings2007 COMPARED TO 2006Equity in earnings increased by $12 million from $3 million in 2006to $15 million in 2007 and reflected the mix of investments, com-pared to 2006, and stronger results at several joint ventures reflect-ing the strong lodging demand environment in 2007, for one jointventure, the reopening of a hotel, late in 2006, in Mexico, which hadbeen closed following a hurricane in 2005 and strong demand in2007 for our timeshare products in Hawaii.
2006 COMPARED TO 2005The $33 million decline from earnings of $36 million in 2005 toearnings of $3 million in 2006, attributable to our equity invest-ments, reflected the recognition in 2005 of $30 million of equityearnings from the sale of hotels by three equity joint ventures inwhich we had equity interests. In addition, since 2005 we have sold several equity joint ventures.
Income from Continuing Operations2007 COMPARED TO 2006Compared to 2006, income from continuing operations decreasedby $15 million (2 percent) to $697 million in 2007, and diluted earn-ings per share from continuing operations increased by $0.10 (6percent) to $1.75. As discussed in more detail in the preceding sec-tions beginning with “Operating Income,” the decrease versus theprior year is due to higher general, administrative, and otherexpenses ($91 million), higher taxes ($61 million), higher interestexpense ($60 million), higher loan loss provision ($20 million), lowerinterest income ($11 million), lower timeshare sales and services
24 Marriott International, Inc. 2007

revenue net of direct expenses ($7 million), and lower owned,leased, corporate housing, and other revenue net of directexpenses ($5 million). Partially offsetting these unfavorable varianceswere higher fee income ($204 million), higher gains and otherincome ($23 million), higher equity investment results ($12 million),and a higher minority interest benefit ($1 million).
2006 COMPARED TO 2005Compared to 2005, income from continuing operations increasedby $169 million (31 percent) to $712 million in 2006, and dilutedearnings per share from continuing operations increased by $0.48(41 percent) to $1.65. As discussed in more detail in the precedingsections beginning with “Operating Income,” the increase versusthe prior year is due to higher fee income ($197 million), highertimeshare sales and services revenue net of direct expenses ($98million), lower general, administrative, and other expenses ($76 mil-lion), a lower loan loss provision ($31 million), higher owned, leased,corporate housing, and other revenue net of direct expenses ($17million), and lower minority interest expense ($2 million). Partially offsetting these favorable variances, were significantly higher taxes($96 million), lower gains and other income ($75 million), lowerequity investment results ($33 million), lower interest income ($30million), and higher interest expense ($18 million).
Cumulative Effect of Change in Accounting Principle2006Statement of Position 04-2, “Accounting for Real EstateTime-Sharing Transactions”In December 2004, the Financial Accounting Standards Board(“FASB”) issued Financial Accounting Standards (“FAS”) No. 152,“Accounting for Real Estate Time-Sharing Transactions-an amend-ment of FASB Statements No. 66 and 67,” and the AmericanInstitute of Certified Public Accountants issued SOP 04-2. Addi-tionally, the FASB amended FAS No. 66, “Accounting for Sales ofReal Estate,” and FAS No. 67, “Accounting for Costs and InitialRental Operations of Real Estate Projects,” to exclude accountingfor real estate time-sharing transactions from these statements. We adopted SOP 04-2 at the beginning of the 2006 first quarter.
Under SOP 04-2, we charge the majority of sales and marketingcosts we incur to sell timeshares to expense when incurred. Wealso record an estimate of expected uncollectibility on notes receiv-able that we receive from timeshare purchasers as a reduction inrevenue at the time that we recognize profit on a timeshare sale.We also account for rental and other operations during holdingperiods as incidental operations, which requires us to record anyexcess of revenues over costs as a reduction of inventory costs.
The adoption of SOP 04-2 in 2006, which we reported as acumulative effect of change in accounting principle in ourConsolidated Statements of Income, resulted in a non-cash after-tax charge of $109 million ($0.25 per diluted share). The pretaxcharge totaled $173 million and comprised a $130 million inventorywrite-down, the establishment of a $25 million notes receivablereserve and an increase in current liabilities of $18 million.
We estimate that, for the 20-year period from 2008 through2027, the cost of completing improvements and currently plannedamenities for our owned timeshare properties will be approximately$1.7 billion.
Business SegmentsWe are a diversified hospitality company with operations in fivebusiness segments:
3 North American Full-Service Lodging, which includesMarriott Hotels & Resorts, Marriott Conference Centers,
JW Marriott Hotels & Resorts, Renaissance Hotels & Resorts,and Renaissance ClubSport properties located in the conti-nental United States and Canada;
3 North American Limited-Service Lodging, which includesCourtyard, Fairfield Inn, SpringHill Suites, Residence Inn,TownePlace Suites, and Marriott ExecuStay propertieslocated in the continental United States and Canada;
3 International Lodging, which includes Marriott Hotels &Resorts, JW Marriott Hotels & Resorts, Renaissance Hotels &Resorts, Courtyard, Fairfield Inn, Residence Inn, RamadaInternational, and Marriott Executive Apartments propertieslocated outside the continental United States and Canada;
3 Luxury Lodging, which includes The Ritz-Carlton andBulgari Hotels & Resorts properties worldwide; and
3 Timeshare, which includes the development, marketing,operation, and sale of timeshare, fractional ownership, andresidential properties worldwide under Marriott VacationClub, The Ritz-Carlton Club, Grand Residences by Marriott,and Horizons by Marriott Vacation Club.
In addition to the segments above, in 2007 we exited the syn-thetic fuel business, which was formerly a separate segment butwhich we now report under discontinued operations.
In addition to the brands noted above, in 2007 we announcedour new brand of family-friendly resorts and spas, “NickelodeonResorts by Marriott” and a new brand of lifestyle boutique hotels,“Edition.” At year-end 2007, no properties were yet open undereither brand.
In 2006, we analyzed our internal reporting process and imple-mented changes in the fourth quarter that were designed toimprove efficiency and, as part of this process, we evaluated theimpact on segment reporting. Accordingly, we now report five oper-ating segments, and no longer allocate indirect administrativeexpenses to our segments. We reflect this revised segment report-ing throughout this report for all periods presented, and presenthistorical figures in a manner that is consistent with the revised seg-ment reporting. See also the Form 8-K that we filed on March 19,2007, furnishing quarterly Revenues and Income from ContinuingOperations for each of 2006 and 2005 in the new segment format.
We evaluate the performance of our segments based primarilyon the results of the segment without allocating corporateexpenses, interest expense, indirect general, administrative, and otherexpenses, or income taxes. With the exception of the Timesharesegment, we do not allocate interest income to our segments.Because note sales are an integral part of the Timeshare segment,we include note sale gains in our Timeshare segment results. Weinclude interest income associated with Timeshare segment notesin our Timeshare segment results because financing sales are anintegral part of that segment’s operations. We also allocate othergains or losses as well as equity in earnings or losses from our jointventures and divisional general, administrative, and other expensesto each of our segments. “Other unallocated corporate” representsthat portion of our revenues, general, administrative, and otherexpenses, equity in earnings or losses, and other gains or lossesthat are not allocable to our segments.
We aggregate the brands presented within our North AmericanFull-Service, North American Limited-Service, International,Luxury, and Timeshare segments considering their similar eco-nomic characteristics, types of customers, distribution channels,the regulatory business environment of the brands and operationswithin each segment, and our organizational and managementreporting structure.
Marriott International, Inc. 2007 25

Total Lodging Products by SegmentAt year-end 2007, we operated or franchised the following properties by segment (excluding 2,156 corporate housing rental units):
Total Lodging ProductsProperties Rooms
U.S. Non-U.S. Total U.S. Non-U.S. Total
North American Full-Service Lodging Segment (1)
Marriott Hotels & Resorts 309 12 321 121,842 4,556 126,398Marriott Conference Centers 13 — 13 3,476 — 3,476JW Marriott Hotels & Resorts 15 — 15 7,901 — 7,901Renaissance Hotels & Resorts 70 3 73 25,942 1,034 26,976Renaissance ClubSport 1 — 1 175 — 175
408 15 423 159,336 5,590 164,926
North American Limited-Service Lodging Segment (1)
Courtyard 693 16 709 96,759 2,847 99,606Fairfield Inn 529 7 536 46,930 741 47,671SpringHill Suites 176 1 177 20,445 124 20,569Residence Inn 528 17 545 62,805 2,536 65,341TownePlace Suites 141 — 141 14,122 — 14,122
2,067 41 2,108 241,061 6,248 247,309
International Lodging Segment (1)
Marriott Hotels & Resorts 4 144 148 2,742 39,396 42,138JW Marriott Hotels & Resorts 1 22 23 387 8,244 8,631Renaissance Hotels & Resorts — 67 67 — 21,783 21,783Courtyard — 58 58 — 11,174 11,174Fairfield Inn — 1 1 — 206 206Residence Inn — 1 1 — 75 75Marriott Executive Apartments — 18 18 — 2,905 2,905Ramada International — 2 2 — 332 332
5 313 318 3,129 84,115 87,244
Luxury Lodging SegmentThe Ritz-Carlton 36 34 70 11,627 9,978 21,605Bulgari Hotels & Resorts — 2 2 — 117 117The Ritz-Carlton-Residential (2) 16 1 17 1,614 93 1,707
52 37 89 13,241 10,188 23,429
Timeshare Lodging Segment (3)
Marriott Vacation Club 37 9 46 8,987 1,909 10,896The Ritz-Carlton Club-Fractional 5 2 7 283 105 388The Ritz-Carlton Club-Residential (2) 2 1 3 138 6 144Grand Residences by Marriott-Fractional 1 1 2 199 49 248Grand Residences by Marriott-Residential (1), (2) 1 — 1 65 — 65Horizons by Marriott Vacation Club 2 — 2 444 — 444
48 13 61 10,116 2,069 12,185
Total 2,580 419 2,999 426,883 108,210 535,093
(1) North American includes properties located in the continental United States and Canada. International includes properties located outside the continental United States and Canada.(2) Represents projects where we manage the related owners’ association. Residential products are included once they possess a certificate of occupancy.(3) Includes resorts that are in active sales as well as those that are sold out. Products in active sales may not be ready for occupancy.
26 Marriott International, Inc. 2007

Revenues
($ in millions) 2007 2006 2005
North American Full-Service Segment $ 5,476 $ 5,196 $ 5,116
North American Limited-Service Segment 2,198 2,060 1,886
International Segment 1,594 1,411 1,017Luxury Segment 1,576 1,423 1,333Timeshare Segment 2,065 1,840 1,721
Total segment revenues 12,909 11,930 11,073Other unallocated corporate 81 65 56
$12,990 $11,995 $11,129
Income from Continuing Operations
($ in millions) 2007 2006 2005
North American Full-Service Segment $ 478 $ 455 $ 349
North American Limited-Service Segment 461 380 303
International Segment 271 237 133Luxury Segment 72 63 45Timeshare Segment 306 280 271
Total segment financial results 1,588 1,415 1,101Other unallocated corporate (287) (251) (219)Interest income, provision for loan
losses and interest expense (163) (72) (55)Income taxes (441) (380) (284)
$ 697 $ 712 $ 543
Equity in Earnings (Losses) of Equity Method Investees
($ in millions) 2007 2006 2005
North American Full-Service Segment $ 3 $ 2 $ 21
North American Limited-Service Segment 2 — (6)
International Segment 3 — 20Luxury Segment (4) (2) (1)Timeshare Segment 10 (2) 1
Total segment equity in earnings (losses) 14 (2) 35
Other unallocated corporate 1 5 1
$ 15 $ 3 $ 36
Our business includes our North American Full-Service, NorthAmerican Limited-Service, International, Luxury, and Timesharesegments. We consider total segment revenues and total segmentfinancial results to be meaningful indicators of our performancebecause they measure our growth in profitability and enableinvestors to compare the revenues and results of our operations to those of other lodging companies.
We consider RevPAR to be a meaningful indicator of our per-formance because it measures the period-over-period change inroom revenues for comparable properties. We calculate RevPAR bydividing room sales for comparable properties by room nights avail-able to guests for the period. RevPAR may not be comparable tosimilarly titled measures, such as revenues.
Company-operated house profit margin is the ratio of property-level gross operating profit (also known as house profit) to totalproperty-level revenue. This ratio measures our overall ability as theoperator to produce property-level profits by generating sales andcontrolling the operating expenses over which we have the mostdirect control. Gross operating profit includes room, food and bev-erage, and other revenue and the related expenses including payrolland benefits expenses, as well as repairs and maintenance, utility,general and administrative, and sales and marketing expenses.Gross operating profit does not include the impact of managementfees, furniture, fixtures and equipment replacement reserves, insur-ance, taxes, or other fixed expenses.
2007 COMPARED TO 2006We added 203 properties (29,200 rooms) and 55 properties (9,722rooms) exited the system in 2007, not including residential prod-ucts. We also added three residential properties (347 units).
Total segment financial results increased by $173 million (12 per-cent) to $1,588 million in 2007 from $1,415 million in 2006, andtotal segment revenues increased by $979 million to $12,909 millionin 2007, an 8 percent increase from revenues of $11,930 million in2006. The results, as compared to the prior year, reflect a $204 mil-lion (17 percent) increase in combined base management, fran-chise, and incentive management fees from $1,224 million in 2006to $1,428 million in 2007, a $16 million increase in earnings associ-ated with equity investments, and a $1 million minority interest ben-efit. Partially offsetting these favorable variances was a decrease of$18 million in owned, leased, corporate housing, and other revenuenet of direct expenses, $13 million of increased general, administra-tive, and other expenses, a decrease of $10 million in gains andother income, and a decrease of $7 million in timeshare sales andservices revenue net of direct expenses.
Higher RevPAR for comparable rooms, resulting from bothdomestic and international rate increases, higher property-level foodand beverage and other revenue, and new unit growth, drove theincrease in base management and franchise fees. In 2006, we rec-ognized $5 million of base management fees that were calculatedbased on prior periods’ results, but not earned and due until 2006,versus no similar fees in 2007. Incentive management feesincreased by $88 million (31 percent) during 2007, reflecting theimpact of strong room rate increases and property-level marginimprovements associated with productivity improvements. Incentivemanagement fees included $17 million and $10 million for 2007 and 2006, respectively, that were calculated based on prior periods’earnings, but not earned and due until the periods in which theywere recognized. Furthermore, incentive management fees for 2007also included $13 million of business interruption insurance pro-ceeds associated with hurricanes in prior years and base manage-ment fees included $6 million and $1 million of business interruptioninsurance proceeds, also associated with hurricanes in prior years,received in 2007 and 2006, respectively. In 2007, 67 percent of ourmanaged properties paid incentive management fees to us versus62 percent in 2006.
Systemwide RevPAR, which includes data from our franchisedproperties, in addition to our owned, leased, and managed proper-ties, for comparable North American properties increased by 6.0percent over 2006, and RevPAR for our comparable North Americancompany-operated properties increased by 6.2 percent over 2006.
Systemwide RevPAR for comparable international propertiesincreased by 8.4 percent, and RevPAR for comparable internationalcompany-operated properties increased by 8.9 percent. WorldwideRevPAR for comparable systemwide properties increased by 6.5 per-cent (7.6 percent using actual dollars) while worldwide RevPAR forcomparable company-operated properties increased by 7.0 percent.
Marriott International, Inc. 2007 27

As compared to 2006, 2007 worldwide comparable company-operated house profit margins increased by 150 basis points, whileNorth American company-operated house profit margins improvedby 160 basis points versus 2006. For 2007, as compared to 2006,house profit per available room (“HP-PAR”) at our full-service man-aged properties in North America increased by 10.6 percent. HP-PAR at our North American limited-service managed propertiesincreased by 8.9 percent, and worldwide HP-PAR for all our brandsincreased by 11.0 percent on a constant dollar basis.
2006 COMPARED TO 2005We added 136 properties (23,466 rooms) and 45 properties (8,616rooms) left the system in 2006. Most of the properties that left thesystem were limited-service properties.
Total segment financial results increased by $314 million (29 per-cent) to $1,415 million in 2006 from $1,101 million in 2005, andtotal segment revenues increased by $857 million to $11,930 millionin 2006, an 8 percent increase from revenues of $11,073 million in2005. The results as compared to the prior year reflect a $197 mil-lion (19 percent) increase in combined base management, fran-chise, and incentive management fees from $1,027 million in 2005to $1,224 million in 2006, $124 million of lower general, administra-tive, and other expenses, $8 million of increased owned, leased,corporate housing, and other revenue net of direct expenses, a $98million increase in timeshare sales and services revenue net of directexpenses, and an increase in minority interest of $2 million, partiallyoffset by $78 million of lower gains and other income and a $37million decline in earnings associated with equity investments.Higher RevPAR for comparable rooms, resulting from both domes-tic and international rate increases, higher property-level food andbeverage and other revenue, and new unit growth drove theincrease in base management and franchise fees. In 2006, we rec-ognized $5 million of base management fees that were calculatedbased on prior periods’ results, but not earned and due until 2006.Incentive management fees increased by $80 million (40 percent)during 2006, reflecting the impact of strong room rate improvementand property-level margin improvements. Incentive managementfees include $10 million and $14 million for 2006 and 2005, respec-tively, that were calculated based on prior periods’ earnings, but notearned and due until the periods in which they were recognized. In2006, 62 percent of our managed properties paid incentive man-agement fees to us versus 51 percent in 2005.
Systemwide RevPAR for comparable North American propertiesincreased by 9.1 percent over 2005 and RevPAR for our compara-ble North American company-operated properties increased by 8.9 percent.
Systemwide RevPAR for comparable international properties,increased by 10.5 percent, and RevPAR for comparable interna-tional company-operated properties increased by 11.1 percent.Worldwide RevPAR for comparable systemwide propertiesincreased by 9.4 percent while worldwide RevPAR for comparablecompany-operated properties increased by 9.5 percent.
In addition, worldwide comparable company-operated houseprofit margins increased by 230 basis points, while North Americancompany-operated house profit margins improved by 240 basispoints versus 2005. For 2006, as compared to 2005, HP-PAR at ourfull-service managed properties in North America increased by 16.3percent. HP-PAR at our North American limited-service managedproperties increased by 12.6 percent, and worldwide HP-PAR for allour brands increased by 15.4 percent on a constant dollar basis.
Lodging DevelopmentWe opened 203 properties, totaling 29,200 rooms, across ourbrands in 2007 and 55 properties (9,722 rooms) left the system, not
including residential products. We also added three residential prop-erties (347 units). Highlights of the year included:
3 Converting 26 properties (5,618 rooms), or 18 percent of ourgross room additions for the year, from other brands, and 21percent of the rooms were located in international markets;
3 Opening approximately 16 percent of all the new rooms out-side the United States;
3 Adding 156 properties (17,517 rooms) to our North AmericanLimited-Service brands; and
3 Opening two new Marriott Vacation Club properties in the WestIndies on the island of St. Kitts, and the U.S. Virgin Islands onthe island of St. Thomas, as well as one new Ritz-Carlton Cluband residences property in San Francisco, California.
We currently have more than 125,000 hotel rooms under con-struction, awaiting conversion, or approved for development in ourhotel development pipeline and we expect to add over 30,000 hotelrooms and timeshare units to our system in 2008. We expect toremove approximately 5,000 rooms from our system during the2008 full year.
We believe that we have access to sufficient financial resourcesto finance our growth, as well as to support our ongoing operationsand meet debt service and other cash requirements. Nonetheless,our ability to sell properties that we develop and the ability of hoteldevelopers to build or acquire new Marriott-branded properties,both of which are important parts of our growth plan, depend inpart on capital access, availability and cost for other hotel develop-ers and third-party owners. These growth plans are subject tonumerous risks and uncertainties, many of which are outside of ourcontrol. See the “Forward-Looking Statements” and “Risks andUncertainties” captions earlier in this report and the “Liquidity andCapital Resources” caption later in this report.
Statistics. The following tables show occupancy, average dailyrate, and RevPAR for comparable properties, for each of the brandsin our North American Full-Service and North American Limited-Service segments, for our International segment by region, and theprincipal brand in our Luxury segment, The Ritz-Carlton. We havenot presented statistics for company-operated Fairfield Inn proper-ties in these tables because we operate only a limited number ofproperties, as the brand is predominantly franchised and such infor-mation would not be meaningful (identified as “nm” in the tables thatfollow). Systemwide statistics include data from our franchised prop-erties, in addition to our owned, leased, and managed properties.
The occupancy, average daily rate, and RevPAR statistics usedthroughout this report for 2007 include the period from December30, 2006, through December 28, 2007, the statistics for 2006include the period from December 31, 2005, through December 29,2006, and the statistics for 2005 include the period from January 1,2005, through December 30, 2005 (except in each case, for TheRitz-Carlton brand properties and properties located outside of thecontinental United States and Canada, which for them includes theperiod from January 1 throughDecember 31 for each year).
The adjacent graph showsRevPAR for North AmericanComparable Company-Operated“Composite North American”properties (which includes our Marriott Hotels & Resorts,Renaissance Hotels & Resorts, TheRitz-Carlton, Courtyard, ResidenceInn, TownePlace Suites, Fairfield Innand SpringHill Suites brands) for thelast five fiscal years:
28 Marriott International, Inc. 2007
2003 2004 2005 2006
RevPAR
$85.
85
$95.
04
$103
.29
2007
$110
.74
$115
.60

Comparable Company- ComparableOperated North Systemwide North
American Properties (1) American Properties (1)
2007 Change vs. 2006 2007 Change vs. 2006
MARRIOTT HOTELS & RESORTS (2)
Occupancy 72.6% 1.0% pts. 70.8% 0.6% pts.Average Daily Rate $175.41 5.4% $160.61 5.5%RevPAR $127.43 6.9% $113.66 6.4%
RENAISSANCE HOTELS & RESORTS
Occupancy 73.1% 0.4% pts. 71.8% –0.4% pts.Average Daily Rate $169.93 5.4% $157.29 5.8%RevPAR $124.17 5.9% $112.96 5.1%
COMPOSITE NORTH AMERICAN FULL-SERVICE (3)
Occupancy 72.7% 0.9% pts. 70.9% 0.5% pts.Average Daily Rate $174.54 5.4% $160.10 5.5%RevPAR $126.92 6.8% $113.56 6.2%
THE RITZ-CARLTON NORTH AMERICA
Occupancy 72.3% 0.1% pts. 72.3% 0.1% pts.Average Daily Rate $331.48 7.3% $331.48 7.3%RevPAR $239.67 7.5% $239.67 7.5%
COMPOSITE NORTH AMERICAN FULL-SERVICE AND LUXURY (4)
Occupancy 72.7% 0.8% pts. 71.0% 0.4% pts.Average Daily Rate $189.41 5.7% $169.92 5.7%RevPAR $137.66 6.9% $120.65 6.4%
RESIDENCE INN
Occupancy 77.7% –0.5% pts. 78.2% –0.8% pts.Average Daily Rate $124.24 4.6% $122.44 6.1%RevPAR $ 96.53 3.9% $ 95.80 5.1%
COURTYARD
Occupancy 70.4% –0.4% pts. 72.1% –0.2% pts.Average Daily Rate $127.34 5.6% $124.12 5.9%RevPAR $ 89.69 4.9% $ 89.53 5.6%
FAIRFIELD INN
Occupancy nm nm 70.5% –0.3% pts.Average Daily Rate nm nm $ 88.19 7.2%RevPAR nm nm $ 62.17 6.7%
TOWNEPLACE SUITES
Occupancy 74.2% –1.1% pts. 73.5% –2.4% pts.Average Daily Rate $ 85.65 8.9% $ 86.93 8.4%RevPAR $ 63.56 7.2% $ 63.89 5.0%
SPRINGHILL SUITES
Occupancy 72.6% 0.6% pts. 73.2% –0.6% pts.Average Daily Rate $107.86 4.2% $106.49 6.5%RevPAR $ 78.27 5.0% $ 77.97 5.7%
COMPOSITE NORTH AMERICAN LIMITED-SERVICE (5)
Occupancy 72.7% –0.4% pts. 73.6% –0.5% pts.Average Daily Rate $122.63 5.4% $113.34 6.3%RevPAR $ 89.18 4.8% $ 83.37 5.6%
COMPOSITE NORTH AMERICAN (6)
Occupancy 72.7% 0.3% pts. 72.6% –0.2% pts.Average Daily Rate $159.01 5.8% $134.62 6.2%RevPAR $115.60 6.2% $ 97.70 6.0%
(1) Statistics are for the fifty-two weeks ended December 28, 2007, and December 29, 2006,except for The Ritz-Carlton for which the statistics are for the twelve months ended December 31, 2007, and December 31, 2006. For properties located in Canada the comparison to 2006 is on a constant U.S. dollar basis.
(2) Marriott Hotels & Resorts includes JW Marriott Hotels & Resorts.(3) Composite North American Full-Service statistics include properties located in the continental
United States and Canada for Marriott Hotels & Resorts and Renaissance Hotels & Resorts.(4) Composite North American Full-Service and Luxury includes Marriott Hotels & Resorts,
Renaissance Hotels & Resorts, and The Ritz-Carlton.(5) Composite North American Limited-Service statistics include properties located in the conti-
nental United States and Canada for Residence Inn, Courtyard, Fairfield Inn, TownePlaceSuites, and SpringHill Suites.
(6) Composite North American statistics include properties located in the continental UnitedStates and Canada for Marriott Hotels & Resorts, Renaissance Hotels & Resorts, ResidenceInn, Courtyard, Fairfield Inn, TownePlace Suites, SpringHill Suites, and The Ritz-Carlton.
Comparable Company- Comparable Operated Properties (1) Systemwide Properties (1)
2007 Change vs. 2006 2007 Change vs. 2006
CARIBBEAN AND LATIN AMERICA (2)
Occupancy 76.5% 2.4% pts. 74.8% 2.8% pts.Average Daily Rate $167.56 9.2% $156.76 7.5%RevPAR $128.25 12.7% $117.20 11.7%
CONTINENTAL EUROPE (2)
Occupancy 74.4% 1.3% pts. 72.0% 1.2% pts.Average Daily Rate $173.92 5.8% $174.93 5.4%RevPAR $129.34 7.7% $126.01 7.3%
UNITED KINGDOM (2)
Occupancy 77.8% 0.1% pts. 77.4% 0.3% pts.Average Daily Rate $203.27 5.2% $200.65 4.7%RevPAR $158.08 5.2% $155.27 5.1%
MIDDLE EAST AND AFRICA (2)
Occupancy 73.3% 4.8% pts. 72.4% 4.9% pts.Average Daily Rate $135.74 9.1% $133.98 9.0%RevPAR $ 99.57 16.8% $ 96.95 17.0%
ASIA PACIFIC (2), (3)
Occupancy 75.2% –0.8% pts. 75.3% –0.5% pts.Average Daily Rate $147.79 8.9% $148.67 7.7%RevPAR $111.15 7.8% $111.92 7.0%
REGIONAL COMPOSITE (4), (5)
Occupancy 75.7% 0.8% pts. 74.6% 1.0% pts.Average Daily Rate $168.30 7.0% $166.03 6.3%RevPAR $127.44 8.2% $123.78 7.8%
INTERNATIONAL LUXURY (6)
Occupancy 72.7% 4.0% pts. 72.7% 4.0% pts.Average Daily Rate $292.24 6.1% $292.24 6.1%RevPAR $212.54 12.2% $212.54 12.2%
TOTAL INTERNATIONAL (7)
Occupancy 75.4% 1.2% pts. 74.4% 1.3% pts.Average Daily Rate $180.73 7.2% $176.57 6.6%RevPAR $136.29 8.9% $131.36 8.4%
(1) Financial results for all properties are reported on a period-end basis, while statistics for prop-erties located outside the continental United States and Canada are reported on a month-endbasis. The statistics are for January through December. For the properties located in countriesthat use currencies other than the U.S. dollar, the comparison to 2006 is on a constant U.S.dollar basis.
(2) Regional information includes Marriott Hotels & Resorts, Renaissance Hotels & Resorts, andCourtyard properties located outside of the continental United States and Canada.
(3) Excludes Hawaii.(4) Includes Hawaii.(5) Regional Composite statistics include all properties located outside of the continental United
States and Canada for Marriott Hotels & Resorts, Renaissance Hotels & Resorts, andCourtyard.
(6) Includes The Ritz-Carlton properties located outside of North America and Bulgari Hotels &Resorts.
(7) Total International includes Regional Composite statistics and statistics for The Ritz-CarltonInternational and Bulgari Hotels & Resorts.
Comparable Company- Comparable Operated Properties (1) Systemwide Properties (1)
2007 Change vs. 2006 2007 Change vs. 2006
COMPOSITE LUXURY (2)
Occupancy 72.5% 1.8% pts. 72.5% 1.8% pts.Average Daily Rate $314.36 6.6% $314.36 6.6%RevPAR $227.87 9.4% $227.87 9.4%
TOTAL WORLDWIDE (3)
Occupancy 73.5% 0.5% pts. 72.9% 0.1% pts.Average Daily Rate $165.19 6.2% $141.60 6.4%RevPAR $121.34 7.0% $103.19 6.5%
(1) Financial results for all properties are reported on a period-end basis, while statistics for prop-erties located outside the continental United States and Canada are reported on a month-endbasis. For the properties located in countries that use currencies other than the U.S. dollar,the comparison to 2006 is on a constant U.S. dollar basis.
(2) Composite Luxury includes worldwide properties for The Ritz-Carlton and Bulgari Hotels & Resorts.(3) Total Worldwide statistics include all properties worldwide for Marriott Hotels & Resorts,
Renaissance Hotels & Resorts, Residence Inn, Courtyard, Fairfield Inn, TownePlace Suites,SpringHill Suites, and The Ritz-Carlton. Statistics for properties located in the continentalUnited States and Canada (except for The Ritz-Carlton) represent the fifty-two weeks endedDecember 28, 2007, and December 29, 2006. Statistics for all The Ritz-Carlton propertiesand properties located outside of the continental United States and Canada represent thetwelve months ended December 31, 2007, and December 31, 2006.
Marriott International, Inc. 2007 29

Comparable Company- ComparableOperated North Systemwide North
American Properties (1) American Properties (1)
2006 Change vs. 2005 2006 Change vs. 2005
MARRIOTT HOTELS & RESORTS (2)
Occupancy 72.3% –0.6% pts. 70.9% 0.2% pts.Average Daily Rate $168.11 9.1% $154.37 8.3%RevPAR $121.58 8.3% $109.48 8.6%
RENAISSANCE HOTELS & RESORTS
Occupancy 72.8% 0.6% pts. 72.2% 1.1% pts.Average Daily Rate $162.96 8.7% $151.91 8.4%RevPAR $118.57 9.6% $109.75 10.0%
COMPOSITE NORTH AMERICAN FULL-SERVICE (3)
Occupancy 72.4% –0.4% pts. 71.1% 0.3% pts.Average Daily Rate $167.27 9.0% $153.99 8.3%RevPAR $121.10 8.5% $109.52 8.9%
THE RITZ-CARLTON NORTH AMERICA
Occupancy 72.9% 2.1% pts. 72.9% 2.1% pts.Average Daily Rate $307.20 7.1% $307.20 7.1%RevPAR $223.88 10.3% $223.88 10.3%
COMPOSITE NORTH AMERICAN FULL-SERVICE AND LUXURY (4)
Occupancy 72.4% –0.1% pts. 71.2% 0.5% pts.Average Daily Rate $180.17 8.9% $163.03 8.3%RevPAR $130.52 8.7% $116.11 9.0%
RESIDENCE INN
Occupancy 78.3% –1.8% pts. 79.2% –0.5% pts.Average Daily Rate $117.99 9.2% $113.85 8.2%RevPAR $ 92.35 6.8% $ 90.15 7.6%
COURTYARD
Occupancy 70.9% –0.4% pts. 72.5% 0.1% pts.Average Daily Rate $119.30 10.9% $116.67 9.5%RevPAR $ 84.62 10.3% $ 84.57 9.7%
FAIRFIELD INN
Occupancy nm nm 70.7% 1.0% pts.Average Daily Rate nm nm $ 82.05 9.1%RevPAR nm nm $ 58.01 10.6%
TOWNEPLACE SUITES
Occupancy 75.3% –0.3% pts. 75.7% –0.2% pts.Average Daily Rate $ 78.68 10.9% $ 79.69 10.2%RevPAR $ 59.28 10.4% $ 60.35 9.9%
SPRINGHILL SUITES
Occupancy 72.3% –2.0% pts. 74.1% 0.2% pts.Average Daily Rate $102.86 10.7% $ 98.76 9.8%RevPAR $ 74.42 7.8% $ 73.16 10.0%
COMPOSITE NORTH AMERICAN LIMITED-SERVICE (5)
Occupancy 73.3% –0.8% pts. 74.2% 0.1% pts.Average Daily Rate $115.24 10.4% $105.65 9.0%RevPAR $ 84.41 9.1% $ 78.34 9.2%
COMPOSITE NORTH AMERICAN (6)
Occupancy 72.8% –0.4% pts. 73.0% 0.3% pts.Average Daily Rate $152.14 9.5% $128.07 8.7%RevPAR $110.74 8.9% $ 93.47 9.1%
(1) Statistics are for the fifty-two weeks ended December 29, 2006, and December 30, 2005,except for The Ritz-Carlton for which the statistics are for the twelve months ended December 31, 2006, and December 31, 2005. For properties located in Canada the comparison to 2005 is on a constant U.S. dollar basis.
(2) Marriott Hotels & Resorts includes JW Marriott Hotels & Resorts.(3) Composite North American Full-Service statistics include properties located in the continental
United States and Canada for Marriott Hotels & Resorts and Renaissance Hotels & Resorts.(4) Composite North American Full-Service and Luxury includes Marriott Hotels & Resorts,
Renaissance Hotels & Resorts, and The Ritz-Carlton.(5) Composite North American Limited-Service statistics include properties located in the conti-
nental United States and Canada for Residence Inn, Courtyard, Fairfield Inn, TownePlaceSuites, and SpringHill Suites.
(6) Composite North American statistics include properties located in the continental UnitedStates and Canada for Marriott Hotels & Resorts, Renaissance Hotels & Resorts, ResidenceInn, Courtyard, Fairfield Inn, TownePlace Suites, SpringHill Suites, and The Ritz-Carlton.
Comparable Company- Comparable Operated Properties (1) Systemwide Properties (1)
2006 Change vs. 2005 2006 Change vs. 2005
CARIBBEAN AND LATIN AMERICA (2)
Occupancy 74.9% 1.5% pts. 73.0% 0.5% pts.Average Daily Rate $159.93 9.7% $150.93 9.2%RevPAR $119.81 12.0% $110.11 9.9%
CONTINENTAL EUROPE (2)
Occupancy 72.6% 2.0% pts. 70.7% 1.9% pts.Average Daily Rate $147.28 6.6% $150.58 7.2%RevPAR $106.95 9.6% $106.53 10.2%
UNITED KINGDOM (2)
Occupancy 79.6% 3.5% pts. 75.1% 3.1% pts.Average Daily Rate $225.38 9.5% $204.99 8.6%RevPAR $179.44 14.6% $153.94 13.3%
MIDDLE EAST AND AFRICA (2)
Occupancy 68.9% –0.3% pts. 69.0% –0.7% pts.Average Daily Rate $143.12 11.0% $134.95 11.5%RevPAR $ 98.58 10.5% $ 93.05 10.3%
ASIA PACIFIC (2), (3)
Occupancy 75.8% 1.0% pts. 76.2% 0.9% pts.Average Daily Rate $127.09 11.3% $129.26 9.8%RevPAR $ 96.28 12.7% $ 98.46 11.2%
REGIONAL COMPOSITE (4), (5)
Occupancy 74.6% 1.3% pts. 73.6% 1.1% pts.Average Daily Rate $148.13 9.5% $147.12 9.0%RevPAR $110.53 11.4% $108.32 10.7%
INTERNATIONAL LUXURY (6)
Occupancy 71.7% –0.1% pts. 71.7% –0.1% pts.Average Daily Rate $241.90 9.2% $241.90 9.2%RevPAR $173.35 9.1% $173.55 9.1%
TOTAL INTERNATIONAL (7)
Occupancy 74.4% 1.2% pts. 73.5% 1.0% pts.Average Daily Rate $153.99 9.4% $152.02 9.0%RevPAR $114.61 11.1% $111.78 10.5%
(1) Financial results for all properties are reported on a period-end basis, while statistics for prop-erties located outside the continental United States and Canada are reported on a month-endbasis. The statistics are for January through December. For the properties located in countriesthat use currencies other than the U.S. dollar, the comparison to 2005 is on a constant U.S.dollar basis.
(2) Regional information includes Marriott Hotels & Resorts, Renaissance Hotels & Resorts, andCourtyard properties located outside of the continental United States and Canada.
(3) Excludes Hawaii.(4) Includes Hawaii.(5) Regional Composite statistics include all properties located outside of the continental United
States and Canada for Marriott Hotels & Resorts, Renaissance Hotels & Resorts, andCourtyard.
(6) Includes The Ritz-Carlton properties located outside of North America and Bulgari Hotels &Resorts.
(7) Total International includes Regional Composite statistics and statistics for The Ritz-CarltonInternational and Bulgari Hotels & Resorts.
Comparable Company- Comparable Operated Properties (1) Systemwide Properties (1)
2006 Change vs. 2005 2006 Change vs. 2005
COMPOSITE LUXURY (2)
Occupancy 72.5% 1.4% pts. 72.5% 1.4% pts.Average Daily Rate $289.50 7.5% $289.50 7.5%RevPAR $209.88 9.7% $209.88 9.7%
TOTAL WORLDWIDE (3)
Occupancy 73.2% 0.0% pts. 73.1% 0.4% pts.Average Daily Rate $152.63 9.5% $131.92 8.8%RevPAR $111.75 9.5% $ 96.39 9.4%
(1) Financial results for all properties are reported on a period-end basis, while statistics for prop-erties located outside the continental United States and Canada are reported on a month-endbasis. For the properties located in countries that use currencies other than the U.S. dollar,the comparison to 2005 is on a constant U.S. dollar basis.
(2) Composite Luxury includes worldwide properties for The Ritz-Carlton and Bulgari Hotels & Resorts.(3) Total Worldwide statistics include all properties worldwide for Marriott Hotels & Resorts,
Renaissance Hotels & Resorts, Residence Inn, Courtyard, Fairfield Inn, TownePlace Suites,SpringHill Suites, and The Ritz-Carlton. Statistics for properties located in the continentalUnited States and Canada (except for The Ritz-Carlton) represent the fifty-two weeks endedDecember 29, 2006, and December 30, 2005. Statistics for all The Ritz-Carlton propertiesand properties located outside of the continental United States and Canada represent thetwelve months ended December 31, 2006, and December 31, 2005.
30 Marriott International, Inc. 2007

North American Full-Service LodgingNorth American Full-Service Lodging includes Marriott Hotels &Resorts, Marriott Conference Centers, JW Marriott Hotels & Resorts,Renaissance Hotels & Resorts, and Renaissance ClubSport.
Annual Change
($ in millions) 2007 2006 2005 2007/2006 2006/2005
Segment revenues $5,476 $5,196 $5,116 5% 2%
Segment results $ 478 $ 455 $ 349 5% 30%
2007 COMPARED TO 2006In 2007, across our North American Full-Service Lodging segment,we added 13 properties (3,947 rooms) and six properties (2,853rooms) left the system.
In 2007, RevPAR for comparable company-operated NorthAmerican full-service properties increased by 6.8 percent to$126.92. Occupancy for these properties increased by 0.9 percent-age points to 72.7 percent, and average daily rates increased by5.4 percent to $174.54.
The $23 million increase in segment results compared to 2006reflects a $65 million increase in base management, incentive man-agement, and franchise fees, partially offset by a $22 million declinein gains and other income and a $20 million decrease in owned,leased, and other revenue net of direct expenses.
The $65 million increase in fees was largely due to strongerRevPAR and property-level margins, driven primarily by rate increasesand productivity improvements. Incentive management fees for 2007reflect the receipt of $12 million and base management fees for 2007reflect the receipt of $2 million, both of which were for business inter-ruption insurance proceeds associated with Hurricane Katrina, andno similar fees in 2006. Additionally, 2006 reflected the recognition of$3 million of base management fees that were calculated based onprior periods’ results, but not earned and due until 2006, comparedto the recognition of no similar fees in 2007.
Gains and other income was $22 million lower in 2007, as com-pared to 2006, and reflected a $37 million charge in 2006 associatedwith a straight-line rent receivable, partially offset by the redemption ofpreferred stock in a cost method investee that generated income of$25 million in 2006 and $34 million of lower other gains in 2007, ascompared to 2006. The $34 million decrease in other gains com-pared to the prior year reflects gains in 2006 associated with the saleof joint venture investments and real estate, while 2007 reflects limitedsimilar activity. Owned, leased, and other revenue net of directexpenses decreased by $20 million and reflected properties sold and$10 million of hotel management and franchise agreement termina-tion fees received in 2006, compared to $3 million of such feesreceived in 2007. General, administrative, and other expenses for2007 were unchanged as compared to 2006 primarily reflecting $5million of hotel management agreement performance cure paymentsin 2006 offset by a guarantee charge in 2007 associated with oneproperty and the write-off of a deferred contract acquisition costassociated with another property that left the system.
2006 COMPARED TO 2005In 2006, across our North American Full-Service Lodging segment,we added 15 properties (4,971 rooms) and six properties (1,604rooms) left the system.
In 2006, RevPAR for comparable company-operated NorthAmerican full-service properties increased by 8.5 percent to $121.10.Occupancy for these properties decreased by 0.4 percentage points,and average daily rates increased by 9.0 percent to $167.27.
Compared to the prior year, our 2006 results reflect a $59 millionincrease in base management, incentive management, and franchise
fees. The increase in fees is largely due to stronger RevPAR, drivenprimarily by rate increases and, to a lesser extent, higher food andbeverage, meeting room rental and other revenue, and productivityimprovements, all of which favorably impacted property-level houseprofit margins. The growth in the number of rooms, year-over-year,also contributed to the increase in fees. Incentive management feesincluded $10 million for 2005 that were calculated based on priorperiods’ earnings but not earned and due until they were recog-nized. Similarly, base management fees for 2006 included $4 millionof fees that were calculated based on prior periods’ results, but notearned and due until 2006. Owned, leased, and other revenue net ofdirect expenses decreased by $8 million primarily as a result of prop-erties sold in 2006 and the receipt in 2005 of a $10 million hotelagreement termination fee associated with one property, partially off-set by the receipt in 2006 of $10 million of hotel management andfranchise agreement termination fees.
General, administrative, and other expenses decreased by $69 mil-lion as a result of, among other things, a $60 million charge in 2005associated with the CTF transaction, more fully discussed in the previ-ous “Operating Income” discussion, as well as expenses of $14 millionin 2005 related to our bedding incentive program, partially offset byincreased expenses in 2006 reflecting costs related to unit growth anddevelopment, systems improvements, and increases in ordinary costssuch as wages and benefits. In 2005, general, administrative, andother expenses included $3 million of hotel management agreementperformance cure payments associated with one property. In 2006,general, administrative, and other expenses included a $5 million hotelmanagement agreement performance cure payment.
Gains and other income was $3 million higher than the prior yearand reflected the redemption of preferred stock in a cost methodinvestee that generated income of $25 million in 2006 and $15 mil-lion of higher net gains and other income in 2006 reflecting gains in2006 associated with the sale of joint venture investments and realestate that were partially offset by lower gains in 2006 associatedwith the sale or repayment before maturity of loans receivable asso-ciated with several properties. Gains and other income for 2006reflected a $37 million non-cash charge to adjust the carryingamount to net realizable value associated with land we own andlease, as further described in the “Expected Land Sale” caption inthe “Management’s Discussion and Analysis of Financial Conditionand Results of Operations” section of our 2006 Form 10-K. Equityresults decreased by $19 million versus the prior year and reflectedthe recognition in 2005 of $16 million in equity earnings from twojoint ventures as a result of the ventures’ sale of hotels and our saleof some joint venture investments in 2005 and 2006, offset to someextent by improved equity joint venture results reflecting thestronger demand environment.
North American Limited-Service LodgingNorth American Limited-Service Lodging includes Courtyard,Fairfield Inn, SpringHill Suites, Residence Inn, TownePlace Suites,and Marriott ExecuStay.
Annual Change
($ in millions) 2007 2006 2005 2007/2006 2006/2005
Segment revenues $2,198 $2,060 $1,886 7% 9%
Segment results $ 461 $ 380 $ 303 21% 25%
2007 COMPARED TO 2006Across our North American Limited-Service Lodging segment, weadded 156 properties (17,517 rooms) and 16 properties (1,853rooms) left the system in 2007. The properties that left the systemwere primarily associated with our Fairfield Inn brand.
Marriott International, Inc. 2007 31

In 2007, RevPAR for comparable company-operated NorthAmerican limited-service properties increased by 4.8 percent to$89.18. Occupancy for these properties decreased by 0.4 percent-age points to 72.7 percent, and average daily rates increased by5.4 percent to $122.63.
The $81 million increase in segment results, as compared to2006, primarily reflects an $83 million increase in base manage-ment, incentive management, and franchise fees, a $5 millionincrease in owned, leased, and other revenue net of directexpenses, a $2 million increase in gains and other income, and a$2 million increase in joint venture equity earnings, partially offset by$11 million of higher general, administrative, and other expenses.
In 2007, we recognized $15 million of incentive managementfees that were calculated based on prior years’ results but notearned and due until 2007 as compared to the recognition of nosimilar fees in 2006. The additional increase in fees is largely due to higher RevPAR, driven by rate increases, which increased basemanagement and franchise fees, and to productivity improvements,which increased property-level margins and incentive managementfees. Additionally, growth in the number of rooms contributed to theincrease in base management and franchise fees. The $5 millionincrease in owned, leased, and other revenue net of directexpenses is primarily a result of hotel franchise agreement termina-tion fees of $6 million received in 2007, which were associated withproperties, primarily our Fairfield Inn brand, that left our system and$1 million of similar fees in 2006. The $11 million increase in gen-eral, administrative, and other expenses in 2007 primarily reflectsthe impact of unit growth and development and the write-off of $3 million of deferred contract acquisition costs.
2006 COMPARED TO 2005Across our North American Limited-Service Lodging segment, we added 91 properties (11,329 rooms) and 28 properties (3,647rooms) left the system in 2006. The properties that left the systemwere primarily associated with our Fairfield Inn brand.
In 2006, RevPAR for comparable company-operated NorthAmerican limited-service properties increased by 9.1 percent to$84.41. Occupancy for these properties decreased by 0.8 percent-age points to 73.3 percent, and average daily rates increased by10.4 percent to $115.24.
The $77 million increase in segment results for 2006 primarilyreflects a $77 million increase in base management, incentive man-agement, and franchise fees, $27 million of lower general, adminis-trative, and other expenses, and $6 million of increased equityresults, partially offset by a $14 million decrease in owned, leased,and other revenue net of direct expenses and a $19 milliondecrease in gains and other income. The increase in fees is largelydue to higher RevPAR, driven by rate increases, which impactedproperty-level house profits and, to a lesser extent, to 2006 produc-tivity improvements and the growth in the number of rooms.Stronger performance at our renovated Courtyard properties, ver-sus nonrenovated properties, also contributed to the increase insegment results over the prior year. The decrease in owned, leased,and other revenue net of direct expenses reflects lower lease rev-enue as a result of our sale, late in 2005, of a portfolio of landunderlying 75 Courtyard hotels, partially offset by improved ownedand leased results in 2006 reflecting stronger demand.
The decrease in general, administrative, and other expenses of$27 million is attributable to the recognition of expenses in 2005totaling $11 million associated with our bedding incentive program,a $6 million litigation charge and a $3 million guarantee charge.Improved equity results in 2006 versus 2005 reflect the impact of a
stronger demand environment in 2006, new joint ventures and the impact of owning a 50 percent interest in the Courtyard JointVenture through the first quarter of 2005 versus owning a 21 per-cent interest thereafter. For additional information regarding theCourtyard Joint Venture, see the “Courtyard Joint Venture” captionin the “Liquidity and Capital Resources” section in “Management’sDiscussion and Analysis of Financial Condition and Results ofOperations” of our 2005 Form 10-K. Gains and other incomedecreased by $19 million in 2006 as a result of the 2005 sale of aportfolio of land that generated gains and other income of $17 mil-lion, a $10 million gain in 2005 associated with the repayment,before maturity, to us of the loan we made to the Courtyard JointVenture, partially offset by higher other real estate and other gainsof $4 million in 2006 and increased income of $4 million in 2006associated with cost method joint ventures.
International LodgingInternational Lodging includes International Marriott Hotels &Resorts, International JW Marriott Hotels & Resorts, InternationalRenaissance Hotels & Resorts, International Courtyard, InternationalFairfield Inn, International Residence Inn, Ramada International, andMarriott Executive Apartments.
Annual Change
($ in millions) 2007 2006 2005 2007/2006 2006/2005
Segment revenues $1,594 $1,411 $1,017 13% 39%
Segment results $ 271 $ 237 $ 133 14% 78%
2007 COMPARED TO 2006Across our International Lodging segment, we added 20 properties(4,686 rooms) and 31 properties (4,678 rooms) left the system in 2007.
In 2007, RevPAR for comparable company-operated interna-tional properties increased by 8.2 percent to $127.44. Occupancyfor these properties increased by 0.8 percentage points to 75.7percent, and average daily rates increased by 7.0 percent to$168.30. Results for our international operations were strong acrossmost regions. RevPAR increases as compared to the prior yearwere particularly strong in Central and South East Asia, SouthAmerica, the Middle East, and Eastern Europe.
The $34 million increase in segment results in 2007 as com-pared to 2006, reflects a $27 million increase in base management,incentive management, and franchise fees, an $11 million increasein gains and other income, and a $3 million increase in joint ventureequity earnings, partially offset by $7 million of higher general,administrative, and other expenses. Incentive management feesincluded $2 million for 2007 that were calculated based on priorperiods’ earnings, but not earned and due until recognized, com-pared to $10 million of similar fees in 2006.
The increase in fees is largely due to strong demand and higherRevPAR, driven by rate increases and favorable exchange rates.The $11 million increase in gains and other income reflects highergains in 2007 on real estate sales, as compared to the year-agoperiod, offset by lower gains on the sale of joint ventures. The $7million increase in general, administrative, and other expenses from2006 is primarily attributable to costs related to our unit growth and development. Owned, leased, and other revenue net of directexpenses remained flat primarily reflecting hotel management andfranchise agreement termination fees of $8 million received in 2007 and $12 million of similar fees in 2006, entirely offset by theimproved performance of our owned and leased properties in 2007.
32 Marriott International, Inc. 2007
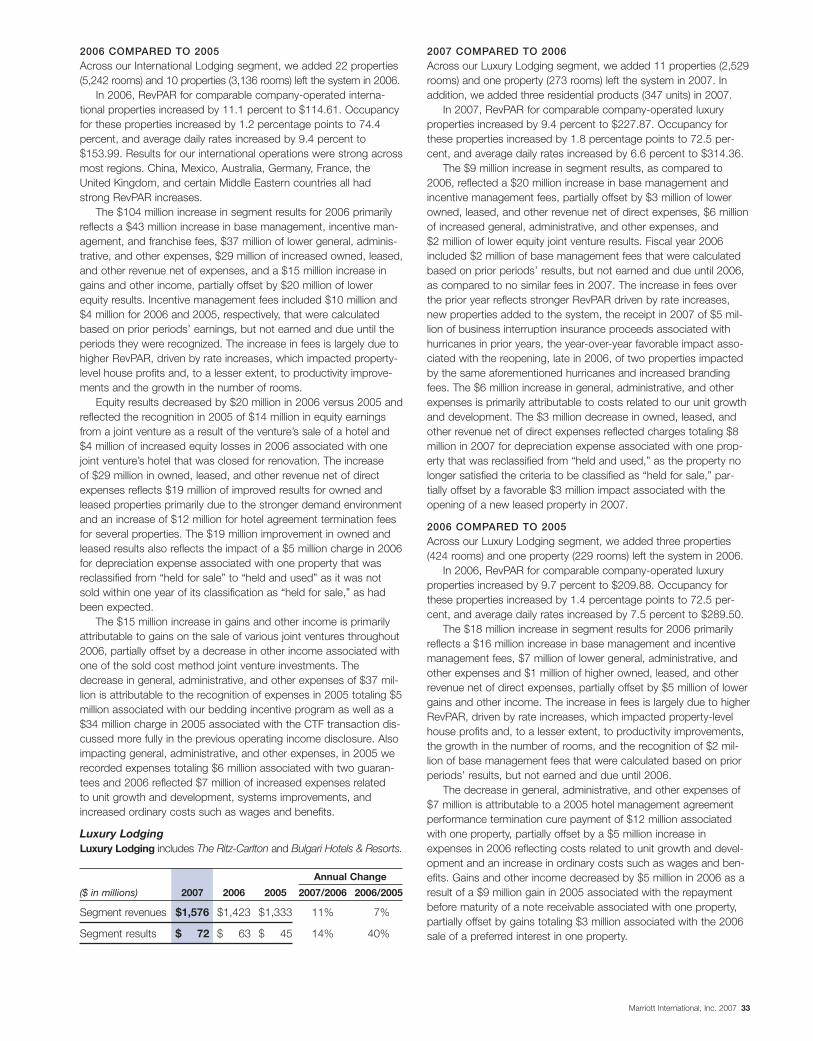
2006 COMPARED TO 2005Across our International Lodging segment, we added 22 properties(5,242 rooms) and 10 properties (3,136 rooms) left the system in 2006.
In 2006, RevPAR for comparable company-operated interna-tional properties increased by 11.1 percent to $114.61. Occupancyfor these properties increased by 1.2 percentage points to 74.4percent, and average daily rates increased by 9.4 percent to$153.99. Results for our international operations were strong acrossmost regions. China, Mexico, Australia, Germany, France, theUnited Kingdom, and certain Middle Eastern countries all hadstrong RevPAR increases.
The $104 million increase in segment results for 2006 primarilyreflects a $43 million increase in base management, incentive man-agement, and franchise fees, $37 million of lower general, adminis-trative, and other expenses, $29 million of increased owned, leased,and other revenue net of expenses, and a $15 million increase ingains and other income, partially offset by $20 million of lowerequity results. Incentive management fees included $10 million and$4 million for 2006 and 2005, respectively, that were calculatedbased on prior periods’ earnings, but not earned and due until theperiods they were recognized. The increase in fees is largely due tohigher RevPAR, driven by rate increases, which impacted property-level house profits and, to a lesser extent, to productivity improve-ments and the growth in the number of rooms.
Equity results decreased by $20 million in 2006 versus 2005 andreflected the recognition in 2005 of $14 million in equity earningsfrom a joint venture as a result of the venture’s sale of a hotel and$4 million of increased equity losses in 2006 associated with onejoint venture’s hotel that was closed for renovation. The increase of $29 million in owned, leased, and other revenue net of directexpenses reflects $19 million of improved results for owned andleased properties primarily due to the stronger demand environmentand an increase of $12 million for hotel agreement termination feesfor several properties. The $19 million improvement in owned andleased results also reflects the impact of a $5 million charge in 2006for depreciation expense associated with one property that wasreclassified from “held for sale” to “held and used” as it was notsold within one year of its classification as “held for sale,” as hadbeen expected.
The $15 million increase in gains and other income is primarilyattributable to gains on the sale of various joint ventures throughout2006, partially offset by a decrease in other income associated withone of the sold cost method joint venture investments. Thedecrease in general, administrative, and other expenses of $37 mil-lion is attributable to the recognition of expenses in 2005 totaling $5million associated with our bedding incentive program as well as a$34 million charge in 2005 associated with the CTF transaction dis-cussed more fully in the previous operating income disclosure. Alsoimpacting general, administrative, and other expenses, in 2005 werecorded expenses totaling $6 million associated with two guaran-tees and 2006 reflected $7 million of increased expenses related to unit growth and development, systems improvements, andincreased ordinary costs such as wages and benefits.
Luxury LodgingLuxury Lodging includes The Ritz-Carlton and Bulgari Hotels & Resorts.
Annual Change
($ in millions) 2007 2006 2005 2007/2006 2006/2005
Segment revenues $1,576 $1,423 $1,333 11% 7%
Segment results $ 72 $ 63 $ 45 14% 40%
2007 COMPARED TO 2006Across our Luxury Lodging segment, we added 11 properties (2,529rooms) and one property (273 rooms) left the system in 2007. Inaddition, we added three residential products (347 units) in 2007.
In 2007, RevPAR for comparable company-operated luxuryproperties increased by 9.4 percent to $227.87. Occupancy forthese properties increased by 1.8 percentage points to 72.5 per-cent, and average daily rates increased by 6.6 percent to $314.36.
The $9 million increase in segment results, as compared to2006, reflected a $20 million increase in base management andincentive management fees, partially offset by $3 million of lowerowned, leased, and other revenue net of direct expenses, $6 millionof increased general, administrative, and other expenses, and $2 million of lower equity joint venture results. Fiscal year 2006included $2 million of base management fees that were calculatedbased on prior periods’ results, but not earned and due until 2006,as compared to no similar fees in 2007. The increase in fees overthe prior year reflects stronger RevPAR driven by rate increases,new properties added to the system, the receipt in 2007 of $5 mil-lion of business interruption insurance proceeds associated withhurricanes in prior years, the year-over-year favorable impact asso-ciated with the reopening, late in 2006, of two properties impactedby the same aforementioned hurricanes and increased brandingfees. The $6 million increase in general, administrative, and otherexpenses is primarily attributable to costs related to our unit growthand development. The $3 million decrease in owned, leased, andother revenue net of direct expenses reflected charges totaling $8million in 2007 for depreciation expense associated with one prop-erty that was reclassified from “held and used,” as the property nolonger satisfied the criteria to be classified as “held for sale,” par-tially offset by a favorable $3 million impact associated with theopening of a new leased property in 2007.
2006 COMPARED TO 2005Across our Luxury Lodging segment, we added three properties(424 rooms) and one property (229 rooms) left the system in 2006.
In 2006, RevPAR for comparable company-operated luxuryproperties increased by 9.7 percent to $209.88. Occupancy forthese properties increased by 1.4 percentage points to 72.5 per-cent, and average daily rates increased by 7.5 percent to $289.50.
The $18 million increase in segment results for 2006 primarilyreflects a $16 million increase in base management and incentivemanagement fees, $7 million of lower general, administrative, andother expenses and $1 million of higher owned, leased, and otherrevenue net of direct expenses, partially offset by $5 million of lowergains and other income. The increase in fees is largely due to higherRevPAR, driven by rate increases, which impacted property-levelhouse profits and, to a lesser extent, to productivity improvements,the growth in the number of rooms, and the recognition of $2 mil-lion of base management fees that were calculated based on priorperiods’ results, but not earned and due until 2006.
The decrease in general, administrative, and other expenses of$7 million is attributable to a 2005 hotel management agreementperformance termination cure payment of $12 million associatedwith one property, partially offset by a $5 million increase inexpenses in 2006 reflecting costs related to unit growth and devel-opment and an increase in ordinary costs such as wages and ben-efits. Gains and other income decreased by $5 million in 2006 as aresult of a $9 million gain in 2005 associated with the repaymentbefore maturity of a note receivable associated with one property,partially offset by gains totaling $3 million associated with the 2006sale of a preferred interest in one property.
Marriott International, Inc. 2007 33

TimeshareTimeshare includes our Marriott Vacation Club, The Ritz-CarltonClub, Grand Residences by Marriott, and Horizons by MarriottVacation Club brands.
Annual Change
($ in millions) 2007 2006 2005 2007/2006 2006/2005
Segment Revenues
Segment revenues $2,065 $1,840 $1,721 12% 7%
Segment Results
Base managementfee revenue $ 43 $ 34 $ 32
Timeshare sales and services, net 350 357 259
Joint venture equity 10 (2) 1Minority interest 1 — —General, adminis-trative, and other expense (98) (109) (93)
Gains and other income — — 72
Segment results $ 306 $ 280 $ 271 9% 3%
Sales and Services Revenue
Development $1,208 $1,112 $1,208Services 315 286 151Financing 195 171 72Other revenue 29 8 56
Sales and servicesrevenue $1,747 $1,577 $1,487 11% 6%
Contract Sales
Timeshare $1,221 $1,207 $1,187Fractional 44 42 101Residential (9) 5 22
Total company 1,256 1,254 1,310Timeshare 33 28 49Fractional 54 68 17Residential 58 282 24
Total joint venture 145 378 90
Total contract sales $1,401 $1,632 $1,400 –14% 17%
2007 COMPARED TO 2006Timeshare contract sales, including sales made by our timesharejoint venture projects, represent sales of timeshare interval, frac-tional ownership, and residential ownership products before theadjustment for percentage-of-completion accounting. Timesharecontract sales decreased by 14 percent as compared to 2006,reflecting fewer residential and fractional sales, partially offset byincreased timeshare sales. Contract sales in 2006 reflected particu-larly strong joint venture residential sales associated with the launchof our San Francisco and Kapalua, Hawaii products.
The $225 million increase in Timeshare segment revenues from$1,840 million to $2,065 million reflected a $170 million increase intimeshare sales and services revenue, a $46 million increase in costreimbursements revenue, and $9 million of increased base manage-ment fees. The increase in timeshare sales and services revenueprimarily reflects newer projects that reached reportability thresholdsin 2007 and increased services and financing revenue. Higher base
management fees reflect the growing number of timeshare resortsunder management. Timeshare segment revenues include $50 mil-lion and $41 million of interest income for 2007 and 2006, respec-tively, and note sale gains of $81 million and $77 million for 2007and 2006, respectively, recorded in our Consolidated Statements ofIncome on the “Timeshare sales and services” revenue line, associ-ated with Timeshare segment notes receivable.
Segment results of $306 million in 2007 increased by $26 millionover 2006 and primarily reflected $9 million of increased base man-agement fees, $12 million of increased joint venture equity results,and $11 million of lower general, administrative, and other expenses,partially offset by $7 million of lower timeshare sales and services rev-enue net of expenses. Timeshare sales and services revenue net ofdirect expenses of $350 million decreased by $7 million, as com-pared to the prior year, primarily reflecting flat development revenuenet of product costs and marketing and selling costs and $12 millionof increased financing revenue net of financing expenses, partially off-set by the $15 million reversal of contingency reserves in 2006 and$4 million of lower services revenue net of services expenses. Flatdevelopment revenue net of product costs and marketing and sellingcosts reflected newer projects that reached reportability thresholds in2007, offset by several other projects that were approaching sell-out.The increase in financing revenue net of financing costs primarilyreflects increased accretion, interest income, and higher note salegains in 2007, as compared to 2006. As compared to the prior year,the $12 million increase in joint venture equity results primarily reflectsstrong demand in 2007 for our products in Kapalua, Hawaii andstart-up costs in 2006 associated with that joint venture. The $11 mil-lion decrease in general, administrative, and other expenses reflectedlower program and systems expenses in 2007.
2006 COMPARED TO 2005Timeshare contract sales increased by 17 percent in 2006.Timeshare segment revenues of $1,840 million and $1,721 million in2006 and 2005, respectively, include $41 million and $38 million for2006 and 2005, respectively, of interest income, recorded in ourConsolidated Statements of Income on the “Timeshare sales andservices” revenue line, associated with Timeshare segment notesreceivable. The $119 million increase in Timeshare segment rev-enues reflects a $90 million increase in Timeshare sales and serv-ices revenue, a $27 million increase in cost reimbursementsrevenue, and $2 million of increased base management fees. The$90 million increase in Timeshare sales and services revenue prima-rily reflects $77 million of revenue in 2006 from note securitizationgains. As detailed earlier in the “Cumulative Effect of Change inAccounting Principle” narrative, note securitization gains of $69 mil-lion for 2005 are not reflected in revenue, but instead are a compo-nent of gains and other income.
HISTORICAL INFORMATIONThe following graphs show the number of Timeshare segment ownersand the Timeshare segment results for each of the last five fiscal years.
34 Marriott International, Inc. 2007
2003 2004 2005 2006
TIMESHARE SEGMENT OWNERS
252,
000
278,
600
319,
000
343,
000
371,
000
2007
TIMESHARESEGMENT RESULTS
($ IN MILLIONS)
2003 2004 2005 2006
$149
$203
$271 $2
80 $306
2007

Segment results of $280 million in 2006 increased by $9 millionover 2005. The $9 million increase includes an increase of $98 mil-lion for Timeshare sales and services revenue net of direct expensesand a $2 million increase in base management fees, partially offsetby a decline of $72 million in gains and other income, a $16 millionincrease in general, administrative, and other expenses, and $3 million of lower joint venture equity earnings. The increase inTimeshare sales and services revenue net of direct expenses of $98 million largely reflects $77 million of revenue in 2006 from notesecuritization gains. Note securitization gains of $69 million for 2005are not reflected in revenue, but instead are a component of gainsand other income. Also reflected in the $98 million variance, devel-opment revenue net of expenses increased by $14 million primarilyreflecting lower development expenses in 2006 associated withprojects in the early stages of development that did not reach rev-enue recognition thresholds and the timing of expenses associatedwith SOP 04-2, implemented in 2006. Additionally, the $98 millionvariance reflected a $15 million reversal of marketing related contin-gency reserves and $12 million of higher financing revenue net ofexpense, partially offset by $21 million of lower services revenue netof expenses. The $3 million decline in equity income primarilyreflects start-up losses associated with several new joint ventures,partially offset by improved performance at other joint ventures. The$72 million decline in gains and other income primarily reflected $69million of note securitization gains in 2005 versus the recording ofnote securitization gains in revenue for 2006, while the $16 millionincrease in general, administrative, and other expenses reflectedhigher program and joint venture development expenses, and cus-tomary increases in ordinary costs such as wages and benefits.
Investment in Leveraged LeaseHistorically, we had a $23 million investment in an aircraft leveragedlease with Delta, which we acquired in 1994. The gross investmentwas comprised of rentals receivable and the residual value of theaircraft offset by unearned income. On September 14, 2005, Deltafiled for bankruptcy protection under Chapter 11 of the U.S.Bankruptcy Code and informed us that it wished to restructure the lease. As a result, our investment was impaired and we hadrecorded pretax charges of approximately $18 million through 2006.We recorded an additional $5 million loss related to this investmentin fiscal 2007. We have no remaining exposure related to this histor-ical investment.
Effective Tax RateTax credits contributed by our synthetic fuel operations have signifi-cantly reduced our effective tax rate during the last several years.As we exited the business in November 2007 our future effectivetax rate is likely to increase significantly, thereby reducing our after-tax profits.
DISCONTINUED OPERATIONS
Synthetic FuelThe tax credits provided under Internal Revenue Code Section 45Kwere only available for the production and sale of synthetic fuelsproduced from coal through December 31, 2007. Given high oilprices during 2007 and the anticipated and related phase-out of asignificant portion of tax credits available for synthetic fuel producedand sold in 2007, we permanently ceased operations at our syn-thetic fuel facilities on November 3, 2007 and report this businessas a discontinued operation. See Footnote No. 2, “DiscontinuedOperations,” and Footnote No. 17, “Contingencies,” in this reportfor additional information regarding the Synthetic Fuel segment.
2007 COMPARED TO 2006For 2007, the synthetic fuel operation generated revenue of $352million versus revenue of $165 million for the prior year, primarilyreflecting higher production in 2007. Production in 2006 reflectedproduction suspensions instituted in response to high oil prices.Income from the Synthetic Fuel segment declined from $5 million in2006 to a loss of $1 million in 2007, primarily reflecting increasedoperating losses associated with higher production in 2007, partiallyoffset by increased revenue and increased tax credits associatedwith higher production and, on the increased operating losses, ahigher tax benefit. Results for 2007 also reflect an estimated 70.71percent phase-out of tax credits due to high oil prices versus aphase-out that was estimated at year-end 2006 to be 39 percent for2006. Additionally, results in 2007 reflect interest costs of $8 millionassociated with hedges entered into in response to high oil prices.
2006 COMPARED TO 2005For 2006, the synthetic fuel operation generated revenue of $165million versus revenue of $421 million for the prior year, primarilyreflecting significantly lower production in 2006 as a result of pro-duction suspensions instituted in response to high oil prices.Income from the Synthetic Fuel segment declined from $125 millionin 2005 to $5 million in 2006, primarily as a result of both lower pro-duction in 2006 and the estimated 39 percent phase-out of taxcredits at year-end 2006 due to high oil prices in 2006. Additionally,results in 2006 reflect interest costs of $4 million associated withhedges entered into in response to high oil prices. Segment resultsfor 2006 also reflect a $5 million charge reflecting the write-down ofassets at the Alabama production facility as the adjacent mine wasclosed at year-end and we did not anticipate operating the facilityagain at this location.
Distribution ServicesIn 2005, we had income, net of tax, of $1 million associated withthe distribution services business that we exited in 2002.
New Accounting StandardsFASB Interpretation No. 48, “Accounting for Uncertainty inIncome Taxes”We adopted FASB Interpretation No. 48, “Accounting for Uncertaintyin Income Taxes,” (“FIN 48”) on December 30, 2006, the first day ofour 2007 fiscal year. FIN 48 is an interpretation of FASB StatementNo. 109, “Accounting for Income Taxes,” which seeks to standardizepractices associated with certain aspects of measurement andrecognition in accounting for income taxes. FIN 48 prescribes arecognition threshold and measurement requirement for the financialstatement recognition of a tax position taken or expected to betaken on a tax return. Additionally, FIN 48 provides guidance on de-recognition, classification, interest and penalties, accounting ininterim periods, disclosure, and transition. Under FIN 48, an entitymay only recognize or continue to recognize tax positions that meeta “more likely than not” threshold. We recorded the cumulative effectof applying FIN 48 of $155 million as an adjustment to the openingbalance of retained earnings and additional paid-in-capital onDecember 30, 2006, the first day of our 2007 fiscal year. SeeFootnote No. 3, “Income Taxes,” for additional information.
Financial Accounting Standards No. 156, “Accounting forServicing of Financial Assets-an Amendment of FASBStatement No. 140”We adopted FASB’s FAS No. 156 on December 30, 2006, the firstday of our 2007 fiscal year. FAS No. 156 requires that all separatelyrecognized servicing assets and liabilities initially be measured at fairvalue, if practicable. It also allows an entity to subsequently elect fairvalue measurement for its servicing assets and liabilities. We
Marriott International, Inc. 2007 35
recorded the cumulative effect of applying FAS No. 156, of $1 mil-lion, net of tax, as an adjustment to the opening balance of retainedearnings on December 30, 2006. See Footnote No. 11, “AssetSecuritizations,” for additional information.
Future Adoption of Accounting StandardsEITF Issue No. 06-8, “Applicability of the Assessment of aBuyer’s Continuing Investment under FASB Statement No.66, Accounting for Sales of Real Estate, for Sales ofCondominiums”In November 2006, the Emerging Issues Task Force of FASB(“EITF”) reached a consensus on EITF Issue No. 06-8, “Applicabilityof the Assessment of a Buyer’s Continuing Investment under FASBStatement No. 66, Accounting for Sales of Real Estate, for Sales ofCondominiums” (“EITF 06-8”). EITF 06-8 will require condominiumsales to meet the continuing investment criterion in FAS No. 66 inorder to recognize profit under the percentage of completionmethod. EITF 06-8 will be effective for annual reporting periodsbeginning after March 15, 2007, which for us begins with our 2008fiscal year. The cumulative effect of applying EITF 06-8, if any, willbe recorded as an adjustment to the opening balance of retainedearnings in the year of adoption. We do not expect the impact ofadoption of EITF 06-8 to be material.
FAS No. 157, “Fair Value Measurements”In September 2006, the FASB issued FAS No. 157, “Fair ValueMeasurements” (“FAS No. 157”). This standard defines fair value,establishes a methodology for measuring fair value, and expandsthe required disclosure for fair value measurements. FAS No. 157 iseffective for fiscal years beginning after November 15, 2007, whichfor us begins with our 2008 fiscal year. Provisions of FAS No. 157must be applied prospectively as of the beginning of the first fiscalyear in which FAS No. 157 is applied. In November 2007, the FASBagreed to partially defer the effective date, for one year, of FAS No. 157, for non-financial assets and liabilities, except those thatare recognized or disclosed at fair value in the financial statementson a recurring basis. We are currently evaluating the impact thatFAS No. 157 will have on our financial statements.
Financial Accounting Standards No. 159, “The Fair ValueOption for Financial Assets and Financial LiabilitiesIncluding an Amendment of FASB Statement No. 115”In February 2007, the FASB issued FAS No. 159, “The Fair ValueOption for Financial Assets and Financial Liabilities Including anAmendment of FASB Statement No. 115” (“FAS No. 159”). Thisstandard permits entities to choose to measure many financialinstruments and certain other items at fair value and is effective forthe first fiscal year beginning after November 15, 2007, which for usbegins with our 2008 fiscal year. We do not expect to elect the fairvalue measurement option for any financial assets or liabilities at thepresent time.
EITF Issue No. 07-6, “Accounting for Sales of Real EstateSubject to the Requirements of FASB Statement No. 66,‘Accounting for Sales of Real Estate,’ When the AgreementIncludes a Buy-Sell Clause”In December 2007, the EITF reached a consensus on EITF Issue No. 07-6, “Accounting for Sales of Real Estate Subject to theRequirements of FASB Statement No. 66, ‘Accounting for Sales ofReal Estate,’ When the Agreement Includes a Buy-Sell Clause”(“EITF 07-6”). EITF 07-6 clarifies whether a buy-sell clause is a pro-hibited form of continuing involvement that would preclude partialsales treatment under FAS No. 66. EITF 07-6 is effective for newarrangements entered into and assessments of existing transactionsoriginally accounted for under the deposit, profit-sharing, leasing, orfinancing methods for reasons other than the exercise of a buy-sell
clause performed in fiscal years beginning after December 15, 2007,which for us begins with our 2008 fiscal year. We do not expect EITF 07-6 to have a material impact on our financial statements.
Financial Accounting Standards No. 141 (Revised 2007),“Business Combinations”On December 4, 2007, the FASB issued FAS No. 141 (Revised2007), “Business Combinations” (“FAS No. 141(R)”). FAS No. 141(R)will significantly change the accounting for business combinations.Under FAS No. 141(R), an acquiring entity will be required to recog-nize all the assets acquired and liabilities assumed in a transactionat the acquisition-date fair value with limited exceptions. FAS No. 141(R) also includes a substantial number of new disclosurerequirements. FAS No. 141(R) applies prospectively to businesscombinations for which the acquisition date is on or after the begin-ning of the first annual reporting period beginning on or afterDecember 15, 2008, which for us begins with our 2009 fiscal year.We are currently evaluating the impact that FAS No. 141(R) will haveon our financial statements.
Financial Accounting Standards No. 160, “Non-controllingInterests in Consolidated Financial Statements-anAmendment of ARB No. 51”On December 4, 2007, the FASB issued FAS No. 160, “Non-controlling Interests in Consolidated Financial Statements-anAmendment of Accounting Research Bulletin (“ARB”) No. 51” (“FASNo. 160”). FAS No. 160 establishes new accounting and reportingstandards for a non-controlling interest in a subsidiary and for thedeconsolidation of a subsidiary. Specifically, this statement requiresthe recognition of a non-controlling interest (minority interest) asequity in the consolidated financial statements separate from theparent’s equity. The amount of net income attributable to the non-controlling interest will be included in consolidated net income onthe face of the income statement. FAS No. 160 clarifies thatchanges in a parent’s ownership interest in a subsidiary that do notresult in deconsolidation are equity transactions if the parent retainsits controlling financial interest. In addition, this statement requiresthat a parent recognize a gain or loss in net income when a sub-sidiary is deconsolidated. Such gain or loss will be measured usingthe fair value of the non-controlling equity investment on the decon-solidation date. FAS No. 160 also includes expanded disclosurerequirements regarding the interests of the parent and its non-con-trolling interest. FAS No. 160 is effective for fiscal years, and interimperiods within those fiscal years, beginning on or after December 15,2008, which for us begins with our 2009 fiscal year. We are cur-rently evaluating the impact that FAS No. 160 will have on ourfinancial statements.
LIQUIDITY AND CAPITAL RESOURCES
Cash Requirements and Our Credit FacilitiesWe are party to a multicurrency revolving credit agreement that pro-vides for borrowings and letters of credit and supports our commer-cial paper program. On May 14, 2007, we amended and restatedthis facility to increase the aggregate borrowings available under thefacility from $2 billion to $2.5 billion and extended the expiration ofthe facility from 2011 to 2012. The material terms of the amendedand restated credit agreement were otherwise unchanged.Borrowings under the facility bear interest at the London InterbankOffered Rate (LIBOR) plus a spread based on our public debt rat-ing. Additionally, we pay annual fees on the facility at a rate alsobased on our public debt rating. We do not anticipate that fluctua-tions in the availability of the commercial paper market will affect ourliquidity because of the flexibility provided by our credit facility. Weclassify commercial paper as long-term debt based on our abilityand intent to refinance it on a long-term basis.
36 Marriott International, Inc. 2007

At year-end 2007, our available borrowing capacity amounted to$2.151 billion and reflected borrowing capacity of $2.5 billion underthe credit facility, plus our cash balance of $332 million, less lettersof credit outstanding totaling $96 million, and less $585 million ofoutstanding commercial paper supported by the facility. We con-sider these resources, together with cash we expect to generatefrom operations, adequate to meet our short-term and long-termliquidity requirements, finance our long-term growth plans, meetdebt service, and fulfill other cash requirements. We periodicallyevaluate opportunities to issue and sell additional debt or equitysecurities, obtain credit facilities from lenders, or repurchase,refinance, or otherwise restructure our long-term debt for strategicreasons, or to further strengthen our financial position.
We issue short-term commercial paper in the United States andin Europe. Our commercial paper issuances are subject to the then-current demand for our commercial paper in each of these markets,as we have no commitments from buyers to purchase our commer-cial paper. We reserve unused capacity under our credit facility torepay outstanding commercial paper borrowings in the event thatthe commercial paper market is not available to us for any reasonwhen outstanding borrowings mature.
We monitor the status of the capital markets and regularly evalu-ate the effect that changes in capital market conditions may haveon our ability to execute our announced growth plans. We expectthat part of our financing and liquidity needs will continue to be metthrough commercial paper borrowings and access to long-termcommitted credit facilities. If conditions in the lodging industry dete-riorate, or if disruptions in the commercial paper market take placeas they did in the immediate aftermath of September 11, 2001, wemay be unable to place some or all of our commercial paper on atemporary or extended basis and may have to rely more on borrow-ings under the credit facility, which may or may not carry a highercost than commercial paper.
Cash from OperationsCash from operations, depreciation expense, and amortizationexpense for the last three fiscal years are as follows:
($ in millions) 2007 2006 2005
Cash from operations $778 $970 $840Depreciation expense 162 155 156Amortization expense 35 33 28
Our ratio of current assets to current liabilities was roughly 1.2 to1.0 at year-end 2007 and 1.3 to 1.0 at year-end 2006. We minimizeworking capital through cash management, strict credit-grantingpolicies, aggressive collection efforts, and high inventory turnover.We also have significant borrowing capacity under our revolvingcredit facility should we need additional working capital.
Our ratios of earnings to fixed charges for the last five fiscalyears, the calculations of which are detailed in Exhibit 12 to thisreport, are as follows:
Fiscal Years
2007 2006 2005 2004 2003
4.3x 5.3x 4.6x 4.9x 3.9x
While our Timeshare segment generates strong operating cashflow, year-to-year cash flow varies based on the timing of both cashoutlays for the acquisition and development of new resorts andcash received from purchaser financing. We include timesharereportable sales we finance in cash from operations when we collect
cash payments or the notes are sold for cash. The following tableshows the net operating activity from our Timeshare segment(which does not include the portion of income from continuing oper-ations from our Timeshare segment):
($ in millions) 2007 2006 2005
Timeshare segment development (in excess of) less than cost of sales $ (55) $ (83) $ 40
New Timeshare segment mortgages, net of collections (559) (537) (441)
Note repurchases (30) (55) (23)Financially reportable sales (in excess of)
less than closed sales (16) 61 (57)Note sale gains (81) (77) (69)Note sale proceeds 515 508 399Collection on retained interests in notes
sold and servicing fees 106 96 90Other cash (outflows) inflows (35) (17) 26
Net cash outflows from Timeshare segment activity $(155) $(104) $ (35)
Our ability to sell Timeshare segment notes is dependent uponcontinued liquidity within the asset-backed and broader structuredcredit markets. While the recent dislocation in the capital marketshas resulted in a general reduction in liquidity for new asset-backedissuances, we believe that demand remains sufficient for our contin-ued sale of Timeshare segment notes, albeit at somewhat lessfavorable terms. If the liquidity of the markets decreases further, orthe underlying quality of any future Timeshare segment notes weoriginate were to deteriorate, we might have increased difficulty orbe unable to consummate such sales, although we do not expectsuch deterioration.
Investing Activities Cash FlowsCapital Expenditures and Other Investments. Capital expendi-tures of $671 million in 2007, $529 million in 2006, and $780 millionin 2005 included expenditures related to the development and con-struction of new hotels and acquisitions of hotel properties, as wellas improvements to existing properties and systems initiatives.Timeshare segment development expenditures, which are includedin “Cash from Operations,” as noted in that section’s narrative, arenot reflected in these numbers. Over time, we have sold lodgingproperties under development subject to long-term managementagreements. The ability of third-party purchasers to raise the neces-sary debt and equity capital depends in part on the perceived risksinherent in the lodging industry and other constraints inherent in thecapital markets as a whole. Although we expect to continue to con-summate such real estate sales, if we were unable to do so, our liq-uidity could decrease and we could have increased exposure to theoperating risks of owning real estate. We monitor the status of thecapital markets and regularly evaluate the potential impact on ourbusiness operations of changes in capital market conditions. Wealso expect to continue to make other investments in connectionwith adding units to our lodging business. These investmentsinclude loans and minority equity investments.
Fluctuations in the values of hotel real estate generally have littleimpact on the overall results of our Lodging segments because: (1)we own less than 1 percent of the total number of hotels that weoperate or franchise; (2) management and franchise fees are gener-ally based upon hotel revenues and profits rather than current hotelproperty values; and (3) our management agreements generally donot terminate upon hotel sale.
Marriott International, Inc. 2007 37

At the end of 2007, we were party to a venture that developed andmarketed fractional ownership and residential interests. Subsequent toyear-end 2007, we purchased our partner’s interest in the joint ven-ture. Concurrent with this transaction, we purchased additional landfrom our partner as well. Cash consideration for this transactiontotaled $37 million and we acquired assets and liabilities totaling $74million and $37 million, respectively, on the date of purchase.
Dispositions. Property and asset sales generated cash pro-ceeds of $745 million in 2007, $798 million in 2006, and $298 mil-lion in 2005. In 2007, we closed on the sales of 13 properties andfive joint venture investments. Cash proceeds of $90 million for aparcel of land sold in 2007 are not reflected in the $745 million asthe proceeds were initially recorded as a deposit because of a con-tingency. Accordingly, these proceeds impacted the “Other investingactivities” section of our Consolidated Statements of Cash Flowsrather than “Dispositions.”
Loan Activity. We have made loans to owners of hotels that weoperate or franchise, typically to facilitate the development of a newhotel. Based on historical experience, over time we expect theseowners to repay the loans in accordance with the loan agreements,or earlier as the hotels mature and capital markets permit. Loan col-lections and sales, net of advances during 2007, amounted to $75million. Lodging senior loans outstanding totaled $7 million (whichincluded a current portion of $4 million) at year-end 2007 and $9million (which included a current portion of $1 million) at year-end2006. Lodging mezzanine and other loans totaled $206 million(which included a current portion of $18 million) at year-end 2007and $268 million (which included a current portion of $32 million) atyear-end 2006. In 2007 our notes receivable balance associatedwith Lodging senior loans and Lodging mezzanine and other loans,declined by $64 million and primarily reflects the repayment or saleof several loans and the reserve against an underperforming loan.
Equity and Cost Method Investments. Cash outflows of $40million in 2007 associated with equity and cost method investmentsprimarily reflects our investments in two joint ventures. Cash out-flows of $95 million in 2006 associated with equity and cost methodinvestments primarily reflects our investments in three joint ventures.Cash outflows of $216 million in 2005 associated with equity andcost method investments primarily reflects our establishment in2005 of a 50/50 joint venture with Whitbread PLC (“Whitbread”). Foradditional information regarding Whitbread see Footnote No. 10,“Marriott and Whitbread Joint Venture” in our 2006 Form 10-K.
Cash from Financing ActivitiesDebt. Debt increased by $1,132 million in 2007, from $1,833 millionto $2,965 million at year-end 2007, due to the issuance of $346million (book value at issuance) of Series I Senior Notes (describedmore fully below), the issuance of $397 million (book value atissuance) of Series J Senior Notes (described more fully below), anet increase in commercial paper outstanding of $270 million andother debt increases of $119 million. Debt increased by $96 millionin 2006, from $1,737 million to $1,833 million at year-end 2006,due to the issuance of $349 million (book value at issuance) ofSeries H Senior Notes, partially offset by a net reduction in com-mercial paper outstanding of $184 million, and other debtdecreases of $69 million.
In 2007, we issued $350 million of aggregate principal amountof 6.375 percent Series I Senior Notes due 2017. The offering of
the notes closed on June 25, 2007. We received net proceedsbefore expenses of approximately $346 million from this offering,after deducting the underwriting discount and estimated expensesof the offering. We used these proceeds for general corporate pur-poses, including the repayment of commercial paper borrowings.Interest on these notes will be paid on June 15 and December 15of each year, and commenced on December 15, 2007. The noteswill mature on June 15, 2017, and are redeemable, in whole or inpart, at any time and from time to time under the terms provided inthe form of note.
Also in 2007, we issued $400 million of aggregate principalamount of 5.625 percent Series J Senior Notes due 2013. Theoffering of the notes closed on October 19, 2007. We received netproceeds before expenses of approximately $396 million from thisoffering, after deducting the underwriting discount and estimatedexpenses of the offering. We used these proceeds for general cor-porate purposes, including working capital, acquisitions, stockrepurchases and the repayment of commercial paper borrowings.Interest on these notes will be paid on February 15 and August 15of each year, and commenced on February 15, 2008. The notes willmature on February 15, 2013, and are redeemable, in whole or inpart, at any time and from time to time under the terms provided inthe form of note.
Both the Series I Senior Notes and the Series J Senior Noteswere issued under an indenture with The Bank of New York, succes-sor to JPMorgan Chase Bank, N.A. (formerly known as The ChaseManhattan Bank), as trustee, dated as of November 16, 1998.
Our financial objectives include diversifying our financingsources, optimizing the mix and maturity of our long-term debt andreducing our working capital. At year-end 2007, our long-term debthad an average interest rate of 6.0 percent and an average maturityof approximately 5.9 years. The ratio of fixed-rate long-term debt tototal long-term debt was 0.8 to 1.0 at year-end 2007. At the end of2007, we had long-term public debt ratings of BBB from Standardand Poor’s and Baa2 from Moody’s.
Subsequent to year-end 2007, on January 15, 2008, we made a$94 million cash payment of principal and interest to retire, at matu-rity, all of our outstanding Series E Senior Notes.
Share Repurchases. We purchased 41.0 million shares of ourClass A Common Stock in 2007 at an average price of $43.32per share, 41.5 million shares of our Class A Common Stock in2006 at an average price of $38.13per share, and 51.4 million sharesof our Class A Common Stock in2005 at an average price of $32.12per share. We purchase shares inthe open market and in privatelynegotiated transactions. As of year-end 2007, 33.2 million sharesremained available for repurchaseunder authorizations from ourBoard of Directors.
The adjacent graph shows ourdiluted weighted average sharescount at year-end for each of thelast five fiscal years.
Dividends. In April 2007, our Board of Directors increased thequarterly cash dividend by 2 percent to $0.0750 per share.
38 Marriott International, Inc. 2007
2003 2004 2005 2006
DILUTED SHARES
(IN MILLIONS)
490.
8
481.
0
462.
3
2007
430.
2
397.
3
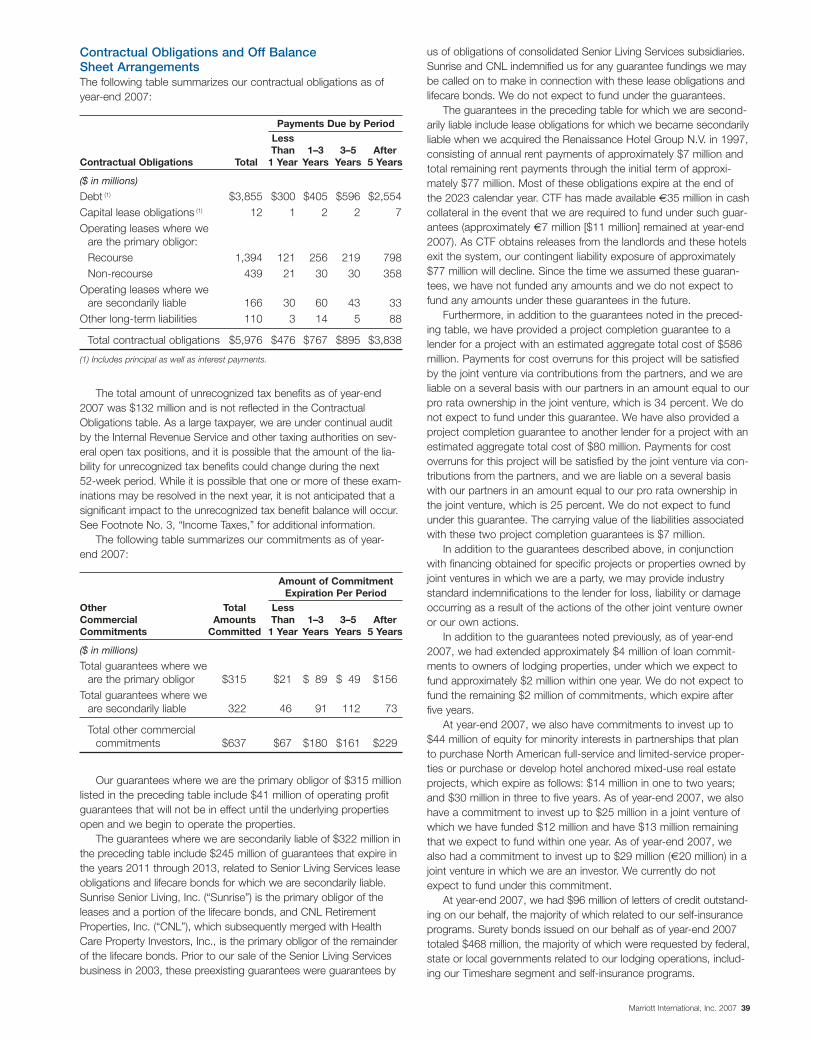
Contractual Obligations and Off Balance Sheet ArrangementsThe following table summarizes our contractual obligations as ofyear-end 2007:
Payments Due by PeriodLessThan 1–3 3–5 After
Contractual Obligations Total 1 Year Years Years 5 Years
($ in millions)
Debt (1) $3,855 $300 $405 $596 $2,554Capital lease obligations (1) 12 1 2 2 7Operating leases where we
are the primary obligor:Recourse 1,394 121 256 219 798Non-recourse 439 21 30 30 358
Operating leases where we are secondarily liable 166 30 60 43 33
Other long-term liabilities 110 3 14 5 88
Total contractual obligations $5,976 $476 $767 $895 $3,838
(1) Includes principal as well as interest payments.
The total amount of unrecognized tax benefits as of year-end2007 was $132 million and is not reflected in the ContractualObligations table. As a large taxpayer, we are under continual auditby the Internal Revenue Service and other taxing authorities on sev-eral open tax positions, and it is possible that the amount of the lia-bility for unrecognized tax benefits could change during the next52-week period. While it is possible that one or more of these exam-inations may be resolved in the next year, it is not anticipated that asignificant impact to the unrecognized tax benefit balance will occur.See Footnote No. 3, “Income Taxes,” for additional information.
The following table summarizes our commitments as of year-end 2007:
Amount of Commitment Expiration Per Period
Other Total LessCommercial Amounts Than 1–3 3–5 AfterCommitments Committed 1 Year Years Years 5 Years
($ in millions)
Total guarantees where we are the primary obligor $315 $21 $ 89 $ 49 $156
Total guarantees where we are secondarily liable 322 46 91 112 73
Total other commercial commitments $637 $67 $180 $161 $229
Our guarantees where we are the primary obligor of $315 millionlisted in the preceding table include $41 million of operating profitguarantees that will not be in effect until the underlying propertiesopen and we begin to operate the properties.
The guarantees where we are secondarily liable of $322 million inthe preceding table include $245 million of guarantees that expire inthe years 2011 through 2013, related to Senior Living Services leaseobligations and lifecare bonds for which we are secondarily liable.Sunrise Senior Living, Inc. (“Sunrise”) is the primary obligor of theleases and a portion of the lifecare bonds, and CNL RetirementProperties, Inc. (“CNL”), which subsequently merged with HealthCare Property Investors, Inc., is the primary obligor of the remainderof the lifecare bonds. Prior to our sale of the Senior Living Servicesbusiness in 2003, these preexisting guarantees were guarantees by
us of obligations of consolidated Senior Living Services subsidiaries.Sunrise and CNL indemnified us for any guarantee fundings we maybe called on to make in connection with these lease obligations andlifecare bonds. We do not expect to fund under the guarantees.
The guarantees in the preceding table for which we are second-arily liable include lease obligations for which we became secondarilyliable when we acquired the Renaissance Hotel Group N.V. in 1997,consisting of annual rent payments of approximately $7 million andtotal remaining rent payments through the initial term of approxi-mately $77 million. Most of these obligations expire at the end ofthe 2023 calendar year. CTF has made available €35 million in cashcollateral in the event that we are required to fund under such guar-antees (approximately €7 million [$11 million] remained at year-end2007). As CTF obtains releases from the landlords and these hotelsexit the system, our contingent liability exposure of approximately$77 million will decline. Since the time we assumed these guaran-tees, we have not funded any amounts and we do not expect tofund any amounts under these guarantees in the future.
Furthermore, in addition to the guarantees noted in the preced-ing table, we have provided a project completion guarantee to alender for a project with an estimated aggregate total cost of $586million. Payments for cost overruns for this project will be satisfiedby the joint venture via contributions from the partners, and we areliable on a several basis with our partners in an amount equal to ourpro rata ownership in the joint venture, which is 34 percent. We donot expect to fund under this guarantee. We have also provided aproject completion guarantee to another lender for a project with anestimated aggregate total cost of $80 million. Payments for costoverruns for this project will be satisfied by the joint venture via con-tributions from the partners, and we are liable on a several basiswith our partners in an amount equal to our pro rata ownership inthe joint venture, which is 25 percent. We do not expect to fundunder this guarantee. The carrying value of the liabilities associatedwith these two project completion guarantees is $7 million.
In addition to the guarantees described above, in conjunctionwith financing obtained for specific projects or properties owned byjoint ventures in which we are a party, we may provide industrystandard indemnifications to the lender for loss, liability or damageoccurring as a result of the actions of the other joint venture owneror our own actions.
In addition to the guarantees noted previously, as of year-end2007, we had extended approximately $4 million of loan commit-ments to owners of lodging properties, under which we expect tofund approximately $2 million within one year. We do not expect tofund the remaining $2 million of commitments, which expire afterfive years.
At year-end 2007, we also have commitments to invest up to$44 million of equity for minority interests in partnerships that planto purchase North American full-service and limited-service proper-ties or purchase or develop hotel anchored mixed-use real estateprojects, which expire as follows: $14 million in one to two years;and $30 million in three to five years. As of year-end 2007, we alsohave a commitment to invest up to $25 million in a joint venture ofwhich we have funded $12 million and have $13 million remainingthat we expect to fund within one year. As of year-end 2007, wealso had a commitment to invest up to $29 million (€20 million) in ajoint venture in which we are an investor. We currently do notexpect to fund under this commitment.
At year-end 2007, we had $96 million of letters of credit outstand-ing on our behalf, the majority of which related to our self-insuranceprograms. Surety bonds issued on our behalf as of year-end 2007totaled $468 million, the majority of which were requested by federal,state or local governments related to our lodging operations, includ-ing our Timeshare segment and self-insurance programs.
Marriott International, Inc. 2007 39

In the normal course of the hotel management business, weenter into purchase commitments to manage the daily operatingneeds of hotels we manage for owners. Since we are reimbursedfrom the cash flows of the hotels, these obligations have minimalimpact on our net income and cash flow.
RELATED PARTY TRANSACTIONS
Equity Method InvestmentsWe have equity method investments in entities that own propertiesfor which we provide management and/or franchise services andreceive fees. In addition, in some cases we provide loans, preferredequity or guarantees to these entities. Our ownership interest inthese equity method investments generally varies from 10 to 50percent. The amount of consolidated retained earnings that repre-sents undistributed earnings attributable to our equity investmentstotaled $9 million at year-end 2007.
The following tables present financial data resulting from trans-actions with these related parties:
Income Statement Data
($ in millions) 2007 2006 2005
Base management fees $ 56 $ 62 $ 83Franchise fees 1 2 2Incentive management fees 26 22 14Cost reimbursements 510 649 936Owned, leased, corporate housing,
and other revenue — — 19
Total revenue $ 593 $ 735 $1,054
General, administrative, and other $ (4) $ (1) $ (19)Reimbursed costs (510) (649) (936)Gains and other income 25 28 54Interest expense (1) (1) —Interest income 4 4 31(Provision for) reversal of provision for
loan losses (12) 1 —Equity in earnings 15 3 36
Balance Sheet Data
At Year- At Year-End End
($ in millions) 2007 2006
Current assets-accounts and notes receivable $ 42 $ 76
Deferred development 2 —Contract acquisition costs 33 34Equity and cost method investments 316 377Loans to equity method investees 21 27Long-term deferred tax asset, net 1 4Current liabilities:
Other payables and accruals (2) (2)Other long-term liabilities (16) (13)
CRITICAL ACCOUNTING ESTIMATESThe preparation of financial statements in accordance with U.S.generally accepted accounting principles (“GAAP”) requires man-agement to make estimates and assumptions that affect reportedamounts and related disclosures. Management considers anaccounting estimate to be critical if:
3 it requires assumptions to be made that were uncertain atthe time the estimate was made; and
3 changes in the estimate, or different estimates that couldhave been selected, could have a material effect on ourconsolidated results of operations or financial condition.
Management has discussed the development and selection ofits critical accounting estimates with the Audit Committee of theBoard of Directors, and the Audit Committee has reviewed the dis-closure presented below relating to them.
Marriott RewardsMarriott Rewards is our frequent guest loyalty program. MarriottRewards members earn points based on their monetary spending at our lodging operations, purchases of timeshare interval, fractionalownership, and residential products and, to a lesser degree, throughparticipation in affiliated partners’ programs, such as those offeredby car rental and credit card companies. Points, which we track onmembers’ behalf, can be redeemed for stays at most of our lodgingoperations, airline tickets, airline frequent flyer program miles, rentalcars, and a variety of other awards; however, points cannot beredeemed for cash. We provide Marriott Rewards as a marketingprogram to participating properties. We charge the cost of operatingthe program, including the estimated cost of award redemption, toproperties based on members’ qualifying expenditures.
We defer revenue received from managed, franchised, andMarriott-owned/leased hotels and program partners equal to the fair value of our future redemption obligation. We determine the fairvalue of the future redemption obligation based on statistical formu-las that project timing of future point redemption based on historicallevels, including an estimate of the “breakage” for points that willnever be redeemed, and an estimate of the points that will eventu-ally be redeemed. These judgment factors determine the requiredliability for outstanding points.
Our management and franchise agreements require that we bereimbursed currently for the costs of operating the program, includ-ing marketing, promotion, communication with, and performingmember services for the Marriott Rewards members. Due to therequirement that properties reimburse us for program operatingcosts as incurred, we receive and recognize the balance of the rev-enue from properties in connection with the Marriott Rewards pro-gram at the time such costs are incurred and expensed. Werecognize the component of revenue from program partners thatcorresponds to program maintenance services over the expected lifeof the points awarded. Upon the redemption of points, we recognizeas revenue the amounts previously deferred and recognize the corre-sponding expense relating to the costs of the awards redeemed.
Valuation of GoodwillWe evaluate the fair value of goodwill to assess potential impair-ments on an annual basis, or during the year if an event or othercircumstance indicates that we may not be able to recover the car-rying amount of the asset. We evaluate the fair value of goodwill atthe reporting unit level and make that determination based uponfuture cash flow projections that assume certain growth projectionswhich may or may not occur. We record an impairment loss forgoodwill when the carrying value of the intangible asset is less thanits estimated fair value.
40 Marriott International, Inc. 2007

Loan Loss ReservesLodging Senior Loans and Lodging Mezzanine and Other LoansWe measure loan impairment based on the present value ofexpected future cash flows discounted at the loan’s original effectiveinterest rate or the estimated fair value of the collateral. For impairedloans, we establish a specific impairment reserve for the differencebetween the recorded investment in the loan and the present valueof the expected future cash flows, that assumes certain growth pro-jections which may or may not occur, or the estimated fair value ofthe collateral. We apply our loan impairment policy individually to allloans in the portfolio and do not aggregate loans for the purpose ofapplying such policy. Where we determine that a loan is impaired,we recognize interest income on a cash basis. At year-end 2007,our recorded investment in impaired loans was $112 million. Wehad a $92 million allowance for credit losses, leaving $20 million of our investment in impaired loans for which there was no relatedallowance for credit losses. At year-end 2006, our recorded invest-ment in impaired loans was $92 million. We had a $70 millionallowance for credit losses, leaving $22 million of our investment inimpaired loans for which there was no related allowance for creditlosses. During 2007 and 2006, our average investment in impairedloans totaled $102 million and $138 million, respectively.
Loans to Timeshare OwnersIn accordance with the adoption of SOP 04-2 in 2006, we recordan estimate of expected uncollectibility on notes receivable that wereceive from timeshare purchasers as a reduction of revenue at the time we recognize profit on a timeshare sale. We assess uncol-lectibility based on pools of receivables, because we hold largenumbers of homogeneous timeshare notes receivable. We estimateuncollectibles based on historical activity for similar timeshare notesreceivable over the past three years. We use a technique referred toas static pool analysis, which tracks uncollectibles for each year’ssales over the life of those notes. At year-end 2007 and year-end2006, our allowance for credit losses associated with “Loans totimeshare owners” totaled $19 million and $29 million, respectively.
Legal ContingenciesWe are subject to various legal proceedings and claims, the out-comes of which are subject to significant uncertainty. We record an accrual for loss contingencies when a loss is probable and theamount of the loss can be reasonably estimated. We review theseaccruals each reporting period and make revisions based onchanges in facts and circumstances.
Income TaxesWe record the current year amounts payable or refundable, as wellas the consequences of events that give rise to deferred tax assetsand liabilities based on differences in how those events are treatedfor tax purposes. We base our estimate of deferred tax assets andliabilities on current tax laws and rates and, in certain cases, busi-ness plans and other expectations about future outcomes.
Changes in existing laws and rates and their related interpreta-tions, and future business results may affect the amount of deferredtax liabilities or the valuation of deferred tax assets over time. Ouraccounting for deferred tax consequences represents manage-ment’s best estimate of future events that can be appropriatelyreflected in the accounting estimates.
OTHER MATTERS
InflationInflation has been moderate in recent years and has not had a sig-nificant impact on our businesses.
QUANTITATIVE AND QUALITATIVE DISCLOSURES ABOUTMARKET RISKWe are exposed to market risk from changes in interest rates, for-eign exchange rates, and debt and equity prices, and with respectto our synthetic fuel business, changes in oil prices. We manageour exposure to these risks by monitoring available financing alter-natives, through development and application of credit grantingpolicies and by entering into derivative arrangements. We do notforesee any significant changes in either our exposure to fluctua-tions in interest rates or foreign exchange rates or how such expo-sure is managed in the future.
We are exposed to interest rate risk on our floating-rate notesreceivable, our residual interests retained in connection with the saleof Timeshare segment notes receivable and the fair value of ourfixed-rate notes receivable. Changes in interest rates also impactour floating-rate long-term debt and the fair value of our fixed-ratelong-term debt.
We are also subject to risk from changes in debt and equityprices from our investments in debt securities and common stock,which have a carrying value of $55 million at year-end 2007, whichwe account for as available-for-sale securities under FAS No. 115,“Accounting for Certain Investments in Debt and Equity Securities.”
We use derivative instruments as part of our overall strategy tomanage our exposure to market risks associated with fluctuations ininterest rates and foreign currency exchange rates. As a matter ofpolicy, we do not use derivatives for trading or speculative purposes.
At year-end 2007, we were party to the following derivativeinstruments:
3 An interest rate swap agreement under which we receive afloating rate of interest and pay a fixed rate of interest. Theswap modifies our interest rate exposure by effectively con-verting a note receivable with a fixed rate to a floating rate.The aggregate notional amount of the swap was $92 millionand it matures in 2010.
3 Four outstanding interest rate swap agreements to manageinterest rate risk associated with the residual interests weretain in conjunction with our timeshare note sales.Historically, we have been required by purchasers and/orrating agencies to utilize interest rate swaps to protect theexcess spread within our sold-note pools. The aggregatenotional amount of the swaps was $157 million, and theyexpire through 2022.
3 Option contracts to hedge the potential volatility of earningsand cash flows associated with variations in foreignexchange rates during 2008. The aggregate dollar equivalentof the notional amounts of the contracts was approximately$86 million, and they expire throughout 2008.
3 Forward contracts to hedge forecasted transactions for con-tracts denominated in foreign currencies. The aggregate dol-lar equivalent of the notional amounts was approximately $58million, and they expire in 2008 and 2010.
3 Forward foreign exchange contracts to manage the foreigncurrency exposure related to certain monetary assets. Theaggregate dollar equivalent of the notional amounts of theforward contracts was $133 million at year-end 2007.
3 Oil price hedges to manage the volatility associated with oilprices and the uncertainty surrounding the potential phase-out of tax credits in 2007. The hedges cover 19 million bar-rels of oil and expired on December 31, 2007.
Marriott International, Inc. 2007 41

The following table sets forth the scheduled maturities and the total fair value of our derivatives and other financial instruments as of year-end 2007:
Maturities by PeriodTotal Total
Carrying Fair($ in millions) 2008 2009 2010 2011 2012 Thereafter Amount Value
Assets—Maturities represent expected principal receipts, fair values represent assets.
Timeshare segment notes receivable $ 68 $ 47 $ 42 $ 38 $ 38 $ 243 $ 476 $ 476Average interest rate 12.70%
Fixed-rate notes receivable $ 17 $ 4 $ 88 $ — $ — $ 25 $ 134 $ 138Average interest rate 12.05%
Floating-rate notes receivable $ 4 $ — $ 4 $ 20 $ 19 $ 32 $ 79 $ 79Average interest rate 7.04%
Residual interests $ 81 $ 55 $ 36 $ 24 $ 16 $ 26 $ 238 $ 238Average interest rate 9.02%
Liabilities—Maturities represent expected principal payments, fair values represent liabilities.
Fixed-rate debt $(137) $(113) $(47) $(14) $(354) $(1,639) $(2,304) $(2,338)Average interest rate 6.12%
Floating-rate debt $ (34) $ — $ — $ — $ — $ (585) $ (619) $ (619)Average interest rate 5.53%
NOTE: We classify commercial paper as long-term debt based on our ability and intent to refinance it on a long-term basis.
Derivatives—Maturities represent notional amounts, fair values represent assets (liabilities).
Interest Rate Swaps:
Fixed to variable $ — $ — $ 93 $ — $ 238 $ 123 $ (7) $ (7)Average pay rate 4.02%Average receive rate 3.64%
Variable to fixed $ — $ — $ — $ — $ — $ 34 $ — $ —Average pay rate 5.23%Average receive rate 4.01%
Forward Foreign Exchange Contracts:
Fixed (EUR) to Fixed (USD) $ 69 $ — $ — $ — $ — $ — $ — $ —Average exchange rate 1.47
Fixed (GBP) to Fixed (USD) $ 46 $ — $ — $ — $ — $ — $ — $ —Average exchange rate 2.00
Fixed (HKD) to Fixed (USD) $ 38 $ — $ — $ — $ — $ — $ — $ —Average Exchange Rate 0.13
Fixed (MXN) to Fixed (USD) $ 13 $ — $ — $ — $ — $ — $ — $ —Average Exchange Rate 0.09
Fixed (JPY) to Fixed (USD) $ 3 $ — $ — $ — $ — $ — $ — $ —Average Exchange Rate 0.01
Fixed (CAD) to Fixed (USD) $ 43 $ — $ — $ — $ — $ — $ — $ —Average Exchange Rate 1.02
Fixed (THB) to Fixed (USD) $ 39 $ — $ 25 $ — $ — $ — $ — $ —Average Exchange Rate 0.03
Oil Price Hedges:
Contract Amount $ 14 $ — $ — $ — $ — $ — $ 4 $ 4(Contract volume is 19 million barrels)
42 Marriott International, Inc. 2007

Fiscal Years 2007, 2006, and 2005 2007 2006 2005
($ in millions, except per share amounts)
REVENUESBase management fees (1) $ 620 $ 553 $ 497Franchise fees (1) 439 390 329Incentive management fees (1) 369 281 201Owned, leased, corporate housing, and other revenue (1) 1,240 1,119 944Timeshare sales and services (including note sale gains of
$81 million for 2007 and $77 million for 2006) 1,747 1,577 1,487Cost reimbursements (1) 8,575 8,075 7,671
12,990 11,995 11,129
OPERATING COSTS AND EXPENSESOwned, leased, and corporate housing-direct 1,062 936 778Timeshare-direct 1,397 1,220 1,228Reimbursed costs (1) 8,575 8,075 7,671General, administrative, and other (1) 768 677 753
11,802 10,908 10,430
OPERATING INCOME 1,188 1,087 699Gains and other income (1) 97 74 149Interest expense (1) (184) (124) (106)Interest income (1) 38 49 79(Provision for) reversal of provision for loan losses (1) (17) 3 (28)Equity in earnings (1) 15 3 36
INCOME FROM CONTINUING OPERATIONS BEFORE INCOME TAXES AND MINORITY INTEREST 1,137 1,092 829
Provision for income taxes (441) (380) (284)Minority interest 1 — (2)
INCOME FROM CONTINUING OPERATIONS 697 712 543Cumulative effect of change in accounting principle, net of tax — (109) —Discontinued operations, net of tax (1) 5 126
NET INCOME $ 696 $ 608 $ 669
EARNINGS PER SHARE-BasicEarnings from continuing operations $ 1.85 $ 1.76 $ 1.26Losses from cumulative effect of accounting change — (0.27) —Earnings from discontinued operations — 0.01 0.29
Earnings per share $ 1.85 $ 1.50 $ 1.55
EARNINGS PER SHARE-DilutedEarnings from continuing operations $ 1.75 $ 1.65 $ 1.17Losses from cumulative effect of accounting change — (0.25) —Earnings from discontinued operations — 0.01 0.28
Earnings per share $ 1.75 $ 1.41 $ 1.45
DIVIDENDS DECLARED PER SHARE $0.2875 $0.2400 $0.2000
(1) See Footnote No. 21, “Related Party Transactions,” of the Notes to Consolidated Financial Statements for disclosure of related party amounts.
See Notes to Consolidated Financial Statements
Consolidated Statements of Income
Marriott International, Inc. 2007 43

Fiscal Year-End 2007 and 2006 2007 2006
($ in millions)
ASSETSCurrent assets
Cash and equivalents $ 332 $ 191Accounts and notes receivable (1) 1,148 1,060Inventory 1,557 1,186Current deferred taxes, net 185 200Assets held for sale 123 411Discontinued operations 53 91Other 174 180
3,572 3,319Property and equipment 1,329 1,233
Intangible assetsGoodwill 921 921Contract acquisition costs (1) 635 575
1,556 1,496Equity and cost method investments (1) 343 402
Notes receivableLoans to equity method investees (1) 21 27Loans to timeshare owners 408 316Other notes receivable 171 217
600 560
Other long-term receivables 176 178Deferred taxes, net (1) 678 665Other (1) 688 735
$ 8,942 $ 8,588
LIABILITIES AND SHAREHOLDERS’ EQUITYCurrent liabilities
Current portion of long-term debt $ 175 $ 15Accounts payable (1) 789 658Accrued payroll and benefits 642 614Liability for guest loyalty program 421 384Liabilities of assets held for sale — 102Timeshare segment deferred revenue 101 178Liabilities related to discontinued operations 13 55Other payables and accruals (1) 735 516
2,876 2,522Long-term debt 2,790 1,818Liability for guest loyalty program 971 847Self-insurance reserves 182 184Other long-term liabilities (1) 694 599
Shareholders’ equityClass A Common Stock 5 5Additional paid-in-capital 3,531 3,617Retained earnings 3,332 2,860Treasury stock, at cost (5,490) (3,908)Accumulated other comprehensive income 51 44
1,429 2,618
$ 8,942 $ 8,588
(1) See Footnote No. 21, “Related Party Transactions,” of the Notes to Consolidated Financial Statements for disclosure of related party amounts.
See Notes to Consolidated Financial Statements
Consolidated Balance Sheets
44 Marriott International, Inc. 2007

Fiscal Years 2007, 2006, and 2005 2007 2006 2005
($ in millions)
OPERATING ACTIVITIES
Net income $ 696 $ 608 $ 669
Adjustments to reconcile to cash provided by operating activities:
Depreciation and amortization 197 188 184
Minority interest (3) (7) (44)
Income taxes (150) (76) (86)
Timeshare activity, net (155) (104) (35)
Liability for guest loyalty program 122 113 125
Cumulative effect of change in accounting principle — 109 —
Working capital changes and other 71 139 27
Net cash provided by operating activities 778 970 840
INVESTING ACTIVITIES
Capital expenditures (671) (529) (780)
Dispositions 745 798 298
Loan advances (31) (59) (56)
Loan collections and sales 106 121 706
Equity and cost method investments (40) (95) (216)
Purchase of available-for-sale securities — (27) (15)
Sale of available-for-sale securities 43 — —
Other (27) (90) (67)
Net cash provided by (used in) investing activities 125 119 (130)
FINANCING ACTIVITIES
Commercial paper, net 258 (188) 499
Issuance of long-term debt 820 352 356
Repayment of long-term debt (153) (17) (523)
Debt exchange consideration, net — — (29)
Issuance of Class A Common Stock 203 378 125
Dividends paid (105) (93) (84)
Purchase of treasury stock (1,757) (1,546) (1,644)
Other (28) 15 26
Net cash used in financing activities (762) (1,099) (1,274)
INCREASE (DECREASE) IN CASH AND EQUIVALENTS 141 (10) (564)
CASH AND EQUIVALENTS, beginning of year 191 201 765
CASH AND EQUIVALENTS, end of year $ 332 $ 191 $ 201
See Notes to Consolidated Financial Statements
Consolidated Statements of Cash Flows
Marriott International, Inc. 2007 45

Fiscal Years 2007, 2006, and 2005 2007 2006 2005
($ in millions)
Net income $696 $608 $669Other comprehensive income (loss), net of tax:
Foreign currency translation adjustments 35 28 (25)Other derivative instrument adjustments (2) — (2)Unrealized losses on available-for-sale securities (8) 27 7Reclassification of gains upon sale of available-for-sale securities (18) — —
Total other comprehensive income (loss) 7 55 (20)
Comprehensive income $703 $663 $649
See Notes to Consolidated Financial Statements
Consolidated Statements of Shareholders’ EquityFiscal Years 2007, 2006, and 2005
(in millions, except per share amounts) AccumulatedCommon Class A Additional Treasury OtherShares Common Paid-in Deferred Retained Stock, at Comprehensive
Outstanding Stock Capital Compensation Earnings Cost Income (Loss)
451.6 Balance at fiscal year-end 2004 $5 $3,421 $(108) $1,951 $(1,197) $ 9— Net income — — — 669 — —— Dividends ($0.2000 per share) — — — (87) — —
11.6 Employee stock plan issuance and other — 141 (29) (33) 180 (20)(51.4) Purchase of treasury stock — — — — (1,650) —
411.8 Balance at fiscal year-end 2005 5 3,562 (137) 2,500 (2,667) (11)— Net income — — — 608 — —— Dividends ($0.2400 per share) — — — (96) — —
19.2 Employee stock plan issuance and other — 192 — (152) 343 55— Impact of adoption of FAS No. 123(R) — (137) 137 — — —
(41.5) Purchase of treasury stock — — — — (1,584) —
389.5 Balance at fiscal year-end 2006 5 3,617 — 2,860 (3,908) 44— Impact of adoption of FAS No. 156 — — — 1 — —— Impact of adoption of FIN 48 — (121) — (34) — —
389.5 Opening balance fiscal year 2007 5 3,496 — 2,827 (3,908) 44— Net income — — — 696 — —— Dividends ($0.2875 per share) — — — (107) — —
8.6 Employee stock plan issuance and other — 35 — (84) 195 7(41.0) Purchase of treasury stock — — — — (1,777) —
357.1 Balance at fiscal year-end 2007 $5 $3,531 $ — $3,332 $(5,490) $ 51
See Notes to Consolidated Financial Statements
Consolidated Statements of Comprehensive Income
46 Marriott International, Inc. 2007

1 SUMMARY OF SIGNIFICANT ACCOUNTING POLICIES
Basis of PresentationThe consolidated financial statements present the results of opera-tions, financial position, and cash flows of Marriott International, Inc.(together with its subsidiaries, “we,” “us,” or the “Company”).
The preparation of financial statements in conformity with U.S.generally accepted accounting principles (“GAAP”) requires manage-ment to make estimates and assumptions that affect the reportedamounts of assets and liabilities as of the date of the financial state-ments, the reported amounts of revenues and expenses during the reporting periods, and the disclosures of contingent liabilities.Accordingly, ultimate results could differ from those estimates.
As a result of the discontinuation of our synthetic fuel businesson November 3, 2007, the balances and activities of the syntheticfuel reportable segment have been segregated and reported asdiscontinued operations for all periods presented.
At the beginning of our 2006 fiscal year, we adopted Statementof Position 04-2, “Accounting for Real Estate Time-SharingTransactions,” (“SOP 04-2”) as issued by the American Institute ofCertified Public Accountants. The American Resort DevelopmentAssociation, a timeshare trade association of which we are a mem-ber and the Staff of the Securities and Exchange Commission(“SEC”) had communications regarding SOP 04-2 and the incomestatement presentation of timeshare note securitization gains. As aresult of those communications, we now classify Timeshare segmentnote securitization gains within our “Timeshare sales and services”revenue caption. Accordingly, Timeshare sales and services revenuereflects Timeshare segment note securitization gains of $81 millionand $77 million for 2007 and 2006, respectively. Gains from thesale of timeshare notes receivable totaling $69 million for 2005, are classified within the “Gains and other income” caption in ourConsolidated Statements of Income.
We have reclassified certain prior year amounts to conform toour 2007 presentation. In our opinion, the accompanying consoli-dated financial statements reflect all normal and recurring adjust-ments necessary to present fairly our financial position at fiscalyear-end 2007 and fiscal year-end 2006 and the results of our oper-ations and cash flows for fiscal years 2007, 2006, and 2005. Wehave eliminated all material intercompany transactions and balancesbetween entities consolidated in these financial statements.
Fiscal YearOur fiscal year ends on the Friday nearest to December 31. Unlessotherwise specified, each reference to a particular year means thefiscal year ended on the date shown in the following table, ratherthan the corresponding calendar year:
Fiscal Fiscal Fiscal FiscalYear Year-end Date Year Year-end Date
2007 December 28, 2007 2003 January 2, 20042006 December 29, 2006 2002 January 3, 20032005 December 30, 2005 2001 December 28, 20012004 December 31, 2004 2000 December 29, 2000
Revenue RecognitionOur revenues include: (1) base management and incentive manage-ment fees; (2) franchise fees; (3) revenues from lodging propertiesand other businesses owned or leased by us; (4) timeshare sales
and services, which also includes resort rental revenue, interestincome associated with our “Loans to timeshare owners,” and for2006 and 2007, Timeshare segment note securitization gains, asnoted in the “Basis of Presentation” caption earlier; and (5) costreimbursements. Management fees comprise a base fee, which is apercentage of the revenues of hotels, and an incentive fee, which isgenerally based on hotel profitability. Franchise fees comprise initialapplication fees and continuing royalties generated from our fran-chise programs, which permit the hotel owners and operators touse certain of our brand names. Cost reimbursements includedirect and indirect costs that are reimbursed to us by lodging prop-erties that we manage or franchise.
Base Management and Incentive Management Fees: Werecognize base management fees as revenue when earned inaccordance with the contract. In interim periods and at year-end,we recognize incentive management fees that would be due as ifthe contract were to terminate at that date, exclusive of any termi-nation fees payable or receivable by us.
Franchise Fee Revenue: We recognize franchise fees as revenuein each accounting period as fees are earned from the franchisee.
Owned and Leased Units: We recognize room sales and rev-enues from other guest services for our owned and leased unitswhen rooms are occupied and services have been rendered.
Timeshare and Fractional Intervals and Condominiums: Werecognize sales when: (1) we have received a minimum of 10 per-cent of the purchase price; (2) the purchaser’s period to cancel for a refund has expired; (3) we deem the receivables to be collectible;and (4) we have attained certain minimum sales and constructionlevels. We defer all revenue using the deposit method for sales thatdo not meet all four of these criteria. For sales that do not qualify forfull revenue recognition as the project has progressed beyond thepreliminary stages but has not yet reached completion, all revenueand profit are deferred and recognized in earnings using the per-centage of completion method.
Timeshare Residential (Stand-Alone Structures): We recog-nize sales under the full accrual method of accounting when wereceive our proceeds and transfer title at settlement.
Cost Reimbursements: We recognize cost reimbursementsfrom managed, franchised, and timeshare properties when we incurthe related reimbursable costs.
Other Revenue includes third-party licensing fees, other brand-ing fees, land rental income, and other revenue.
Ground LeasesWe are both the lessor and lessee of land under long-term operat-ing leases, which include scheduled increases in minimum rents.We recognize these scheduled rent increases on a straight-linebasis over the initial lease term.
Real Estate SalesWe account for the sales of real estate in accordance with FinancialAccounting Standards (“FAS”) No. 66, “Accounting for Sales of RealEstate” (“FAS No. 66”). We reduce gains on sales of real estate bythe maximum exposure to loss if we have continuing involvementwith the property and do not transfer substantially all of the risksand rewards of ownership. In sales transactions where we retain amanagement contract, the terms and conditions of the manage-ment contract are generally comparable to the terms and conditionsof the management contracts obtained directly with third-partyowners in competitive bid processes.
Marriott International, Inc. 2007 47
Notes to Consolidated Financial Statements

Profit Sharing PlanWe contribute to a profit sharing plan for the benefit of employeesmeeting certain eligibility requirements and electing participation inthe plan. Contributions are determined based on a specified per-centage of salary deferrals by participating employees. We recog-nized compensation costs from profit sharing of $107 million in2007, $86 million in 2006, and $69 million in 2005.
Self-Insurance ProgramsWe are self-insured for certain levels of property, liability, workers’compensation and employee medical coverage. We accrue esti-mated costs of these self-insurance programs at the present valueof projected settlements for known and incurred but not reportedclaims. We use a discount rate of 4.7 percent to determine thepresent value of the projected settlements, which we consider to bereasonable given our history of settled claims, including paymentpatterns and the fixed nature of the individual settlements.
We are subject to a variety of assessments related to our insur-ance activities, including those by state guaranty funds and work-ers’ compensation second-injury funds. Our liabilities recorded forassessments are reflected within the amounts shown in ourConsolidated Balance Sheets on the self-insurance reserves line,are not discounted, and totaled $5 million for both year-end 2007and year-end 2006. Our liability of $5 million as of year-end 2007 for assessments is expected to be paid by the end of 2008.
Marriott RewardsMarriott Rewards is our frequent guest loyalty program. MarriottRewards members earn points based on their monetary spending atour lodging operations, purchases of timeshare interval, fractionalownership, and residential products and, to a lesser degree, throughparticipation in affiliated partners’ programs, such as those offeredby airlines and credit card companies. Points, which we track onmembers’ behalf, can be redeemed for stays at most of our lodgingoperations, airline tickets, airline frequent flyer program miles, rentalcars, and a variety of other awards; however, points cannot beredeemed for cash. We provide Marriott Rewards as a marketingprogram to participating properties. We charge the cost of operatingthe program, including the estimated cost of award redemption, toproperties based on members’ qualifying expenditures.
We defer revenue received from managed, franchised, andMarriott-owned/leased hotels and program partners equal to the fair value of our future redemption obligation. We determine the fairvalue of the future redemption obligation based on statistical formu-las that project timing of future point redemption based on historicallevels, including an estimate of the “breakage” for points that willnever be redeemed, and an estimate of the points that will eventu-ally be redeemed. These judgment factors determine the requiredliability for outstanding points.
Our management and franchise agreements require that we bereimbursed currently for the costs of operating the program, includ-ing marketing, promotion, communication with, and performingmember services for the Marriott Rewards members. Due to therequirement that hotels reimburse us for program operating costsas incurred, we receive and recognize the balance of the revenuefrom properties in connection with the Marriott Rewards program atthe time such costs are incurred and expensed. We recognize thecomponent of revenue from program partners that corresponds toprogram maintenance services over the expected life of the pointsawarded. Upon the redemption of points, we recognize as revenuethe amounts previously deferred and recognize the correspondingexpense relating to the costs of the awards redeemed. Our liabilityfor the Marriott Rewards program was $1,392 million at year-end2007 and $1,231 million at year-end 2006.
GuaranteesWe record a liability for the fair value of a guarantee on the date aguarantee is issued or modified. The offsetting entry depends onthe circumstances in which the guarantee was issued. Fundingunder the guarantee reduces the recorded liability. When no fundingis forecasted, the liability is amortized into income on a straight-linebasis over the remaining term of the guarantee.
Rebates and AllowancesWe participate in various vendor rebate and allowance arrangementsas a manager of hotel properties. There are three types of programsthat are common in the hotel industry that are sometimes referred toas “rebates” or “allowances,” including unrestricted rebates, market-ing (restricted) rebates and sponsorships. The primary business pur-pose of these arrangements is to secure favorable pricing for ourhotel owners for various products and services or enhanceresources for promotional campaigns co-sponsored by certain ven-dors. More specifically, unrestricted rebates are funds returned to the buyer, generally based upon volumes or quantities of goods pur-chased. Marketing (restricted) allowances are funds allocated byvendor agreements for certain marketing or other joint promotionalinitiatives. Sponsorships are funds paid by vendors, generally usedby the vendor to gain exposure at meetings and events, which areaccounted for as a reduction of the cost of the event.
We account for rebates and allowances as adjustments of theprices of the vendors’ products and services. We show vendorcosts and the reimbursement of those costs as reimbursed costsand cost reimbursements revenue, respectively; therefore, rebatesare reflected as a reduction of these line items.
Cash and EquivalentsWe consider all highly liquid investments with an initial maturity ofthree months or less at date of purchase to be cash equivalents.
Restricted CashRestricted cash, totaling $153 million and $117 million at year-end2007 and year-end 2006, respectively, is recorded in the “Otherlong-term assets” line in the accompanying Consolidated BalanceSheets. Restricted cash primarily consists of deposits received ontimeshare interval, fractional ownership, and residential sales thatare held in escrow until the contract is closed.
Assets Held for SaleWe consider properties (other than Timeshare segment interval,fractional ownership, and residential products, which we classify asinventory) to be assets held for sale when all of the following criteriaare met:
3 management commits to a plan to sell a property;
3 it is unlikely that the disposal plan will be significantly modi-fied or discontinued;
3 the property is available for immediate sale in its present con-dition;
3 actions required to complete the sale of the property havebeen initiated;
3 sale of the property is probable and we expect the com-pleted sale will occur within one year; and
3 the property is actively being marketed for sale at a price thatis reasonable given its current market value.
Upon designation as an asset held for sale, we record the carrying value of each property at the lower of its carrying value or its estimated fair value, less estimated costs to sell, and wecease depreciation.
48 Marriott International, Inc. 2007

Assets held for sale totaled $123 million at year-end 2007 and consisted of property and equipment. The $123 million totalreflected the following segment composition: North American Full-Service-$17 million; North American Limited-Service-$17 million;and Luxury-$89 million. There were no liabilities of assets held forsale at year-end 2007.
Assets held for sale totaled $411 million at year-end 2006 andconsisted of property and equipment of $391 million, accountsreceivable of $10 million, cash of $6 million, and other assets of $4million. The $411 million total reflected the following segment com-position: International Lodging-$295 million; Luxury Lodging-$73million; and North American Full-Service Lodging-$43 million.Liabilities of assets held for sale totaled $102 million at year-end2006 and consisted of debt totaling $81 million, accounts payableof $11 million, accrued payroll and benefits of $8 million, and otherpayables and accruals of $2 million.
In 2007 we reclassified the balances associated with one prop-erty, in conformity with other “held and used” properties, as theproperty no longer satisfied the criteria to be classified as “held forsale.” In conjunction with that reclassification, we recorded depreci-ation expense of $4 million in 2007 that would have been recog-nized in 2006 and $4 million in late 2007 that would have beenrecognized earlier in 2007 had the asset been continuously classi-fied as “held and used.”
Loan Loss ReservesLodging Senior Loans and Lodging Mezzanine and Other LoansWe measure loan impairment based on the present value ofexpected future cash flows discounted at the loan’s original effectiveinterest rate or the estimated fair value of the collateral. For impairedloans, we establish a specific impairment reserve for the differencebetween the recorded investment in the loan and the present valueof the expected future cash flows or the estimated fair value of thecollateral. We apply our loan impairment policy individually to allloans in the portfolio and do not aggregate loans for the purpose ofapplying such policy. For loans that we have determined to beimpaired, we recognize interest income on a cash basis.
Loans to Timeshare OwnersWe record an estimate of expected uncollectibility on notes receiv-able that we receive from timeshare purchasers as a reduction ofrevenue at the time we recognize profit on a timeshare sale. Weassess uncollectibility based on pools of receivables because wehold large numbers of homogeneous timeshare notes receivable.We estimate uncollectibles based on historical activity for similartimeshare notes receivable over the past three years. We use atechnique referred to as static pool analysis, which tracks uncol-lectibles for each year’s sales over the life of those notes.
Valuation of GoodwillWe evaluate the fair value of goodwill to assess potential impairmentson an annual basis, or during the year if an event or other circumstanceindicates that we may not be able to recover the carrying amount ofthe asset. We evaluate the fair value of goodwill at the reporting unitlevel and make that determination based upon future cash flow projec-tions that assume certain growth projections which may or may notoccur. We record an impairment loss for goodwill when the carryingvalue of the intangible asset is less than its estimated fair value.
InvestmentsWe consolidate entities that we control. We account for investmentsin joint ventures using the equity method of accounting when weexercise significant influence over the venture. If we do not exercisesignificant influence, we account for the investment using the cost
method of accounting. We account for investments in limited part-nerships and limited liability companies using the equity method ofaccounting when we own more than a minimal investment. Ourownership interest in these equity method investments varies gener-ally from 10 percent to 50 percent.
The fair value of our available-for-sale securities totaled $55 mil-lion and $107 million at year-end 2007 and year-end 2006, respec-tively. We included net unrealized holding gains on available-for-salesecurities of $9 million at year-end 2007 and $35 million at year-end2006 in accumulated other comprehensive income. The amount ofnet gains reclassified out of accumulated other comprehensiveincome as a result of the sale of available-for-sale securities totaled$18 million and zero for 2007 and 2006, respectively. We determinedthe cost basis of the securities sold using specific identification.
Costs Incurred to Sell Real Estate ProjectsWe charge the majority of sales and marketing costs we incur tosell timeshares to expense when incurred. Selling and marketingcosts capitalized were $6 million at year-end 2007 and $16 millionat year-end 2006 and are included in the accompanyingConsolidated Balance Sheets in the “Other” caption within the“Current assets” section. If a contract is canceled, we charge unre-coverable direct selling and marketing costs to expense and recorddeposits forfeited as income.
Residual InterestsWe periodically sell notes receivable originated by our Timeshare seg-ment in connection with the sale of timeshare interval and fractionalproducts. We continue to service the notes and transfer all proceedscollected to special purpose entities. We retain servicing assets andother interests in the notes and account for these assets and interestsas residual interests. The interests are limited to the present value ofcash available after paying financing expenses and program fees andabsorbing credit losses. Prior to the start of the 2007 fiscal year, wemeasured servicing assets at the date of sale at their allocated previ-ous carrying amount based on relative fair value, classified thoseassets as held to maturity under the provisions of FAS No. 115,“Accounting for Certain Investments in Debt and Equity Securities”(“FAS No. 115”), and recorded those assets at amortized cost. OnDecember 30, 2006, the first day of fiscal year 2007, we adopted FASNo. 156, “Accounting for Servicing of Financial Assets-an Amendmentof Financial Accounting Standards Board (“FASB”) Statement No. 140”(“FAS No. 156”). FAS No. 156 requires that all separately recognizedservicing assets and liabilities be initially measured at fair value, if prac-ticable. It also allows an entity to subsequently elect fair value meas-urement for its servicing assets and liabilities. In conjunction with theadoption of FAS No. 156, we elected to subsequently measure ourservicing assets using the fair value method. Under the fair valuemethod, we carry servicing assets on the balance sheet at fair valueand report the changes in fair value, primarily due to changes in valua-tion inputs and assumptions and to the collection or realization ofexpected cash flows, in earnings in the period in which the changeoccurs. For additional information regarding the adoption of FAS No.156, see Footnote No. 11, “Asset Securitizations.”
We treat the residual interests, including servicing assets, as“trading” securities under the provisions of FAS No. 115. At thedates of sale and at the end of each reporting period, we estimatethe fair value of the residual interests, including servicing assets,using a discounted cash flow model. We report changes in the fairvalues of these residual interests, including servicing assets, throughthe accompanying Consolidated Statements of Income.
The rate of prepayment of loans serviced is the most significant esti-mate involved in the measurement process. Estimates of prepaymentrates are based on management’s expectations of future prepayment
Marriott International, Inc. 2007 49

rates, reflecting our historical rate of loan repayments, industry trends,and other considerations. Actual prepayment rates differ from thoseprojected by management due to changes in a variety of economicfactors, including prevailing interest rates and the availability of alterna-tive financing sources to borrowers. If actual prepayments of the loansbeing serviced were to occur more slowly than had been projected, thecarrying value of servicing assets could increase, and servicing incomewould exceed previously projected amounts. Accordingly, the servicingassets actually realized, could differ from the amounts initially recorded.
Derivative InstrumentsWe use derivative instruments as part of our overall strategy to man-age our exposure to market risks associated with fluctuations ininterest rates and foreign currency exchange rates. As a matter ofpolicy, we do not use derivatives for trading or speculative purposes.
We record all derivatives at fair value either as assets or liabili-ties. We recognize, currently in earnings, changes in fair value ofderivatives not designated as hedging instruments and of deriva-tives designated as fair value hedging instruments. We recordchanges in the fair value of the hedged item in a fair value hedge asan adjustment to the carrying amount of the hedged item and rec-ognize the change in the fair value of the derivative in earnings inthe same income statement line item.
We record the effective portion of changes in fair value of deriva-tives designated as cash flow hedging instruments as a componentof other comprehensive income and report the ineffective portioncurrently in earnings. We reclassify amounts included in other com-prehensive income into earnings in the same period during whichthe hedged item affects earnings.
Foreign OperationsThe U.S. dollar is the functional currency of our consolidated andunconsolidated entities operating in the United States. The functionalcurrency for our consolidated and unconsolidated entities operatingoutside of the United States is generally the currency of the primaryeconomic environment in which the entity primarily generates andexpends cash. We translate the financial statements of consolidatedentities whose functional currency is not the U.S. dollar into U.S. dol-lars, and we do the same, as needed, for unconsolidated entitieswhose functional currency is not the U.S. dollar. We translate assetsand liabilities at the exchange rate in effect as of the financial state-ment date and translate income statement accounts using theweighted average exchange rate for the period. We include translationadjustments from foreign exchange and the effect of exchange ratechanges on intercompany transactions of a long-term investmentnature as a separate component of shareholders’ equity. We reportgains and losses from foreign exchange rate changes related to inter-company receivables and payables that are not of a long-term invest-ment nature, as well as gains and losses from foreign currencytransactions, currently in operating costs and expenses, and thoseamounted to a $2 million loss in 2007, a $6 million gain in 2006, and a$5 million loss in 2005. Gains and other income for 2007 included $6million attributable to currency translation adjustment gains, net oflosses, from the sale or complete or substantially complete liquidationof investments. There were no similar gains or losses in 2006 or 2005.
New Accounting StandardsFASB Interpretation No. 48, “Accounting for Uncertainty inIncome Taxes”We adopted FASB Interpretation No. 48, “Accounting for Uncertaintyin Income Taxes,” (“FIN 48”) on December 30, 2006, the first day ofour 2007 fiscal year. FIN 48 is an interpretation of FASB StatementNo. 109, “Accounting for Income Taxes,” which seeks to standardizepractices associated with certain aspects of measurement and
recognition in accounting for income taxes. FIN 48 prescribes arecognition threshold and measurement requirement for the financialstatement recognition of a tax position taken or expected to betaken on a tax return. Additionally, FIN 48 provides guidance on de-recognition, classification, interest and penalties, accounting ininterim periods, disclosure, and transition. Under FIN 48, an entitymay only recognize or continue to recognize tax positions that meeta “more likely than not” threshold. We recorded the cumulative effectof applying FIN 48 of $155 million as an adjustment to the openingbalance of retained earnings and additional paid-in-capital onDecember 30, 2006, the first day of our 2007 fiscal year. SeeFootnote No. 3, “Income Taxes,” for additional information.
Financial Accounting Standards No. 156, “Accounting forServicing of Financial Assets—an Amendment of FASBStatement No. 140”We adopted FASB’s FAS No. 156 on December 30, 2006, the firstday of our 2007 fiscal year. FAS No. 156 requires that all separatelyrecognized servicing assets and liabilities initially be measured at fairvalue, if practicable. It also allows an entity to subsequently elect fair value measurement for its servicing assets and liabilities. Werecorded the cumulative effect of applying FAS No. 156, of $1 mil-lion, net of tax, as an adjustment to the opening balance of retainedearnings on December 30, 2006. See Footnote No. 11, “AssetSecuritizations,” for additional information.
Future Adoption of Accounting StandardsEITF Issue No. 06-8, “Applicability of the Assessment of a Buyer’s Continuing Investment under FASB StatementNo. 66, Accounting for Sales of Real Estate, for Sales of Condominiums”In November 2006, the Emerging Issues Task Force of FASB (“EITF”)reached a consensus on EITF Issue No. 06-8, “Applicability of theAssessment of a Buyer’s Continuing Investment under FASB State-ment No. 66, Accounting for Sales of Real Estate, for Sales of Condo-miniums” (“EITF 06-8”). EITF 06-8 will require condominium sales tomeet the continuing investment criterion in FAS No. 66 in order to rec-ognize profit under the percentage of completion method. EITF 06-8will be effective for annual reporting periods beginning after March 15,2007, which for us begins with our 2008 fiscal year. The cumulativeeffect of applying EITF 06-8, if any, will be recorded as an adjustmentto the opening balance of retained earnings in the year of adoption.We do not expect the impact of adoption of EITF 06-8 to be material.
Financial Accounting Standards No. 157, “Fair ValueMeasurements”In September 2006, the FASB issued FAS No. 157, “Fair ValueMeasurements” (“FAS No. 157”). This standard defines fair value,establishes a methodology for measuring fair value, and expandsthe required disclosure for fair value measurements. FAS No. 157 iseffective for fiscal years beginning after November 15, 2007, whichfor us begins with our 2008 fiscal year. Provisions of FAS No. 157must be applied prospectively as of the beginning of the first fiscalyear in which FAS No. 157 is applied. In November 2007, the FASBagreed to partially defer the effective date, for one year, of FAS No.157, for non-financial assets and liabilities, except those that arerecognized or disclosed at fair value in the financial statements on arecurring basis. We are currently evaluating the impact that FAS No.157 will have on our financial statements.
Financial Accounting Standards No. 159, “The Fair ValueOption for Financial Assets and Financial LiabilitiesIncluding an Amendment of FASB Statement No. 115”In February 2007, the FASB issued FAS No. 159, “The Fair ValueOption for Financial Assets and Financial Liabilities Including an
50 Marriott International, Inc. 2007

Amendment of FASB Statement No. 115” (“FAS No. 159”). Thisstandard permits entities to choose to measure many financialinstruments and certain other items at fair value and is effective forthe first fiscal year beginning after November 15, 2007, which for usbegins with our 2008 fiscal year. We do not expect to elect the fairvalue measurement option for any financial assets or liabilities at thepresent time.
EITF Issue No. 07-6, “Accounting for Sales of Real EstateSubject to the Requirements of FASB Statement No. 66,‘Accounting for Sales of Real Estate,’ When the AgreementIncludes a Buy-Sell Clause”In December 2007, the EITF reached a consensus on EITF Issue No. 07-6, “Accounting for Sales of Real Estate Subject to theRequirements of FASB Statement No. 66, ‘Accounting for Sales of Real Estate,’ When the Agreement Includes a Buy-Sell Clause”(“EITF 07-6”). EITF 07-6 clarifies whether a buy-sell clause is a pro-hibited form of continuing involvement that would preclude partialsales treatment under FAS No. 66. EITF 07-6 is effective for newarrangements entered into and assessments of existing transactionsoriginally accounted for under the deposit, profit-sharing, leasing, orfinancing methods for reasons other than the exercise of a buy-sellclause performed in fiscal years beginning after December 15, 2007,which for us begins with our 2008 fiscal year. We do not expect EITF07-6 to have a material impact on our financial statements.
Financial Accounting Standards No. 141 (Revised 2007),“Business Combinations”On December 4, 2007, the FASB issued FAS No. 141 (Revised2007), “Business Combinations” (“FAS No. 141(R)”). FAS No.141(R) will significantly change the accounting for business combi-nations. Under FAS No. 141(R), an acquiring entity will be requiredto recognize all the assets acquired and liabilities assumed in atransaction at the acquisition-date fair value with limited exceptions.FAS No. 141(R) also includes a substantial number of new disclo-sure requirements. FAS No. 141(R) applies prospectively to busi-ness combinations for which the acquisition date is on or after thebeginning of the first annual reporting period beginning on or afterDecember 15, 2008, which for us begins with our 2009 fiscal year.We are currently evaluating the impact that FAS No. 141(R) will haveon our financial statements.
Financial Accounting Standards No. 160, “Non-controllingInterests in Consolidated Financial Statements—anAmendment of ARB No. 51”On December 4, 2007, the FASB issued FAS No. 160, “Non-control-ling Interests in Consolidated Financial Statements-an Amendment ofAccounting Research Bulletin (“ARB”) No. 51” (“FAS No. 160”). FASNo. 160 establishes new accounting and reporting standards for anon-controlling interest in a subsidiary and for the deconsolidation ofa subsidiary. Specifically, this statement requires the recognition of anon-controlling interest (minority interest) as equity in the consoli-dated financial statements separate from the parent’s equity. Theamount of net income attributable to the non-controlling interest willbe included in consolidated net income on the face of the incomestatement. FAS No. 160 clarifies that changes in a parent’s owner-ship interest in a subsidiary that do not result in deconsolidation areequity transactions if the parent retains its controlling financial inter-est. In addition, this statement requires that a parent recognize again or loss in net income when a subsidiary is deconsolidated.Such gain or loss will be measured using the fair value of the non-controlling equity investment on the deconsolidation date. FAS No.160 also includes expanded disclosure requirements regarding theinterests of the parent and its non-controlling interest. FAS No. 160
is effective for fiscal years, and interim periods within those fiscalyears, beginning on or after December 15, 2008, which for usbegins with our 2009 fiscal year. We are currently evaluating theimpact that FAS No. 160 will have on our financial statements.
2 DISCONTINUED OPERATIONS
Our synthetic fuel operations consisted of four coal-based syntheticfuel production facilities (the “Facilities”). Because tax credits underSection 45K of the Internal Revenue Code are not available for theproduction and sale of synthetic fuel produced from coal after cal-endar year-end 2007, and because high oil prices during 2007 willresult in the phase-out of a significant portion of the tax creditsavailable for synthetic fuel produced and sold in 2007, onNovember 3, 2007, we shut down the Facilities and permanentlyceased production of synthetic fuel. Accordingly, we now report thisbusiness segment as a discontinued operation. The book value ofthe Facilities was zero at year-end 2007, as the Facilities have beentransferred to third parties. Under the site leases for the Facilities,we were required to restore the leased premises to substantially thecondition the premises were in when the leases were originally exe-cuted. However, we executed agreements with the lessors of thesites pursuant to which we transferred the Facilities to the lessors inexchange for the release of our obligations to restore the leasedpremises to their original condition. Costs associated with shuttingdown the synthetic fuel operation and transferring the Facilities tothe site lessors were not material.
The following table provides additional income statement andbalance sheet information relating to the discontinued operations:
Income Statement Summary
($ in millions) 2007 2006 2005
Revenue $ 352 $165 $ 421
Operating loss $(113) $ (76) $(144)Gains and other (expense) income (6) (15) 32Interest expense (8) (4) —
Loss before income taxes and minority interest (127) (95) (112)
Tax benefit 46 32 23Tax credits 80 62 167
Total tax benefit 126 94 190
(Loss) income before minority interest (1) (1) 78Minority interest — 6 47
(Loss) income on discontinued synthetic fuel business, net of tax (1) 5 125
Income on discontinued distribution services business, net of tax — — 1
Discontinued operations, net of tax $ (1) $ 5 $ 126
Balance Sheet Summary
At At Year-end Year-end
($ in millions) 2007 2006
Property, plant, and equipment $ — $ 5Other assets 53 86Liabilities (13) (55)
Marriott International, Inc. 2007 51

3 INCOME TAXES
We adopted the provisions of FIN 48, on December 30, 2006, thefirst day of fiscal year 2007. As a result of the implementation of FIN48, we recorded a $155 million increase in the net liability for unrec-ognized tax positions, which was recorded as an adjustment to theopening balance of retained earnings and additional paid-in-capitalon December 30, 2006. The total amount of unrecognized tax ben-efits as of year-end 2007 was $132 million. Included in the balanceat year-end 2007 were $97 million of tax positions that, if recog-nized, would impact the effective tax rate. As a large taxpayer, weare under continual audit by the Internal Revenue Service (“IRS”)and other taxing authorities on several open tax positions, and it ispossible that the amount of the liability for unrecognized tax benefitscould change during the next 52-week period. While it is possiblethat one or more of these examinations may be resolved in the nextyear, it is not anticipated that a significant impact to the unrecog-nized tax benefit balance will occur.
The unrecognized tax benefit reconciliation from beginning bal-ance to ending balance is as follows:
($ in millions) Amount
Unrecognized tax benefit at beginning of year (December 30, 2006) $ 244Change attributable to tax positions
taken during a prior period 163Change attributable to tax positions
taken during the current period 5Decrease attributable to settlements
with taxing authorities (279)Decrease attributable to lapse
of statute of limitations (1)
Unrecognized tax benefit at end of year (December 28, 2007) $ 132
In accordance with our accounting policy, we recognize accruedinterest and penalties related to unrecognized tax benefits as acomponent of tax expense. This policy did not change as a result of the adoption of FIN 48. Our Consolidated Statements of Incomefor the year ended December 28, 2007, and our ConsolidatedBalance Sheets as of that date include interest of $18 million and$8 million, respectively.
We file income tax returns, including returns for our subsidiaries,with federal, state, local, and foreign jurisdictions. We are participat-ing in the IRS Compliance Assurance Program (CAP) for the 2006and 2007 tax years and we intend to participate for 2008. This pro-gram accelerates the examination of key transactions with the goalof resolving any issues before the tax return is filed. Our 2005 fed-eral income tax return is currently being examined by the IRS in atraditional audit process. In June 2007, we received IRS RevenueAgents Reports for both the 2000 through 2002 and 2003 through2004 examination cycles. We have fully resolved all issues and arein the final stages of closing these years. Various state, local, andforeign income tax returns are also under examination by taxingauthorities. We do not believe that the outcome of any examinationwill have a material impact on our financial statements.
As disclosed in our 2006 Form 10-K, the IRS was then auditingthe Company’s federal tax returns for the 2000, 2001, and 2002fiscal years. As part of that audit, the IRS reviewed a leveragedemployee stock ownership plan (“ESOP”) feature of the Company’sEmployees’ Profit Sharing, Retirement and Savings Plan (the “Plan”)
that was implemented in a transaction (the “ESOP transaction”) onJune 13, 2000. Principal and interest on the debt related to thetransaction was forgiven over a 26-month period as a mechanismfor funding Company contributions of elective deferrals and match-ing contributions to the Plan. We claimed federal income tax deduc-tions for the forgiven principal on the debt in the amount of $1billion over that period, along with forgiven interest on the debt. Thebenefit related to the tax deductions was reflected in equity and didnot flow through the provision for income taxes.
On June 7, 2007, we reached a settlement of issues raised dur-ing the IRS’ and Department of Labor’s examination of the ESOPfeature of the Plan. The settlement resulted in an after-tax charge inthe 2007 second quarter totaling $54 million and a reduction inshareholders’ equity of $115 million. The $54 million chargeincluded $35 million of excise taxes (impacting general, administra-tive, and other expense), $13 million of interest expense on thoseexcise taxes, and $6 million of income tax expense primarily reflect-ing additional interest. As a result of the settlement, we have madecash payments to the U.S. Treasury and state tax jurisdictions of$205 million through year-end 2007. The remaining cash paymentsof approximately $1 million are expected to be made in 2008. Thepayments reflect income taxes, excise taxes, and interest charges.No penalties were assessed.
Total deferred tax assets and liabilities as of year-end 2007 andyear-end 2006, were as follows:
($ in millions) 2007 2006
Deferred tax assets $1,013 $1,042Deferred tax liabilities (150) (177)
Net deferred taxes $ 863 $ 865
The tax effect of each type of temporary difference and carry-for-ward that gives rise to a significant portion of deferred tax assets andliabilities as of year-end 2007 and year-end 2006, were as follows:
($ in millions) 2007 2006
Self-insurance $ 27 $ 36Employee benefits 282 250Deferred income 30 34Other reserves 42 52Frequent guest program 101 75Tax credits 300 383Net operating loss carry-forwards 132 126Timeshare financing (47) (37)Property, equipment, and intangible assets (45) (32)Other, net 72 12
Deferred taxes 894 899Less: valuation allowance (31) (34)
Net deferred taxes $863 $865
At year-end 2007, we had approximately $74 million of tax cred-its that expire through 2027, $226 million of tax credits that do notexpire, and $656 million of net operating losses, of which $360 mil-lion expire through 2027. The valuation allowance decreased due toforeign net operating losses that we believe will be realized and theexpiration of state net operating losses.
We have made no provision for U.S. income taxes or additionalforeign taxes on the cumulative unremitted earnings of non-U.S.subsidiaries ($738 million as of year-end 2007) because we consider
52 Marriott International, Inc. 2007

these earnings to be permanently invested. These earnings couldbecome subject to additional taxes if remitted as dividends, loanedto us or a U.S. affiliate or if we sold our interests in the affiliates. Wecannot practically estimate the amount of additional taxes thatmight be payable on the unremitted earnings. We conduct businessin countries that grant a “holiday” from income taxes for 10- and30-year periods. The holidays expire through 2034. The aggregateamount of taxes not incurred due to tax “holidays” and the relatedearnings per share impacts are $22 million ($0.06 per diluted share),$22 million ($0.05 per diluted share), and $11 million ($0.02 perdiluted share) for 2007, 2006, and 2005, respectively.
The (provision for) benefit from income taxes consists of:
($ in millions) 2007 2006 2005
Current — Federal $(303) $(287) $(328)— State (59) (61) (56)— Foreign (61) (56) (35)
(423) (404) (419)Deferred — Federal (10) 5 108
— State 1 1 19— Foreign (9) 18 8
(18) 24 135
$(441) $(380) $(284)
The current tax provision does not reflect the benefits attributa-ble to us relating to the exercise of employee stock options of $115 million in 2007, $194 million in 2006, and $87 million in 2005.Included in the preceding table are tax credits of $4 million in eachof 2007 and 2006, and $5 million in 2005. The taxes applicable toother comprehensive income are not material.
A reconciliation of the U.S. statutory tax rate to our effectiveincome tax rate for continuing operations follows:
2007 2006 2005
U.S. statutory tax rate 35.0)% 35.0)% 35.0)%State income taxes, net of U.S.
tax benefit 2.8 2.9 3.0Nondeductible expenses 1.4 0.3 0.3Change in valuation allowance — (1.9) 1.7Foreign income (0.9) (1.8) (4.4)Tax credits (0.3) (0.4) (0.6)Other, net 0.8 0.1 (0.4)
Effective rate 38.8)% 34.2)% 34.6)%
Cash paid for income taxes, net of refunds, was $350 million in2007, $169 million in 2006, and $182 million in 2005.
4 SHARE-BASED COMPENSATION
Under our 2002 Comprehensive Stock and Cash Incentive Plan(“the Comprehensive Plan”), we award: (1) stock options to pur-chase our Class A Common Stock (“Stock Option Program”); (2)share appreciation rights for our Class A Common Stock; (3)restricted stock units of our Class A Common Stock; and (4)deferred stock units. We grant awards at exercise prices or strikeprices that are equal to the market price of our Class A CommonStock on the date of grant.
We adopted FAS No. 123(R) using the modified prospectivetransition method at the beginning of our 2006 first quarter. Inaccordance with the modified prospective transition method, we didnot restate our Consolidated Financial Statements for prior periodsto reflect the impact of FAS No. 123(R). For all share-based awardsgranted after the date we adopted FAS No. 123(R) and for theunvested portion of previously granted share-based awards thatwere outstanding on that date, FAS No. 123(R) requires that wemeasure compensation costs related to our share-based paymenttransactions at fair value on the grant date and that we recognizethose costs in the financial statements over the vesting period dur-ing which the employee provides service in exchange for the award.Previously, under FAS No. 123 and APB Opinion No. 25, weaccounted for our share-based employee compensation plansusing the intrinsic value method under the recognition and measure-ment principles of APB Opinion No. 25 and recognized share-based compensation expense for all awards except for our StockOption Program awards. We recorded share-based compensationexpense related to award grants of $62 million in 2005.
Under FAS No. 123(R), we recorded share-based compensationexpense related to award grants of $104 million in 2007 and $108million in 2006. Deferred compensation costs related to unvestedawards totaled $162 million at year-end 2007 and $168 million atyear-end 2006, and the weighted average period over which weexpect the deferred compensation costs at year-end 2007 to berecognized is two years.
The following table illustrates the effect on net income and earn-ings per share as if we had applied the fair value recognition provi-sions of FAS No. 123 to share-based employee compensation in2005. We have included the impact of measured but unrecognizedcompensation costs and excess tax benefits credited to additionalpaid-in-capital in the calculation of diluted pro forma shares. Inaddition, we have included the estimated impact of reimbursementsfrom third parties. The reported and pro forma net income andearnings per share figures for 2007 and 2006 in the table are thesame because we calculate share-based compensation expenseunder the provisions of FAS No. 123(R). We have included the 2007and 2006 amounts in the table below to provide detail for compara-tive purposes to the 2005 amounts.
($ in millions, except per share amounts) 2007 2006 2005
Net income, as reported $ 696 $ 608 $ 669Add: Share-based employee
compensation expense included in reported net income, net of related tax effects 67 70 40
Deduct: Total share-based employee compensation expense determined under fair value-based method for all awards, net of related tax effects and estimated reimbursed costs (67) (70) (61)
Pro forma net income $ 696 $ 608 $ 648
Earnings per share:Basic-as reported $1.85 $1.50 $1.55
Basic-pro forma $1.85 $1.50 $1.50
Diluted-as reported $1.75 $1.41 $1.45
Diluted-pro forma $1.75 $1.41 $1.40
Marriott International, Inc. 2007 53

FAS No. 123(R) requires that share-based compensationexpense be recognized over the period from the grant date to thedate on which the award is no longer contingent on the employeeproviding additional service (the “substantive vesting period”). Inperiods prior to the adoption of FAS No. 123(R), we showed share-based compensation expense in our pro forma disclosure only foroption awards to retirement-eligible employees over the awards’stated vesting period. In periods prior to the adoption of FAS No.123(R), we recorded share-based compensation expense for ourother awards to retirement-eligible employees over the awards’stated vesting period. With the adoption of FAS No. 123(R), wecontinue to follow the stated vesting period for the unvested portionof awards granted prior to adoption of FAS No. 123(R) and followthe substantive vesting period for awards granted after the adoptionof FAS No. 123(R).
In accordance with FAS No. 123(R), we present the tax benefitsresulting from the exercise of share-based awards as financing cashflows. Prior to the adoption of FAS No. 123(R), we reported the taxbenefits resulting from the exercise of share-based awards as oper-ating cash flows. Tax benefits resulting from the exercise of share-based awards totaled $115 million, $194 million, and $87 million for2007, 2006, and 2005, respectively.
The aggregate amount of cash we received from the exercise ofstock options granted under share-based payment arrangementswas $89 million, $184 million, and $125 million for 2007, 2006, and2005, respectively.
We issue restricted stock units under the Comprehensive Planto certain officers and key employees and those units vest generallyover four years in annual installments commencing one year afterthe date of grant. We recognize compensation expense for therestricted stock units over the service period equal to the fair mar-ket value of the stock units on the date of issuance. Upon vesting,restricted stock units convert to shares and are distributed fromtreasury shares. At year-end 2007 and year-end 2006, we hadapproximately $145 million and $138 million, respectively, indeferred compensation costs related to restricted stock units.Share-based compensation expense associated with restrictedstock units was $82 million, $77 million, and $52 million for 2007,2006, and 2005, respectively. The weighted average remaining termfor restricted stock unit grants outstanding at year-end 2007 wastwo years. Restricted stock units converted and distributed during2007, 2006, and 2005, had aggregate intrinsic values of $147 mil-lion, $78 million, and $52 million, respectively. The weighted aver-age grant-date fair values of restricted stock units granted in 2007,2006, and 2005 were $49, $35, and $32, respectively.
Changes in our outstanding restricted stock unit grants in 2007were as follows:
Number of WeightedRestricted Average
Stock Units Grant-Date(in millions) Fair Value
Outstanding at year-end 2006 7.6 $30Granted during 2007 2.3 49Distributed during 2007 (3.0) 26Forfeited during 2007 (0.2) 37
Outstanding at year-end 2007 6.7 37
Employee stock options may be granted to officers and keyemployees at exercise prices or strike prices equal to the marketprice of our Class A Common Stock on the date of grant. Non-qualified options generally expire 10 years after the date of grant,except those issued from 1990 through 2000, which expire 15years after the date of the grant. Most stock options under theStock Option Program are exercisable in cumulative installments ofone quarter at the end of each of the first four years following thedate of grant.
We recognized compensation expense associated withemployee stock options of $12 million in 2007 and $22 million in2006. We did not recognize any compensation expense associatedwith employee stock options in 2005. At year-end 2007 and year-end 2006, there was approximately $6 million and $18 million,respectively, in deferred compensation costs related to employeestock options. Upon the exercise of stock options, we issue sharesfrom treasury shares.
Changes in our outstanding Stock Option Program awards in2007 were as follows:
Number of WeightedOptions Average
(in millions) Exercise Price
Outstanding at year-end 2006 43.9 $17Granted during 2007 — 49Exercised during 2007 (6.2) 14Forfeited during 2007 — 23
Outstanding at year-end 2007 37.7 17
Stock options issued under the Stock Option Program awardsoutstanding at year-end 2007, were as follows:
54 Marriott International, Inc. 2007
Outstanding ExercisableNumber of Weighted Average Weighted Number of Weighted Weighted Average
Range of Stock Options Remaining Life Average Stock Options Average Remaining LifeExercise Prices (in millions) (in years) Exercise Price (in millions) Exercise Price (in years)
$ 6 to $ 8 2.7 2 $ 7 2.7 $ 7 2$ 9 to $12 1.4 4 10 1.4 10 4$13 to $18 21.8 6 15 21.8 15 6$19 to $25 10.3 7 22 9.4 22 7$26 to $50 1.5 8 33 0.7 32 8
$ 6 to $50 37.7 6 17 36.0 17 6

Marriott International, Inc. 2007 55
The weighted average grant-date fair value of the 33,000options granted in 2007 was $19 and the options had a weightedaverage exercise price of $49. The weighted average grant-date fairvalue of the 24,000 options granted in 2006 was $13 and theoptions had a weighted average exercise price of $34. The totalintrinsic value of options outstanding at year-end 2007 and year-end 2006 was $1,279 million and $1,368 million, respectively, andthe total intrinsic value for stock options exercisable as of year-end2007 and year-end 2006 was $624 million and $1,233 million,respectively. The total intrinsic value of stock options exercised dur-ing 2007, 2006, and 2005 was approximately $206 million, $309million, and $173 million, respectively.
Employee share appreciation rights (“Employee SARs”) may begranted to officers and key employees at exercise prices or strikeprices equal to the market price of our Class A Common Stock onthe date of grant. Employee SARs expire 10 years after the date ofgrant and generally both vest and are exercisable in cumulativeinstallments of one quarter at the end of each of the first four yearsfollowing the date of grant. Non-employee share appreciation rights(“Non-employee SARs”) may be granted to directors at exerciseprices or strike prices equal to the market price of our Class ACommon Stock on the date of grant. Non-employee SARs expire10 years after the date of grant and vest upon grant; however, theyare generally not exercisable until one year after grant. We firstbegan issuing share appreciation rights in 2006. On exercise ofSARs, employees or Non-employee directors receive the number of shares of Class A Common Stock equal to the number of shareappreciation rights that are being exercised multiplied by the quo-tient of (a) the final value minus the base value, divided by (b) thefinal value.
We recognized compensation expense associated with EmployeeSARs and Non-employee SARs of $5 million in 2007 and $3 million in2006. At the end of 2007 and 2006, we had approximately $7 millionand $4 million, respectively, in deferred compensation costs related to share appreciation rights. Upon the exercise of share appreciationrights, shares are issued from treasury shares. During 2007 and2006, we granted 0.4 million and 0.5 million, respectively, EmployeeSARs with a weighted average base value of $49 and $34, respec-tively, and a weighted average grant-date fair value of $19 and $13,respectively. During 2007 and 2006, we also granted 4,000 and8,000, respectively, Non-employee SARs with a weighted averagebase value of $46 and $37, respectively, and a weighted averagegrant-date fair value of $20 and $18, respectively. No SARs haveexpired or been forfeited in 2007. The total intrinsic value of SARsoutstanding at year-end 2007 and year-end 2006 was zero and $7million, respectively, and the total intrinsic value of SARs exercisableas of year-end 2007 and year-end 2006 were each zero. The totalintrinsic value of SARs exercised during 2007 was $100,000. NoSARs were exercised in 2006.
We use a binomial method to estimate the fair value of eachstock option or SAR granted. The assumptions for stock options forall years and employee SARs for 2007 and 2006 are noted in thefollowing table:
2007 2006 2005
Annual dividends $0.29 $0.22 $0.18Expected volatility 28% 30% 30%Risk-free interest rate 4.8% 4.5% 4.1%Expected life (in years) 7 7 8
For Non-employee SARs issued in 2007 and 2006, the only dif-ferences in the assumptions versus employee SARs were the use ofrisk-free interest rates of 4.6 percent and 5.0 percent, respectively,and for each year’s issuances, an expected life of 10 years.
Estimated volatilities for 2007 and 2006 were based on the his-torical share-price volatility for a period equal to the stock option’sor share appreciation right’s expected lives, ending on the day ofgrant, and calculated based on weekly data. The weighted averageexpected stock option or share appreciation right terms for 2007and 2006 were a product of the lattice-based binomial valuationmodel that uses suboptimal exercise factors to calculate theexpected terms.
We also issue deferred stock units to Non-employee directors.These Non-employee director deferred stock units vest within oneyear and are distributed upon election. At year-end 2007 and year-end 2006, there was approximately $227,000 and $152,000, respec-tively, in deferred costs related to Non-employee director deferredstock units. We recognized share-based expense associated withNon-employee director deferred stock units of $666,000, $492,000,and $416,000 for 2007, 2006, and 2005, respectively. During 2007we granted 20,000 Non-employee director deferred stock units witha weighted average grant-date fair value of $46. For 2006 and 2005,we granted 18,000 and 21,000 Non-employee director deferredstock units with weighted average grant-date fair values of $37 and$32, respectively. The aggregate intrinsic value of Non-employeedirector deferred stock units distributed during 2007, 2006, and2005, was $0.3 million, $1.7 million, and $0.2 million, respectively. Atyear-end 2007 and year-end 2006, there were 218,000 and 203,000,respectively, Non-employee deferred stock units outstanding, and theweighted average grant-date fair value of those outstanding deferredstock units was $24 and $21, respectively.
Although the Comprehensive Plan also provides for issuance ofdeferred stock bonus awards, deferred stock awards, and restrictedstock awards, our Compensation Policy Committee indefinitely sus-pended the issuance of deferred bonus stock commencing with our2001 fiscal year and the issuance of both deferred stock awardsand restricted stock awards commencing with the 2003 fiscal year.At year-end 2007 and year-end 2006, there was approximately $4million and $8 million, respectively, in deferred compensation costsrelated to these suspended award programs, and the weightedaverage remaining term was two years for such award grants out-standing at year-end 2007. Share-based compensation expenseassociated with these suspended award programs was $4 million,$6 million, and $10 million for 2007, 2006, and 2005, respectively.
At year-end 2007, 63 million shares were reserved under theComprehensive Plan including 39 million shares under the StockOption Program and Share Appreciation Right Program.

5 EARNINGS PER SHARE
The table below illustrates the reconciliation of the earnings andnumber of shares used in the basic and diluted earnings per sharecalculations.
(in millions, except per share amounts) 2007 2006 2005
Computation of Basic Earnings Per Share
Income from continuing operations $ 697 $ 712 $ 543Weighted average shares outstanding 376.1 404.1 432.7
Basic earnings per share from continuing operations $1.85 $1.76 $1.26
Computation of Diluted Earnings Per Share
Income from continuing operations $ 697 $ 712 $ 543
Weighted average shares outstanding 376.1 404.1 432.7Effect of dilutive securities
Employee stock option and share appreciation rights plan 16.8 20.2 19.0
Deferred stock incentive plan 1.9 3.4 7.5Restricted stock units 2.5 2.5 3.1
Shares for diluted earnings per share 397.3 430.2 462.3
Diluted earnings per share from continuing operations $1.75 $1.65 $1.17
We compute the effect of dilutive securities using the treasurystock method and average market prices during the period. Wedetermine dilution based on earnings from continuing operations.
In accordance with FAS No. 128, “Earnings per Share,” we havenot included the following stock options and SARs in our calculationof diluted earnings per share because the exercise prices weregreater than the average market prices for the applicable periods:
(a) for the year ended December 28, 2007, 0.4 million optionsand SARs, with exercise prices ranging from $45.91 to $49.03;
(b) for the year ended December 29, 2006, no options, and
(c) for the year ended December 30, 2005, no options.
6 INVENTORY
Inventory, totaling $1,557 million and $1,186 million as of December28, 2007, and December 29, 2006, respectively, consists primarilyof Timeshare segment interval, fractional ownership, and residentialproducts totaling $1,536 million and $1,166 million as of December28, 2007, and December 29, 2006, respectively. Inventory totaling$21 million and $20 million as of December 28, 2007, andDecember 29, 2006, respectively, relates to hotel operating suppliesfor the limited number of properties we own or lease. We valueTimeshare segment interval, fractional ownership, and residentialproducts at the lower of cost or net realizable value and generallyvalue operating supplies at the lower of cost (using the first-in, first-out method) or market. Consistent with recognized industry prac-tice, we classify Timeshare segment interval, fractional ownership,and residential products inventory, which has an operating cyclethat exceeds 12 months, as a current asset.
7 PROPERTY AND EQUIPMENT
The following table details the composition of our property andequipment balances at year-end 2007 and year-end 2006.
($ in millions) 2007 2006
Land $ 399 $ 316Buildings and leasehold improvements 833 724Furniture and equipment 900 837Construction in progress 216 215
2,348 2,092Accumulated depreciation (1,019) (859)
$1,329 $1,233
We record property and equipment at cost, including interest,rent, and real estate taxes incurred during development and con-struction. Interest capitalized as a cost of property and equipmenttotaled $49 million in 2007, $32 million in 2006, and $30 million in2005. We capitalize the cost of improvements that extend the use-ful life of property and equipment when incurred. These capitalizedcosts may include structural costs, equipment, fixtures, floor, andwall coverings. We expense all repair and maintenance costs asincurred. We compute depreciation using the straight-line methodover the estimated useful lives of the assets (three to 40 years), andwe amortize leasehold improvements over the shorter of the assetlife or lease term. Depreciation expense totaled $162 million in2007, $155 million in 2006, and $156 million in 2005.
8 ACQUISITIONS AND DISPOSITIONS
2007 AcquisitionsDuring 2007, we acquired one full-service property, one limited-service property, and one extended-stay property for cash consid-eration of $199 million. These three properties were acquired inconjunction with a land assemblage for a large hotel complex that is still in the formative development stage. In addition, we acquiredcertain land parcels in 2007 for cash consideration of $52 million.Also during 2007, we acquired the fee simple interest in theimprovements of three properties and the leasehold interest in theground underlying the three properties for cash consideration of$58 million. The purchase included one full-service property andtwo limited-service properties, which were each sold later in thesame year.
During the first half of 2007, we were party to a venture thatdeveloped and marketed fractional ownership and residential inter-ests. In the second half of 2007, we purchased our partner’s inter-est in the joint venture for $6 million. In conjunction with thattransaction, we acquired assets and liabilities totaling $90 millionand $84 million, respectively, on the date of the purchase. Duringthe first half of 2007, we were party to another venture that wasestablished to develop and market timeshare and residential inter-ests. In the second half of 2007, we purchased our partner’s inter-est in that joint venture, and concurrent with this transaction, wepurchased additional land and assets from our partner as well.Aggregate cash and notes payable issued for these transactionstotaled $106 million, and we acquired assets and liabilities totaling$182 million and $76 million, respectively, on the date of purchase.
At year-end 2007, we were party to a venture that developed andmarketed fractional and whole ownership interests. Subsequent toyear-end 2007, we purchased our partner’s interest in that joint ven-ture and concurrent with this transaction, we purchased additional
56 Marriott International, Inc. 2007

land from our partner as well. Cash consideration for this transactiontotaled $37 million and we acquired assets and liabilities totaling $74million and $37 million, respectively, on the date of purchase.
2007 DispositionsIn 2007, we sold nine properties for cash proceeds of $601 millionand recognized gains totaling $24 million. We continue to operateeight of the nine properties under long-term agreements. We soldtwo parcels of land for $55 million in cash proceeds that were underdevelopment and recognized a gain of $2 million. We also sold thefee simple interest in the improvements of three properties and theleasehold interest in the ground underlying the three properties, ini-tially acquired in early 2007, for book value and received $58 millionin cash proceeds. We continue to manage the properties underlong-term agreements. Each of the aforementioned sales wasaccounted for under the full accrual method in accordance with FASNo. 66. During the year, we also sold our interests in five joint ven-tures for cash proceeds of $30 million and recognized gains totaling$13 million. We had other asset sales during the year, which gener-ated proceeds totaling $1 million. Cash flows totaling $745 million for all the preceding dispositions in 2007 are reflected in the“Dispositions” line in our Consolidated Statements of Cash Flows.
In 2007, we also sold land that was under development. Due toa contingency in the sales contract, this sale was accounted forunder the deposit method of FAS No. 66. Accordingly, the cashproceeds, totaling $90 million, were reflected in “Other investingactivities” in our Consolidated Statements of Cash Flows.
2006 AcquisitionsDuring 2006, we acquired one full-service property for $130 millionincluding aggregate cash consideration of $46 million plus theassumption of debt. In addition we acquired three other full-serviceproperties for aggregate cash consideration of $134 million. Wesold each of the four properties to third-party owners during the2007 fiscal year.
2006 DispositionsIn 2006 we sold our interest in the 50/50 joint venture withWhitbread PLC (“Whitbread”), which held 46 hotels consisting ofmore than 8,000 rooms and we received approximately $164 millionin cash, net of transaction costs, which was approximately equal tothe investment’s book value. We continue to manage the hotelsunder the Marriott Hotels & Resorts and Renaissance Hotels &Resorts brands. We also sold our minority interest in five other jointventures during 2006 for cash proceeds of $64 million and recog-nized gains of $43 million. Additionally, one cost method investeeredeemed the preferred stock we held for $81 million in cash consid-eration and we recognized income of $25 million on the redemption.
During 2006 we also sold 10 full-service properties for cash pro-ceeds of $487 million and recognized gains totaling $14 million. Weaccounted for each of the sales under the full accrual method inaccordance with FAS No. 66 and will continue to operate eight ofthe properties under long-term management agreements. The soldproperties included eight properties purchased in 2005 from CTFHoldings Ltd. and certain of its affiliates (collectively “CTF”). Foradditional information regarding the CTF transaction, see the “2005Acquisitions” caption later in this footnote. Prior to the sale of oneproperty, balances associated with that property were reclassified inconformity with other “held and used” properties, in the first half of2006 as the property was not expected to be sold, within one yearof its classification as “held for sale.” In conjunction with that reclas-sification, we recorded depreciation expense of $2 million in the firsthalf of 2006 that would have been recognized had the asset beencontinuously classified as “held and used.” Cash proceeds of $26
million for one hotel sold in 2006 are not reflected in the dispositionproceeds of $487 million as the proceeds were initially recorded as a deposit because of a contingency and impacted the “Otherinvesting activities” section of our Consolidated Statements of CashFlows rather than “Dispositions.” The contingency was subse-quently resolved and sale accounting was achieved in 2006. Otherasset sales generated cash proceeds of $2 million.
Late in 2006, we sold a 75 percent interest in a joint venture to athird party for its book value of $14 million. At the time of the sale, thejoint venture’s only asset was a parcel of land. In conjunction with thesale, we made a $25 million bridge loan to the joint venture, whichmatured in early 2007. Following the guidance found in EITF 98-8,“Accounting for Transfers of Investments That Are in Substance RealEstate,” and FAS No. 66 due to our continuing involvement with thejoint venture, we consolidated the joint venture for the period of timethat the bridge loan was outstanding. Subsequent to the bridge loan’srepayment, we account for our remaining interest in the joint ventureunder the equity method as required by APB Opinion No. 18, “TheEquity Method of Accounting for Investments in Common Stock.”
In 1988, the Company as landlord, entered into a 59-yearground lease with a lessee for land that was improved with a hotelthat is owned by the lessee. The hotel was previously branded aMarriott property. The lease contained contractual rental increasesover the term of the lease and annual ground rent on the landtotaled approximately $5 million in 2006. The lease also contained aprovision that permitted the lessee, under certain circumstances, topurchase the land for a fixed price. We and the lessee had variousdiscussions in 2006 concerning the land as well as the hotel. Duringthe 2006 second quarter, it became probable that none of the pro-posed transactions were acceptable to both parties and the lesseeindicated its intent to exercise its option to purchase the land.Accordingly, in the 2006 second quarter, we reclassified the landfrom the “Property and equipment” caption in our ConsolidatedBalance Sheets to the “Assets held for sale” caption and recordeda $37 million non-cash charge to adjust the carrying amount to netrealizable value. We completed the sale of the land, at book value,to the lessee in 2007 and this transaction is reflected in the figuresnoted earlier for dispositions in 2007.
2005 AcquisitionsDuring the third quarter of 2005, we purchased from CTF and cer-tain of its affiliates 13 properties (in each case through a purchaseof real estate, a purchase of the entity that owned the hotel, or anassignment of CTF’s leasehold rights) and certain joint venture inter-ests from CTF for an aggregate price of $381 million. Prior to thesale, all of the properties were operated by us or our subsidiaries.
At the purchase date, we planned to sell eight of the properties tothird-party owners and the balances related to these full-service prop-erties were classified within the “Assets held for sale” and “Liabilitiesof assets held for sale” captions in our Consolidated Balance Sheetsat year-end 2005. All eight properties were sold in 2006. One operat-ing lease terminated in 2005. At the purchase date we operated fourremaining properties under leases, three of which expire by 2012.Under the purchase and sale agreement we signed with CTF in thesecond quarter of 2005, we were obligated to purchase two addi-tional properties for $17 million, the acquisition of which was post-poned pending receipt of certain third-party consents. We did notpurchase these additional two properties and the obligation expired.
On the closing date we and CTF also modified managementagreements on 29 other CTF-leased hotels, 28 located in Europeand one located in the United States. We became secondarily liable for annual rent payments for certain of these hotels when we acquired the Renaissance Hotel Group N.V. in 1997. At theclosing date, we continued to manage 16 of these hotels under
Marriott International, Inc. 2007 57

new long-term management agreements; however, due to certainprovisions in the management agreements, we account for thesecontracts as operating leases. CTF placed approximately $89 mil-lion in trust accounts to cover possible shortfalls in cash flow nec-essary to meet rent payments under these leases. In turn, wereleased CTF from its guarantees in connection with these leases.In 2007, the lease agreement associated with one of these proper-ties was terminated. In 2007, we also entered into a transactionwhereby the landlord allowed us to assume the lease agreement foranother of the properties for which we then became the primaryobligor. In conjunction with becoming the primary obligor, wereceived a $16 million distribution from the trust, and the balance of the funds was distributed to the landlord. We accounted for ourreceipt of trust funds as a lease incentive, the reduction of whichwill be recorded on a straight-line basis as an adjustment to leaseexpense over the term expiring in 2033. At year-end 2007, approxi-mately $38 million remained in these trust accounts for the 14 prop-erties we still manage and account for as leases. Minimum leasepayments relating to these leases are as follows: $30 million in eachof 2008, 2009, and 2010; $26 million in 2011; $17 million in 2012;and $33 million thereafter, for a total of $166 million.
For 13 European leased hotels, of the 29 properties mentioned inthe preceding paragraph, CTF may terminate management agree-ments with us if and when CTF obtains releases from landlords ofour back-up guarantees. Pending completion of the CTF-landlordagreements, we continue to manage these hotels under modifiedmanagement agreements and remain secondarily liable under certainof these leases. We are also secondarily obligated for real estatetaxes and other charges associated with the leases. Third partieshave severally indemnified us for all payments we may be required tomake in connection with these obligations. Since we assumed theseguarantees, we have not funded any amounts and we do not expectto fund any amounts under these guarantees in the future. CTF hadoriginally made available €35 million in cash collateral in the eventthat we were required to fund under such guarantees. At year-end2007, we still managed five of the original 13 properties.Approximately €7 million ($11 million) of cash collateral remainedavailable at year-end 2007. Our contingent liability exposure at year-end 2007 associated with the five remaining properties totaled $77million as also noted in Footnote No. 17, “Contingencies.” As CTFobtains releases from the landlords and these remaining hotels exitthe system, our contingent liability exposure will decline.
At the closing date, we continued to manage three other hotelsin the United Kingdom under amended management agreementswith CTF and continued to manage 14 other properties in Asia onbehalf of New World Development Company Limited and its affili-ates. CTF’s principals are officers, directors, and stockholders ofNew World Development Company Limited. At the closing date, theowners of the United Kingdom and Asian hotels agreed to invest$17 million to renovate those properties.
We and CTF also exchanged legal releases effective as of theclosing date and litigation and arbitration that was outstandingbetween the two companies and their affiliates was dismissed.
Simultaneously with the closing on the foregoing transactions,CTF also sold five properties and one minority joint venture interestto Sunstone Hotel Investors, Inc. (“Sunstone”) for $419 million, eightproperties to Walton Street Capital, L.L.C. (“Walton Street”) for $578million, and two properties to Tarsadia Hotels (“Tarsadia”) for $29million, in each case as substitute purchasers under our purchaseand sale agreement with CTF. Prior to consummation of the sales,we also operated all of these properties. At closing, Walton Streetand Sunstone entered into new long-term management agreementswith us and agreed to invest a combined $68 million to furtherupgrade the 13 properties they acquired. At the closing date, the
two properties purchased by Tarsadia were operated under short-term management and franchise agreements.
When we signed the purchase and sale agreement for the fore-going transactions in the 2005 second quarter, we recorded a $94million pretax charge primarily due to the non-cash write-off ofdeferred contract acquisition costs associated with the terminationof the existing management agreements for properties involved inthese transactions. As described above, we entered into new long-term management agreements with CTF, Walton Street, andSunstone at the closing of the transactions.
In 2005 we also purchased two full-service properties, one inParis, France and the other in Munich, Germany, for aggregate cashconsideration of $146 million. We planned to sell these two full-service properties to third-party owners and the balances related tothese properties were classified within the “Assets held for sale” and“Liabilities of assets held for sale” line items on our ConsolidatedBalance Sheets at year-end 2005. The property in Paris, France,was sold in 2006 and the property located in Munich, Germany,was sold in 2007. The balances associated with the Munich,Germany, property were reclassified, in conformity with other “heldand used” properties in the 2006 fourth quarter as the property wasnot sold at that time, as expected, within one year of its classifica-tion as “held for sale.” In conjunction with the 2006 reclassification,we recorded depreciation expense of $5 million in the 2006 fourthquarter that would have been recognized had the asset been con-tinuously classified as “held and used.”
2005 DispositionsLate in 2005, we contributed land underlying an additional nineCourtyard hotels, worth approximately $40 million, to CBM LandJoint Venture limited partnership (“CBM Land JV”), a joint venturethe majority of which was owned, at the time of the transaction, bya third party on behalf of an institutional investor, thereby obtaininga 23 percent equity stake in CBM Land JV. At the same time wecompleted the sale of a portfolio of land underlying 75 Courtyard byMarriott hotels for approximately $246 million in cash to CBM LandJV. In conjunction with this transaction, we recognized a gain of $17million in 2005, we deferred recognition of a $5 million gain due toour minority interest in the joint venture, and we also deferredrecognition of a $40 million gain due to contingencies in the trans-action documents. As those contingencies expire in subsequentyears, we will recognize additional gains. In each of 2007 and 2006,we recognized gains of $4 million, and at year-end 2007, the aggre-gate remaining deferred gains totaled $37 million.
We also sold a number of other land parcels in 2005 for $38million in cash, net of transaction costs and recognized gains total-ing $6 million, and we sold two minority interests in joint venturesfor $14 million in cash and recognized gains totaling $7 million.
9 GOODWILL AND INTANGIBLE ASSETS
The following table details the composition of our goodwill andother intangible assets at year-end 2007 and year-end 2006.
($ in millions) 2007 2006
Contract acquisition costs and other $ 899 $ 809Accumulated amortization (264) (234)
$ 635 $ 575
Goodwill $1,049 $1,049Accumulated amortization (128) (128)
$ 921 $ 921
58 Marriott International, Inc. 2007

We capitalize costs incurred to acquire management, franchise,and license agreements that are both direct and incremental. Weamortize these costs on a straight-line basis over the initial term ofthe agreements, ranging from 15 to 30 years. We evaluate the car-rying values of intangible assets for impairment under the provisionsof FAS No. 142, “Goodwill and Other Intangible Assets.” Amortiza-tion expense totaled $35 million in 2007, $33 million in 2006, and$28 million in 2005. Estimated aggregate amortization expense foreach of the next five fiscal years is as follows: $29 million for 2008;$26 million for 2009; $26 million for 2010; $25 million for 2011; and$25 million for 2012.
10 NOTES RECEIVABLE
The following table details the composition of our notes receivablebalances at year-end 2007 and year-end 2006.
($ in millions) 2007 2006
Loans to timeshare owners $476 $ 386Lodging senior loans 7 9Lodging mezzanine and other loans 206 268
689 663Less current portion (89) (103)
$600 $ 560
We classify notes receivable due within one year as currentassets in the caption “Accounts and notes receivable” in theaccompanying Consolidated Balance Sheets, including $68 millionand $70 million, as of year-end 2007 and year-end 2006, respec-tively, related to “Loans to timeshare owners.”
Our notes receivable are due as follows: 2008-$89 million;2009-$51 million; 2010-$134 million; 2011-$58 million; 2012-$57million; and $300 million thereafter. The 2007 notes receivable bal-ance is net of unamortized discounts totaling $25 million and the2006 notes receivable balance is net of unamortized discountstotaling $28 million. Gains from the sale of notes receivable totaledapproximately $82 million, $79 million, and $94 million during 2007,2006, and 2005, respectively.
Lodging Senior Loans and Lodging Mezzanine and Other LoansInterest income associated with “Lodging senior loans” and“Lodging mezzanine and other loans” is reflected in the accompa-nying Consolidated Statements of Income in the “Interest income”caption. We do not accrue interest on “Lodging senior loans” and“Lodging mezzanine and other loans” that are impaired. At year-end2007, our recorded investment in impaired “Lodging senior loans”and “Lodging mezzanine and other loans” was $112 million and wehad a $92 million allowance for credit losses, leaving $20 million ofour investment in impaired loans for which there was no relatedallowance for credit losses. At year-end 2006, our recorded invest-ment in impaired “Lodging senior loans” and “Lodging mezzanineand other loans” was $92 million and we had a $70 millionallowance for credit losses, leaving $22 million of our investment inimpaired loans for which there was no related allowance for credit
losses. During 2007 and 2006, our average investment in impairedloans totaled $102 million and $138 million, respectively.
The following table summarizes the activity related to our“Lodging senior loans” and “Lodging mezzanine and other loans”notes receivable reserve for 2005, 2006, and 2007:
($ in millions) Notes Receivable Reserve
Year-end 2004 balance $ 92Additions 11Reversals —Write-offs (9)Transfers and other 9
Year-end 2005 balance 103Additions —Reversals (5)Write-offs (38)Transfers and other 10
Year-end 2006 balance 70Additions 11Reversals —Write-offs —Transfers and other 11
Year-end 2007 balance $ 92
Loans to Timeshare OwnersAt year-end 2007, the weighted average interest rate for our “Loansto timeshare owners” was 12.7 percent and the stated interestrates associated with these loans ranged from zero to 19.9 percent.We reflect interest income associated with “Loans to timeshareowners” of $50 million, $41 million, and $38 million for 2007, 2006,and 2005, respectively, in the accompanying ConsolidatedStatements of Income in the “Timeshare sales and services” rev-enue caption. We do not accrue interest on “Loans to timeshareowners” that are over 90 days past due. Our recorded investmentin “Loans to timeshare owners” on nonaccrual status at year-end2007 and year-end 2006 totaled $59 million and $67 million,respectively. We established the reserve for “Loans to timeshareowners” notes receivable in 2006 in conjunction with the adoptionof SOP 04-2.
The following table summarizes the activity related to our “Loansto timeshare owners” notes receivable reserve for 2006 and 2007.
($ in millions) Notes Receivable Reserve
Year-end 2005 balance $ —Establishment of reserve 25Additions for current year sales 20Write-offs (16)
Year-end 2006 balance 29Additions for current year sales 29Write-offs (24)Other (15)
Year-end 2007 balance $ 19
Marriott International, Inc. 2007 59

60 Marriott International, Inc. 2007
11 ASSET SECURITIZATIONS
We periodically sell, without recourse, through special purpose enti-ties, notes receivable originated by our Timeshare segment in con-nection with the sale of timeshare interval and fractional products.We continue to service the notes and transfer all proceeds collectedto special purpose entities. We retain servicing assets and otherinterests in the notes and account for these assets and interests asresidual interests. The interests are limited to the present value ofcash available after paying financing expenses and program feesand absorbing credit losses. Prior to the start of the 2007 fiscalyear, we measured servicing assets at the date of sale at their allo-cated previous carrying amount based on relative fair value, classi-fied those assets as held to maturity under the provisions of FASNo. 115 and recorded those assets at amortized cost.
On December 30, 2006, the first day of fiscal year 2007, weadopted FAS No. 156. In conjunction with the adoption of FAS No.156, we elected to subsequently measure our servicing assetsusing the fair value method. Under the fair value method, we carryservicing assets on the balance sheet at fair value, and report thechanges in fair value, primarily due to changes in valuation inputsand assumptions and to the collection or realization of expectedcash flows, in earnings in the period in which the change occurs.
To determine the fair value of servicing assets, we use a valuationmodel that calculates the present value of estimated future net servic-ing income, which is based on the monthly fee we receive for servicingthe securitized notes. We use market assumptions in the valuationmodel, including estimates of prepayment speeds, default rates, anddiscount rates. We have inherent risk for changes in the fair value ofthe servicing asset but do not deem the risk significant and therefore,do not use other financial instruments to mitigate this risk.
Effective December 30, 2006, upon the remeasurement of ourservicing assets at fair value, we recorded a cumulative-effect adjust-ment to the 2007 beginning balance of retained earnings of $1 mil-lion after-tax ($2 million pretax) in our Consolidated Statements ofShareholders’ Equity. Accordingly, servicing assets totaled $11 mil-lion at year-end 2006 and $13 million on the first day of fiscal year2007. At year-end 2007, servicing assets totaled $15 million.
The table below reconciles the servicing assets balance at year-end 2006, to the beginning balance on December 30, 2006.
($ in millions) Servicing Assets
Balance at year-end 2006 (December 29, 2006) $11Remeasurement upon adoption of FAS No. 156 2
Beginning balance at December 30, 2006 $13
The changes in servicing assets, measured using the fair valuemethod, were:
($ in millions) Servicing Assets
Fair value, beginning of period (December 30, 2006) $13
Servicing from securitizations 6Changes in fair value (1) (4)
Fair value, end of period (December 28, 2007) $15
(1) Principally represents changes due to collection/realization of expected cash flowsover time and changes in fair value due to changes in key variables listed below.
Contractually specified servicing fees, late fees, and ancillaryfees earned for 2007, 2006, and 2005 totaled $6 million, $5 million,
and $4 million, respectively, and were reflected within the changesin fair value to the servicing assets noted above.
We have included gains from the sales of timeshare notesreceivable totaling $81 million in 2007 and $77 million in 2006 within the “Timeshare sales and services” revenue caption in ourConsolidated Statements of Income. Gains from the sale of time-share notes receivable of $69 million in 2005 are in the “Gains and other income” caption in the accompanying ConsolidatedStatements of Income. For additional information regarding the clas-sification of gains from the sale of timeshare notes receivable, seethe “Basis of Presentation” caption in Footnote No. 1, “Summary ofSignificant Accounting Policies.” In addition, in September 2006, werepurchased notes receivable with a principal balance of $31 millionand in November 2006, sold those notes, along with $249 million ofadditional notes in a $280 million note securitization. The gain onthe sale of these notes is included in the $77 million gain noted ear-lier in this paragraph.
We had residual interests of $238 million and $221 million,respectively, at year-end 2007 and year-end 2006, which arerecorded in the accompanying Consolidated Balance Sheets as otherlong-term receivables of $157 million and $137 million, respectively,and other current assets of $81 million and $84 million, respectively.
At the dates of sale and at the end of each reporting period, we estimate the fair value of residual interests, including servicingassets, using a discounted cash flow model. These transactionsmay utilize interest rate swaps to protect the net interest marginassociated with the beneficial interest. We report in income,changes in the fair value of residual interests, including servicingassets, as they are considered trading securities under the provi-sions of FAS No. 115. During 2007, 2006, and 2005, we recordedtrading gains of $30 million, $19 million, and $2 million, respectively.We used the following key assumptions to measure the fair value ofthe residual interests, including servicing assets, at the date of saleduring 2007, 2006, and 2005: average discount rate of 9.02 per-cent, 9.22 percent, and 8.56 percent, respectively; averageexpected annual prepayments, including defaults, of 25.02 percent,25.22 percent, and 23.56 percent, respectively; expected weightedaverage life of prepayable notes receivable, excluding prepaymentsand defaults, of 75 months, 70 months, and 79 months, respec-tively; and expected weighted average life of prepayable notesreceivable, including prepayments and defaults of 34 months, 32months, and 38 months, respectively. Our key assumptions arebased on experience.
We used the following key assumptions in measuring the fairvalue of the residual interests, including servicing assets, in our 11outstanding note sales at year-end 2007: an average discount rateof 7.96 percent; an average expected annual prepayment rate,including defaults, of 19.58 percent; an expected weighted averagelife of prepayable notes receivable, excluding prepayments anddefaults, of 62 months; and an expected weighted average life ofprepayable notes receivable, including prepayments and defaults of35 months.
Cash flows between us and third-party purchasers during 2007,2006, and 2005, were as follows: net proceeds to us from newtimeshare note sales of $515 million, $508 million, and $399 million,respectively; repurchases by us of defaulted loans (over 150 daysoverdue) of $30 million, $24 million, and $23 million, respectively;repurchases by us of other loans in 2006 of $31 million; servicingfees received by us of $6 million, $5 million, and $4 million, respec-tively; and cash flows received from our retained interests of $100million, $91 million, and $86 million, respectively.
At year-end 2007, $1,263 million of principal remained outstand-ing in all sales in which we had a retained residual interest. Delin-quencies of more than 90 days at year-end 2007 amounted to

$10 million. Existing reserves were adequate for defaulted loans thatwere resolved during 2007. We have been able to resell timeshareunits underlying defaulted loans without incurring material losses.
We completed a stress test on the fair value of the residual inter-ests as of year-end 2007 with the objective of measuring thechange in value associated with independent changes in individualkey variables. The methodology used applied unfavorable changesthat would be considered statistically significant for the key variablesof prepayment rate, discount rate, and weighted average remainingterm. The fair value of the residual interests was $238 million atyear-end 2007, before we applied any stress test changes. Anincrease of 100 basis points in the prepayment rate would decreasethe year-end valuation by $4 million, or 1.9 percent, and an increaseof 200 basis points in the prepayment rate would decrease theyear-end valuation by $9 million, or 3.7 percent. An increase of 100basis points in the discount rate would decrease the year-end valu-ation by $5 million, or 2.3 percent, and an increase of 200 basispoints in the discount rate would decrease the year-end valuationby $11 million, or 4.4 percent. A decline of two months in theweighted average remaining term would decrease the year-end val-uation by $3 million, or 1.1 percent, and a decline of four months inthe weighted average remaining term would decrease the year-endvaluation by $5 million, or 2.3 percent.
12 LONG-TERM DEBT
Our long-term debt at year-end 2007 and year-end 2006 consistedof the following:
($ in millions) 2007 2006
Senior Notes:Series C, interest rate of 7.875%, face amount
of $76, maturing September 15, 2009 (effective interest rate of 8.018%) $ 76 $ 76
Series E, interest rate of 7.000%, face amount of $91, maturing January 15, 2008 (effective interest rate of 7.194%) 91 91
Series F, interest rate of 4.625%, face amount of $350, maturing June 15, 2012 (effective interest rate of 4.796%) 349 349
Series G, interest rate of 5.810%, face amount of $427, maturing November 10, 2015 (effective interest rate of 6.571%) 402 399
Series H, interest rate of 6.200%, face amount of $350, maturing June 15, 2016 (effective interest rate of 6.294%) 349 349
Series I, interest rate of 6.375%, face amount of $350, maturing June 15, 2017 (effective interest rate of 6.439%) 346 —
Series J, interest rate of 5.625%, face amount of $400, maturing February 15, 2013 (effective interest rate of 5.661%) 397 —
Commercial paper, average interest rate of 5.4% at year-end 2007 585 315
Mortgage debt, average interest rate of 7.2% at year-end 2007, maturing through May 1, 2025 196 167
Other 174 87
2,965 1,833Less current portion (175) (15)
$2,790 $1,818
As of year-end 2007, all debt, other than mortgage debt and $1 million of other debt, is unsecured.
During 2007, we amended and restated our multicurrencyrevolving credit agreement, originally entered into in 2005, toincrease the aggregate borrowings and letters of credit availableunder the facility from $2 billion to $2.5 billion and to extend theexpiration of the facility from 2011 to 2012. The availability of revolv-ing credit borrowings supports our commercial paper program.Borrowings under the facility bear interest at the London InterbankOffered Rate (LIBOR) plus a spread, based on our public debt rat-ing. Additionally, we pay quarterly fees on the facility at a rate alsobased on our public debt rating.
In 2005 we began issuing short-term commercial paper inEurope in addition to our long-standing commercial paper programin the United States. Our United States and European commercialpaper issuances are subject to the availability of the commercialpaper market, as we have no commitment from buyers to purchaseour commercial paper. We reserve unused capacity under our creditfacility to repay outstanding commercial paper borrowings in theevent that the commercial paper market is not available to us forany reason when outstanding borrowings mature. We classify com-mercial paper as long-term debt based on our ability and intent torefinance it on a long-term basis.
During 2007, we issued $350 million of aggregate principalamount of 6.375 percent Series I Senior Notes due 2017. The offer-ing of the Notes closed on June 25, 2007. We received net pro-ceeds before expenses of approximately $346 million from thisoffering, after deducting the underwriting discount and estimatedexpenses of the offering. We used these proceeds for generalcorporate purposes, including the repayment of commercial paper borrowings. Interest on these notes is paid on June 15 andDecember 15 of each year, and commenced on December 15,2007. The notes will mature on June 15, 2017, and are redeem-able, in whole or in part, at any time and from time to time underthe terms provided in the form of note.
Also in 2007, we issued $400 million of aggregate principalamount of 5.625 percent Series J Senior Notes due 2013. Theoffering of the notes closed on October 19, 2007. We received netproceeds before expenses of approximately $396 million from thisoffering, after deducting the underwriting discount and estimatedexpenses of the offering. We used these proceeds for general cor-porate purposes, including working capital, capital expenditures,acquisitions, stock repurchases, and the repayment of commercialpaper borrowings. Interest on these notes is paid on February 15and August 15 of each year, and commenced on February 15,2008. The notes will mature on February 15, 2013, and areredeemable, in whole or in part, at any time and from time to timeunder the terms provided in the form of note.
Both the Series I Senior Notes and the Series J Senior Noteswere issued under an indenture with The Bank of New York, succes-sor to JPMorgan Chase Bank, N.A. (formerly known as The ChaseManhattan Bank), as trustee, dated as of November 16, 1998.
We are in compliance with covenants in our loan agreements,which require the maintenance of certain financial ratios and mini-mum shareholders’ equity and also include, among other things,limitations on additional indebtedness and the pledging of assets.
Aggregate debt maturities are: 2008-$175 million; 2009-$118million; 2010-$51 million; 2011-$19 million; 2012-$360 million; and$2,242 million thereafter.
Cash paid for interest, net of amounts capitalized, was $115 mil-lion in 2007, $73 million in 2006, and $87 million in 2005.
Subsequent to year-end 2007, on January 15, 2008, we made a$94 million cash payment of principal and interest to retire, at matu-rity, all of our outstanding Series E Senior Notes.
Marriott International, Inc. 2007 61

13 SELF-INSURANCE RESERVE FOR LOSSES ANDLOSS ADJUSTMENT EXPENSES
The activity in the reserve for losses and loss adjustment expensesis summarized as follows:
($ in millions) 2007 2006
Balance at beginning of year $271 $264Less: reinsurance recoverable (16) (24)
Net balance at beginning of year 255 240
Incurred related to:Current Year 120 122Prior year (34) (20)
Total incurred 86 102
Paid related to:Current Year (31) (37)Prior year (50) (50)
Total paid (81) (87)
Net balance at end of year 260 255Add: reinsurance recoverable 14 16
Balance at end of year $274 $271
The provision for unpaid loss and loss adjustment expensesdecreased by $34 million and $20 million in 2007 and 2006,respectively, as a result of changes in estimates from insured eventsof the prior years due to changes in underwriting experience andfrequency and severity trends. The year-end 2007 self-insurancereserve of $274 million is comprised of a current portion of $92 mil-lion and long-term portion of $182 million. The year-end 2006 self-insurance reserve of $271 million is comprised of a current portionof $87 million and a long-term portion of $184 million.
14 SHAREHOLDERS’ EQUITY
Eight hundred million shares of our Class A Common Stock, with apar value of $.01 per share, are authorized, and 10 million shares ofpreferred stock, without par value, are authorized. As of the 2007fiscal year-end, there were 357.1 million shares of our Class ACommon Stock outstanding and no shares of our preferred stockwere outstanding.
On March 27, 1998, our Board of Directors adopted a share-holder rights plan under which one preferred stock purchase rightwas distributed for each share of our Class A Common Stock. Each right entitles the holder to buy 1/1000th of a share of a newlyissued series of junior participating preferred stock of the Companyat an exercise price of $175. The rights may not presently be exer-cised, but will be exercisable 10 days after a person or groupacquires beneficial ownership of 20 percent or more of our Class ACommon Stock or begins a tender or exchange for 30 percent ormore of our Class A Common Stock. Shares owned by a person or group on March 27, 1998, and held continuously thereafter, areexempt for purposes of determining beneficial ownership under therights plan. The rights are nonvoting and will expire on March 27,2008, unless previously exercised or redeemed by us for $.01 each.If we are involved in a merger or certain other business combina-tions not approved by the Board of Directors prior to the expirationof the rights, each right entitles its holder, other than the acquiringperson or group, to purchase common stock of either the Company
or the acquirer having a value of twice the exercise price of theright. The Company does not plan to extend the shareholder rightsplan or the rights beyond their March 27, 2008 expiration.
Accumulated other comprehensive income of $51 million atyear-end 2007 primarily consisted of gains totaling $9 million asso-ciated with available-for-sale securities and gains totaling $46 millionassociated with foreign currency translation adjustments, partiallyoffset by net losses of $5 million associated with interest rate swapagreement cash flow hedges. Accumulated other comprehensiveincome of $44 million at year-end 2006 primarily consisted of gainstotaling $35 million associated with available-for-sale securities andgains totaling $12 million associated with foreign currency transla-tion adjustments.
15 FAIR VALUE OF FINANCIAL INSTRUMENTS
We believe that the fair values of current assets and current liabili-ties approximate their reported carrying amounts. The fair values ofnon-current financial assets, liabilities, and derivatives are shown inthe following table.
At Year-end 2007 At Year-end 2006Carrying Fair Carrying Fair
($ in millions) Amount Value Amount Value
Notes and other long-term assets $ 996 $ 1,002 $ 993 $ 996
Long-term debt and other long-term liabilities $(2,967) $(3,050) $(1,816) $(1,847)
Derivative instruments $ (7) $ (7) $ 6 $ 6
We value notes and other receivables based on the expectedfuture cash flows discounted at risk-adjusted rates. We determinevaluations for long-term debt and other long-term liabilities basedon quoted market prices or expected future payments discountedat risk-adjusted rates.
16 DERIVATIVE INSTRUMENTS
During 2007, we entered into interest rate swap agreements tomanage the volatility of the U.S. Treasury component of the interestrate risk associated with the forecasted issuance of our Series I andSeries J Senior Notes. During 2006, we entered into an interest rateswap agreement to manage the volatility of the U.S. Treasury com-ponent of the interest rate risk associated with the forecastedissuance of our Series H Notes. During 2005, we entered into twosimilar instruments in conjunction with the forecasted issuance ofour Series F Notes and the exchange of our Series C and Series ESenior Notes for new Series G Notes. All five swaps were desig-nated as cash flow hedges under FAS No. 133, “Accounting forDerivative Instruments and Hedging Activities” (“FAS No. 133”) andwere terminated upon pricing of the notes. All five swaps werehighly effective in offsetting fluctuations in the U.S. Treasury com-ponent. Thus, there was no net gain or loss reported in earningsduring 2007, 2006, or 2005. The net losses for these swaps were$4 million in 2007 associated with the Series I and Series J SeniorNotes, zero in 2006 associated with the Series H Senior Notes, and$2 million in 2005 associated with the Series F and Series G SeniorNotes were recorded in other comprehensive income and are beingamortized to interest expense using the interest method over the lifeof the notes.
62 Marriott International, Inc. 2007

At year-end 2007, we had four outstanding interest rate swapagreements to manage interest rate risk associated with the resid-ual interests we retain in conjunction with our timeshare note sales.Historically, we were required by purchasers and/or rating agenciesto utilize interest rate swaps to protect the excess spread within oursold note pools. The aggregate notional amount of the swaps is$157 million, and they expire through 2022. These swaps are notaccounted for as hedges under FAS No. 133. The fair value of theswaps was a net asset of $2 million at year-end 2007 and $5 mil-lion at year-end 2006. For the outstanding interest rate swaps, werecorded a $3 million net loss during 2007, a $1 million net lossduring 2006 and a $2 million net gain during 2005.
During 2007, 2006, and 2005, we entered into interest rateswaps to manage interest rate risk associated with forecasted time-share note sales. During 2007, five swaps were designated as cashflow hedges under FAS No. 133 and were highly effective in offset-ting interest rate fluctuations. The amount of the ineffectiveness wasimmaterial. In 2007, we terminated two of those five swaps andrecognized no gain or loss from the sales of Timeshare segmentnotes receivable. The aggregate notional amount of the remainingthree swaps is $238 million at year-end 2007, and they expirethrough 2012. The fair value of the remaining three swaps was anet liability of $7 million at year-end 2007. For the outstanding inter-est rate swaps, we recorded in 2007 a $7 million net loss in othercomprehensive income. During 2006, two swaps (the “2006swaps”) were designated as cash flow hedges under FAS No. 133and were highly effective in offsetting interest rate fluctuations. In2006, we terminated the 2006 swaps and recognized a net gain of$1 million in the gains from the sales of Timeshare segment notesreceivable. During 2005, one swap was designated as a cash flowhedge under FAS No. 133 and was highly effective in offsettinginterest rate fluctuations. The amount of the ineffectiveness wasimmaterial and upon termination we recognized a net gain of $2million in gains from the sales of Timeshare segment notes receiv-able. The second swap entered into in 2005 did not qualify forhedge accounting. The non-qualifying swap resulted in a loss of $3 million during 2005, which was also recognized in gains from the sales of Timeshare segment notes receivable.
During 2007, 2006, and 2005, we entered into forward foreignexchange contracts to manage the foreign currency exposurerelated to certain monetary assets. The aggregate dollar equivalentof the notional amount of the contracts was $133 million at year-end 2007. The forward exchange contracts do not qualify ashedges in accordance with FAS No. 133. The fair value of the for-ward contracts was an asset of $2 million at year-end 2007 andzero at year-end 2006. We recorded a $10 million loss during 2007,a $34 million loss during 2006, and a $26 million gain in 2005, relat-ing to these forward foreign exchange contracts. The net gains andlosses for all years were recorded as general, administrative, andother expense and were offset by income and losses recorded fromtranslating the related monetary assets denominated in foreign cur-rencies into U.S. dollars.
During 2007, 2006, and 2005, we entered into foreign exchangeoption contracts to hedge the potential volatility of earnings andcash flows associated with variations in foreign exchange rates. Theaggregate dollar equivalent of the notional amounts of the contractswas $86 million at year-end 2007. These contracts have terms ofless than one year and are classified as cash flow hedges. Changesin their fair values are recorded as a component of other compre-hensive income. The fair value of the option contracts was approxi-mately $1 million at year-end 2007 and zero at year-end 2006. Werecorded an immaterial amount in general, administrative, and otherexpense due to changes in the time value of these contracts, which
is excluded from the assessment of our hedge effectiveness. Thehedges were highly effective and there was no net gain or lossreported in earnings for 2007, 2006, and 2005. As of year-end2007, the deferred gains or losses on existing contracts accumu-lated in other comprehensive income that we expect to reclassifyinto earnings over the next year were zero.
During 2007, we entered into foreign exchange forward contractsto hedge forecasted transactions for contracts denominated in for-eign currencies. The aggregate dollar equivalent of the notionalamounts of the contracts was $58 million at year-end 2007. Thesecontracts have terms of less than three years and are classified ascash flow hedges. Changes in their fair value are recorded as acomponent of other comprehensive income. The fair value of the for-ward contracts was zero at year-end 2007. We recorded an immate-rial amount in general, administrative, and other expense due tochanges in the time value of these contracts, which is excluded fromthe assessment of our hedge effectiveness. The hedges were highlyeffective and there was no gain or loss reported in 2007. As of year-end 2007, the deferred gains or losses on existing contracts accu-mulated in other comprehensive income that we expect to reclassifyinto earnings over the next three years were $1 million.
During 2007, 2006, and 2005, we entered into forward foreignexchange contracts to manage currency exchange rate volatilityassociated with certain investments in foreign operations. The con-tracts offset the gains and losses associated with translation adjust-ments for various investments in foreign operations. One contractwas designated as a hedge in the net investment of a foreign oper-ation under FAS No. 133 at year-end 2006. The hedge was highlyeffective and resulted in a $1 million net loss for 2007, no net gainor loss for 2006, and a $1 million net loss for 2005 in the foreigncurrency translation adjustment section of other comprehensiveincome. Certain contracts did not qualify as hedges under FAS No.133 and resulted in no gain or loss for 2007, a loss of $17 millionfor 2006, and a gain of $3 million for 2005, impacting our general,administrative, and other expenses. No contracts remained at year-end 2007. One contract remained at year-end 2006, which had anaggregate dollar equivalent of the notional amount of $43 millionand a fair value of zero. Contracts remaining at year-end 2005 hadan aggregate dollar equivalent of the notional amount of $229 mil-lion and a fair value of approximately zero.
During 2007 and 2006, in response to high oil prices and uncer-tainty surrounding the potential phase out of tax credits, we enteredinto oil price hedges in conjunction with our synthetic fuel operation.These hedges do not qualify as cash flow hedges under FAS No. 133.Therefore, changes in the fair values of these instruments are marked-to-market through interest income at each reporting period. Corres-pondingly, we recorded a net loss of $8 million during 2007 and a netloss of $2 million during 2006. At year-end 2007, hedges with a totalfair value of $4 million remained outstanding. At year-end 2006,hedges with a total fair value of $5 million remained outstanding.
During 2003, we entered into an interest rate swap agreementunder which we receive a floating rate of interest and pay a fixed rateof interest. The swap modifies our interest rate exposure by effec-tively converting a note receivable with a fixed rate to a floating rate.The aggregate notional amount of the swap is $92 million and itmatures in 2010. The swap is classified as a fair value hedge underFAS No. 133 and the change in the fair value of the swap, as well asthe change in the fair value of the underlying note receivable, is rec-ognized in interest income. The fair value of the swap was a $2 mil-lion liability at year-end 2007, and a $1 million asset at year-end2006 and 2005. The hedge is highly effective and, therefore, no netgain or loss was reported during 2007, 2006, and 2005.
Marriott International, Inc. 2007 63

17 CONTINGENCIES
GuaranteesWe issue guarantees to certain lenders and hotel owners primarilyto obtain long-term management contracts. The guarantees gener-ally have a stated maximum amount of funding and a term of threeto 10 years. The terms of guarantees to lenders generally require usto fund if cash flows from hotel operations are inadequate to coverannual debt service or to repay the loan at the end of the term. The terms of the guarantees to hotel owners generally require us tofund if the hotels do not attain specified levels of operating profit.Guarantee fundings to lenders and hotel owners are generallyrecoverable as loans repayable to us out of future hotel cash flowsand/or proceeds from the sale of hotels. We also enter into projectcompletion guarantees with certain lenders in conjunction withhotels and Timeshare segment properties that we or our joint ven-ture partners are building.
The maximum potential amount of future fundings for guaranteeswhere we are the primary obligor and the carrying amount of the lia-bility for expected future fundings at year-end 2007 are as follows:
Maximum Liability for Future Potential Amount Fundings at
Guarantee Type of Future Fundings Year-end 2007
($ in millions)
Debt service $ 35 $ 1Operating profit 204 31Other 76 7
Total guarantees where we are the primary obligor $315 $39
Our guarantees of $315 million listed in the preceding tableinclude $41 million of operating profit guarantees that will not be ineffect until the underlying properties open and we begin to operatethe properties.
The guarantees of $315 million in the preceding table do notinclude $245 million of guarantees that expire in the years 2011through 2013, related to Senior Living Services lease obligationsand lifecare bonds for which we are secondarily liable. SunriseSenior Living, Inc. (“Sunrise”) is the primary obligor of the leasesand a portion of the lifecare bonds, and CNL Retirement Properties,Inc. (“CNL”), which subsequently merged with Health Care PropertyInvestors, Inc., is the primary obligor of the remainder of the lifecarebonds. Prior to our sale of the Senior Living Services business in2003, these preexisting guarantees were guarantees by us of obli-gations of consolidated Senior Living Services subsidiaries. Sunriseand CNL have indemnified us for any guarantee fundings we maybe called on to make in connection with these lease obligations andlifecare bonds. We do not expect to fund under the guarantees.
The table also does not include lease obligations for which webecame secondarily liable when we acquired the Renaissance HotelGroup N.V. in 1997, consisting of annual rent payments of approxi-mately $7 million and total remaining rent payments through the ini-tial term of approximately $77 million. Most of these obligationsexpire at the end of the 2023 calendar year. CTF had originallymade available €35 million in cash collateral in the event that weare required to fund under such guarantees (approximately €7 mil-lion [$11 million] remained at year-end 2007). As CTF obtainsreleases from the landlords and these hotels exit the system, ourcontingent liability exposure of approximately $77 million willdecline. Since the time we assumed these guarantees, we have not
64 Marriott International, Inc. 2007
funded any amounts and we do not expect to fund any amountsunder these guarantees in the future.
Furthermore, in addition to the guarantees noted in the preced-ing table, we have provided a project completion guarantee to alender for a project with an estimated aggregate total cost of $586million. Payments for cost overruns for this project will be satisfiedby the joint venture via contributions from the partners, and we areliable on a several basis with our partners in an amount equal to ourpro rata ownership in the joint venture, which is 34 percent. We donot expect to fund under the guarantee. We have also provided aproject completion guarantee to another lender for a project with anestimated aggregate total cost of $80 million. Payments for costoverruns for this project will be satisfied by the joint venture via con-tributions from the partners, and we are liable on a several basiswith our partners in an amount equal to our pro rata ownership inthe joint venture, which is 25 percent. We do not expect to fundunder this guarantee. The carrying value of the liabilities associatedwith these two project completion guarantees is $7 million.
In addition to the guarantees described in the preceding para-graphs, in conjunction with financing obtained for specific projectsor properties owned by joint ventures in which we are a party, wemay provide industry standard indemnifications to the lender forloss, liability, or damage occurring as a result of the actions of theother joint venture owner or our own actions.
Commitments and Letters of CreditIn addition to the guarantees noted previously, as of year-end 2007,we had extended approximately $4 million of loan commitments toowners of lodging properties, under which we expect to fund approx-imately $2 million within one year. We do not expect to fund theremaining $2 million of commitments, which expire after five years.
At year-end 2007, we also have commitments to invest up to$44 million of equity for minority interests in partnerships that planto purchase North American full-service and limited-service proper-ties or purchase or develop hotel anchored mixed-use real estateprojects, which expire as follows: $14 million in one to two years;and $30 million in three to five years. As of year-end 2007, we alsohave a commitment to invest up to $25 million in a joint venture ofwhich we have funded $12 million and have $13 million remainingthat we expect to fund within one year. As of year-end 2007, wealso had a commitment to invest up to $29 million (€20 million) in ajoint venture in which we are an investor. We currently do notexpect to fund under this commitment.
At year-end 2007, we had $96 million of letters of credit out-standing on our behalf, the majority of which related to our self-insurance programs. Surety bonds issued on our behalf at year-end2007, totaled $468 million, the majority of which were requested byfederal, state or local governments related to our lodging operations,including our Timeshare segment and self-insurance programs.
Synthetic FuelThe tax credits available under the Internal Revenue Code for theproduction and sale of synthetic fuels were established byCongress to encourage the development of alternative domesticenergy sources. Congress deemed that the incentives provided bythe tax credits would not be necessary if the price of oil increasedbeyond certain thresholds as prices would then provide a more nat-ural market for these alternative fuels. As a result, the tax creditsavailable under the Internal Revenue Code for the production andsale of synthetic fuel in any given calendar year are phased out ifthe Reference Price of a barrel of oil for that year falls within a spec-ified range. The Reference Price of a barrel of oil is an estimate ofthe annual average wellhead price per barrel of domestic crude oil

and is determined for each calendar year by the Secretary of theTreasury by April 1 of the following year. In 2005 and 2006, theReference Price was roughly equal to 89 percent and 90 percent,respectively, of the average price in those years of the benchmarkNYMEX futures contract for a barrel of light, sweet crude oil. Theprice range within which the credit is phased out was set in 1980and is adjusted annually for inflation. In 2006, the Reference Pricephase-out range was $55.06 to $69.12. Because the ReferencePrice of a barrel of oil for 2006 was within that range, at $59.68,there was a 33 percent reduction of the tax credits available forsynthetic fuel produced and sold in 2006.
Assuming a 2.5 percent inflation adjustment factor for 2007, andassuming the ratio of the Reference Price to the average price ofthe benchmark NYMEX futures contract remains the same forNovember and December 2007 as it has been in the five precedingmonths, we currently estimate that the tax credits available for pro-duction and sale of synthetic fuel in 2007 would begin to be phasedout if the average price of the benchmark NYMEX futures contractin 2007 exceeds approximately $62 and would be fully phased outif the average price of the benchmark NYMEX futures contract in2007 exceeds approximately $78. For the year ended December28, 2007, our results reflect a provision for an estimated 70.71 per-cent tax credit phase-out as a result of high oil prices. The averageprice of the benchmark NYMEX futures contract for 2007, throughDecember 31, 2007, was approximately $72.41.
Late in 2006 and early in 2007, we entered into hedge agree-ments to minimize operating losses that could occur if more than amajority of the tax credits is phased out in 2007.
See Footnote No. 2, “Discontinued Operations,” earlier in thisreport, for additional information related to the synthetic fuel opera-tions, including information related to the cessation of synthetic fuelproduction permanently in November 2007.
Investment in Leveraged LeaseHistorically, we had a $23 million investment in an aircraft leveragedlease with Delta Air Lines, Inc. (“Delta”) which we acquired in 1994.The gross investment was comprised of rentals receivable and theresidual value of the aircraft offset by unearned income. OnSeptember 14, 2005, Delta filed for bankruptcy protection underChapter 11 of the U.S. Bankruptcy Code and informed us that itwished to restructure the lease. As a result, our investment wasimpaired and we had recorded pretax charges of approximately $18 million through 2006. We recorded an additional $5 million lossrelated to this investment in fiscal 2007. We have no remainingexposure related to this historical investment.
18 LEASES
We have summarized our future obligations under operating leasesat year-end 2007, below:
Fiscal Year Minimum Lease Payments
($ in millions)
2008 $ 1422009 1472010 1392011 1262012 123Thereafter 1,156
Total minimum lease payments where we are the primary obligor $1,833
Most leases have initial terms of up to 20 years and contain oneor more renewal options, generally for five- or 10-year periods.These leases provide for minimum rentals and additional rentalsbased on our operations of the leased property. The total minimumlease payments above include $439 million, representing obligationsof consolidated subsidiaries that are non-recourse to MarriottInternational, Inc.
As discussed in Footnote No. 8, “Acquisitions and Dispositions,”we became secondarily liable for annual rent payments for certainhotels when we acquired the Renaissance Hotel Group N.V. in 1997.At year-end 2007, we continued to manage 14 of these hotels underlong-term management agreements; however, due to certain provi-sions in the management agreements, we account for these con-tracts as operating leases. CTF placed funds into trust accounts tocover possible shortfalls in cash flow necessary to meet rent pay-ments under these leases. In turn, we released CTF affiliates fromtheir guarantees in connection with these leases. Approximately $38million remained in these trust accounts at year-end 2007. Minimumlease payments relating to these leases, which are not reflected inthe $1,833 million in the preceding table are as follows: $30 million ineach of 2008, 2009, and 2010; $26 million in 2011; $17 million in2012; and $33 million thereafter, for a total of $166 million.
The composition of rent expense for the last three fiscal yearsassociated with operating leases is detailed in the following table:
($ in millions) 2007 2006 2005
Minimum rentals $272 $253 $211Additional rentals 100 109 109
$372 $362 $320
We have summarized our future obligations under capital leasesat year-end 2007, in the following table:
Fiscal Year Minimum Lease Payments
($ in millions)
2008 $ 12009 12010 12011 12012 1Thereafter 7
Total minimum lease payments 12Less: Amount representing interest (5)
Present value of net minimum lease payments $ 7
The accompanying Consolidated Balance Sheets for year-end2007, included $7 million in the “Long-term debt” caption that rep-resented the present value of net minimum lease payments associ-ated with capital leases.
19 BUSINESS SEGMENTS
We are a diversified hospitality company with operations in five busi-ness segments:
3 North American Full-Service Lodging, which includesMarriott Hotels & Resorts, Marriott Conference Centers, JW Marriott Hotels & Resorts, Renaissance Hotels & Resorts,and Renaissance ClubSport properties located in the conti-nental United States and Canada;
Marriott International, Inc. 2007 65

3 North American Limited-Service Lodging, which includesCourtyard, Fairfield Inn, SpringHill Suites, Residence Inn,TownePlace Suites, and Marriott ExecuStay propertieslocated in the continental United States and Canada;
3 International Lodging, which includes Marriott Hotels &Resorts, JW Marriott Hotels & Resorts, Renaissance Hotels &Resorts, Courtyard, Fairfield Inn, Residence Inn, RamadaInternational, and Marriott Executive Apartments propertieslocated outside the continental United States and Canada;
3 Luxury Lodging, which includes The Ritz-Carlton andBulgari Hotels & Resorts properties worldwide; and
3 Timeshare, which includes the development, marketing,operation, and sale of timeshare, fractional ownership, andresidential properties worldwide under Marriott VacationClub, The Ritz-Carlton Club, Grand Residences by Marriott,and Horizons by Marriott Vacation Club.
In addition to the segments above, in 2007 we exited the syn-thetic fuel business, which was formerly a separate segment butwhich we now report under discontinued operations.
In addition to the brands noted above, in 2007 we announcedour new brand of family-friendly resorts and spas, “NickelodeonResorts by Marriott” and a new brand of lifestyle boutique hotels,“Edition.” At year-end 2007, no properties were yet open undereither brand.
In 2006, we analyzed our internal reporting process and imple-mented changes in the fourth quarter that were designed toimprove efficiency and, as part of this process, we evaluated theimpact on segment reporting. Accordingly, we now report five oper-ating segments, and no longer allocate indirect administrativeexpenses to our segments. We reflect this revised segment report-ing throughout this report for all periods presented, and presenthistorical figures in a manner that is consistent with the revised seg-ment reporting. See also the Form 8-K that we filed on March 19,2007, furnishing quarterly Revenues and Income from ContinuingOperations for each of 2006 and 2005 in the new segment format.
We evaluate the performance of our segments based primarilyon the results of the segment without allocating corporateexpenses, interest expense, or indirect general, administrative, andother expenses. With the exception of the Timeshare segment, wedo not allocate interest income to our segments. Because notesales are an integral part of the Timeshare segment, we includenote sale gains in our Timeshare segment results. We include inter-est income associated with Timeshare segment notes in ourTimeshare segment results because financing sales are an integralpart of that segment’s business. We also allocate other gains orlosses as well as equity in earnings or losses from our joint venturesand divisional general, administrative, and other expenses to eachof our segments. “Other unallocated corporate” represents that por-tion of our revenues, general, administrative, and other expenses,equity in earnings or losses, and other gains or losses that are notallocable to our segments.
We aggregate the brands presented within our North AmericanFull-Service, North American Limited-Service, International, Luxury,and Timeshare segments considering their similar economic charac-teristics, types of customers, distribution channels, the regulatorybusiness environment of the brands and operations within each seg-ment and our organizational and management reporting structure.
Revenues
($ in millions) 2007 2006 2005
North American Full-Service Segment $ 5,476 $ 5,196 $ 5,116
North American Limited-Service Segment 2,198 2,060 1,886
International Segment 1,594 1,411 1,017Luxury Segment 1,576 1,423 1,333Timeshare Segment 2,065 1,840 1,721
Total segment revenues 12,909 11,930 11,073Other unallocated corporate 81 65 56
$12,990 $11,995 $11,129
Income from Continuing Operations
($ in millions) 2007 2006 2005
North American Full-Service Segment $ 478 $ 455 $ 349
North American Limited-Service Segment 461 380 303
International Segment 271 237 133Luxury Segment 72 63 45Timeshare Segment 306 280 271
Total segment financial results 1,588 1,415 1,101Other unallocated corporate (287) (251) (219)Interest income, provision for loan
losses, and interest expense (163) (72) (55)Income taxes (441) (380) (284)
$ 697 $ 712 $ 543
Equity in Earnings (Losses) of Equity Method Investees
($ in millions) 2007 2006 2005
North American Full-Service Segment $ 3 $ 2 $ 21
North American Limited-Service Segment 2 — (6)
International Segment 3 — 20Luxury Segment (4) (2) (1)Timeshare Segment 10 (2) 1
Total segment equity in earnings (losses) 14 (2) 35
Other unallocated corporate 1 5 1
$ 15 $ 3 $ 36
Depreciation and Amortization
($ in millions) 2007 2006 2005
North American Full-Service Segment $ 25 $ 24 $ 19
North American Limited-Service Segment 23 24 24
International Segment 23 23 18Luxury Segment 17 7 10Timeshare Segment 39 39 46
Total segment depreciation and amortization 127 117 117
Other unallocated corporate 62 61 57Discontinued operations 8 10 10
$ 197 $ 188 $ 184
66 Marriott International, Inc. 2007

Assets
At At AtYear-end Year-end Year-end
($ in millions) 2007 2006 2005
North American Full-Service Segment $1,322 $1,104 $1,309
North American Limited-Service Segment 486 565 613
International Segment 855 1,225 1,333Luxury Segment 748 755 656Timeshare Segment 3,142 2,560 2,454
Total segment assets 6,553 6,209 6,365Other unallocated corporate 2,336 2,288 2,062Discontinued operations 53 91 103
$8,942 $8,588 $8,530
Equity Method Investments
At At AtYear-end Year-end Year-end
($ in millions) 2007 2006 2005
North American Full-Service Segment $ 16 $ 18 $ 21
North American Limited-Service Segment 75 35 50
International Segment 62 73 119Luxury Segment 41 17 18Timeshare Segment 99 168 115
Total segment equity method investments 293 311 323
Other unallocated corporate 23 21 26
$ 316 $ 332 $ 349
Goodwill
At At AtYear-end Year-end Year-end
($ in millions) 2007 2006 2005
North American Full-Service Segment $ 406 $ 406 $ 407
North American Limited-Service Segment 72 72 72
International Segment 273 273 273Luxury Segment 170 170 172
Total segment goodwill $ 921 $ 921 $ 924
Capital Expenditures
($ in millions) 2007 2006 2005
North American Full-Service Segment $ 446 $ 75 $ 197
North American Limited-Service Segment 36 38 10
International Segment 44 215 376Luxury Segment 35 104 84Timeshare Segment 56 28 27
Total segment capital expenditures 617 460 694
Other unallocated corporate 54 69 86
$ 671 $ 529 $ 780
Segment expenses include selling expenses directly related tothe operations of the businesses, aggregating $616 million in 2007,$600 million in 2006, and $609 million in 2005. Approximately 89percent for 2007 and 90 percent for each of 2006 and 2005 of the selling expenses are related to our Timeshare segment.
The consolidated financial statements include the followingrelated to operations located outside the United States (which arepredominately related to our International Lodging segment):Revenues of $2,287 million in 2007, $1,869 million in 2006, and$1,388 million in 2005; segment financial results of $341 million in2007 (32 percent from Europe, 30 percent from the Americasexcluding the United States, 17 percent from Asia, 11 percent fromthe United Kingdom, 8 percent from the Middle East and Africa,and 2 percent from Australia), $298 million in 2006, and $178 mil-lion in 2005; and fixed assets of $257 million in 2007 and $684 mil-lion in 2006. At year-end 2007, fixed assets totaling $257 millionlocated outside the United States are included within the “Propertyand equipment” caption in our Consolidated Balance Sheets. Atyear-end 2006, fixed assets totaling $684 million located outsidethe United States include fixed assets of $336 million which areincluded within the “Property and equipment” caption and $348 mil-lion of fixed assets which are included within the “Assets held forsale” caption in our Consolidated Balance Sheets. No individualcountry, other than the United States, constitutes a material portionof our revenues, financial results or fixed assets.
20 VARIABLE INTEREST ENTITIES
We currently consolidate a holding company that holds 100 percentinterest in four entities that are variable interest entities under FIN46, “Consolidation of Variable Interest Entities-revised” (“FIN 46(R)”).At year-end 2007, the combined capital in the four variable interestentities is less than $1 million, which is used primarily to fund hotelworking capital. Our equity at risk was $3 million and we held 55percent of the common equity shares of the holding company. Thecreditors of the holding company do not have general recourse toour credit.
We are party to a venture that develops and markets fractionalownership and residential interests. During the 2007 second quar-ter, we issued a guarantee to the senior lender of the venture insupport of the senior loan facility and reevaluated our variable inter-ests in the venture under FIN 46(R). At that time, we determinedthat we were the primary beneficiary and as such, we also consoli-dated this venture. During the 2007 third quarter, the guarantee wasreplaced with the issuance of a loan facility for $40 million, of which$36 million is receivable and outstanding at year-end 2007. Ourissuance of the loan facility was a reconsideration event under FIN46(R); we again determined we were the primary beneficiary andcontinue to consolidate the joint venture. At year-end 2007, the car-rying amount of consolidated assets that are collateral for the vari-able interest entity’s obligations totaled $141 million and comprised$24 million of accounts receivable, $106 million of real estate heldfor development, property, equipment, and other long-term assets,and $11 million of cash. The creditors of the variable interest entitydo not have general recourse to our credit.
In conjunction with the transaction with CTF described more fullyin Footnote No. 8, “Acquisitions and Dispositions,” under the cap-tion “2005 Acquisitions” we manage certain hotels on behalf of fourtenant entities 100 percent owned by CTF, which lease the hotelsfrom third-party owners. At year-end 2007, the number of hotelstotaled 14. The entities have minimal equity and minimal assetscomprised of hotel working capital. CTF placed money in a trustaccount to cover cash flow shortfalls and to meet rent payments.
Marriott International, Inc. 2007 67
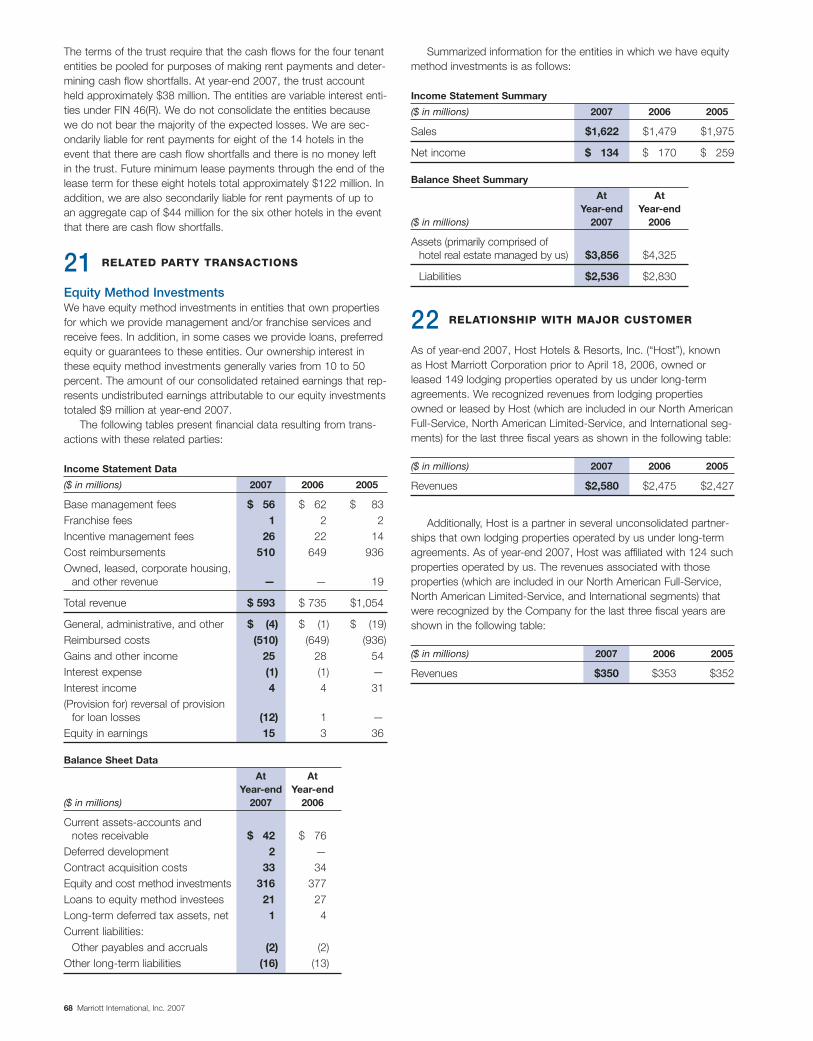
The terms of the trust require that the cash flows for the four tenantentities be pooled for purposes of making rent payments and deter-mining cash flow shortfalls. At year-end 2007, the trust accountheld approximately $38 million. The entities are variable interest enti-ties under FIN 46(R). We do not consolidate the entities becausewe do not bear the majority of the expected losses. We are sec-ondarily liable for rent payments for eight of the 14 hotels in theevent that there are cash flow shortfalls and there is no money leftin the trust. Future minimum lease payments through the end of thelease term for these eight hotels total approximately $122 million. Inaddition, we are also secondarily liable for rent payments of up toan aggregate cap of $44 million for the six other hotels in the eventthat there are cash flow shortfalls.
21 RELATED PARTY TRANSACTIONS
Equity Method InvestmentsWe have equity method investments in entities that own propertiesfor which we provide management and/or franchise services andreceive fees. In addition, in some cases we provide loans, preferredequity or guarantees to these entities. Our ownership interest inthese equity method investments generally varies from 10 to 50percent. The amount of our consolidated retained earnings that rep-resents undistributed earnings attributable to our equity investmentstotaled $9 million at year-end 2007.
The following tables present financial data resulting from trans-actions with these related parties:
Income Statement Data
($ in millions) 2007 2006 2005
Base management fees $ 56 $ 62 $ 83Franchise fees 1 2 2Incentive management fees 26 22 14Cost reimbursements 510 649 936Owned, leased, corporate housing,
and other revenue — — 19
Total revenue $ 593 $ 735 $1,054
General, administrative, and other $ (4) $ (1) $ (19)Reimbursed costs (510) (649) (936)Gains and other income 25 28 54Interest expense (1) (1) —Interest income 4 4 31(Provision for) reversal of provision
for loan losses (12) 1 —Equity in earnings 15 3 36
Balance Sheet Data
At AtYear-end Year-end
($ in millions) 2007 2006
Current assets-accounts and notes receivable $ 42 $ 76
Deferred development 2 —Contract acquisition costs 33 34Equity and cost method investments 316 377Loans to equity method investees 21 27Long-term deferred tax assets, net 1 4Current liabilities:
Other payables and accruals (2) (2)Other long-term liabilities (16) (13)
Summarized information for the entities in which we have equitymethod investments is as follows:
Income Statement Summary
($ in millions) 2007 2006 2005
Sales $1,622 $1,479 $1,975
Net income $ 134 $ 170 $ 259
Balance Sheet Summary
At AtYear-end Year-end
($ in millions) 2007 2006
Assets (primarily comprised of hotel real estate managed by us) $3,856 $4,325
Liabilities $2,536 $2,830
22 RELATIONSHIP WITH MAJOR CUSTOMER
As of year-end 2007, Host Hotels & Resorts, Inc. (“Host”), knownas Host Marriott Corporation prior to April 18, 2006, owned orleased 149 lodging properties operated by us under long-termagreements. We recognized revenues from lodging propertiesowned or leased by Host (which are included in our North AmericanFull-Service, North American Limited-Service, and International seg-ments) for the last three fiscal years as shown in the following table:
($ in millions) 2007 2006 2005
Revenues $2,580 $2,475 $2,427
Additionally, Host is a partner in several unconsolidated partner-ships that own lodging properties operated by us under long-termagreements. As of year-end 2007, Host was affiliated with 124 suchproperties operated by us. The revenues associated with thoseproperties (which are included in our North American Full-Service,North American Limited-Service, and International segments) thatwere recognized by the Company for the last three fiscal years areshown in the following table:
($ in millions) 2007 2006 2005
Revenues $350 $353 $352
68 Marriott International, Inc. 2007

Marriott International, Inc. 2007 69
Shareholder Return Performance Graph—Unaudited
The following graph compares the performance of the Company’s Class A Common Stock from January 3, 2003 to the end of fiscal 2007with the performance of the Standard & Poor’s Corporation Composite 500 Index and the Standard & Poor’s Hotels, Resorts and Cruise LinesIndex. The graph assumes an initial investment of $100 on January 3, 2003, and reinvestment of dividends.
Comparison of Shareholder Returns among Marriott International, Inc., the S&P 500 Index and the S&P 500 Hotels, Resorts and Cruise Lines Index
0
50
100
150
200
250
300
Marriott International, Inc.
S&P 500 Hotels Index
S&P 500 Index
12/28/0712/29/0612/30/0512/31/041/2/041/3/03
Dol
lars
Fiscal Year Ended
1/3/03 1/2/04 12/31/04 12/30/05 12/29/06 12/28/07
Marriott International, Inc. 100.0 135.6 186.3 199.3 285.9 205.8S&P 500 Hotels Index 100.0 145.6 212.1 215.4 246.9 216.0S&P 500 Index 100.0 124.2 138.1 144.9 167.8 178.3
NOTE: The S&P 500 Hotels, Resorts and Cruise Lines Index includes Carnival plc, Starwood Hotels & Resorts, the Company, and Wyndham Hotels and Resorts. In October of2007 Hilton Hotels Corporation was delisted from the index.

70 Marriott International, Inc. 2007
Fiscal Year 2007 (1), (2)
First Second Third Fourth Fiscal($ in millions, except per share data) Quarter Quarter Quarter Quarter Year
Revenues (3) $2,836 $3,122 $2,943 $4,089 $12,990
Operating income (3) $ 237 $ 335 $ 210 $ 406 $ 1,188
Income from continuing operations minority interest $ 164 $ 175 $ 122 $ 236 $ 697Discontinued operations, net of tax 18 32 9 (60) (1)
Net income $ 182 $ 207 $ 131 $ 176 $ 696
Diluted earnings per share from continuing operations $ 0.40 $ 0.43 $ 0.31 $ 0.62 $ 1.75Diluted earnings per share from discontinued operations 0.04 0.08 0.02 (0.16) —
Diluted earnings per share $ 0.44 $ 0.51 $ 0.33 $ 0.46 $ 1.75
Fiscal Year 2006 (1), (2)
First Second Third Fourth Fiscal($ in millions, except per share data) Quarter Quarter Quarter Quarter Year
Revenues (3) $2,648 $2,852 $2,697 $3,798 $11,995
Operating income (3) $ 230 $ 292 $ 227 $ 338 $ 1,087
Income from continuing operations $ 167 $ 182 $ 144 $ 219 $ 712Discontinued operations, after-tax 3 4 (3) 1 5Cumulative effect of change in accounting principle, net of tax (109) — — — (109)
Net income $ 61 $ 186 $ 141 $ 220 $ 608
Diluted earnings per share from continuing operations $ 0.38 $ 0.42 $ 0.34 $ 0.52 $ 1.65Diluted losses per share from cumulative effect of accounting change (0.25) — — — (0.25)Diluted earnings per share from discontinued operations 0.01 0.01 (0.01) — 0.01
Diluted earnings per share $ 0.14 $ 0.43 $ 0.33 $ 0.52 $ 1.41
(1) The quarters consisted of 12 weeks, except for the fourth quarters, which consisted of 16 weeks.(2) All share and per share amounts reflect the June 2006 stock split. The sum of the earnings per share for the four quarters differs from annual earnings per share due to the
required method of computing the weighted average shares in interim periods.(3) Balances do not reflect the impact of the synthetic fuel business as the impact of that business is now reflected in discontinued operations.
Quarterly Financial Data—Unaudited
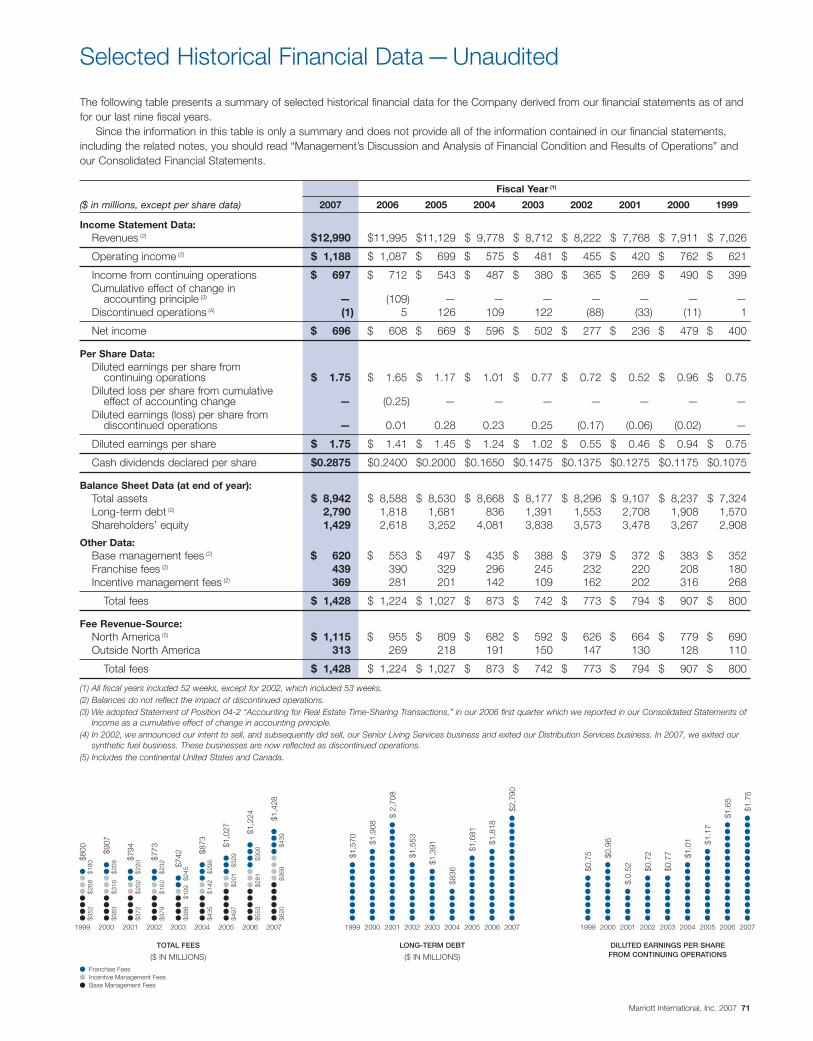
The following table presents a summary of selected historical financial data for the Company derived from our financial statements as of andfor our last nine fiscal years.
Since the information in this table is only a summary and does not provide all of the information contained in our financial statements,including the related notes, you should read “Management’s Discussion and Analysis of Financial Condition and Results of Operations” andour Consolidated Financial Statements.
Fiscal Year (1)
($ in millions, except per share data) 2007 2006 2005 2004 2003 2002 2001 2000 1999
Income Statement Data:Revenues (2) $12,990 $11,995 $11,129 $ 9,778 $ 8,712 $ 8,222 $ 7,768 $ 7,911 $ 7,026
Operating income (2) $ 1,188 $ 1,087 $ 699 $ 575 $ 481 $ 455 $ 420 $ 762 $ 621
Income from continuing operations $ 697 $ 712 $ 543 $ 487 $ 380 $ 365 $ 269 $ 490 $ 399Cumulative effect of change in
accounting principle (3) — (109) — — — — — — —Discontinued operations (4) (1) 5 126 109 122 (88) (33) (11) 1
Net income $ 696 $ 608 $ 669 $ 596 $ 502 $ 277 $ 236 $ 479 $ 400
Per Share Data:Diluted earnings per share from
continuing operations $ 1.75 $ 1.65 $ 1.17 $ 1.01 $ 0.77 $ 0.72 $ 0.52 $ 0.96 $ 0.75Diluted loss per share from cumulative
effect of accounting change — (0.25) — — — — — — —Diluted earnings (loss) per share from
discontinued operations — 0.01 0.28 0.23 0.25 (0.17) (0.06) (0.02) —
Diluted earnings per share $ 1.75 $ 1.41 $ 1.45 $ 1.24 $ 1.02 $ 0.55 $ 0.46 $ 0.94 $ 0.75
Cash dividends declared per share $0.2875 $0.2400 $0.2000 $0.1650 $0.1475 $0.1375 $0.1275 $0.1175 $0.1075
Balance Sheet Data (at end of year):Total assets $ 8,942 $ 8,588 $ 8,530 $ 8,668 $ 8,177 $ 8,296 $ 9,107 $ 8,237 $ 7,324Long-term debt (2) 2,790 1,818 1,681 836 1,391 1,553 2,708 1,908 1,570Shareholders’ equity 1,429 2,618 3,252 4,081 3,838 3,573 3,478 3,267 2,908
Other Data:Base management fees (2) $ 620 $ 553 $ 497 $ 435 $ 388 $ 379 $ 372 $ 383 $ 352Franchise fees (2) 439 390 329 296 245 232 220 208 180Incentive management fees (2) 369 281 201 142 109 162 202 316 268
Total fees $ 1,428 $ 1,224 $ 1,027 $ 873 $ 742 $ 773 $ 794 $ 907 $ 800
Fee Revenue-Source:North America (5) $ 1,115 $ 955 $ 809 $ 682 $ 592 $ 626 $ 664 $ 779 $ 690Outside North America 313 269 218 191 150 147 130 128 110
Total fees $ 1,428 $ 1,224 $ 1,027 $ 873 $ 742 $ 773 $ 794 $ 907 $ 800
(1) All fiscal years included 52 weeks, except for 2002, which included 53 weeks.(2) Balances do not reflect the impact of discontinued operations.(3) We adopted Statement of Position 04-2 “Accounting for Real Estate Time-Sharing Transactions,” in our 2006 first quarter which we reported in our Consolidated Statements of
Income as a cumulative effect of change in accounting principle.(4) In 2002, we announced our intent to sell, and subsequently did sell, our Senior Living Services business and exited our Distribution Services business. In 2007, we exited our
synthetic fuel business. These businesses are now reflected as discontinued operations.(5) Includes the continental United States and Canada.
Marriott International, Inc. 2007 71
Selected Historical Financial Data—Unaudited
TOTAL FEES
($ IN MILLIONS)
20001999 2001 2002 2003 2004 2005 2006
$800
$352
$268
$180
$383
$316
$208
$372
$202
$220
$379
$162
$232
$388
$109
$245
$435
$142
$296
$497
$201
$329
$553
$281
$390
$620
$369
$439
$907
$794
$773
$742 $8
73 $1,0
27
2007
$1,2
24 $1,4
28
Franchise FeesIncentive Management FeesBase Management Fees
20001999 2001 2002 2003 2004 2005 2006
LONG-TERM DEBT
($ IN MILLIONS)
$1,5
70 $1,9
08
$ 2,
708
$1,5
53
$1,3
91
$836
$1,6
81
2007
$1,8
18
$2,7
90
20001999 2001 2002 2003 2004 2005 2006
DILUTED EARNINGS PER SHAREFROM CONTINUING OPERATIONS
$0.7
5 $0.9
6
$.0.
52 $0.7
2
$0.7
7 $1.0
1 $1.1
7
$1.6
5
2007
$1.7
5
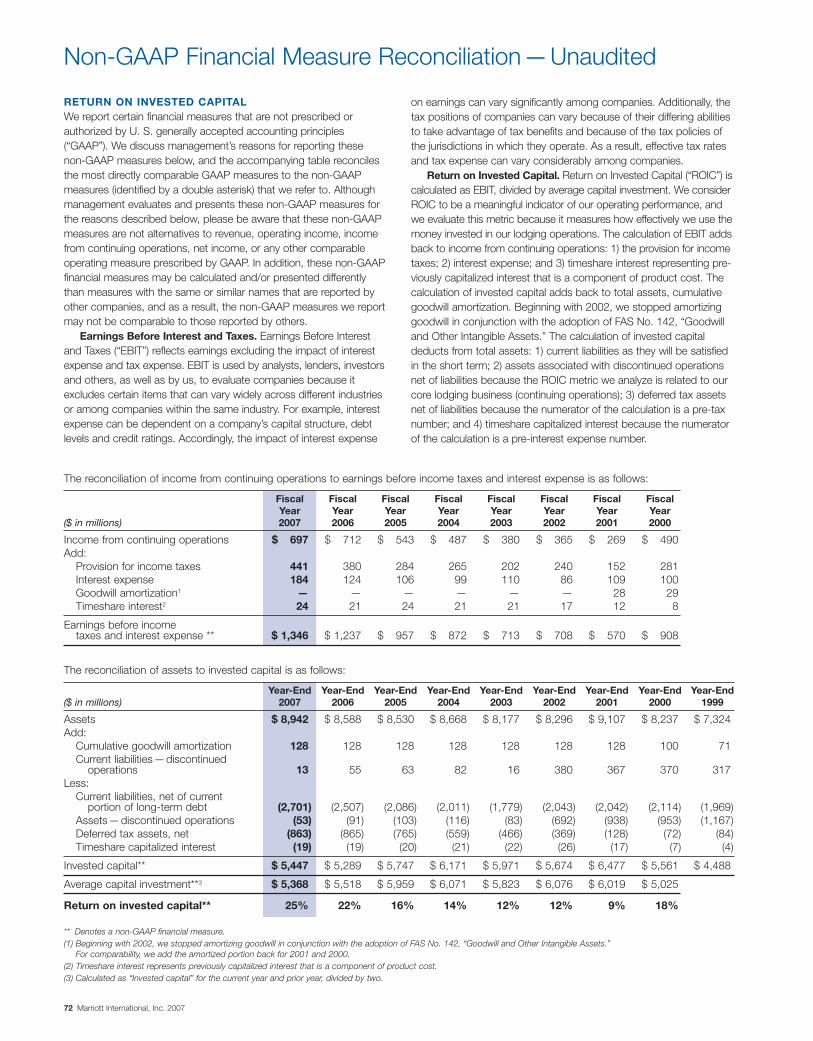
72 Marriott International, Inc. 2007
The reconciliation of income from continuing operations to earnings before income taxes and interest expense is as follows:
Fiscal Fiscal Fiscal Fiscal Fiscal Fiscal Fiscal FiscalYear Year Year Year Year Year Year Year
($ in millions) 2007 2006 2005 2004 2003 2002 2001 2000
Income from continuing operations $ 697 $ 712 $ 543 $ 487 $ 380 $ 365 $ 269 $ 490Add:
Provision for income taxes 441 380 284 265 202 240 152 281Interest expense 184 124 106 99 110 86 109 100Goodwill amortization1 — — — — — — 28 29Timeshare interest2 24 21 24 21 21 17 12 8
Earnings before income taxes and interest expense ** $ 1,346 $ 1,237 $ 957 $ 872 $ 713 $ 708 $ 570 $ 908
The reconciliation of assets to invested capital is as follows:
Year-End Year-End Year-End Year-End Year-End Year-End Year-End Year-End Year-End($ in millions) 2007 2006 2005 2004 2003 2002 2001 2000 1999
Assets $ 8,942 $ 8,588 $ 8,530 $ 8,668 $ 8,177 $ 8,296 $ 9,107 $ 8,237 $ 7,324Add:
Cumulative goodwill amortization 128 128 128 128 128 128 128 100 71Current liabilities—discontinued
operations 13 55 63 82 16 380 367 370 317Less:
Current liabilities, net of current portion of long-term debt (2,701) (2,507) (2,086) (2,011) (1,779) (2,043) (2,042) (2,114) (1,969)
Assets—discontinued operations (53) (91) (103) (116) (83) (692) (938) (953) (1,167)Deferred tax assets, net (863) (865) (765) (559) (466) (369) (128) (72) (84)Timeshare capitalized interest (19) (19) (20) (21) (22) (26) (17) (7) (4)
Invested capital** $ 5,447 $ 5,289 $ 5,747 $ 6,171 $ 5,971 $ 5,674 $ 6,477 $ 5,561 $ 4,488
Average capital investment**3 $ 5,368 $ 5,518 $ 5,959 $ 6,071 $ 5,823 $ 6,076 $ 6,019 $ 5,025
Return on invested capital** 25% 22% 16% 14% 12% 12% 9% 18%
** Denotes a non-GAAP financial measure.(1) Beginning with 2002, we stopped amortizing goodwill in conjunction with the adoption of FAS No. 142, “Goodwill and Other Intangible Assets.”
For comparability, we add the amortized portion back for 2001 and 2000.(2) Timeshare interest represents previously capitalized interest that is a component of product cost.(3) Calculated as “Invested capital” for the current year and prior year, divided by two.
Non-GAAP Financial Measure Reconciliation—Unaudited
RETURN ON INVESTED CAPITALWe report certain financial measures that are not prescribed orauthorized by U. S. generally accepted accounting principles(“GAAP”). We discuss management’s reasons for reporting thesenon-GAAP measures below, and the accompanying table reconcilesthe most directly comparable GAAP measures to the non-GAAPmeasures (identified by a double asterisk) that we refer to. Althoughmanagement evaluates and presents these non-GAAP measures forthe reasons described below, please be aware that these non-GAAPmeasures are not alternatives to revenue, operating income, incomefrom continuing operations, net income, or any other comparableoperating measure prescribed by GAAP. In addition, these non-GAAPfinancial measures may be calculated and/or presented differentlythan measures with the same or similar names that are reported byother companies, and as a result, the non-GAAP measures we reportmay not be comparable to those reported by others.
Earnings Before Interest and Taxes. Earnings Before Interestand Taxes (“EBIT”) reflects earnings excluding the impact of interestexpense and tax expense. EBIT is used by analysts, lenders, investorsand others, as well as by us, to evaluate companies because itexcludes certain items that can vary widely across different industriesor among companies within the same industry. For example, interestexpense can be dependent on a company’s capital structure, debtlevels and credit ratings. Accordingly, the impact of interest expense
on earnings can vary significantly among companies. Additionally, thetax positions of companies can vary because of their differing abilitiesto take advantage of tax benefits and because of the tax policies ofthe jurisdictions in which they operate. As a result, effective tax ratesand tax expense can vary considerably among companies.
Return on Invested Capital. Return on Invested Capital (“ROIC”) iscalculated as EBIT, divided by average capital investment. We considerROIC to be a meaningful indicator of our operating performance, andwe evaluate this metric because it measures how effectively we use themoney invested in our lodging operations. The calculation of EBIT addsback to income from continuing operations: 1) the provision for incometaxes; 2) interest expense; and 3) timeshare interest representing pre-viously capitalized interest that is a component of product cost. Thecalculation of invested capital adds back to total assets, cumulativegoodwill amortization. Beginning with 2002, we stopped amortizinggoodwill in conjunction with the adoption of FAS No. 142, “Goodwilland Other Intangible Assets.” The calculation of invested capitaldeducts from total assets: 1) current liabilities as they will be satisfiedin the short term; 2) assets associated with discontinued operationsnet of liabilities because the ROIC metric we analyze is related to ourcore lodging business (continuing operations); 3) deferred tax assetsnet of liabilities because the numerator of the calculation is a pre-taxnumber; and 4) timeshare capitalized interest because the numeratorof the calculation is a pre-interest expense number.

Marriott International, Inc. 2007 73
Management of Marriott International, Inc. is responsible for theintegrity and objectivity of the consolidated financial statements andother financial information presented in this annual report. In meet-ing this responsibility, we maintain a highly developed system ofinternal controls, policies and procedures, including an internalauditing function.
The consolidated financial statements have been audited byErnst & Young LLP, independent registered public accounting firm.Its report expresses an informed judgment as to whether man-agement’s financial statements, considered in their entirety, fairlypresent, in all material respects, our financial position, operatingresults and cash flows in conformity with U.S. generally acceptedaccounting principles.
Management’s Responsibility for Financial Statements
The Board of Directors pursues its responsibility for the financialstatements through its Audit Committee, composed of three direc-tors not otherwise employed by the Company. The committeemeets a minimum of four times during the year with the independ-ent registered public accounting firm, representatives of manage-ment and the internal auditors to review the scope and results ofthe internal and external audits, the accounting principles applied infinancial reporting, and financial and operational controls. The inde-pendent registered public accounting firm and internal auditors haveunrestricted access to the Audit Committee, with or without thepresence of management.
Management of Marriott International, Inc. (the “Company”) isresponsible for establishing and maintaining adequate internal con-trol over financial reporting and for the assessment of the effective-ness of internal control over financial reporting. As defined by theSecurities and Exchange Commission, internal control over financialreporting is a process designed by, or under the supervision of, theCompany’s principal executive and principal financial officers andeffected by the Company’s Board of Directors, management, andother personnel, to provide reasonable assurance regarding the reli-ability of financial reporting and the preparation of the consolidatedfinancial statements in accordance with U.S. generally acceptedaccounting principles.
The Company’s internal control over financial reporting is sup-ported by written policies and procedures that: (1) pertain to themaintenance of records that, in reasonable detail, accurately andfairly reflect the Company’s transactions and dispositions of theCompany’s assets; (2) provide reasonable assurance that transac-tions are recorded as necessary to permit preparation of the con-solidated financial statements in accordance with U.S. generallyaccepted accounting principles, and that receipts and expendituresof the Company are being made only in accordance with authoriza-tions of the Company’s management and directors; and (3) providereasonable assurance regarding prevention or timely detection ofunauthorized acquisition, use or disposition of the Company’sassets that could have a material effect on the consolidated finan-cial statements.
Management’s Report on Internal Control Over Financial Reporting
Because of its inherent limitations, internal control over financialreporting may not prevent or detect misstatements. Also, projec-tions of any evaluation of effectiveness to future periods are subjectto the risk that controls may become inadequate because ofchanges in conditions, or that the degree of compliance with thepolicies or procedures may deteriorate.
In connection with the preparation of the Company’s annualconsolidated financial statements, management has undertaken anassessment of the effectiveness of the Company’s internal controlover financial reporting as of December 28, 2007, based on criteriaestablished in Internal Control-Integrated Framework issued by theCommittee of Sponsoring Organizations of the TreadwayCommission (the “COSO Framework”). Management’s assessmentincluded an evaluation of the design of the Company’s internal con-trol over financial reporting and testing of the operational effective-ness of those controls.
Based on this assessment, management has concluded that asof December 28, 2007, the Company’s internal control over finan-cial reporting was effective to provide reasonable assurance regard-ing the reliability of financial reporting and the preparation offinancial statements for external purposes in accordance with U.S.generally accepted accounting principles.
Ernst & Young LLP, the independent registered public account-ing firm that audited the Company’s consolidated financial state-ments included in this report, has issued an attestation report oninternal control over financial reporting, a copy of which appears onthe next page of this annual report.

74 Marriott International, Inc. 2007
We have audited Marriott International, Inc.’s internal control overfinancial reporting as of December 28, 2007, based on criteriaestablished in Internal Control-Integrated Framework issued by theCommittee of Sponsoring Organizations of the TreadwayCommission (“the COSO criteria”). Marriott International, Inc.’s man-agement is responsible for maintaining effective internal control overfinancial reporting and for its assessment of the effectiveness ofinternal control over financial reporting- included in the accompany-ing Management’s Report on Internal Control Over FinancialReporting. Our responsibility is to express an opinion on the com-pany’s internal control over financial reporting based on our audit.
We conducted our audit in accordance with the standards of thePublic Company Accounting Oversight Board (United States). Thosestandards require that we plan and perform the audit to obtain rea-sonable assurance about whether effective internal control overfinancial reporting was maintained in all material respects. Our auditincluded obtaining an understanding of internal control over financialreporting, assessing the risk that a material weakness exists, testingand evaluating the design and operating effectiveness of internalcontrol based on the assessed risk, and performing such other pro-cedures as we considered necessary in the circumstances. Webelieve that our audit provides a reasonable basis for our opinion.
A company’s internal control over financial reporting is a processdesigned to provide reasonable assurance regarding the reliability offinancial reporting and the preparation of financial statements forexternal purposes in accordance with generally accepted account-ing principles. A company’s internal control over financial reportingincludes those policies and procedures that (1) pertain to the main-tenance of records that, in reasonable detail, accurately and fairlyreflect the transactions and dispositions of the assets of the com-pany; (2) provide reasonable assurance that transactions are
Report of Independent Registered Public Accounting Firm on Internal Control Over Financial Reporting
recorded as necessary to permit preparation of financial statementsin accordance with generally accepted accounting principles, andthat receipts and expenditures of the company are being made onlyin accordance with authorizations of management and directors ofthe company; and (3) provide reasonable assurance regarding pre-vention or timely detection of unauthorized acquisition, use, or dis-position of the company’s assets that could have a material effecton the financial statements.
Because of its inherent limitations, internal control over financialreporting may not prevent or detect misstatements. Also, projec-tions of any evaluation of effectiveness to future periods are subjectto the risk that controls may become inadequate because ofchanges in conditions, or that the degree of compliance with thepolicies or procedures may deteriorate.
In our opinion, Marriott International, Inc. maintained in all mate-rial respects, effective internal control over financial reporting as ofDecember 28, 2007, based on the COSO criteria.
We also have audited, in accordance with the standards of thePublic Company Accounting Oversight Board (United States), theconsolidated balance sheets of Marriott International, Inc. as ofDecember 28, 2007 and December 29, 2006, and the related con-solidated statements of income, cash flows, comprehensive incomeand shareholders’ equity for each of the three fiscal years in theperiod ended December 28, 2007, of Marriott International, Inc. andour report dated February 14, 2008 expressed an unqualifiedopinion thereon.
McLean, VirginiaFebruary 14, 2008
To the Board of Directors and Shareholders of Marriott International, Inc.:

Marriott International, Inc. 2007 75
We have audited the accompanying consolidated balance sheets ofMarriott International, Inc. as of December 28, 2007 and December29, 2006, and the related consolidated statements of income, cashflows, comprehensive income and shareholders’ equity for each ofthe three fiscal years in the period ended December 28, 2007.These financial statements are the responsibility of the Company’smanagement. Our responsibility is to express an opinion on thesefinancial statements based on our audits.
We conducted our audits in accordance with the standards ofthe Public Company Accounting Oversight Board (United States).Those standards require that we plan and perform an audit to obtainreasonable assurance about whether the financial statements arefree of material misstatement. An audit includes examining, on a testbasis, evidence supporting the amounts and disclosures in the finan-cial statements. An audit also includes assessing the accountingprinciples used and significant estimates made by management, aswell as evaluating the overall financial statement presentation. Webelieve that our audits provide a reasonable basis for our opinion.
In our opinion, the financial statements referred to above presentfairly, in all material respects, the consolidated financial position ofMarriott International, Inc. as of December 28, 2007 and December29, 2006, and the consolidated results of its operations and itscash flows for each of the three fiscal years in the period ended
Report of Independent Registered Public Accounting Firm
December 28, 2007, in conformity with U.S. generally acceptedaccounting principles.
As discussed in Note 1 to the financial statements, in 2007 theCompany adopted the provisions of FASB Interpretation No. 48,“Accounting for Uncertainty in Income Taxes” and FASB StatementNo. 156, “Accounting for Servicing of Financial Assets.” In 2006 theCompany changed its accounting for real estate time-sharing transac-tions in connection with the adoption of Statement of Position 04-2,“Accounting for Real Estate Time-sharing Transactions,” and changedits accounting for stock-based compensation in connection with theadoption of FASB Statement No. 123(R), “Share-Based Payment.”
We also have audited, in accordance with the standards of thePublic Company Accounting Oversight Board (United States), MarriottInternational, Inc.’s internal control over financial reporting as ofDecember 28, 2007, based on criteria established in Internal Control-Integrated Framework issued by the Committee of SponsoringOrganizations of the Treadway Commission and our report datedFebruary 14, 2008, expressed an unqualified opinion thereon.
McLean, VirginiaFebruary 14, 2008
To the Board of Directors and Shareholders of Marriott International, Inc.:

76 Marriott International, Inc. 2007
DirectorsJ.W. MARRIOTT, JR.1
Chairman of the Board andChief Executive OfficerMarriott International, Inc.
JOHN W. MARRIOTT III
Vice Chairman of the Board, Marriott International, Inc., and Chief Executive Officer JWM Family Enterprises, L.P.
LAWRENCE W. KELLNER1,2,4
Chairman of the Board and Chief Executive OfficerContinental Airlines, Inc.
DEBRA L. LEE4,5
Chairman and Chief Executive OfficerBET Networks
FLORETTA DUKES MCKENZIE3,4,6
Senior Advisor, American Institute for Research,and Founder and Former ChairwomanThe McKenzie Group
GEORGE MUÑOZ2,4,5
PrincipalMuñoz Investment Banking Group, LLC
HARRY J. PEARCE2,5
ChairmanNortel Networks Corporation
STEVEN S REINEMUND3,4
Retired Chairman of the Board and Chief Executive OfficerPepsiCo, Inc.
WILLIAM J. SHAW5
President and Chief Operating OfficerMarriott International, Inc.
LAWRENCE M. SMALL3,5
Former SecretaryThe Smithsonian Institution
Director EmeritusSTERLING D. COLTON
Chairman EmeritusThe Ritz-Carlton Hotel Company, L.L.C.WILLIAM R. TIEFEL
Senior Executive OfficersJ.W. MARRIOTT, JR.†
Chairman of the Board andChief Executive Officer
WILLIAM J. SHAW†
President and Chief Operating Officer
EDWARD A. RYAN†
Executive Vice President andGeneral Counsel
ARNE M. SORENSON†
Executive Vice President,Chief Financial Officer andPresident–Continental European Lodging
JAMES M. SULLIVAN†
Executive Vice PresidentLodging Development
Executive Officers
CARL T. BERQUIST†
Executive Vice PresidentFinancial Information and Enterprise Risk Management
A. BRADFORD BRYAN, JR.
Executive Vice PresidentArchitecture and Construction
SIMON F. COOPER†
President and Chief Operating OfficerThe Ritz-Carlton Hotel Company, L.L.C.
EDWIN D. FULLER†
President and Managing DirectorMarriott Lodging– International
BANCROFT S. GORDON
Vice President, Senior Counsel and Corporate Secretary
CAROLYN B. HANDLON5
Executive Vice President–Financeand Global Treasurer
DEBORAH MARRIOTT HARRISON
Senior Vice PresidentGovernment Affairs
MICHAEL E. JANNINI
Executive Vice PresidentGlobal Brand Strategy and Innovation
Directors and Officers*
STEPHEN P. JOYCE
Executive Vice PresidentDevelopment and Owner and Franchise Services
KEVIN M. KIMBALL
Executive Vice President–FinanceMarriott Lodging
KATHLEEN MATTHEWS5
Executive Vice PresidentGlobal Communications and Public Affairs
ROBERT J. MCCARTHY†
PresidentNorth American Lodging Operations and Global Brand Management
AMY C. MCPHERSON5
Executive Vice PresidentGlobal Sales and Marketing
JIMMIE WALTON PASCHALL5
Global Diversity Officer andSenior Vice President, External Affairs
LAURA E. PAUGH
Senior Vice President– Investor Relations
DAVID A. RODRIGUEZ5,†
Executive Vice PresidentGlobal Human Resources
STEPHEN P. WEISZ†
PresidentMarriott Vacation Club International
CARL WILSON
Executive Vice President andChief Information Officer
LEGEND* All information as of March 10, 2008.1 Executive Committee2 Audit Committee3 Compensation Policy Committee4 Nominating and Corporate Governance Committee5 Committee for Excellence6 Dr. McKenzie retires from the Board on May 2, 2008.† Executive officer as defined under the Securities Exchange
Act of 1934

Cert no. SW-COC-002262
Marriott International, Inc. 2007 77
Corporate Information
Corporate HeadquartersMarriott International, Inc.10400 Fernwood RoadBethesda, MD 20817301/380-3000Internet: Marriott.com
Common Stock ListingsThe company’s Class A common stock (tickersymbol: MAR) is listed on the New York StockExchange and other exchanges.
Shareholders of RecordAt January 25, 2008, there were 354,043,159shares of Class A Common Stock outstandingheld by 48,288 shareholders of record.
Investor RelationsFor information, call: 301/380-6500Internet: Marriott.com/investor
Independent Registered Public Accounting FirmErnst & Young LLPMcLean, Virginia
Annual Meeting of ShareholdersMay 2, 2008—10:30 a.m.JW Marriott Hotel1331 Pennsylvania Avenue, NWWashington, DC 20004
Registrar and Transfer AgentShareholder inquiries regarding stock transfers,dividend payments, address changes, enrollmentin the company’s direct investment plan, loststock certificates, or other stock account mattersshould be directed to:
Mellon Investor Services480 Washington Blvd., 29th FloorJersey City, NJ 07310800/311-4816 (U.S. and Canada)+1 201/680-6693 (International)Internet: www.melloninvestor.com
Common Stock Prices and Dividends
DividendsStock Price Declared
High Low Per Share
2006– First quarter .......$35.35 $32.32 $0.0525– Second quarter.. 38.38 34.20 0.0625– Third quarter ...... 38.44 34.30 0.0625– Fourth quarter.... 48.31 37.19 0.0625
2007– First quarter .......$51.50 $44.79 $0.0625– Second quarter.. 52.00 43.90 0.0750– Third quarter ...... 48.85 39.70 0.0750– Fourth quarter.... 45.10 31.34 0.0750
Internet Users: We invite you to learnmore about Marriott’s business and growthopportunities at Marriott.com/investor. Ourinvestor site includes investor presentations,earnings conference calls, press releases,SEC filings, company history, and informa-tion about the company’s governance andBoard of Directors. You may also enroll inour dividend reinvestment plan.
Shareholders may also elect to receivenotices of shareholder meetings, proxymaterials and annual reports electronicallythrough the Internet. If your shares are reg-istered in your own name, and not in “streetname” through a broker or other nominee,simply log in to Investor ServiceDirect, theInternet site maintained by our transferagent, Mellon Investor Services LLC, atwww.melloninvestor.com/isd and the step-by-step instructions will prompt youthrough enrollment.
Telephone NumbersFor reservations or information, call:
Marriott Hotels & Resorts ........... 800/228-9290Renaissance Hotels & Resorts ... 800/468-3571The Ritz-Carlton Hotel
Company, L.L.C. ..................... 800/241-3333JW Marriott Hotels & Resorts ..... 800/228-9290Bulgari Hotels & Resorts ............ 301/547-4900Courtyard ................................... 800/321-2211SpringHill Suites ......................... 888/287-9400Fairfield Inn................................. 800/228-2800Residence Inn ............................ 800/331-3131TownePlace Suites ..................... 800/257-3000Marriott Executive Apartments ... 800/800-5744Marriott ExecuStay ..................... 800/800-5744Marriott Vacation Club................ 866/300-3032The Ritz-Carlton Club................. 800/941-4386Grand Residences by Marriott.... 866/894-7263Horizons by Marriott
Vacation Club .......................... 866/300-3032
Lodging Development Inquiries
TONY CAPUANO
Executive Vice PresidentNorth America Full Service ......... 301/380-3200
DARYL NICKEL
Executive Vice PresidentSelect-Service and Extended-Stay,
North America ......................... 301/380-5237
KEVIN KEARNEY
Executive Vice PresidentEurope, the Middle East
and Africa ............................41-44-723-5100
PAUL FOSKEY
Executive Vice PresidentAsia/Pacific...............................852-2918-6230
CARLTON ERVIN
Senior Vice PresidentCaribbean and Latin America ..... 301/380-2340
STEPHEN MUDGE
Executive Vice PresidentMixed Use Development ............ 301/380-8028
RICHARD HOFFMAN
Executive Vice PresidentMergers, Acquisitions and
Business Development ............ 301/380-1670
SCOTT MELBY
Executive Vice PresidentDevelopment, Planning and
Feasibility................................. 301/380-3200
Internet: www.MarriottDevelopment.com
©Marriott International, Inc. 2008 All rights reserved.
CEO and CFO CertificationsAs required by the New York Stock Exchangelisting rules, our Chief Executive Officer certifiedto the New York Stock Exchange on May 21,2007, that he was not aware of any violation bythe company of the New York Stock Exchangelisting standards as of that date. In addition,our Chief Executive Officer and our ChiefFinancial Officer have provided certificationswith respect to the company’s public disclo-sures as required under Rule 13a-14(a) andRule 13a-14(b) of the Securities Exchange Act,which certifications were either furnished orfiled as Exhibits 31.1, 31.2 and 32 to the com-pany’s Annual Report on Form 10-K for fiscalyear 2007 filed with the Securities andExchange Commission.
Other InformationAny shareholder who would like a copy of thecompany’s Annual Report on Form 10-K for fiscalyear 2007 may obtain one, without charge, byaddressing a request to the Secretary, MarriottInternational, Inc., Department 52/862, MarriottDrive, Washington, DC 20058. The company’scopying costs will be charged if copies ofexhibits to the Annual Report on Form 10-K arerequested. You may also obtain a copy of theAnnual Report on Form 10-K for fiscal year2007, including exhibits, from the company’sWeb site at Marriott.com/investor, clicking on“Corporate Information & SEC Filings.”
With our commitment to preserving the environment and all of its natural resources, this report isprinted with soy ink on recycled, Environmental Choice Certified paper. The FSC certification isgranted by the Forest Stewardship Council for supporting responsible use of forest resources.
Special thanks to the Crystal Gateway Marriott in Arlington, Va., for hosting the photo shoot of our employees featured in this report.

COVER
Stephanie EllisCustomer Care Sales SpecialistGlobal Reservations and Customer Care CenterSalt Lake City, Utah
With her extensive knowledge about Marriott, and a friendly smile that almost radiates through thephone, Stephanie will help you select the perfecthotel for your next business trip or family vacation.
2007 AwardsMarriott International, Inc.100 Best Companies to Work For and One of America’s Most Admired Companies (FORTUNE ®)
Best Places to Launch a Career (BusinessWeek)
100 Best Companies for Working Mothers (Working Mother)
Top 50 Companies for Diversity (DiversityInc)
Top 40 Companies for Diversity (Black Enterprise)
Diversity Elite 60 (Hispanic Business)
100% Score on Corporate Equality Index (Human Rights Campaign)
Top Hospitality and Travel Company for Innovative Use of Technology (InformationWeek)
2007 Extra Mile Award (Budget Travel)
Best Hotel Chain Worldwide (Business Traveller Germany)
2007 ENERGY STAR® Sustained Excellence Award (The U.S. Environmental Protection Agency)
World Savers Award for Outstanding CommunityEngagement and Social Responsibility Programs (Condé Nast Traveler)
The Ritz-Carlton Hotel Company, L.L.C.Best Luxury Hotel Chain (Consumer Reports, Luxury Institute and J.D. Power and Associates®)
Customer Service Elite (BusinessWeek)
JW Marriott Hotels & ResortsTop Upscale Hotel Brand (Business Travel News)
Customer Service Elite (BusinessWeek)
Marriott Hotels & ResortsTop Upscale Hotel Brand (Business Travel News)Top Brand for Business Travelers (TripAdvisor®)
Courtyard by MarriottOne of Top Five Hotel Chains (TripAdvisor)
SpringHill Suites by MarriottTop Mid-Priced Hotel Brand (Business Travel News)
Marriott Vacation Club InternationalBest Customer Service Organization in America (American Business Awards)
Marriott RewardsBest Customer Service; Frequent Guest Program–Americas (Freddie Awards)
Marriott International, Inc.Marriott DriveWashington, D.C. 20058Marriott.com
Global Reach. Personal Service.
Marriott International, Inc. 2007 Annual Report