2015 edition annual health, labour and welfare · pdf file2015 edition annual health, labour...
TRANSCRIPT

Ministry of Health, Labour and Welfare
2015 Edition
Annual Health, Labour and Welfare Report
― Consideration of a depopulating society ― ~ Towards a society where people can live in peace and
realize of their hope ~
【 Summary 】

Table of contents (Part 1)
Prologue Projections of Population Decline and its Impact 1st Section Projections of Population Decline
2nd Section The Impacts of Population Decline in Japan and the Future Direction with Long-term Vision 1st Chapter Depopulating Society
1st Section Overview of Population in Japan
2nd Section Various Measures to be taken for Population in Japan
3rd Section Background and Current Status of Declining Population Society and the Nation’s Opinions
4th Section The current situations in foreign countries
5th Section Summary: Review of efforts aimed at overcoming the depopulation issue
2nd Chapter Measures for Overcoming Population Decline
Prologue Overview picture of how the nation has been dealing with the depopulation issue
1st Section Fulfill the Hopes of Young Generation for Child-rearing
2nd Section To support life in communities as a result of depopulation
2
Prologue Projections of Population Decline and its Impact
1st Section Projections of Population Decline
3
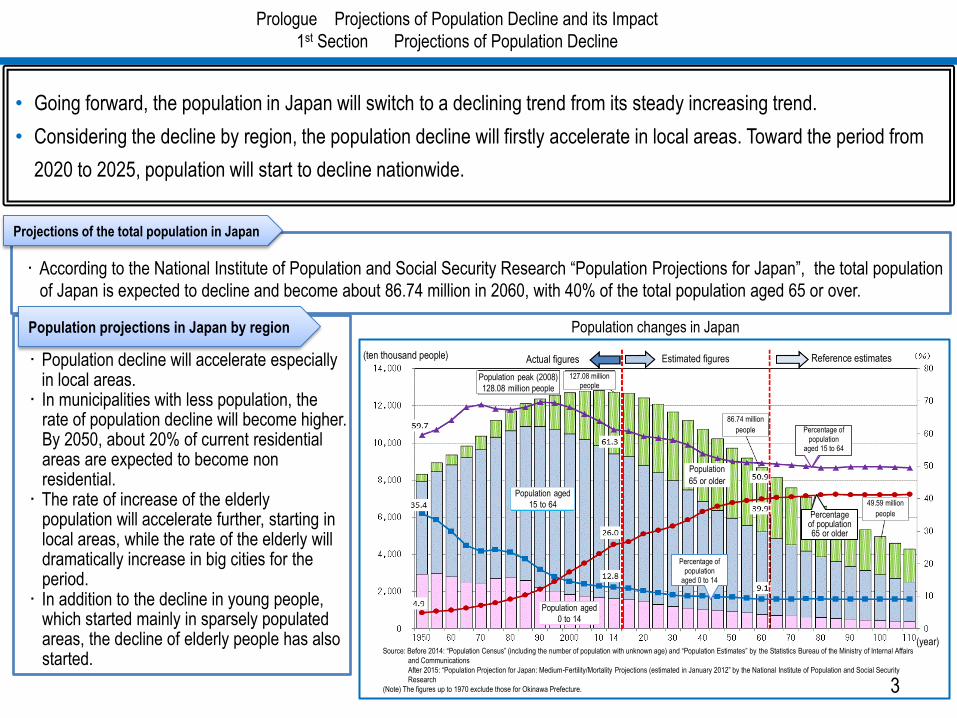
Population changes in Japan
• Going forward, the population in Japan will switch to a declining trend from its steady increasing trend.
• Considering the decline by region, the population decline will firstly accelerate in local areas. Toward the period from
2020 to 2025, population will start to decline nationwide.
・According to the National Institute of Population and Social Security Research “Population Projections for Japan”, the total population
of Japan is expected to decline and become about 86.74 million in 2060, with 40% of the total population aged 65 or over.
・Population decline will accelerate especially in local areas. ・In municipalities with less population, the
rate of population decline will become higher. By 2050, about 20% of current residential areas are expected to become non residential.
・The rate of increase of the elderly population will accelerate further, starting in local areas, while the rate of the elderly will dramatically increase in big cities for the period.
・In addition to the decline in young people, which started mainly in sparsely populated areas, the decline of elderly people has also started.
Projections of the total population in Japan
Population projections in Japan by region
(ten thousand people) Actual figures Estimated figures Reference estimates
Population peak (2008)
128.08 million people
Population aged
15 to 64
127.08 million
people
Population aged
0 to 14
Population
65 or older
Percentage of
population aged 0 to 14
86.74 million
people Percentage of
population aged 15 to 64
Percentage of population 65 or older
49.59 million
people
(year) Source: Before 2014: “Population Census” (including the number of population with unknown age) and “Population Estimates” by the Statistics Bureau of the Ministry of Internal Affairs
and Communications
After 2015: “Population Projection for Japan: Medium-Fertility/Mortality Projections (estimated in January 2012” by the National Institute of Population and Social Security
Research
(Note) The figures up to 1970 exclude those for Okinawa Prefecture.

Prologue 2nd Section The Impacts of Population Decline in Japan and the Future Direction with Long-term Vision
Population projections illustrated in “Town, people, creation of jobs with a long-term vision”
4
• An aging society with fewer children will affect negatively 1) the economy, 2) local communities and 3) social security and finance.
• In “the long-term vision for the creation of cities, people and jobs” decided by the cabinet, the government is indicating to develop an approach to stop the
further population decline and to secure total population of around 90 million people in 2060, and aiming a stationary state of population of around 90 million
people in about 2090.
• It takes decades to make the birth rate recover and stop the decline, therefore, prevention of population decline is a pressing issue.
• Further, the current nation’s desired birth rate is about 1.8. Further recovery from that level to about 2.07, which is a necessary level for natural population
growth, requires the nation’s desired birth rate to become higher. This is important.
① Impact on economy: The decline of labor input and consumption brought by decline of labor force.
② Impact on local communities: Rapid shrinkage of local economic societies in rural areas and functional reduction in urban cities.
③ Impact on social security and finance: The decline in the number of workers paying for social security will lead to difficulty maintaining
social security and impact toward fiscal consolidation.
We suggest “putting a brake on declining
population” as a future direction, and we
present our estimate in the possible
improved birth rate.
If realizing young generation’s dreams comes
true, the fertility rate is expected to raise to about
1.8.
If the fertility rate recovers to the replacement
level 2.07 by 2030 - 2040, total population will be
able to be kept at around 100 million in 2060.
If steady population level and productivity
improvements are realized, the real GDP growth
rate is expected to be kept at the level of 1.5% -
2.0%.
Impacts of population decline
Direction with long-term vision
(注1)実績は、総務省統計局「国勢調査」等による(各年10月1日現在の人口)。国立社会保障・人口問題研究所「日本の将来推計人口(平成24年1月推計)」は出生中位(死亡中位)の仮定による。2110~2160年の点線は2110年までの仮定等をもとに、まち・ひと・しごと創生本部事務局において機械的に延長したものである。
(注2)「合計特殊出生率が上昇した場合」は、経済財政諮問会議専門調査会「選択する未来」委員会における人口の将来推計を参考にしながら、合計特殊出生率が2030年に1.8程度、2040年に2.07程度( 2020年には1.6程度 )となった場合について、まち・ひと・しごと創生本部事務局において推計を行ったものである。
128.08 million people in 2008 (population peak)
127.30 million people as of 2013
101.94 million people as of 2060 (Reference 1) 100.30 million people (Reference 2) 98.84 million people 90.26 million people in 2110
(Reference 1) 86.75 million people (Reference 2) 83.46 million people
86.74 million people as of 2060
42.86 million people as of 2110
(ten thousand people)
Actual figures (1960-2013)
“Population Projection for Japan: Medium-Fertility/Mortality Projections (estimated in January
2012”
In case total fertility rate increases (approximately 1.8 in 2030, 2.07 in 2040) (Reference 1) In case total fertility rate: approximately 1.8 in 2035, 2.07 in 2045)
(Reference 2) In case total fertility rate: approximately 1.8 in 2040, 2.07 in 2050)
(Note 1) Actual figures are from the “Population Census” etc. by the Statistics Bureau of Ministry of Internal Affairs and Communications (population as of October 1 of each year). Estimated figures are from
“Population Projection for Japan: Medium-Fertility/Mortality Projections (estimated in January 2012). Dotted lines for the period between 2110 and 2116 are based on the data up to 2110 and
mechanically extended by the Head Office of “Towns, people and creation of jobs.”
(Note 2) “In case the total fertility rate increases” is estimates by the Head Office of “Towns, people and creation of jobs,” in which the total fertility rate becomes approximately 1.8 in 2030, 2.07 in 2040 (1.6
in 2020), with reference to population projections by “Choice for the Future” Council on Economic and Fiscal Policy, Expert Panel, Committee for Japan’s Future.

1st Chapter Depopulating Society
1st Section Overview of Population in Japan
Annual changes in number of live births and total fertility rate
• The number of live births in Japan increased rapidly in the late 1940s immediately after the war (the 1st baby boom), however, the number of live births
decreased remarkably after the 1950s. Then, the fertility rate remained at the level of around 2 except 1966, the year of Hinoeuma when giving birth is
generally avoided due to superstition. After the 2nd baby boom, the fertility rate reached below replacement level in 1974 and continued to decline since then.
• An aging society with fewer children rapidly developed partially due to a rapid increase in the life expectancy . The population declined after peaking in 2008.
Change in birth trend and its factors
・The fertility rate has become lower than the replacement level since 1974.
・Japan has remained the world’s top country for longevity since the 1980s.
・Since the beginning of the 21th century, the death rate has increased more than the fertility
rate, causing natural attrition.
Trends in birth and death
・A large proportion of the population moved in large cities during high
economic growth periods.
・Excess concentration of population to the Greater Tokyo Area mainly
among the still continues after the 1980s.
Population migration
5 Source: “Vital Statistics” by the Statistics and Information Department, Minister’s Secretariat, MHLW (Note) The figures from 1947 to 1972 exclude those for Okinawa Prefecture. The figures up to 2013 are final data. The figurers for 2014 are preliminary data.
① The period between the 1950s and mid 1970s:
The fertility rate fell sharply in the 1950s, then the birth rate
remained steady.
←The number of births per a married couple declined. 2
children per married couple became average.
② The period between the mid 1970s and mid 2000s:
←Until the mid 1980s, the cause of fertility rate decline
was mainly the late marriage trend. In addition, decline
in the parenting age group population also contributed to
the decline in number.
←Since the mid 1980s,the fertility rate has declined further
due to tendency for staying unmarried and decline in the
number of births per a married couple in addition to the
late marriage trend.
③ Since the mid 2000s:
←The fertility rate has slightly increased, especially the
rate by women aged 30 and over.
First baby boom (1947-1949)
(ten thousand people)
2.70 million (1949)
Year of “Hinoeuma”
(1966)
Second baby boom (1971-1974)
1 million people 1.42
(2014)
Num
ber o
f liv
e bi
rths
Tot
al f
ertil
ity r
ate
/ R
epla
cem
ent
leve
l
Number of live births (left axis) Total fertility rate (right axis) Replacement level (right axis)
(year)

1st Chapter 2nd Section Various Measures to be taken for Population in Japan
• Soon after the end of the war, rapid population increase started (the 1st baby
boom) and then population increase control become an issue to be dealt with.
• After its peak of 1949, the population increase stopped and started to decline
sharply.
• The population inflow into large cities from rural farming areas as a result of
high economic growth.
• Since 1974, just after the 2nd baby boom, the fertility rate has remained below
the level of the replacement.
• People’s awareness about population issues has gradually shifted from
population increase control to measures for a graying population, leading to the
development of welfare for the elderly.
• The long-term trend of declining fertility rate has not been dealt with even
though there has bee focus on the fertility rate trend.
《How people thought about this trend in those times》
・In 1949, “the resolution on the population issue” was
adopted by the Lower House plenary session.
⇒ The resolution recognized that population at the time was
significantly surplus, and for decrease the surplus population, decided
the dissemination of family planning (birth control concept), research and
preparation regarding future immigration.
《How these issues were dealt with in those times》
・1974 Population White Paper (Population Council)
⇒ “Based on the world’s population trend and each issue, more efforts
should be taken to deal with stopping the population increase.
・1984 ‘s Population Council Report
⇒This report referred to the importance of promoting the elderly’s
participation in various social activities while expecting a further
birthrate decline. [Projections of population of the time ]
・Intermediate forecast in 1976:
Population increase would continue and hit its peak in 2010.
・Intermediate forecast in 1981 and 1986:
Population growth would peak in around 2010, then population is
expected to decline gradually while the long-term estimated fertility rate
would be 2.00 (estimated in mid 1986). ← Then, the trend of birth rate decline was not marked.
6
• Since 1974, the fertility rate has remained lower than the replacement level. Population issues have been focused on the measures for dealing with a graying
population rather than population increase control.
• In the wake of“1.57 shock” in 1990, people’s interest in the declining fertility rate became higher as a social issue.
• Since then, various measures for birthrate decline have been taken. As a result, each one of these measures has steadily progressed.
• After the birth rate recorded the lowest level of 1.26 in 2005, it recovered to the level of 1.42 recently (as of 2014).
The post-World War Ⅱ – the 1st baby boom (1945-1970)
The 2nd baby boom - the end of the Showa era (1971-1989)
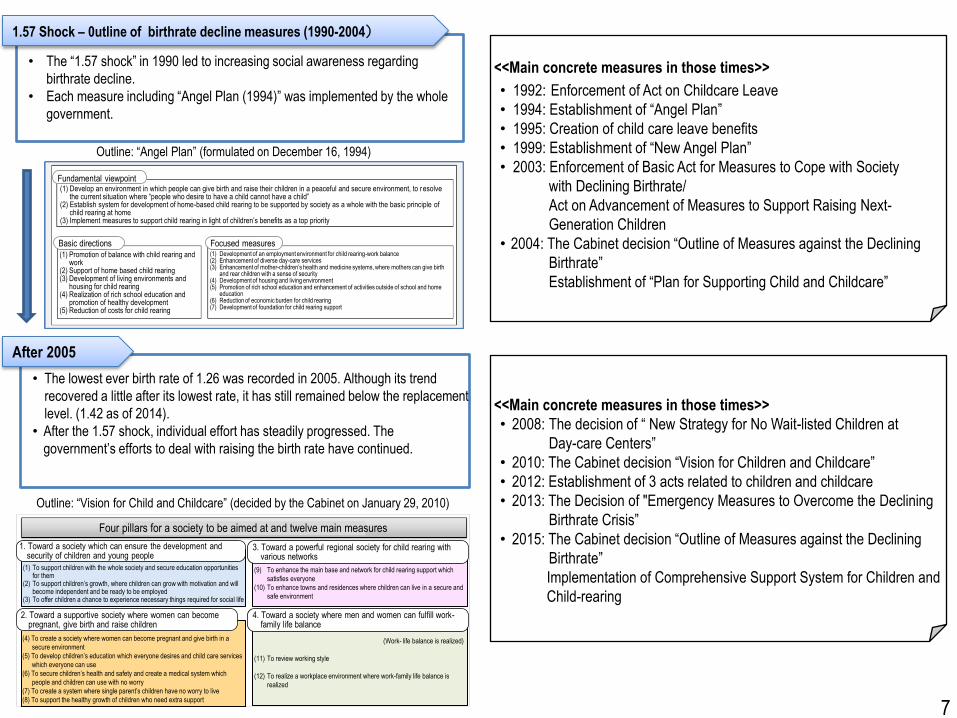
• The “1.57 shock” in 1990 led to increasing social awareness regarding
birthrate decline.
• Each measure including “Angel Plan (1994)” was implemented by the whole
government.
• The lowest ever birth rate of 1.26 was recorded in 2005. Although its trend
recovered a little after its lowest rate, it has still remained below the replacement
level. (1.42 as of 2014).
• After the 1.57 shock, individual effort has steadily progressed. The
government’s efforts to deal with raising the birth rate have continued.
<<Main concrete measures in those times>>
• 1992: Enforcement of Act on Childcare Leave
• 1994: Establishment of “Angel Plan”
• 1995: Creation of child care leave benefits
• 1999: Establishment of “New Angel Plan”
• 2003: Enforcement of Basic Act for Measures to Cope with Society
with Declining Birthrate/
Act on Advancement of Measures to Support Raising Next-
Generation Children
• 2004: The Cabinet decision “Outline of Measures against the Declining
Birthrate”
Establishment of “Plan for Supporting Child and Childcare”
7
<<Main concrete measures in those times>>
• 2008: The decision of “ New Strategy for No Wait-listed Children at
Day-care Centers”
• 2010: The Cabinet decision “Vision for Children and Childcare”
• 2012: Establishment of 3 acts related to children and childcare
• 2013: The Decision of "Emergency Measures to Overcome the Declining
Birthrate Crisis”
• 2015: The Cabinet decision “Outline of Measures against the Declining
Birthrate”
Implementation of Comprehensive Support System for Children and
Child-rearing
1.57 Shock – 0utline of birthrate decline measures (1990-2004)
After 2005
Outline: “Angel Plan” (formulated on December 16, 1994)
Outline: “Vision for Child and Childcare” (decided by the Cabinet on January 29, 2010)
Fundamental viewpoint
Basic directions Focused measures
(1) Develop an environment in which people can give birth and raise their children in a peaceful and secure environment, to resolve the current situation where “people who desire to have a child cannot have a child”
(2) Establish system for development of home-based child rearing to be supported by society as a whole with the basic principle of child rearing at home
(3) Implement measures to support child rearing in light of children’s benefits as a top priority
(1) Promotion of balance with child rearing and work
(2) Support of home based child rearing (3) Development of living environments and
housing for child rearing (4) Realization of rich school education and
promotion of healthy development (5) Reduction of costs for child rearing
(1) Development of an employment environment for child rearing-work balance (2) Enhancement of diverse day-care services (3) Enhancement of mother-children’s health and medicine systems, where mothers can give birth
and rear children with a sense of security (4) Development of housing and living environment (5) Promotion of rich school education and enhancement of activities outside of school and home
education (6) Reduction of economic burden for child rearing (7) Development of foundation for child rearing support
Four pillars for a society to be aimed at and twelve main measures
1. Toward a society which can ensure the development and security of children and young people
3. Toward a powerful regional society for child rearing with various networks
(1) To support children with the whole society and secure education opportunities for them
(2) To support children’s growth, where children can grow with motivation and will become independent and be ready to be employed
(3) To offer children a chance to experience necessary things required for social life
2. Toward a supportive society where women can become pregnant, give birth and raise children
(4) To create a society where women can become pregnant and give birth in a
secure environment
(5) To develop children’s education which everyone desires and child care services
which everyone can use
(6) To secure children’s health and safety and create a medical system which
people and children can use with no worry
(7) To create a system where single parent’s children have no worry to live
(8) To support the healthy growth of children who need extra support
(9) To enhance the main base and network for child rearing support which
satisfies everyone
(10) To enhance towns and residences where children can live in a secure and
safe environment
4. Toward a society where men and women can fulfill work-family life balance
(Work- life balance is realized)
(11) To review working style
(12) To realize a workplace environment where work-family life balance is
realized

• The percentage of unmarried people in Japan has been increasing year by year, however, most single people desire to marry in the future.
• The reasons why single young people don’t get married are that they don’t have much opportunity to meet their ideal person, f inancial concern such as being afraid of lack of living expenses after marriage , and others are not wanting to lose their free and easygoing lifestyle and their wish to focus on their work(or academic life) .
• Especially, there are many non-regular employees who remain single due to economic reasons. And among men, disparity between regular employees and non-regular employees is also observed for the ratio of having a partner.
<Reasons not married so far (aged 20-29 and 30-39)>
<Ratio of a married couple with a spouse by employment status (male)>
<Proportion of lifetime never-married (including future estimate)>
86.3 89.4
0 20 40 60 80
男性 女性
(%)
Source: “Fourteenth Japanese National Fertility Survey in 2010 (Survey on Singles)” by the National Institute of Population and Social Security Research (Note) The figures are for never-married persons aged 18-34
<Among never-married persons who intend to marry someday (18-34 years)>
1.7 2.1 2.6 3.9
5.6
9.0
12.6
16.0
20.1
24.2
26.6 27.4 27.6 29.0
3.3 4.3 4.5 4.3
4.3 5.1
5.8 7.3
10.6
14.9
17.8 18.9 18.8 19.2
0
5
10
15
20
25
1970 1975 1980 1985 1990 1995 2000 2005 2010 2015 2020 2025 2030 2035
男性
女性
(%)
Source: “Population Statistics (year of 2015)” and “Household Projection for Japan (January 2013)” by the
National Institute of Population and Social Security Research.
(Note) Proportion of lifetime never-married is the ratio of people that have never marred at the age of 50, and is
calculated by the average of unmarried people from 45 to 49 and from 50 to 54 by “Population Statistics
(year of 2015)” up to 2010 and “Household Projection for Japan” after 2015.
→ Future figures
(year)
Male
Female
55.0
21.7
38.6
33.1
27.8
24.5
21.2
19.5
16.4
58.2
20.3
24.3
20.7
31.6
27.0
22.9
25.7
20.3
0 10 20 30 40 50 60
適当な相手にめぐり合わないから
異性とうまくつきあえないから
結婚後の生活資金が足りないと思うから
結婚資金が足りないから
自由や気楽さを失いたくないから
まだ若すぎるから
趣味や娯楽を楽しみたいから
必要性を感じないから
仕事(学業)にうちこみたいから
男性
女性
(%)
Source: “Survey Report on Marriage and Family Formation” (2010) by the Cabinet Office
Reasons you have not got married
Reasons you do not
want to get married
9.6
3.7
33.4
14.5
60.1
27.1
71.7
33.5
0 10 20 30 40 50 60 70
正規の職員・従業員
非正規の職員・従業員
正規の職員・従業員
非正規の職員・従業員
正規の職員・従業員
非正規の職員・従業員
正規の職員・従業員
非正規の職員・従業員
20~
24
歳
25~
29
歳
30~
34
歳
35~
39
歳
(%)
Source: Prepared by the Office of Counselor for Policy Evaluation attached to Director-General for Policy Planning and Evaluation,
Ministry of Health, Labour and Welfare, from 2012 Employment Status Survey of Ministry of Internal Affairs and Communications
(Note) Martial partner includes person of separation by death, separation by divorce, and unknown
1st Chapter 3rd Section Background and Current Status of Declining Population Society and the Nation’s Opinions
Circumstances surrounding marriage and its opinions
8
Actual figures ←
Male Female
Male
Female
Have not met the right person
Not good at dealing with the opposite sex
Think don’t have enough money after marriage
Think don’t have enough money for marriage
Don’t want to lose freedom or easygoing life
Too young
Don’t want sacrifice hobbies and leisure
Don’t think it is necessary to get married
Concentrate on work or study
year
s
year
s
year
s
year
s
Regular staff/worker
Non-regular staff/worker
Regular staff/worker
Non-regular staff/worker
Regular staff/worker
Non-regular staff/worker
Regular staff/worker
Non-regular staff/worker
1.86 1.69
1.66
1.66 1.64
1.42
1.30 1.27
1.27 1.24
1.15
1.0 1.1 1.2 1.3 1.4 1.5 1.6 1.7 1.8 1.9 2.0
沖 縄
宮 崎 島 根
長 崎
熊 本 全 国
宮 城 北海道
奈 良 京 都
東 京
Source: “2014 Vital Statistics (preliminary data)” by the Statistics and Information Department, Minister’s Secretariat, MHLW 9
<末子が6歳未満の夫婦の1週間当たりの家事・育児時間>
<Total fertility rate by prefectures (top five and bottom five prefectures> <結婚時の妻の年齢別の完結出生児数>
<初婚年齢と母の平均年齢の推移>
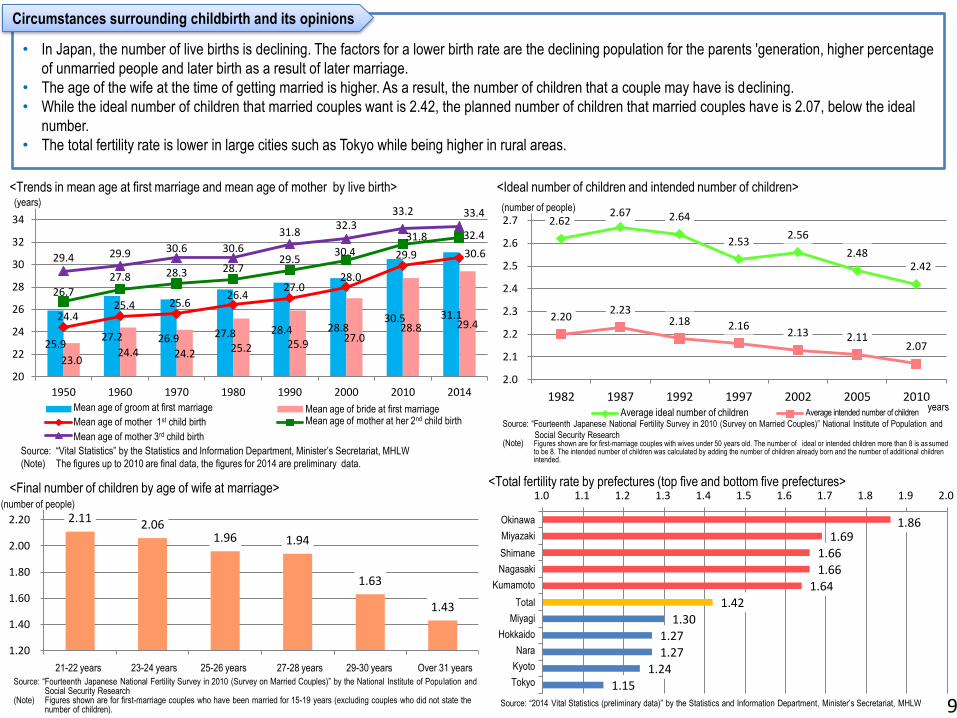
• In Japan, the number of live births is declining. The factors for a lower birth rate are the declining population for the parents 'generation, higher percentage
of unmarried people and later birth as a result of later marriage.
• The age of the wife at the time of getting married is higher. As a result, the number of children that a couple may have is declining.
• While the ideal number of children that married couples want is 2.42, the planned number of children that married couples have is 2.07, below the ideal
number.
• The total fertility rate is lower in large cities such as Tokyo while being higher in rural areas.
<初婚年齢と出生時の母の平均年齢の推移> <理想子ども数と予定子ども数>
Circumstances surrounding childbirth and its opinions
2.62 2.67 2.64
2.53 2.56
2.48 2.42
2.20 2.23
2.18 2.16 2.13 2.11
2.07
2.0
2.1
2.2
2.3
2.4
2.5
2.6
2.7
1982 1987 1992 1997 2002 2005 2010
平均理想子ども数 平均予定子ども数 Source: “Fourteenth Japanese National Fertility Survey in 2010 (Survey on Married Couples)” National Institute of Population and
Social Security Research (Note) Figures shown are for first-marriage couples with wives under 50 years old. The number of ideal or intended children more than 8 is assumed
to be 8. The intended number of children was calculated by adding the number of children already born and the number of addit ional children intended.
(人)
25.9 27.2 26.9 27.8 28.4 28.8
30.5 31.1
23.0 24.4 24.2 25.2 25.9
27.0 28.8 29.4
24.4 25.4 25.6
26.4 27.0
28.0
29.9 30.6
26.7
27.8 28.3 28.7 29.5
30.4
31.8 32.4
29.4 29.9 30.6 30.6
31.8 32.3
33.2 33.4
20
22
24
26
28
30
32
34
1950 1960 1970 1980 1990 2000 2010 2014
夫の平均初婚年齢 妻の平均初婚年齢 第1子出生時の母の平均年齢 第2子出生時の母の平均年齢 第3子出生時の母の平均年齢
(歳)
資料:厚生労働省大臣官房統計情報部「人口動態統計」 (注)2010年までは確定数、2014年は概数
(年)
2.11 2.06 1.96 1.94
1.63
1.43
1.20
1.40
1.60
1.80
2.00
2.20
21~22歳 23~24歳 25~26歳 27~28歳 29~30歳 31歳~
資料:国立社会保障・人口問題研究所「第14回出生動向基本調査(夫婦調査)」(2010年) (注)対象は結婚持続期間15~19年の初婚どうしの夫婦(出生子ども数不詳を除く)
(人)
(years)
(number of people)
Mean age of groom at first marriage
Mean age of mother 1st child birth
Mean age of mother 3rd child birth
Mean age of bride at first marriage Mean age of mother at her 2nd child birth
(number of people)
<Trends in mean age at first marriage and mean age of mother by live birth>
Source: “Vital Statistics” by the Statistics and Information Department, Minister’s Secretariat, MHLW
(Note) The figures up to 2010 are final data, the figures for 2014 are preliminary data.
<Final number of children by age of wife at marriage>
21-22 years 23-24 years 25-26 years 27-28 years 29-30 years Over 31 years
Source: “Fourteenth Japanese National Fertility Survey in 2010 (Survey on Married Couples)” by the National Institute of Population and Social Security Research
(Note) Figures shown are for first-marriage couples who have been married for 15-19 years (excluding couples who did not state the number of children).
<Ideal number of children and intended number of children>
Average ideal number of children Average intended number of children years
Okinawa
Miyazaki
Shimane
Nagasaki
Kumamoto
Total
Miyagi
Hokkaido
Nara
Kyoto
Tokyo

<末子が6歳未満の夫婦の1週間当たりの家事・育児時間> <初婚年齢と母の平均年齢の推移>
• The ratio of people who are in the middle of child raising who feel burden and insecure about child raising: about 70% of men vs. 80% of women.
• The necessary and important things for the young generation to feel positive about giving birth and child raising are: securing a steady employment status
and income, utilizing nursery schools without worry, developing the environment for balancing work and family, review of working style etc. Those factors
are the highest ranked.
• The percentage of women with a job before giving a birth who continue to work after giving a birth: less than 40%
• House chores are being done by most housemakers‘ with children below 6 years old.
• The percentage of 3 generations living together continues to become lower. As an ideal family living style, half of married couples desire to live together
with their parents or live in the neighborhood. Families with small children in their thirties have a tendency to wish to live in the neighborhood.
39
202
40
152
28
259
30
216
0 50 100 150 200 250 300 350 400 450
全世帯平均・夫
全世帯平均・妻
共働き世帯・夫
共働き世帯・妻
育児時間 その他家事関連時間
Source: “Survey on Time Use and Leisure Activities” (2011), by the Ministry of Internal Affairs and Communications
(Note) “Other housework related hours” is the total hours of “housework”, “caring and nursing” and “shopping.”
<Daily time spent on housework and childcare by married couples with children below 6> <子育てをしていて負担・不安に思う人の割合>
Circumstances surrounding child care and family, and its opinions
<第1子出産前後の妻の就業変化>
24.2 13.7 62.1
0% 20% 40% 60% 80% 100%
就業継続(育休利用) 就業継続(育休なし) 出産退職
Continued employment rate after giving birth
<Necessary things which help people feel positive about childbirth and child rearing (top five items)>
72.4
47.4
46.4
42.1
38.2
24.4
43.8
45.3
49.2
49.9
0 10 20 30 40 50 60 70 80 90
安定した雇用と収入
安心して保育サービスが
利用できること
安心できる出産・小児医療の
体制確保
仕事と家庭の両立支援、長時間
労働などの働き方の見直し
周産期・小児医療費や保育料
など経済的負担の軽減
とても必要、大事 ある程度必要、大事
(%)
Source: “Awareness Survey for a Society with Declining Population” (2015) by the Counsellor Office for Policy Evaluation, Director-General for Policy
Planning and Evaluation, MHLW
10
26.0
31.6
41.4
45.7
14.9
12.7
9.8
5.9
7.9
4.0
0% 10% 20% 30% 40% 50% 60% 70% 80% 90% 100%
男性
女性
とてもある どちらかといえばある どちらかといえばない ない わからない Source: “Awareness Survey for a Society with Declining Population” (2015) by the Counsellor Office for Policy Evaluation, Director-General for
Policy Planning and Evaluation, MHLW
(Note) The figures are people who have children aged 0-15.
<Ideal family living style>
16.2
13.8
6.9
4.4
1.1
3.8
17.3
35.1
17.7
14.5
14.9
30.8
21.7
29.8
31.5
18.6
3.2
4.6
3.7
0.8
3.6
2.1
3.9
0% 10% 20% 30% 40% 50% 60% 70% 80% 90% 100%
全体
30代男性
30代女性
親・子ども・父方の祖父母(夫の親)との三世代世帯(同居) 親・子ども・母方の祖父母(妻の親)との三世代世帯(同居)
親と子どもの世帯で父方の祖父母と(夫の親)と近居 親と子どもの世帯で母方の祖父母(妻の親)と近居
親と子どもの世帯で祖父母とは離れて住む 夫婦のみの2人暮らし
ひとり暮らし その他・わからない
Source: “Child rearing awareness survey in families and communities” (2013), by the Cabinet Office
Male
Steady employment and income
<Ratio of people who feel burden and insecure regarding child rearing>
Female
Very much A little Not really Not at all Don’t know
Stable availability of childcare services
Supportive system offering safe childbirth
and pediatric medical care
Work-family life balance support and review of working style including work with long
hours etc. Reduction of economic burden for perinatal period, pediatric medical expense, nursing
school expense etc.
Very needed and important Needed at a certain level, important
<Change in employment status of wives before and after giving birth to their first child>
Very Continued employment (using child-care leave) much
Continued employment (not using child-care leave)
Retire after giving birth
Source: “Fourteenth Japanese National Fertility Survey in 2010 (Survey on Married Couples)” by the National Institute of Populat ion and Social Security Research
All households average/husband
All households average/wife
Double incomes/ husband
Double incomes/ wife
Time spent for childcare Time spent for other housework related chores
(minutes)
Total
Male 30-39
Female 30-39
Three generation households consisting of a married couple and a child or children, and paternal grandparents (husband’s parents)
Households with a married couple and a child or children, living in proximity to paternal grandparents (husband’s parents)
Households with a married couple and a child or children, living away from grandparents
Living alone
Three generation households consisting of a married couple and a child or children, and maternal grandparents (wife’s parents)
Households with a married couple and their children, living in proximity to maternal grandparents (wife’s parents)
Households with a married couple
Other(s) / Do not know

<Ratio of people who said “0” when they were asked “number of people they communicate
with in their neighborhood and community>
<Do you feel attachment to the area where you live?>
<Is a community support necessary for child rearing?>
57.1 33.8 6.7 1.8 0.2
0.4
0% 10% 20% 30% 40% 50% 60% 70% 80% 90% 100%
とても重要だと思う やや重要だと思う どちらとも言えない
あまり重要ではないと思う まったく重要ではないと思う わからない Source: “Child Rearing Awareness Survey in Families and a Communities” (2013), by the Cabinet Office
23.0
41.9
69.2
20.3
39.4
67.4
17.6
37.7
64.7
17.2
35.2
61.4
13.9
29.9
55.7
0 20 40 60
挨拶程度の付き合いの人が「0人」
日常的に立ち話をする程度の人が「0人」
生活面で協力しあっている人が「0人」
政令指定都市(東京23区を含む) 人口30万人以上の自治体(政令指定都市以外) 人口10万人以上30万人未満の自治体 人口5万人以上10万人未満の自治体 人口5万人未満の自治体
(%)
Source: “Awareness Survey for a Society with Declining Population” (2015) by the Counsellor Office for Policy Evaluation, Director-General for Policy Planning and Evaluation, MHLW
26.6 38.3 25.6 5.6 3.9
0% 10% 20% 30% 40% 50% 60% 70% 80% 90% 100%
あてはまる まああてはまる どちらともいえない どちらかといえばあてはまらない あてはまらない
Source: “2010 National Survey of Lifestyle Preferences” (2010), by the Cabinet Office
• More than 90% of people think that the support from their communities is important for child raising, but many people do not have close relations with their
neighborhood (especially in urban areas, this tendency is remarkable).
• While the number of people with little relationship with their community is increasing, people’s thoughts about their community are still strong. Nearly 80%
of people who live in rural farming and fishing villages say that they don’t want to move to an urban area. On the other hand, about 40% of people living in
urban areas have an intention to move to a rural area.
• For conditions to immigrate to the rural areas, many people indicate that basic infrastructures for their daily life, such as shopping, medical centers are
ensured, and they can secure the job as they require there.
<Willingness of people in rural faming and fishing areas to move to big cities>
5.3 14.4 2.9 33.7 43.7
0% 10% 20% 30% 40% 50% 60% 70% 80% 90% 100%
移住したい どちらかというと移住したい
その他・わからない どちらかというと移住したくない 移住したくない
Source: “Poll for Rural Farming and Fishing Areas” (2014) by the Cabinet Office
<Willingness of people in big cities to move to local areas>
21.3 18.4 0.8 33.3 26.2
0% 10% 20% 30% 40% 50% 60% 70% 80% 90% 100%
思う どちらかといえば思う わからない どちらかといえば思わない 思わない Source: “Poll about Japan’s Future Image regarding Population, Economic Society etc.” 2014), by the Cabinet Office
<Conditions that people think they may move>
Child raising in the community and changes in connection with a community: to keep connection with a community with a declining population
11
51.6
50.3
42.5
34.4
42.7
54.4
38.5
33.0
61.6
45.8
47.0
35.9
0 10 20 30 40 50 60
買い物、医療などの日常生活基盤が
確保されている
希望する仕事が確保できる
居住に必要な家屋や土地が安く得られる
交通インフラが整備されている
全体
男性
女性
(%)
Source: “Awareness Survey for a Society with Declining Population” (2015) by the Counsellor Office for Policy
Evaluation, Director-General for Policy Planning and Evaluation, MHLW
Neither important nor unimportant
Not very important
Very important A little important
Not important at all Don’t know
I have neighbors that I just greet (0)
I have neighbors whom I talk to when I have a chance to meet them (0)
I have neighbors who help each other in daily life (0)
Government-decreed cities (including 23 wards in Tokyo)
Municipalities with a population of over 300,000
Municipalities with a population of over 100,000 and less than 300,000
Municipalities with a population of over 50,000 and less than 100,000
Municipalities with a population of less than 50,000
Very much
Neutral
Not at all
Quite a lot
Not really
Want to move
Other(s) / Don’t know
Don’t want to move
If asked, I may say I want to move
If asked, I may say I don’t want to move
Very much A little Don’t know Not really Not at all
There are shops, medical facilities etc. in the
neighborhood needed for daily life
I can get a job which I desire
I can obtain a house and some land at
reasonable cost needed for a residence
Transportation infrastructure is secured
Total
Male
Female

1st Chapter 4th Section The current situations in foreign countries 12
Comparison of public social expenditure (family relation) as a percent of GDP
• As far as fertility rates in foreign countries are concerned, the rates in France and Sweden have recovered to the level of around 2 while those of Japan and
Germany have remained around the level of 1.4.
• Japan’s GDP ratio of the government family expense is lower than other foreign countries.
Trends in the total fertility rate in various countries Each related index
1.36
3.78 2.85
2.11
3.46
0.72
0
1
2
3
4
日本 英国 フランス ドイツ スウェーデン アメリカ
Source: OECD Social Expenditure Database (data obtained in February 2015). Data in 2011.
(%)
Measures taken in other countries
・The distinctive characteristics of the measure taken in the countries where
the birth rate is recovered, include 1) enhancement of child care services
and child care leave system; 2) promotion to support the balance between
work and family life (Reference) Child care leave system:
France: Parents with more than 3 children are eligible for having childcare leave or having
shorter working hours until their children reach the age of 6.
Sweden: Parents are eligible for full-time childcare leave until children reach the age of 1and
a half years old and part-time childcare leave until children reach the age of 8.
(Reference) Working hour system:
Measures to control longer working hours including overtime work have been implemented
both in France and Sweden.
・ Regarding public social expenditure in Japan, especially, the ratio of
family expense is lower and the ratio of old age expense is higher,
compared with other nations.
・Looking at women’s labor force participation rate by age group, the rate
between 30’s and early 40’s shows a lower rate compared with other
foreign countries. →”M-Shaped Curve”
・Housework and childcare hours of husbands is less compared with other
foreign countries. (Reference) Housework and childcare hours of :
Japan 67 minutes; France 150 minutes; Sweden 201 minutes
・ The ratio of employees with longer hours is higher compared with other
foreign countries. (Reference) Ratio of employees with longer hours (more than 49 hours per week)
Japan 22.7%; France 11.6%;Sweden 7.6%
Tot
al fe
rtili
ty r
ate
Sweden
France
U.K.
U.S.A.
Germany Japan
(up to 2012) Source: Based on “Towns, people, creation of jobs with a long-term vision (reference source),” by the Head Office of “Towns, people, creation of jobs,” Minister’s Secretariat, the Cabinet Office
Source: “Vital Statistics” (Japan), “Eurostat” (U.K.), “Bilan demographics” (France), “Statistisches Bundesamt” (Germany), “Summary of Population Statistics” (Sweden), “National Vital Statistics Report”
(U.S.A.)
years
(from 2013) Source: Based on “2014 Vital Statistics Monthly Report (preliminary data) by the Statistics, and Information Department, Minister’s Secretariat, MHLW
Source: “Vital Statistics” (Japan, the figures for 2013 are final data, the figures for 2014 are preliminary data), “Eurostat, Population and Social Conditions” (U.K., France, Germany, Sweden), “National Vital
Statistics Reports” (U.S.A.)
Germany France Japan U.K. Sweden U.S.A.

13
1st Chapter 5th Section Summary: Review of efforts aimed at overcoming the depopulation issue
It is important to share risk consciousness regarding population decline.
To understand people’s awareness and the current status of the community is important and urgent. It is also important to find
effective countermeasures along with understanding and analyzing concretely the background regarding population decline.
With all power, the government endeavor to realize a wish list of the young people’s marriage, childbirth and child care. By steady continuation and
enhancement of the approach which lead to realization of feelings of achievement of their hopes, it is important to make further achievement in the hopes
and the ideals.
It is important to deal with further approaches aiming at non-marriage and late marriage.
It is important that various measures, being operated simultaneously with measures to prevent the birthrate from declining, including efforts for dealing
with overcoming depopulation and revitalizing local economies and measures for a lower birth rate, contribute to changing the depopulation trend.
It is required to promote measures from the viewpoint to maintain a foundation where people can live with no worry regardless of a certain level of
population decrease and aging of society caused.
These measures include keeping an environment where people can live with no worry of their social security etc. in the wake of a certain degree of
depopulation and as a result of the graying society due to depopulation.
[Regarding a brake on population decline)
To secure steady employment for young people. To create more employment in local areas by revitalizing local economies. To stop outflow of human resources from
local areas. To put a brake on inflow of human resources into Tokyo only.
To deal with elimination of wait-listed children for nursery schools. To enhance counseling centers and support with easy access, regarding pregnancy, child birth and
child rearing in nearby local communities.
To review working style including the remedy of long working hours as well as promoting companies’ measures to support the balance between work and family life.
[Regarding maintaining a foundation necessary for people’s daily life as a result of depopulation and aging associated with it]
In order for people to sustain their live in the familiar surroundings or in their home, it is necessary to promote the approach to support local community by
various entities as well as secure a foundation for services to support people’s daily life.
Considering the facts that it will be increasingly difficult to secure human resources and offer support services in many regions, integrated various welfare
services should be offered as much as possible. To consider a welfare services system which can immediately cope with changes of welfare needs, as well as deal with nurturing comprehensive welfare human
resources.
Direction of concrete measures to overcome population decline
Basic attitude to overcome population decline

2nd Chapter Measures for Overcoming Population Decline
Prologue Overview picture of how the nation has been dealing with the depopulation issue
• The government established the “Headquarters for Regional Empowerment for Japan’s Growth” towards overcoming population decline and revitalizing
local economies in Japan, along with “the long-term vision” and “comprehensive strategy.”
• The Ministry of Health, Labour and Welfare also established the promotion headquarters and made a policy to support the policy as well as promoting
each measure relating to this policy.
September, 2014 to the present: Establishment of the “Headquarters for Regional Empowerment for Japan’s Growth.” Cabinet decision of “long-term vision” and
“comprehensive strategy”
March, 2015: The Cabinet decision of new “Outline of Measures against the Declining Birthrate”
April, 2015: Enforcement of “ Comprehensive Support System for Children and Child-rearing”
The whole government’s efforts
14
How the Ministry of Health, Labour and
Welfare has been dealing with the issue:
October, 2014 to the present:
Establishment of the “Promotion Headquarters for
Regional Empowerment for Japan’s Growth” → The support plan for “revitalizing communities,
people and jobs “ was made:
①Employment system and measures
②Measures for declining birth rate
③Establishment of basis for medical, elderly care,
welfare services
The efforts regarding the above will be shown.
Provision of support plan for “Comprehensive Strategy for Towns, People, Job Creation”
Policies for an employment system
and measures
Policies for birthrate decline
measures
Policies for development of medical,
family care and welfare services
Compre-
hensive
Strategy
MHWL’
policies
- Development of projects and implementation system for regional economic employment
- Human resources reflux to local areas, nurturing human resources
- Enforcement of competitiveness for regional industries
- Seamless support for pregnancy, childbirth, child rearing
(establishment of “Comprehensive Support Center for
Families with Children”)
- Enhancement of child and child rearing support etc.
- Creation of “small-scale base” (base for multi-generation
and multi-functioning) for mountainous areas
- Securing safe living in big cities etc.
Provision of attractive working style different from
that of a big city which cannot be found in a big
city, and, merits of living in regional area, as well
as creation of regional-based disposable income
model case
Selection of an industry which has
competitiveness and comparative superiority
specific to a regional area
Creation of matching support for securing
personnel which regional areas and companies
need, support for developing human resources’
capabilities and for attractive workplace, etc.
Dealing with each issue according to the situation of first child, second child and third child, and providing analyses and measures to solve these issues
Implementation of “clear” environment for supporting child rearing with progressive measures
Analysis of trends in live births and total fertility rates by birth order, by region, and the comparison of other areas
Dealing with rationalization and effectiveness for facilities and human resources
Further participation in enterprises etc. to promote dealing with birthrate decline
Analysis and dissemination of advanced efforts
Revision of multiple welfare services, and
establishment of a working group in MHWL, dealing
with measures to integrate and collaborate
professions, which will become future and potential
leaders for the services
Utilization of health-conscious social capital and
community development
Movement support measures to regional areas as
part of community support programs
Utilization of promotion agencies for regional
medical cooperation, regional medical care
comprehensive funds and Health Care REIT, etc.
Implementation of consultation when municipalities plan “Local Version Comprehensive Strategies” Appointment and utilization of a concierge for revitalizing local economies Establishment of a working group in MHWL, dealing with further consideration of multiple welfare services etc.

2nd Chapter 1st Section
Fulfill the Hopes of the Young Generation for Child-rearing
• Develop comprehensive and systematic employment measures for youths.
• Promote a shift from non-regular workers to full-time workers.
• Deal with comprehensive new employment issues as a result of population decline in
local areas → to promoting “revitalizing local economies.”
①Securing employment
15
• Creation of common benefits and community-based day-
care benefits across certified child care centers,
kindergartens, and day-care centers.
• Promotion of Acceleration Plan for Reducing Wait-listed
Children and plan for securing child nursing staff.
• Development of community-based child and childcare
support projects.
• Promote efforts for business owners in accordance
with the Act on Advancement of Measures to Support
Raising Next-Generation Children.
• Promote efforts for enterprises along with subsidies
related to work-life balance support.
• Raise business owners’ awareness by
means of offering awards etc.
• Seamless support for pregnancy, childbirth and child-rearing (develop
comprehensive support centers for families with children).
• Support for married couples suffering from infertility
• Medical health check ups for pregnant women
②Supporting pregnancy and child-rearing
③Enhancing support for child-rearing
④Reviewing working style
• To support generations with child raising as well as the young generation, the Ministry of Health, Labor and Welfare has been dealing with efforts such as
① securing employment, ② supporting pregnancy and child-rearing, ③ enhancing support for child-rearing and 4) reviewing working style.
待機児童解消加速化プラン
① 賃貸方式や国有地も活用した保育所整備(「ハコ」)
②
小規模保育事業などの運営費支援等
認可を目指す認可外保育施設への支援
③
保育を支える保育士の確保(「ヒト」)
④
取組自治体
支援パッケージ ~5本の柱~
⑤ 事業所内保育施設への支援
◇ 平成25・26年度の2か年の保育拡大量は約19.1万人となり、緊急集中取組期間の整備目標(約20万人)はほぼ達成する見込み。 ※保育の受け皿の増加分のみを積み上げた場合の保育拡大量は約20.1万人
◇ 平成27年度からの3か年(取組加速期間)で、約21万人分の保育の受け皿を確保することで、潜在的な保育ニーズを含め、約40万人分の保育の受け皿を新たに確保し、平成29年度末までに待機児童の解消を目指す。 ※引き続き、各自治体における待機児童対策の進展等に応じてフォローアップを継続していく。
緊急集中取組期間
2013(H25)年度 2015(H27)年度 2017(H29)年度 2019(H31)年度
新制度スタート
2年間前倒し緊急プロジェクト
新制度等による取組
取組加速期間
市町村子ども・子育て支援事業計画の期間(2015~2019年度)
40万人21万人
消費税財源の充当待機児童解消を
目指す
※ 「保育緊急確保事業」の活用など
Acceleration Plan for Reducing Wait-listed Children
The expanded capacity of number of children that could be accepted at nursery schools in FY2013 and FY2014 was approximately
191,000. Developing objectives for urgent intensive efforts period (approximately 200,000) are almost expected to reach the target. *If the increased number of capacity for childcare is added, the maximum expanded number is about 201,000.
By securing capacity of 210,000 children, in three years from 2015(period for accelerated efforts), about 400,000 capacity number is
secured including potential needs for childcare. We are expecting to achieve the goal of zero-waiting list for nursery school by the
end of 2017. *Further follow-ups will be implemented according to developments each municipality makes for measures for the wait-listed children.
FY2013 FY2015 FY2017 FY2019
400,000 people 210,000 people
Urgent intensive effort period Accelerated effort period
Urgent projects *Utilization of “urgent day-care services security projects” etc.
Implementation of new system etc. 2 years ahead of schedule
Appropriation of consumption tax revenue A new system start Aimed at the zero
wait-listed children
Period of child and child rearing support project in municipalities (FY2015 to FY2019)
Support packages -Five pillars-
Implementing
municipalities
Support for childcare facilities in companies
Establishment of nursery schools by utilizing rental schemes and government owned land
(hako )
Securing nursery staff who support childcare (hito)
Management expense support for small-scale childcare services
Support for unauthorized nursery schools which aim at being authorized in the future
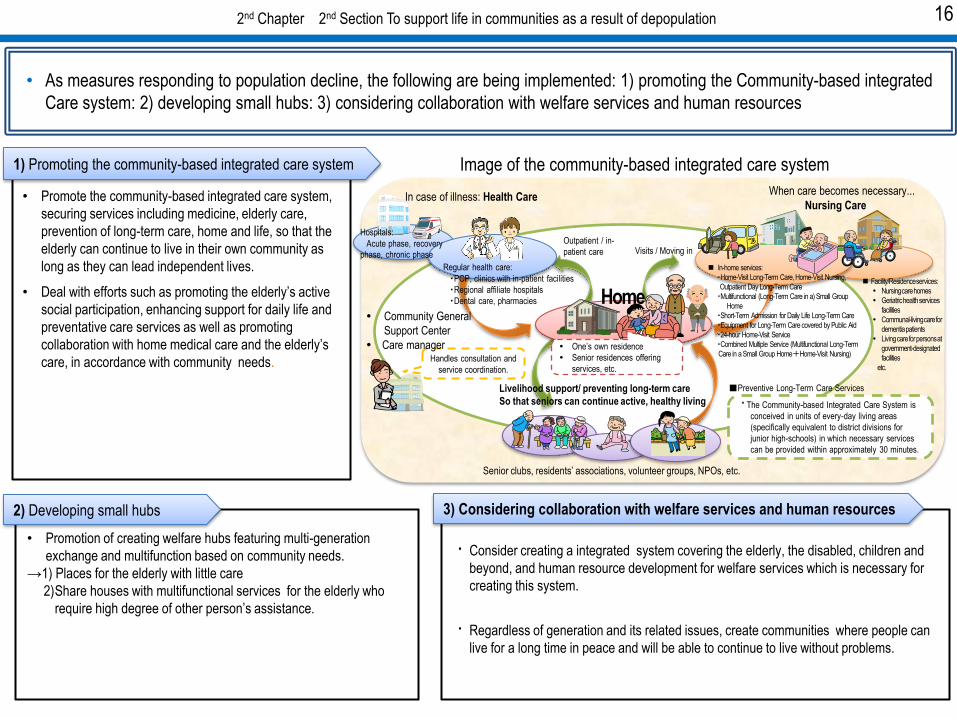
2nd Chapter 2nd Section To support life in communities as a result of depopulation
・Consider creating a integrated system covering the elderly, the disabled, children and
beyond, and human resource development for welfare services which is necessary for
creating this system.
・Regardless of generation and its related issues, create communities where people can
live for a long time in peace and will be able to continue to live without problems.
3) Considering collaboration with welfare services and human resources
16
• Promote the community-based integrated care system,
securing services including medicine, elderly care,
prevention of long-term care, home and life, so that the
elderly can continue to live in their own community as
long as they can lead independent lives.
• Deal with efforts such as promoting the elderly’s active
social participation, enhancing support for daily life and
preventative care services as well as promoting
collaboration with home medical care and the elderly’s
care, in accordance with community needs.
• Promotion of creating welfare hubs featuring multi-generation
exchange and multifunction based on community needs.
→1) Places for the elderly with little care
2) Share houses with multifunctional services for the elderly who
require high degree of other person’s assistance.
1) Promoting the community-based integrated care system
2) Developing small hubs
• As measures responding to population decline, the following are being implemented: 1) promoting the Community-based integrated
Care system: 2) developing small hubs: 3) considering collaboration with welfare services and human resources
Image of the community-based integrated care system
Home
* The Community-based Integrated Care System is
conceived in units of every-day living areas
(specifically equivalent to district divisions for
junior high-schools) in which necessary services
can be provided within approximately 30 minutes.
In-home services:
・Home-Visit Long-Term Care, Home-Visit Nursing,
Outpatient Day Long-Term Care
・Multifunctional (Long-Term Care in a) Small Group
Home
・Short-Term Admission for Daily Life Long-Term Care
・Equipment for Long-Term Care covered by Public Aid
・24-hour Home-Visit Service
・Combined Multiple Service (Multifunctional Long-Term
Care in a Small Group Home+Home-Visit Nursing) One’s own residence
Senior residences offering
services, etc. Handles consultation and
service coordination.
Regular health care:
・PCP, clinics with in-patient facilities
・Regional affiliate hospitals
・Dental care, pharmacies
Senior clubs, residents’ associations, volunteer groups, NPOs, etc.
Community General
Support Center
Care manager
Outpatient / in-
patient care Visits / Moving in
Hospitals:
Acute phase, recovery
phase, chronic phase
In case of illness: Health Care When care becomes necessary...
Nursing Care
■Preventive Long-Term Care Services Livelihood support/ preventing long-term care
So that seniors can continue active, healthy living
Facility/Residence services:
Nursing care homes
Geriatric health services
facilities
Communal-living care for
dementia patients
Living care for persons at
government-designated
facilities
etc.