2016 assessment ratios - illinois · 2018-07-03 · coeffcient of number price-related coefficient...
TRANSCRIPT
Coeffcient of Number Price-related Coefficient of
Geographic Adjusted Dispersion of Ratio Differential Concentration
Area Median Median (COD) Sales 1st 3rd Range (PRD) (COC)
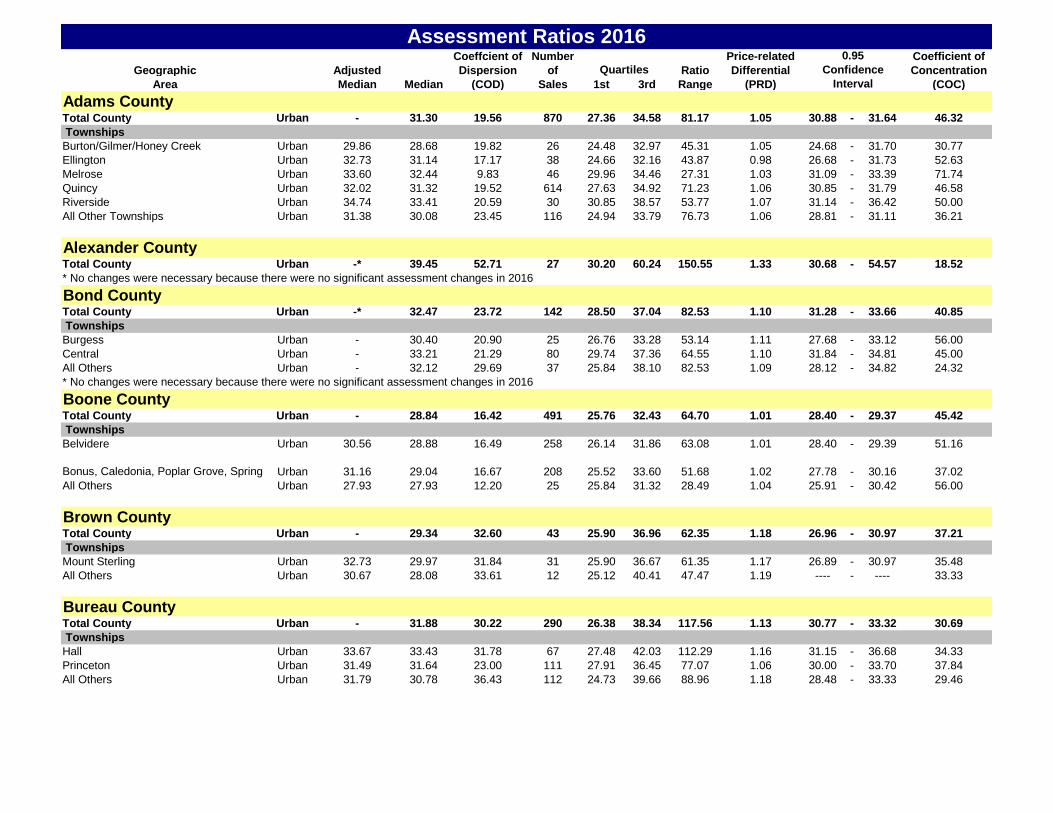
Adams CountyTotal County Urban - 31.30 19.56 870 27.36 34.58 81.17 1.05 30.88 - 31.64 46.32
Townships
Burton/Gilmer/Honey Creek Urban 29.86 28.68 19.82 26 24.48 32.97 45.31 1.05 24.68 - 31.70 30.77
Ellington Urban 32.73 31.14 17.17 38 24.66 32.16 43.87 0.98 26.68 - 31.73 52.63
Melrose Urban 33.60 32.44 9.83 46 29.96 34.46 27.31 1.03 31.09 - 33.39 71.74
Quincy Urban 32.02 31.32 19.52 614 27.63 34.92 71.23 1.06 30.85 - 31.79 46.58
Riverside Urban 34.74 33.41 20.59 30 30.85 38.57 53.77 1.07 31.14 - 36.42 50.00
All Other Townships Urban 31.38 30.08 23.45 116 24.94 33.79 76.73 1.06 28.81 - 31.11 36.21
Alexander CountyTotal County Urban -* 39.45 52.71 27 30.20 60.24 150.55 1.33 30.68 - 54.57 18.52
* No changes were necessary because there were no significant assessment changes in 2016
Bond CountyTotal County Urban -* 32.47 23.72 142 28.50 37.04 82.53 1.10 31.28 - 33.66 40.85
Townships
Burgess Urban - 30.40 20.90 25 26.76 33.28 53.14 1.11 27.68 - 33.12 56.00
Central Urban - 33.21 21.29 80 29.74 37.36 64.55 1.10 31.84 - 34.81 45.00
All Others Urban - 32.12 29.69 37 25.84 38.10 82.53 1.09 28.12 - 34.82 24.32
* No changes were necessary because there were no significant assessment changes in 2016
Boone CountyTotal County Urban - 28.84 16.42 491 25.76 32.43 64.70 1.01 28.40 - 29.37 45.42
Townships
Belvidere Urban 30.56 28.88 16.49 258 26.14 31.86 63.08 1.01 28.40 - 29.39 51.16
Bonus, Caledonia, Poplar Grove, Spring Urban 31.16 29.04 16.67 208 25.52 33.60 51.68 1.02 27.78 - 30.16 37.02
All Others Urban 27.93 27.93 12.20 25 25.84 31.32 28.49 1.04 25.91 - 30.42 56.00
Brown CountyTotal County Urban - 29.34 32.60 43 25.90 36.96 62.35 1.18 26.96 - 30.97 37.21
Townships
Mount Sterling Urban 32.73 29.97 31.84 31 25.90 36.67 61.35 1.17 26.89 - 30.97 35.48
All Others Urban 30.67 28.08 33.61 12 25.12 40.41 47.47 1.19 ---- - ---- 33.33
Bureau CountyTotal County Urban - 31.88 30.22 290 26.38 38.34 117.56 1.13 30.77 - 33.32 30.69
Townships
Hall Urban 33.67 33.43 31.78 67 27.48 42.03 112.29 1.16 31.15 - 36.68 34.33
Princeton Urban 31.49 31.64 23.00 111 27.91 36.45 77.07 1.06 30.00 - 33.70 37.84
All Others Urban 31.79 30.78 36.43 112 24.73 39.66 88.96 1.18 28.48 - 33.33 29.46
Assessment Ratios 2016
Quartiles
0.95
Confidence
Interval
Coeffcient of Number Price-related Coefficient of
Geographic Adjusted Dispersion of Ratio Differential Concentration
Area Median Median (COD) Sales 1st 3rd Range (PRD) (COC)
Assessment Ratios 2016
Quartiles
0.95
Confidence
Interval
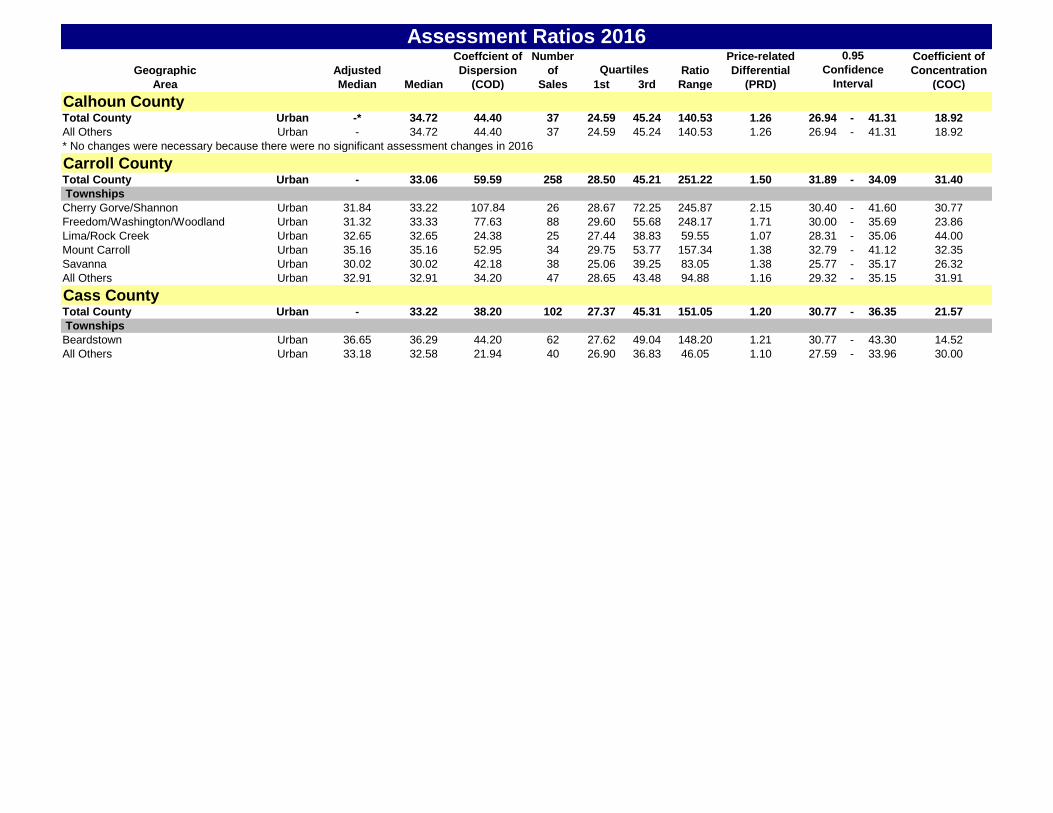
Calhoun CountyTotal County Urban -* 34.72 44.40 37 24.59 45.24 140.53 1.26 26.94 - 41.31 18.92
All Others Urban - 34.72 44.40 37 24.59 45.24 140.53 1.26 26.94 - 41.31 18.92
* No changes were necessary because there were no significant assessment changes in 2016
Carroll CountyTotal County Urban - 33.06 59.59 258 28.50 45.21 251.22 1.50 31.89 - 34.09 31.40
Townships
Cherry Gorve/Shannon Urban 31.84 33.22 107.84 26 28.67 72.25 245.87 2.15 30.40 - 41.60 30.77
Freedom/Washington/Woodland Urban 31.32 33.33 77.63 88 29.60 55.68 248.17 1.71 30.00 - 35.69 23.86
Lima/Rock Creek Urban 32.65 32.65 24.38 25 27.44 38.83 59.55 1.07 28.31 - 35.06 44.00
Mount Carroll Urban 35.16 35.16 52.95 34 29.75 53.77 157.34 1.38 32.79 - 41.12 32.35
Savanna Urban 30.02 30.02 42.18 38 25.06 39.25 83.05 1.38 25.77 - 35.17 26.32
All Others Urban 32.91 32.91 34.20 47 28.65 43.48 94.88 1.16 29.32 - 35.15 31.91
Cass CountyTotal County Urban - 33.22 38.20 102 27.37 45.31 151.05 1.20 30.77 - 36.35 21.57
Townships
Beardstown Urban 36.65 36.29 44.20 62 27.62 49.04 148.20 1.21 30.77 - 43.30 14.52
All Others Urban 33.18 32.58 21.94 40 26.90 36.83 46.05 1.10 27.59 - 33.96 30.00
Coeffcient of Number Price-related Coefficient of
Geographic Adjusted Dispersion of Ratio Differential Concentration
Area Median Median (COD) Sales 1st 3rd Range (PRD) (COC)
Assessment Ratios 2016
Quartiles
0.95
Confidence
Interval
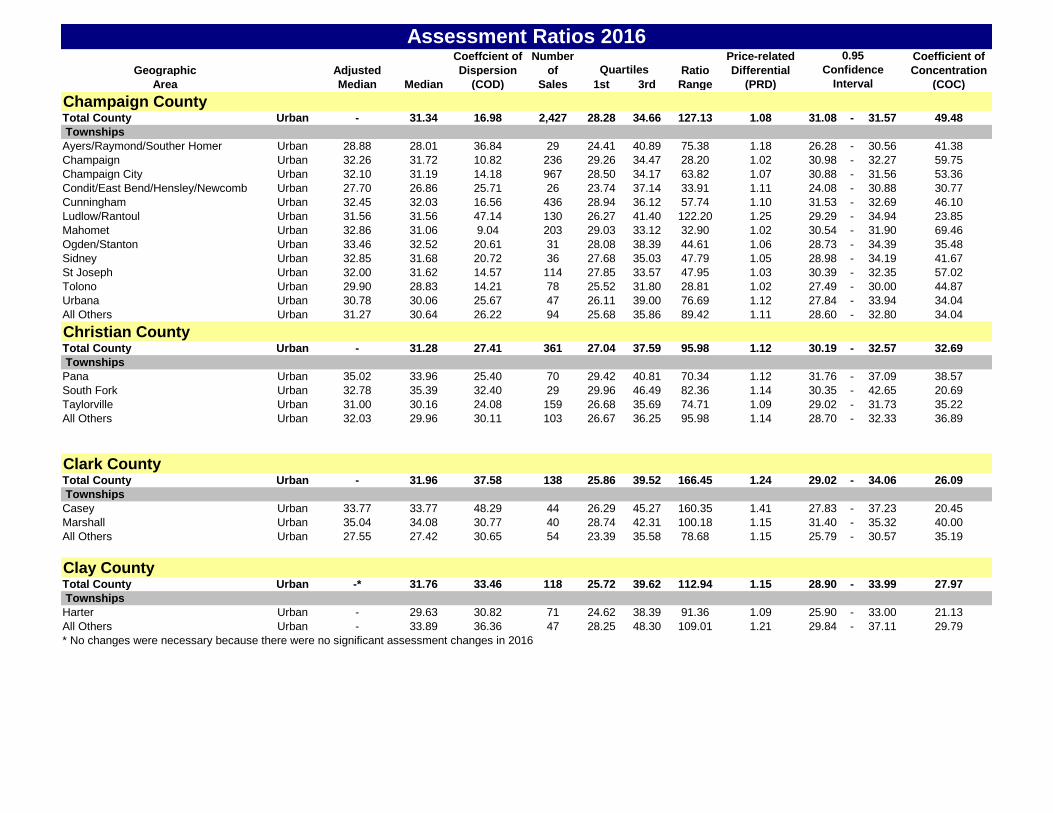
Champaign CountyTotal County Urban - 31.34 16.98 2,427 28.28 34.66 127.13 1.08 31.08 - 31.57 49.48
Townships
Ayers/Raymond/Souther Homer Urban 28.88 28.01 36.84 29 24.41 40.89 75.38 1.18 26.28 - 30.56 41.38
Champaign Urban 32.26 31.72 10.82 236 29.26 34.47 28.20 1.02 30.98 - 32.27 59.75
Champaign City Urban 32.10 31.19 14.18 967 28.50 34.17 63.82 1.07 30.88 - 31.56 53.36
Condit/East Bend/Hensley/Newcomb Urban 27.70 26.86 25.71 26 23.74 37.14 33.91 1.11 24.08 - 30.88 30.77
Cunningham Urban 32.45 32.03 16.56 436 28.94 36.12 57.74 1.10 31.53 - 32.69 46.10
Ludlow/Rantoul Urban 31.56 31.56 47.14 130 26.27 41.40 122.20 1.25 29.29 - 34.94 23.85
Mahomet Urban 32.86 31.06 9.04 203 29.03 33.12 32.90 1.02 30.54 - 31.90 69.46
Ogden/Stanton Urban 33.46 32.52 20.61 31 28.08 38.39 44.61 1.06 28.73 - 34.39 35.48
Sidney Urban 32.85 31.68 20.72 36 27.68 35.03 47.79 1.05 28.98 - 34.19 41.67
St Joseph Urban 32.00 31.62 14.57 114 27.85 33.57 47.95 1.03 30.39 - 32.35 57.02
Tolono Urban 29.90 28.83 14.21 78 25.52 31.80 28.81 1.02 27.49 - 30.00 44.87
Urbana Urban 30.78 30.06 25.67 47 26.11 39.00 76.69 1.12 27.84 - 33.94 34.04
All Others Urban 31.27 30.64 26.22 94 25.68 35.86 89.42 1.11 28.60 - 32.80 34.04
Christian CountyTotal County Urban - 31.28 27.41 361 27.04 37.59 95.98 1.12 30.19 - 32.57 32.69
Townships
Pana Urban 35.02 33.96 25.40 70 29.42 40.81 70.34 1.12 31.76 - 37.09 38.57
South Fork Urban 32.78 35.39 32.40 29 29.96 46.49 82.36 1.14 30.35 - 42.65 20.69
Taylorville Urban 31.00 30.16 24.08 159 26.68 35.69 74.71 1.09 29.02 - 31.73 35.22
All Others Urban 32.03 29.96 30.11 103 26.67 36.25 95.98 1.14 28.70 - 32.33 36.89
Clark CountyTotal County Urban - 31.96 37.58 138 25.86 39.52 166.45 1.24 29.02 - 34.06 26.09
Townships
Casey Urban 33.77 33.77 48.29 44 26.29 45.27 160.35 1.41 27.83 - 37.23 20.45
Marshall Urban 35.04 34.08 30.77 40 28.74 42.31 100.18 1.15 31.40 - 35.32 40.00
All Others Urban 27.55 27.42 30.65 54 23.39 35.58 78.68 1.15 25.79 - 30.57 35.19
Clay CountyTotal County Urban -* 31.76 33.46 118 25.72 39.62 112.94 1.15 28.90 - 33.99 27.97
Townships
Harter Urban - 29.63 30.82 71 24.62 38.39 91.36 1.09 25.90 - 33.00 21.13
All Others Urban - 33.89 36.36 47 28.25 48.30 109.01 1.21 29.84 - 37.11 29.79
* No changes were necessary because there were no significant assessment changes in 2016
Coeffcient of Number Price-related Coefficient of
Geographic Adjusted Dispersion of Ratio Differential Concentration
Area Median Median (COD) Sales 1st 3rd Range (PRD) (COC)
Assessment Ratios 2016
Quartiles
0.95
Confidence
Interval
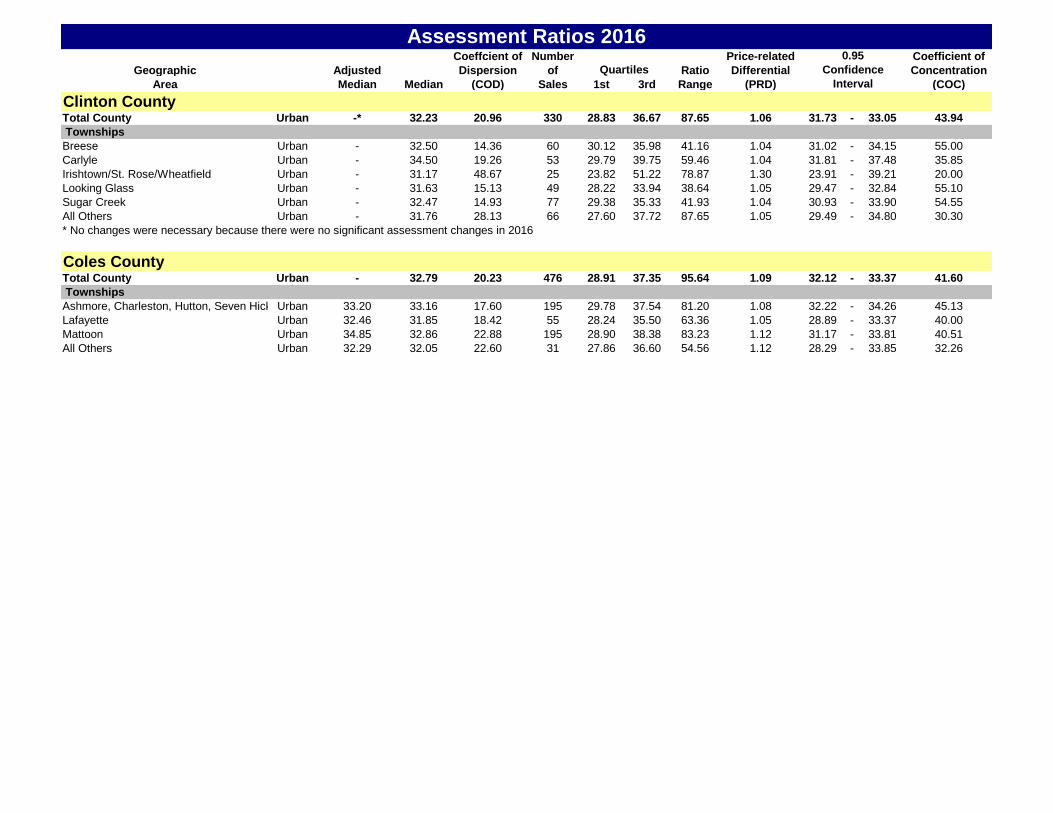
Clinton CountyTotal County Urban -* 32.23 20.96 330 28.83 36.67 87.65 1.06 31.73 - 33.05 43.94
Townships
Breese Urban - 32.50 14.36 60 30.12 35.98 41.16 1.04 31.02 - 34.15 55.00
Carlyle Urban - 34.50 19.26 53 29.79 39.75 59.46 1.04 31.81 - 37.48 35.85
Irishtown/St. Rose/Wheatfield Urban - 31.17 48.67 25 23.82 51.22 78.87 1.30 23.91 - 39.21 20.00
Looking Glass Urban - 31.63 15.13 49 28.22 33.94 38.64 1.05 29.47 - 32.84 55.10
Sugar Creek Urban - 32.47 14.93 77 29.38 35.33 41.93 1.04 30.93 - 33.90 54.55
All Others Urban - 31.76 28.13 66 27.60 37.72 87.65 1.05 29.49 - 34.80 30.30
* No changes were necessary because there were no significant assessment changes in 2016
Coles CountyTotal County Urban - 32.79 20.23 476 28.91 37.35 95.64 1.09 32.12 - 33.37 41.60
Townships
Ashmore, Charleston, Hutton, Seven HickoryUrban 33.20 33.16 17.60 195 29.78 37.54 81.20 1.08 32.22 - 34.26 45.13
Lafayette Urban 32.46 31.85 18.42 55 28.24 35.50 63.36 1.05 28.89 - 33.37 40.00
Mattoon Urban 34.85 32.86 22.88 195 28.90 38.38 83.23 1.12 31.17 - 33.81 40.51
All Others Urban 32.29 32.05 22.60 31 27.86 36.60 54.56 1.12 28.29 - 33.85 32.26
Coeffcient of Number Price-related Coefficient of
Geographic Adjusted Dispersion of Ratio Differential Concentration
Area Median Median (COD) Sales 1st 3rd Range (PRD) (COC)
Assessment Ratios 2016
Quartiles
0.95
Confidence
Interval
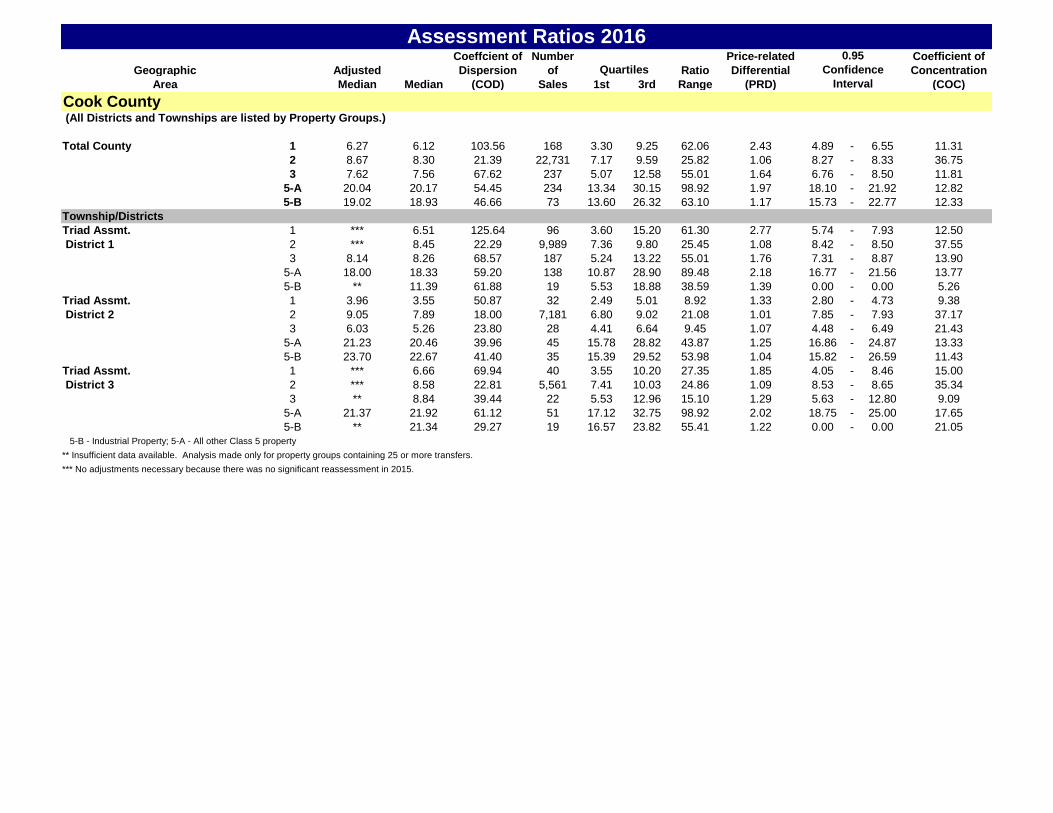
Cook County (All Districts and Townships are listed by Property Groups.)
Total County 1 6.27 6.12 103.56 168 3.30 9.25 62.06 2.43 4.89 - 6.55 11.31
2 8.67 8.30 21.39 22,731 7.17 9.59 25.82 1.06 8.27 - 8.33 36.75
3 7.62 7.56 67.62 237 5.07 12.58 55.01 1.64 6.76 - 8.50 11.81
5-A 20.04 20.17 54.45 234 13.34 30.15 98.92 1.97 18.10 - 21.92 12.82
5-B 19.02 18.93 46.66 73 13.60 26.32 63.10 1.17 15.73 - 22.77 12.33
Township/Districts
Triad Assmt. 1 *** 6.51 125.64 96 3.60 15.20 61.30 2.77 5.74 - 7.93 12.50
District 1 2 *** 8.45 22.29 9,989 7.36 9.80 25.45 1.08 8.42 - 8.50 37.55
3 8.14 8.26 68.57 187 5.24 13.22 55.01 1.76 7.31 - 8.87 13.90
5-A 18.00 18.33 59.20 138 10.87 28.90 89.48 2.18 16.77 - 21.56 13.77
5-B ** 11.39 61.88 19 5.53 18.88 38.59 1.39 0.00 - 0.00 5.26
Triad Assmt. 1 3.96 3.55 50.87 32 2.49 5.01 8.92 1.33 2.80 - 4.73 9.38
District 2 2 9.05 7.89 18.00 7,181 6.80 9.02 21.08 1.01 7.85 - 7.93 37.17
3 6.03 5.26 23.80 28 4.41 6.64 9.45 1.07 4.48 - 6.49 21.43
5-A 21.23 20.46 39.96 45 15.78 28.82 43.87 1.25 16.86 - 24.87 13.33
5-B 23.70 22.67 41.40 35 15.39 29.52 53.98 1.04 15.82 - 26.59 11.43
Triad Assmt. 1 *** 6.66 69.94 40 3.55 10.20 27.35 1.85 4.05 - 8.46 15.00
District 3 2 *** 8.58 22.81 5,561 7.41 10.03 24.86 1.09 8.53 - 8.65 35.34
3 ** 8.84 39.44 22 5.53 12.96 15.10 1.29 5.63 - 12.80 9.09
5-A 21.37 21.92 61.12 51 17.12 32.75 98.92 2.02 18.75 - 25.00 17.65
5-B ** 21.34 29.27 19 16.57 23.82 55.41 1.22 0.00 - 0.00 21.05
5-B - Industrial Property; 5-A - All other Class 5 property
** Insufficient data available. Analysis made only for property groups containing 25 or more transfers.
*** No adjustments necessary because there was no significant reassessment in 2015.
Coeffcient of Number Price-related Coefficient of
Geographic Adjusted Dispersion of Ratio Differential Concentration
Area Median Median (COD) Sales 1st 3rd Range (PRD) (COC)
Assessment Ratios 2016
Quartiles
0.95
Confidence
Interval
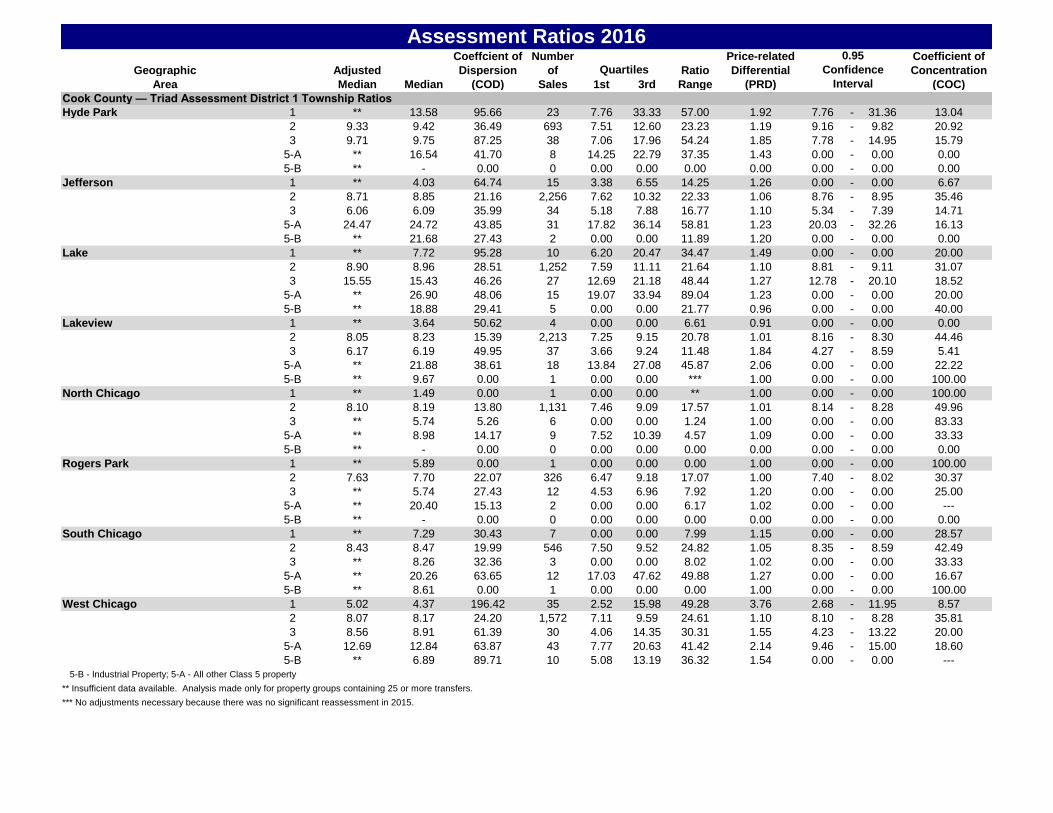
Cook County — Triad Assessment District 1 Township Ratios
Hyde Park 1 ** 13.58 95.66 23 7.76 33.33 57.00 1.92 7.76 - 31.36 13.04
2 9.33 9.42 36.49 693 7.51 12.60 23.23 1.19 9.16 - 9.82 20.92
3 9.71 9.75 87.25 38 7.06 17.96 54.24 1.85 7.78 - 14.95 15.79
5-A ** 16.54 41.70 8 14.25 22.79 37.35 1.43 0.00 - 0.00 0.00
5-B ** - 0.00 0 0.00 0.00 0.00 0.00 0.00 - 0.00 0.00
Jefferson 1 ** 4.03 64.74 15 3.38 6.55 14.25 1.26 0.00 - 0.00 6.67
2 8.71 8.85 21.16 2,256 7.62 10.32 22.33 1.06 8.76 - 8.95 35.46
3 6.06 6.09 35.99 34 5.18 7.88 16.77 1.10 5.34 - 7.39 14.71
5-A 24.47 24.72 43.85 31 17.82 36.14 58.81 1.23 20.03 - 32.26 16.13
5-B ** 21.68 27.43 2 0.00 0.00 11.89 1.20 0.00 - 0.00 0.00
Lake 1 ** 7.72 95.28 10 6.20 20.47 34.47 1.49 0.00 - 0.00 20.00
2 8.90 8.96 28.51 1,252 7.59 11.11 21.64 1.10 8.81 - 9.11 31.07
3 15.55 15.43 46.26 27 12.69 21.18 48.44 1.27 12.78 - 20.10 18.52
5-A ** 26.90 48.06 15 19.07 33.94 89.04 1.23 0.00 - 0.00 20.00
5-B ** 18.88 29.41 5 0.00 0.00 21.77 0.96 0.00 - 0.00 40.00
Lakeview 1 ** 3.64 50.62 4 0.00 0.00 6.61 0.91 0.00 - 0.00 0.00
2 8.05 8.23 15.39 2,213 7.25 9.15 20.78 1.01 8.16 - 8.30 44.46
3 6.17 6.19 49.95 37 3.66 9.24 11.48 1.84 4.27 - 8.59 5.41
5-A ** 21.88 38.61 18 13.84 27.08 45.87 2.06 0.00 - 0.00 22.22
5-B ** 9.67 0.00 1 0.00 0.00 *** 1.00 0.00 - 0.00 100.00
North Chicago 1 ** 1.49 0.00 1 0.00 0.00 ** 1.00 0.00 - 0.00 100.00
2 8.10 8.19 13.80 1,131 7.46 9.09 17.57 1.01 8.14 - 8.28 49.96
3 ** 5.74 5.26 6 0.00 0.00 1.24 1.00 0.00 - 0.00 83.33
5-A ** 8.98 14.17 9 7.52 10.39 4.57 1.09 0.00 - 0.00 33.33
5-B ** - 0.00 0 0.00 0.00 0.00 0.00 0.00 - 0.00 0.00
Rogers Park 1 ** 5.89 0.00 1 0.00 0.00 0.00 1.00 0.00 - 0.00 100.00
2 7.63 7.70 22.07 326 6.47 9.18 17.07 1.00 7.40 - 8.02 30.37
3 ** 5.74 27.43 12 4.53 6.96 7.92 1.20 0.00 - 0.00 25.00
5-A ** 20.40 15.13 2 0.00 0.00 6.17 1.02 0.00 - 0.00 ---
5-B ** - 0.00 0 0.00 0.00 0.00 0.00 0.00 - 0.00 0.00
South Chicago 1 ** 7.29 30.43 7 0.00 0.00 7.99 1.15 0.00 - 0.00 28.57
2 8.43 8.47 19.99 546 7.50 9.52 24.82 1.05 8.35 - 8.59 42.49
3 ** 8.26 32.36 3 0.00 0.00 8.02 1.02 0.00 - 0.00 33.33
5-A ** 20.26 63.65 12 17.03 47.62 49.88 1.27 0.00 - 0.00 16.67
5-B ** 8.61 0.00 1 0.00 0.00 0.00 1.00 0.00 - 0.00 100.00
West Chicago 1 5.02 4.37 196.42 35 2.52 15.98 49.28 3.76 2.68 - 11.95 8.57
2 8.07 8.17 24.20 1,572 7.11 9.59 24.61 1.10 8.10 - 8.28 35.81
3 8.56 8.91 61.39 30 4.06 14.35 30.31 1.55 4.23 - 13.22 20.00
5-A 12.69 12.84 63.87 43 7.77 20.63 41.42 2.14 9.46 - 15.00 18.60
5-B ** 6.89 89.71 10 5.08 13.19 36.32 1.54 0.00 - 0.00 ---
5-B - Industrial Property; 5-A - All other Class 5 property
** Insufficient data available. Analysis made only for property groups containing 25 or more transfers.
*** No adjustments necessary because there was no significant reassessment in 2015.
Coeffcient of Number Price-related Coefficient of
Geographic Adjusted Dispersion of Ratio Differential Concentration
Area Median Median (COD) Sales 1st 3rd Range (PRD) (COC)
Assessment Ratios 2016
Quartiles
0.95
Confidence
Interval
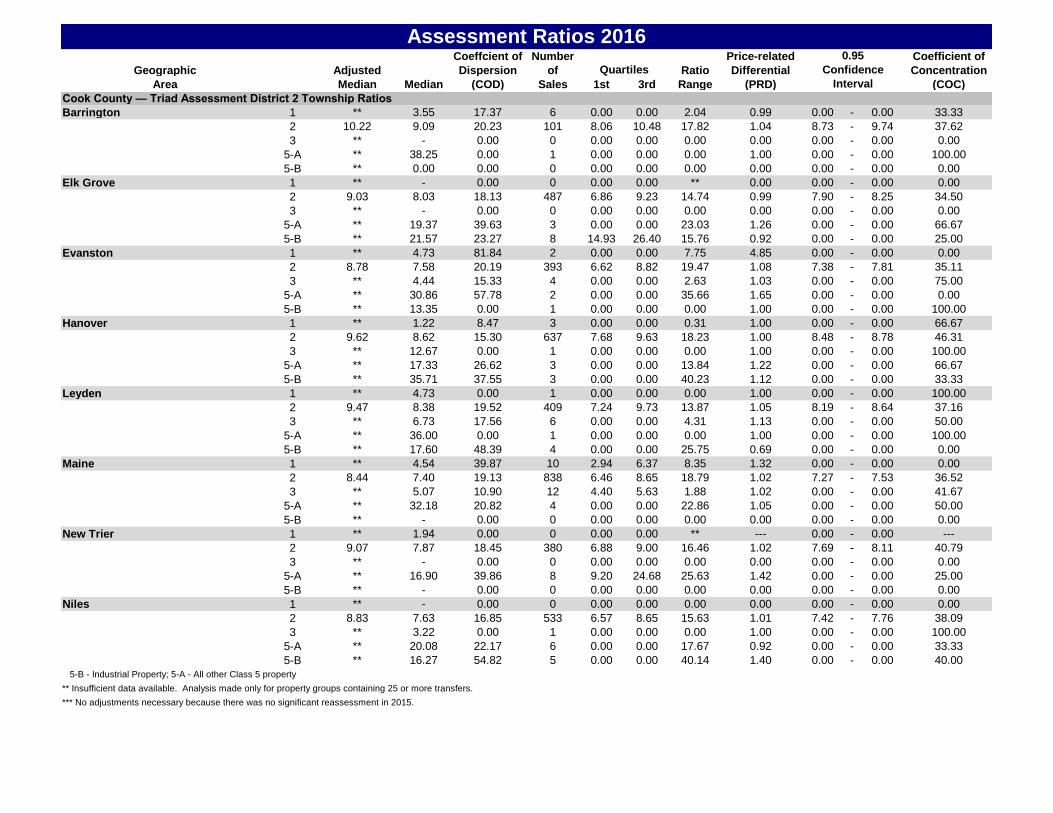
Cook County — Triad Assessment District 2 Township Ratios
Barrington 1 ** 3.55 17.37 6 0.00 0.00 2.04 0.99 0.00 - 0.00 33.33
2 10.22 9.09 20.23 101 8.06 10.48 17.82 1.04 8.73 - 9.74 37.62
3 ** - 0.00 0 0.00 0.00 0.00 0.00 0.00 - 0.00 0.00
5-A ** 38.25 0.00 1 0.00 0.00 0.00 1.00 0.00 - 0.00 100.00
5-B ** 0.00 0.00 0 0.00 0.00 0.00 0.00 0.00 - 0.00 0.00
Elk Grove 1 ** - 0.00 0 0.00 0.00 ** 0.00 0.00 - 0.00 0.00
2 9.03 8.03 18.13 487 6.86 9.23 14.74 0.99 7.90 - 8.25 34.50
3 ** - 0.00 0 0.00 0.00 0.00 0.00 0.00 - 0.00 0.00
5-A ** 19.37 39.63 3 0.00 0.00 23.03 1.26 0.00 - 0.00 66.67
5-B ** 21.57 23.27 8 14.93 26.40 15.76 0.92 0.00 - 0.00 25.00
Evanston 1 ** 4.73 81.84 2 0.00 0.00 7.75 4.85 0.00 - 0.00 0.00
2 8.78 7.58 20.19 393 6.62 8.82 19.47 1.08 7.38 - 7.81 35.11
3 ** 4.44 15.33 4 0.00 0.00 2.63 1.03 0.00 - 0.00 75.00
5-A ** 30.86 57.78 2 0.00 0.00 35.66 1.65 0.00 - 0.00 0.00
5-B ** 13.35 0.00 1 0.00 0.00 0.00 1.00 0.00 - 0.00 100.00
Hanover 1 ** 1.22 8.47 3 0.00 0.00 0.31 1.00 0.00 - 0.00 66.67
2 9.62 8.62 15.30 637 7.68 9.63 18.23 1.00 8.48 - 8.78 46.31
3 ** 12.67 0.00 1 0.00 0.00 0.00 1.00 0.00 - 0.00 100.00
5-A ** 17.33 26.62 3 0.00 0.00 13.84 1.22 0.00 - 0.00 66.67
5-B ** 35.71 37.55 3 0.00 0.00 40.23 1.12 0.00 - 0.00 33.33
Leyden 1 ** 4.73 0.00 1 0.00 0.00 0.00 1.00 0.00 - 0.00 100.00
2 9.47 8.38 19.52 409 7.24 9.73 13.87 1.05 8.19 - 8.64 37.16
3 ** 6.73 17.56 6 0.00 0.00 4.31 1.13 0.00 - 0.00 50.00
5-A ** 36.00 0.00 1 0.00 0.00 0.00 1.00 0.00 - 0.00 100.00
5-B ** 17.60 48.39 4 0.00 0.00 25.75 0.69 0.00 - 0.00 0.00
Maine 1 ** 4.54 39.87 10 2.94 6.37 8.35 1.32 0.00 - 0.00 0.00
2 8.44 7.40 19.13 838 6.46 8.65 18.79 1.02 7.27 - 7.53 36.52
3 ** 5.07 10.90 12 4.40 5.63 1.88 1.02 0.00 - 0.00 41.67
5-A ** 32.18 20.82 4 0.00 0.00 22.86 1.05 0.00 - 0.00 50.00
5-B ** - 0.00 0 0.00 0.00 0.00 0.00 0.00 - 0.00 0.00
New Trier 1 ** 1.94 0.00 0 0.00 0.00 ** --- 0.00 - 0.00 ---
2 9.07 7.87 18.45 380 6.88 9.00 16.46 1.02 7.69 - 8.11 40.79
3 ** - 0.00 0 0.00 0.00 0.00 0.00 0.00 - 0.00 0.00
5-A ** 16.90 39.86 8 9.20 24.68 25.63 1.42 0.00 - 0.00 25.00
5-B ** - 0.00 0 0.00 0.00 0.00 0.00 0.00 - 0.00 0.00
Niles 1 ** - 0.00 0 0.00 0.00 0.00 0.00 0.00 - 0.00 0.00
2 8.83 7.63 16.85 533 6.57 8.65 15.63 1.01 7.42 - 7.76 38.09
3 ** 3.22 0.00 1 0.00 0.00 0.00 1.00 0.00 - 0.00 100.00
5-A ** 20.08 22.17 6 0.00 0.00 17.67 0.92 0.00 - 0.00 33.33
5-B ** 16.27 54.82 5 0.00 0.00 40.14 1.40 0.00 - 0.00 40.00
5-B - Industrial Property; 5-A - All other Class 5 property
** Insufficient data available. Analysis made only for property groups containing 25 or more transfers.
*** No adjustments necessary because there was no significant reassessment in 2015.
Coeffcient of Number Price-related Coefficient of
Geographic Adjusted Dispersion of Ratio Differential Concentration
Area Median Median (COD) Sales 1st 3rd Range (PRD) (COC)
Assessment Ratios 2016
Quartiles
0.95
Confidence
Interval
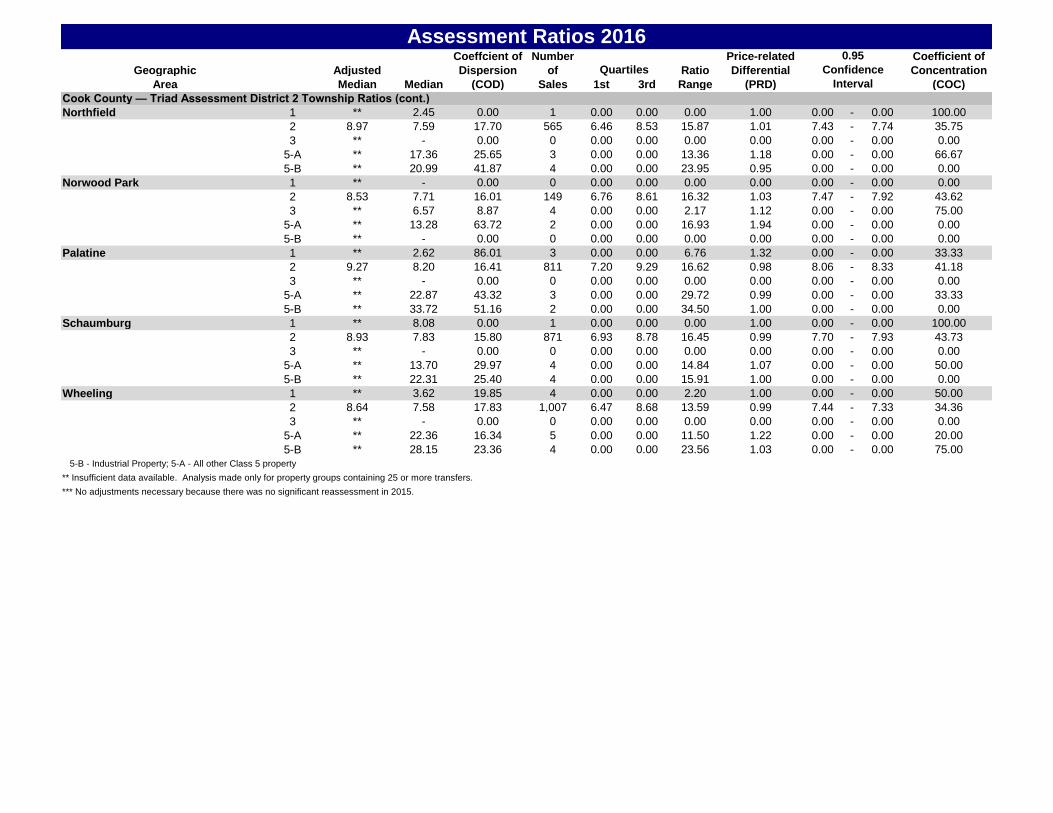
Cook County — Triad Assessment District 2 Township Ratios (cont.)
Northfield 1 ** 2.45 0.00 1 0.00 0.00 0.00 1.00 0.00 - 0.00 100.00
2 8.97 7.59 17.70 565 6.46 8.53 15.87 1.01 7.43 - 7.74 35.75
3 ** - 0.00 0 0.00 0.00 0.00 0.00 0.00 - 0.00 0.00
5-A ** 17.36 25.65 3 0.00 0.00 13.36 1.18 0.00 - 0.00 66.67
5-B ** 20.99 41.87 4 0.00 0.00 23.95 0.95 0.00 - 0.00 0.00
Norwood Park 1 ** - 0.00 0 0.00 0.00 0.00 0.00 0.00 - 0.00 0.00
2 8.53 7.71 16.01 149 6.76 8.61 16.32 1.03 7.47 - 7.92 43.62
3 ** 6.57 8.87 4 0.00 0.00 2.17 1.12 0.00 - 0.00 75.00
5-A ** 13.28 63.72 2 0.00 0.00 16.93 1.94 0.00 - 0.00 0.00
5-B ** - 0.00 0 0.00 0.00 0.00 0.00 0.00 - 0.00 0.00
Palatine 1 ** 2.62 86.01 3 0.00 0.00 6.76 1.32 0.00 - 0.00 33.33
2 9.27 8.20 16.41 811 7.20 9.29 16.62 0.98 8.06 - 8.33 41.18
3 ** - 0.00 0 0.00 0.00 0.00 0.00 0.00 - 0.00 0.00
5-A ** 22.87 43.32 3 0.00 0.00 29.72 0.99 0.00 - 0.00 33.33
5-B ** 33.72 51.16 2 0.00 0.00 34.50 1.00 0.00 - 0.00 0.00
Schaumburg 1 ** 8.08 0.00 1 0.00 0.00 0.00 1.00 0.00 - 0.00 100.00
2 8.93 7.83 15.80 871 6.93 8.78 16.45 0.99 7.70 - 7.93 43.73
3 ** - 0.00 0 0.00 0.00 0.00 0.00 0.00 - 0.00 0.00
5-A ** 13.70 29.97 4 0.00 0.00 14.84 1.07 0.00 - 0.00 50.00
5-B ** 22.31 25.40 4 0.00 0.00 15.91 1.00 0.00 - 0.00 0.00
Wheeling 1 ** 3.62 19.85 4 0.00 0.00 2.20 1.00 0.00 - 0.00 50.00
2 8.64 7.58 17.83 1,007 6.47 8.68 13.59 0.99 7.44 - 7.33 34.36
3 ** - 0.00 0 0.00 0.00 0.00 0.00 0.00 - 0.00 0.00
5-A ** 22.36 16.34 5 0.00 0.00 11.50 1.22 0.00 - 0.00 20.00
5-B ** 28.15 23.36 4 0.00 0.00 23.56 1.03 0.00 - 0.00 75.00
5-B - Industrial Property; 5-A - All other Class 5 property
** Insufficient data available. Analysis made only for property groups containing 25 or more transfers.
*** No adjustments necessary because there was no significant reassessment in 2015.
Coeffcient of Number Price-related Coefficient of
Geographic Adjusted Dispersion of Ratio Differential Concentration
Area Median Median (COD) Sales 1st 3rd Range (PRD) (COC)
Assessment Ratios 2016
Quartiles
0.95
Confidence
Interval
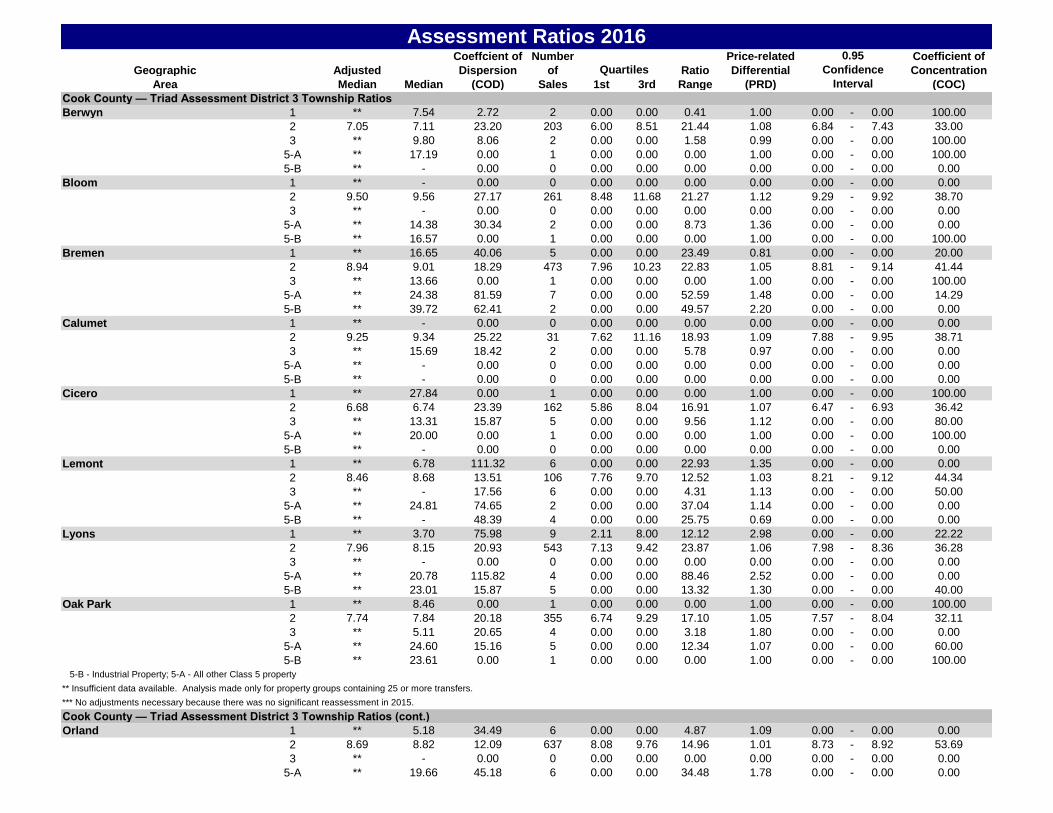
Cook County — Triad Assessment District 3 Township Ratios
Berwyn 1 ** 7.54 2.72 2 0.00 0.00 0.41 1.00 0.00 - 0.00 100.00
2 7.05 7.11 23.20 203 6.00 8.51 21.44 1.08 6.84 - 7.43 33.00
3 ** 9.80 8.06 2 0.00 0.00 1.58 0.99 0.00 - 0.00 100.00
5-A ** 17.19 0.00 1 0.00 0.00 0.00 1.00 0.00 - 0.00 100.00
5-B ** - 0.00 0 0.00 0.00 0.00 0.00 0.00 - 0.00 0.00
Bloom 1 ** - 0.00 0 0.00 0.00 0.00 0.00 0.00 - 0.00 0.00
2 9.50 9.56 27.17 261 8.48 11.68 21.27 1.12 9.29 - 9.92 38.70
3 ** - 0.00 0 0.00 0.00 0.00 0.00 0.00 - 0.00 0.00
5-A ** 14.38 30.34 2 0.00 0.00 8.73 1.36 0.00 - 0.00 0.00
5-B ** 16.57 0.00 1 0.00 0.00 0.00 1.00 0.00 - 0.00 100.00
Bremen 1 ** 16.65 40.06 5 0.00 0.00 23.49 0.81 0.00 - 0.00 20.00
2 8.94 9.01 18.29 473 7.96 10.23 22.83 1.05 8.81 - 9.14 41.44
3 ** 13.66 0.00 1 0.00 0.00 0.00 1.00 0.00 - 0.00 100.00
5-A ** 24.38 81.59 7 0.00 0.00 52.59 1.48 0.00 - 0.00 14.29
5-B ** 39.72 62.41 2 0.00 0.00 49.57 2.20 0.00 - 0.00 0.00
Calumet 1 ** - 0.00 0 0.00 0.00 0.00 0.00 0.00 - 0.00 0.00
2 9.25 9.34 25.22 31 7.62 11.16 18.93 1.09 7.88 - 9.95 38.71
3 ** 15.69 18.42 2 0.00 0.00 5.78 0.97 0.00 - 0.00 0.00
5-A ** - 0.00 0 0.00 0.00 0.00 0.00 0.00 - 0.00 0.00
5-B ** - 0.00 0 0.00 0.00 0.00 0.00 0.00 - 0.00 0.00
Cicero 1 ** 27.84 0.00 1 0.00 0.00 0.00 1.00 0.00 - 0.00 100.00
2 6.68 6.74 23.39 162 5.86 8.04 16.91 1.07 6.47 - 6.93 36.42
3 ** 13.31 15.87 5 0.00 0.00 9.56 1.12 0.00 - 0.00 80.00
5-A ** 20.00 0.00 1 0.00 0.00 0.00 1.00 0.00 - 0.00 100.00
5-B ** - 0.00 0 0.00 0.00 0.00 0.00 0.00 - 0.00 0.00
Lemont 1 ** 6.78 111.32 6 0.00 0.00 22.93 1.35 0.00 - 0.00 0.00
2 8.46 8.68 13.51 106 7.76 9.70 12.52 1.03 8.21 - 9.12 44.34
3 ** - 17.56 6 0.00 0.00 4.31 1.13 0.00 - 0.00 50.00
5-A ** 24.81 74.65 2 0.00 0.00 37.04 1.14 0.00 - 0.00 0.00
5-B ** - 48.39 4 0.00 0.00 25.75 0.69 0.00 - 0.00 0.00
Lyons 1 ** 3.70 75.98 9 2.11 8.00 12.12 2.98 0.00 - 0.00 22.22
2 7.96 8.15 20.93 543 7.13 9.42 23.87 1.06 7.98 - 8.36 36.28
3 ** - 0.00 0 0.00 0.00 0.00 0.00 0.00 - 0.00 0.00
5-A ** 20.78 115.82 4 0.00 0.00 88.46 2.52 0.00 - 0.00 0.00
5-B ** 23.01 15.87 5 0.00 0.00 13.32 1.30 0.00 - 0.00 40.00
Oak Park 1 ** 8.46 0.00 1 0.00 0.00 0.00 1.00 0.00 - 0.00 100.00
2 7.74 7.84 20.18 355 6.74 9.29 17.10 1.05 7.57 - 8.04 32.11
3 ** 5.11 20.65 4 0.00 0.00 3.18 1.80 0.00 - 0.00 0.00
5-A ** 24.60 15.16 5 0.00 0.00 12.34 1.07 0.00 - 0.00 60.00
5-B ** 23.61 0.00 1 0.00 0.00 0.00 1.00 0.00 - 0.00 100.00
5-B - Industrial Property; 5-A - All other Class 5 property
** Insufficient data available. Analysis made only for property groups containing 25 or more transfers.
*** No adjustments necessary because there was no significant reassessment in 2015.
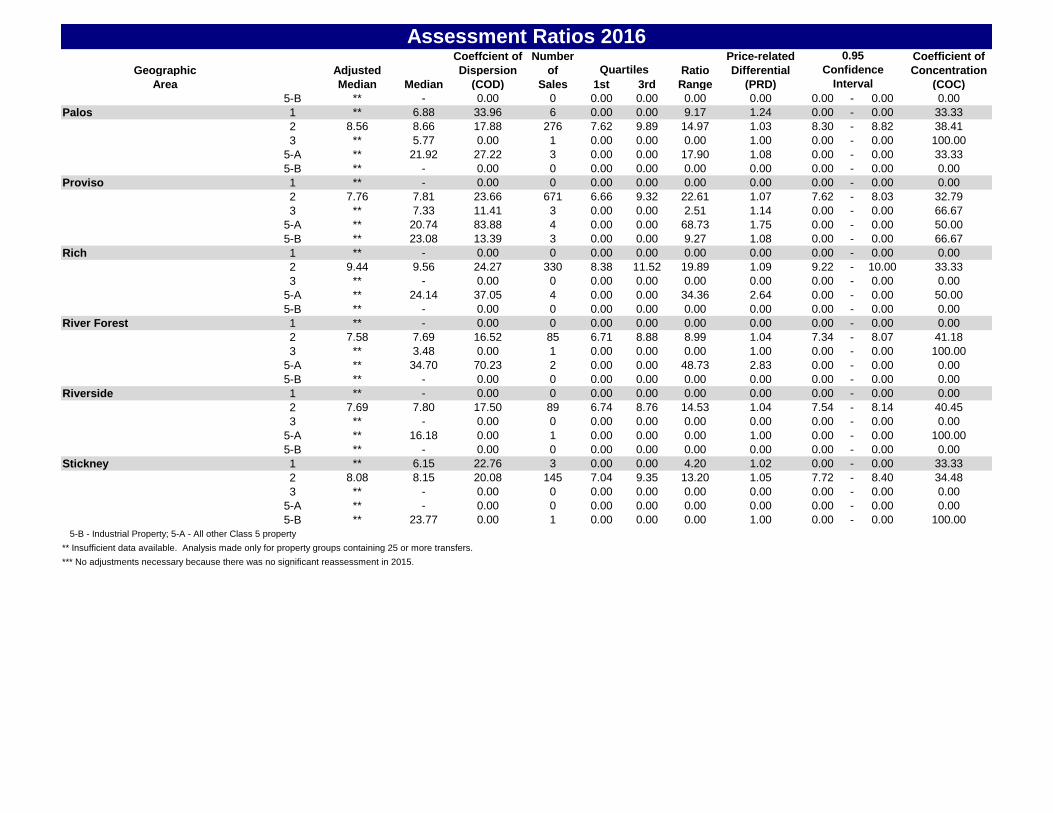
Cook County — Triad Assessment District 3 Township Ratios (cont.)
Orland 1 ** 5.18 34.49 6 0.00 0.00 4.87 1.09 0.00 - 0.00 0.00
2 8.69 8.82 12.09 637 8.08 9.76 14.96 1.01 8.73 - 8.92 53.69
3 ** - 0.00 0 0.00 0.00 0.00 0.00 0.00 - 0.00 0.00
5-A ** 19.66 45.18 6 0.00 0.00 34.48 1.78 0.00 - 0.00 0.00
Coeffcient of Number Price-related Coefficient of
Geographic Adjusted Dispersion of Ratio Differential Concentration
Area Median Median (COD) Sales 1st 3rd Range (PRD) (COC)
Assessment Ratios 2016
Quartiles
0.95
Confidence
Interval
5-B ** - 0.00 0 0.00 0.00 0.00 0.00 0.00 - 0.00 0.00
Palos 1 ** 6.88 33.96 6 0.00 0.00 9.17 1.24 0.00 - 0.00 33.33
2 8.56 8.66 17.88 276 7.62 9.89 14.97 1.03 8.30 - 8.82 38.41
3 ** 5.77 0.00 1 0.00 0.00 0.00 1.00 0.00 - 0.00 100.00
5-A ** 21.92 27.22 3 0.00 0.00 17.90 1.08 0.00 - 0.00 33.33
5-B ** - 0.00 0 0.00 0.00 0.00 0.00 0.00 - 0.00 0.00
Proviso 1 ** - 0.00 0 0.00 0.00 0.00 0.00 0.00 - 0.00 0.00
2 7.76 7.81 23.66 671 6.66 9.32 22.61 1.07 7.62 - 8.03 32.79
3 ** 7.33 11.41 3 0.00 0.00 2.51 1.14 0.00 - 0.00 66.67
5-A ** 20.74 83.88 4 0.00 0.00 68.73 1.75 0.00 - 0.00 50.00
5-B ** 23.08 13.39 3 0.00 0.00 9.27 1.08 0.00 - 0.00 66.67
Rich 1 ** - 0.00 0 0.00 0.00 0.00 0.00 0.00 - 0.00 0.00
2 9.44 9.56 24.27 330 8.38 11.52 19.89 1.09 9.22 - 10.00 33.33
3 ** - 0.00 0 0.00 0.00 0.00 0.00 0.00 - 0.00 0.00
5-A ** 24.14 37.05 4 0.00 0.00 34.36 2.64 0.00 - 0.00 50.00
5-B ** - 0.00 0 0.00 0.00 0.00 0.00 0.00 - 0.00 0.00
River Forest 1 ** - 0.00 0 0.00 0.00 0.00 0.00 0.00 - 0.00 0.00
2 7.58 7.69 16.52 85 6.71 8.88 8.99 1.04 7.34 - 8.07 41.18
3 ** 3.48 0.00 1 0.00 0.00 0.00 1.00 0.00 - 0.00 100.00
5-A ** 34.70 70.23 2 0.00 0.00 48.73 2.83 0.00 - 0.00 0.00
5-B ** - 0.00 0 0.00 0.00 0.00 0.00 0.00 - 0.00 0.00
Riverside 1 ** - 0.00 0 0.00 0.00 0.00 0.00 0.00 - 0.00 0.00
2 7.69 7.80 17.50 89 6.74 8.76 14.53 1.04 7.54 - 8.14 40.45
3 ** - 0.00 0 0.00 0.00 0.00 0.00 0.00 - 0.00 0.00
5-A ** 16.18 0.00 1 0.00 0.00 0.00 1.00 0.00 - 0.00 100.00
5-B ** - 0.00 0 0.00 0.00 0.00 0.00 0.00 - 0.00 0.00
Stickney 1 ** 6.15 22.76 3 0.00 0.00 4.20 1.02 0.00 - 0.00 33.33
2 8.08 8.15 20.08 145 7.04 9.35 13.20 1.05 7.72 - 8.40 34.48
3 ** - 0.00 0 0.00 0.00 0.00 0.00 0.00 - 0.00 0.00
5-A ** - 0.00 0 0.00 0.00 0.00 0.00 0.00 - 0.00 0.00
5-B ** 23.77 0.00 1 0.00 0.00 0.00 1.00 0.00 - 0.00 100.00
5-B - Industrial Property; 5-A - All other Class 5 property
** Insufficient data available. Analysis made only for property groups containing 25 or more transfers.
*** No adjustments necessary because there was no significant reassessment in 2015.
Coeffcient of Number Price-related Coefficient of
Geographic Adjusted Dispersion of Ratio Differential Concentration
Area Median Median (COD) Sales 1st 3rd Range (PRD) (COC)
Assessment Ratios 2016
Quartiles
0.95
Confidence
Interval
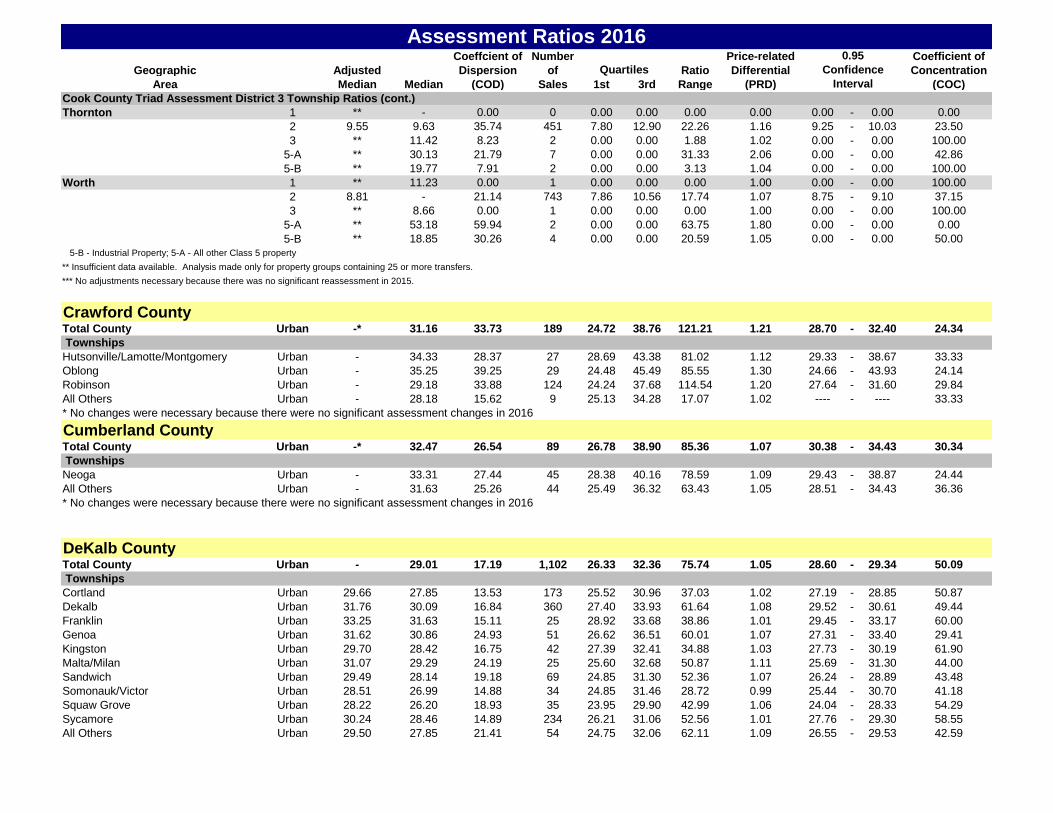
Cook County Triad Assessment District 3 Township Ratios (cont.)
Thornton 1 ** - 0.00 0 0.00 0.00 0.00 0.00 0.00 - 0.00 0.00
2 9.55 9.63 35.74 451 7.80 12.90 22.26 1.16 9.25 - 10.03 23.50
3 ** 11.42 8.23 2 0.00 0.00 1.88 1.02 0.00 - 0.00 100.00
5-A ** 30.13 21.79 7 0.00 0.00 31.33 2.06 0.00 - 0.00 42.86
5-B ** 19.77 7.91 2 0.00 0.00 3.13 1.04 0.00 - 0.00 100.00
Worth 1 ** 11.23 0.00 1 0.00 0.00 0.00 1.00 0.00 - 0.00 100.00
2 8.81 - 21.14 743 7.86 10.56 17.74 1.07 8.75 - 9.10 37.15
3 ** 8.66 0.00 1 0.00 0.00 0.00 1.00 0.00 - 0.00 100.00
5-A ** 53.18 59.94 2 0.00 0.00 63.75 1.80 0.00 - 0.00 0.00
5-B ** 18.85 30.26 4 0.00 0.00 20.59 1.05 0.00 - 0.00 50.00
5-B - Industrial Property; 5-A - All other Class 5 property
** Insufficient data available. Analysis made only for property groups containing 25 or more transfers.
*** No adjustments necessary because there was no significant reassessment in 2015.
Crawford CountyTotal County Urban -* 31.16 33.73 189 24.72 38.76 121.21 1.21 28.70 - 32.40 24.34
Townships
Hutsonville/Lamotte/Montgomery Urban - 34.33 28.37 27 28.69 43.38 81.02 1.12 29.33 - 38.67 33.33
Oblong Urban - 35.25 39.25 29 24.48 45.49 85.55 1.30 24.66 - 43.93 24.14
Robinson Urban - 29.18 33.88 124 24.24 37.68 114.54 1.20 27.64 - 31.60 29.84
All Others Urban - 28.18 15.62 9 25.13 34.28 17.07 1.02 ---- - ---- 33.33
* No changes were necessary because there were no significant assessment changes in 2016
Cumberland CountyTotal County Urban -* 32.47 26.54 89 26.78 38.90 85.36 1.07 30.38 - 34.43 30.34
Townships
Neoga Urban - 33.31 27.44 45 28.38 40.16 78.59 1.09 29.43 - 38.87 24.44
All Others Urban - 31.63 25.26 44 25.49 36.32 63.43 1.05 28.51 - 34.43 36.36
* No changes were necessary because there were no significant assessment changes in 2016
DeKalb CountyTotal County Urban - 29.01 17.19 1,102 26.33 32.36 75.74 1.05 28.60 - 29.34 50.09
Townships
Cortland Urban 29.66 27.85 13.53 173 25.52 30.96 37.03 1.02 27.19 - 28.85 50.87
Dekalb Urban 31.76 30.09 16.84 360 27.40 33.93 61.64 1.08 29.52 - 30.61 49.44
Franklin Urban 33.25 31.63 15.11 25 28.92 33.68 38.86 1.01 29.45 - 33.17 60.00
Genoa Urban 31.62 30.86 24.93 51 26.62 36.51 60.01 1.07 27.31 - 33.40 29.41
Kingston Urban 29.70 28.42 16.75 42 27.39 32.41 34.88 1.03 27.73 - 30.19 61.90
Malta/Milan Urban 31.07 29.29 24.19 25 25.60 32.68 50.87 1.11 25.69 - 31.30 44.00
Sandwich Urban 29.49 28.14 19.18 69 24.85 31.30 52.36 1.07 26.24 - 28.89 43.48
Somonauk/Victor Urban 28.51 26.99 14.88 34 24.85 31.46 28.72 0.99 25.44 - 30.70 41.18
Squaw Grove Urban 28.22 26.20 18.93 35 23.95 29.90 42.99 1.06 24.04 - 28.33 54.29
Sycamore Urban 30.24 28.46 14.89 234 26.21 31.06 52.56 1.01 27.76 - 29.30 58.55
All Others Urban 29.50 27.85 21.41 54 24.75 32.06 62.11 1.09 26.55 - 29.53 42.59
Coeffcient of Number Price-related Coefficient of
Geographic Adjusted Dispersion of Ratio Differential Concentration
Area Median Median (COD) Sales 1st 3rd Range (PRD) (COC)
Assessment Ratios 2016
Quartiles
0.95
Confidence
Interval
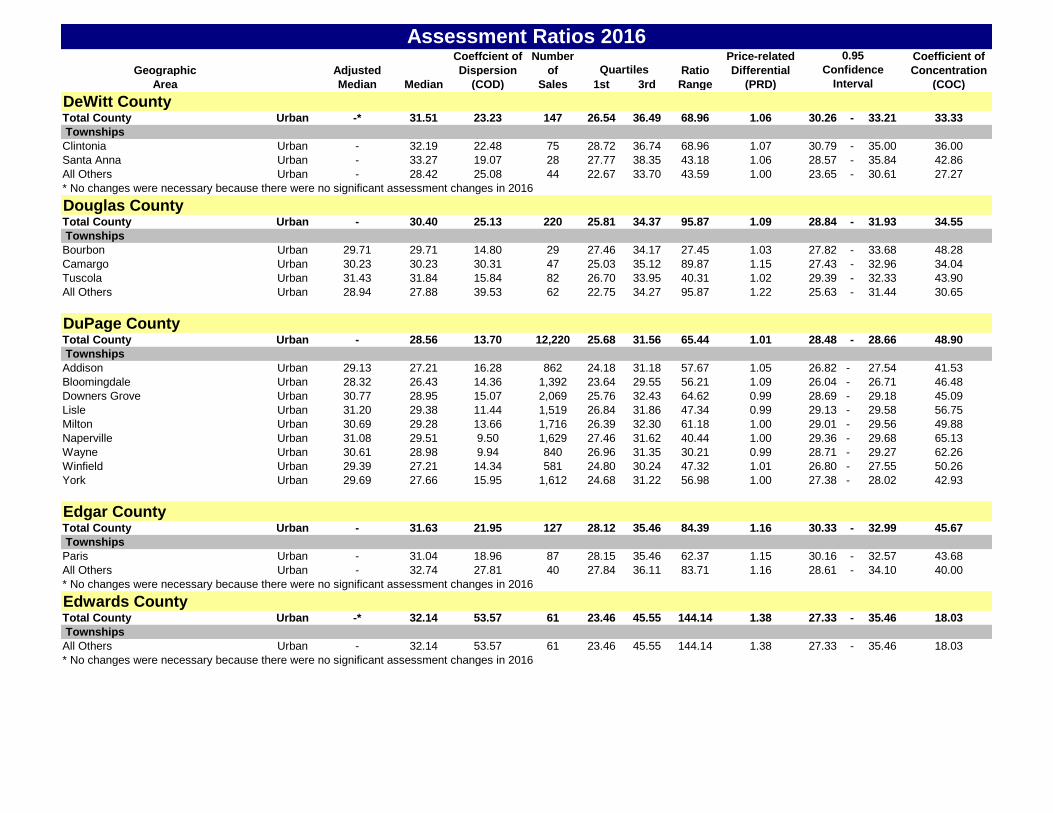
DeWitt CountyTotal County Urban -* 31.51 23.23 147 26.54 36.49 68.96 1.06 30.26 - 33.21 33.33
Townships
Clintonia Urban - 32.19 22.48 75 28.72 36.74 68.96 1.07 30.79 - 35.00 36.00
Santa Anna Urban - 33.27 19.07 28 27.77 38.35 43.18 1.06 28.57 - 35.84 42.86
All Others Urban - 28.42 25.08 44 22.67 33.70 43.59 1.00 23.65 - 30.61 27.27
* No changes were necessary because there were no significant assessment changes in 2016
Douglas CountyTotal County Urban - 30.40 25.13 220 25.81 34.37 95.87 1.09 28.84 - 31.93 34.55
Townships
Bourbon Urban 29.71 29.71 14.80 29 27.46 34.17 27.45 1.03 27.82 - 33.68 48.28
Camargo Urban 30.23 30.23 30.31 47 25.03 35.12 89.87 1.15 27.43 - 32.96 34.04
Tuscola Urban 31.43 31.84 15.84 82 26.70 33.95 40.31 1.02 29.39 - 32.33 43.90
All Others Urban 28.94 27.88 39.53 62 22.75 34.27 95.87 1.22 25.63 - 31.44 30.65
DuPage CountyTotal County Urban - 28.56 13.70 12,220 25.68 31.56 65.44 1.01 28.48 - 28.66 48.90
Townships
Addison Urban 29.13 27.21 16.28 862 24.18 31.18 57.67 1.05 26.82 - 27.54 41.53
Bloomingdale Urban 28.32 26.43 14.36 1,392 23.64 29.55 56.21 1.09 26.04 - 26.71 46.48
Downers Grove Urban 30.77 28.95 15.07 2,069 25.76 32.43 64.62 0.99 28.69 - 29.18 45.09
Lisle Urban 31.20 29.38 11.44 1,519 26.84 31.86 47.34 0.99 29.13 - 29.58 56.75
Milton Urban 30.69 29.28 13.66 1,716 26.39 32.30 61.18 1.00 29.01 - 29.56 49.88
Naperville Urban 31.08 29.51 9.50 1,629 27.46 31.62 40.44 1.00 29.36 - 29.68 65.13
Wayne Urban 30.61 28.98 9.94 840 26.96 31.35 30.21 0.99 28.71 - 29.27 62.26
Winfield Urban 29.39 27.21 14.34 581 24.80 30.24 47.32 1.01 26.80 - 27.55 50.26
York Urban 29.69 27.66 15.95 1,612 24.68 31.22 56.98 1.00 27.38 - 28.02 42.93
Edgar CountyTotal County Urban - 31.63 21.95 127 28.12 35.46 84.39 1.16 30.33 - 32.99 45.67
Townships
Paris Urban - 31.04 18.96 87 28.15 35.46 62.37 1.15 30.16 - 32.57 43.68
All Others Urban - 32.74 27.81 40 27.84 36.11 83.71 1.16 28.61 - 34.10 40.00
Edwards CountyTotal County Urban -* 32.14 53.57 61 23.46 45.55 144.14 1.38 27.33 - 35.46 18.03
Townships
All Others Urban - 32.14 53.57 61 23.46 45.55 144.14 1.38 27.33 - 35.46 18.03
* No changes were necessary because there were no significant assessment changes in 2016
* No changes were necessary because there were no significant assessment changes in 2016
Coeffcient of Number Price-related Coefficient of
Geographic Adjusted Dispersion of Ratio Differential Concentration
Area Median Median (COD) Sales 1st 3rd Range (PRD) (COC)
Assessment Ratios 2016
Quartiles
0.95
Confidence
Interval
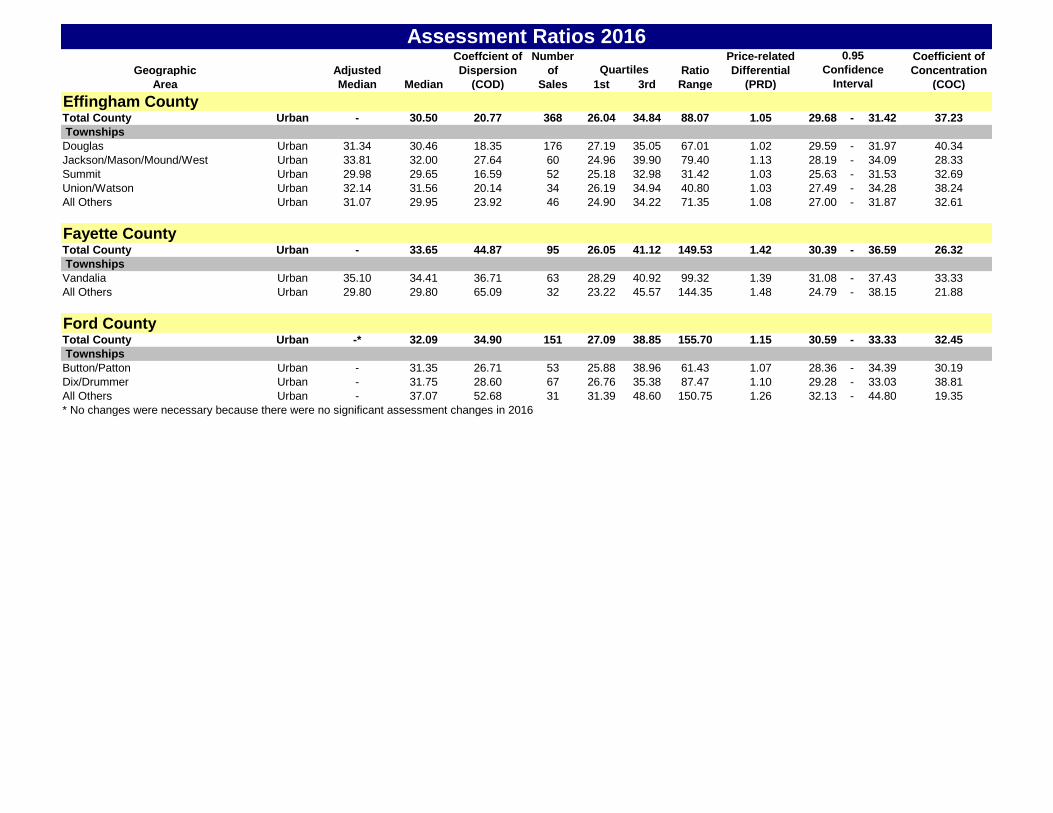
Effingham CountyTotal County Urban - 30.50 20.77 368 26.04 34.84 88.07 1.05 29.68 - 31.42 37.23
Townships
Douglas Urban 31.34 30.46 18.35 176 27.19 35.05 67.01 1.02 29.59 - 31.97 40.34
Jackson/Mason/Mound/West Urban 33.81 32.00 27.64 60 24.96 39.90 79.40 1.13 28.19 - 34.09 28.33
Summit Urban 29.98 29.65 16.59 52 25.18 32.98 31.42 1.03 25.63 - 31.53 32.69
Union/Watson Urban 32.14 31.56 20.14 34 26.19 34.94 40.80 1.03 27.49 - 34.28 38.24
All Others Urban 31.07 29.95 23.92 46 24.90 34.22 71.35 1.08 27.00 - 31.87 32.61
Fayette CountyTotal County Urban - 33.65 44.87 95 26.05 41.12 149.53 1.42 30.39 - 36.59 26.32
Townships
Vandalia Urban 35.10 34.41 36.71 63 28.29 40.92 99.32 1.39 31.08 - 37.43 33.33
All Others Urban 29.80 29.80 65.09 32 23.22 45.57 144.35 1.48 24.79 - 38.15 21.88
Ford CountyTotal County Urban -* 32.09 34.90 151 27.09 38.85 155.70 1.15 30.59 - 33.33 32.45
Townships
Button/Patton Urban - 31.35 26.71 53 25.88 38.96 61.43 1.07 28.36 - 34.39 30.19
Dix/Drummer Urban - 31.75 28.60 67 26.76 35.38 87.47 1.10 29.28 - 33.03 38.81
All Others Urban - 37.07 52.68 31 31.39 48.60 150.75 1.26 32.13 - 44.80 19.35
* No changes were necessary because there were no significant assessment changes in 2016
Coeffcient of Number Price-related Coefficient of
Geographic Adjusted Dispersion of Ratio Differential Concentration
Area Median Median (COD) Sales 1st 3rd Range (PRD) (COC)
Assessment Ratios 2016
Quartiles
0.95
Confidence
Interval
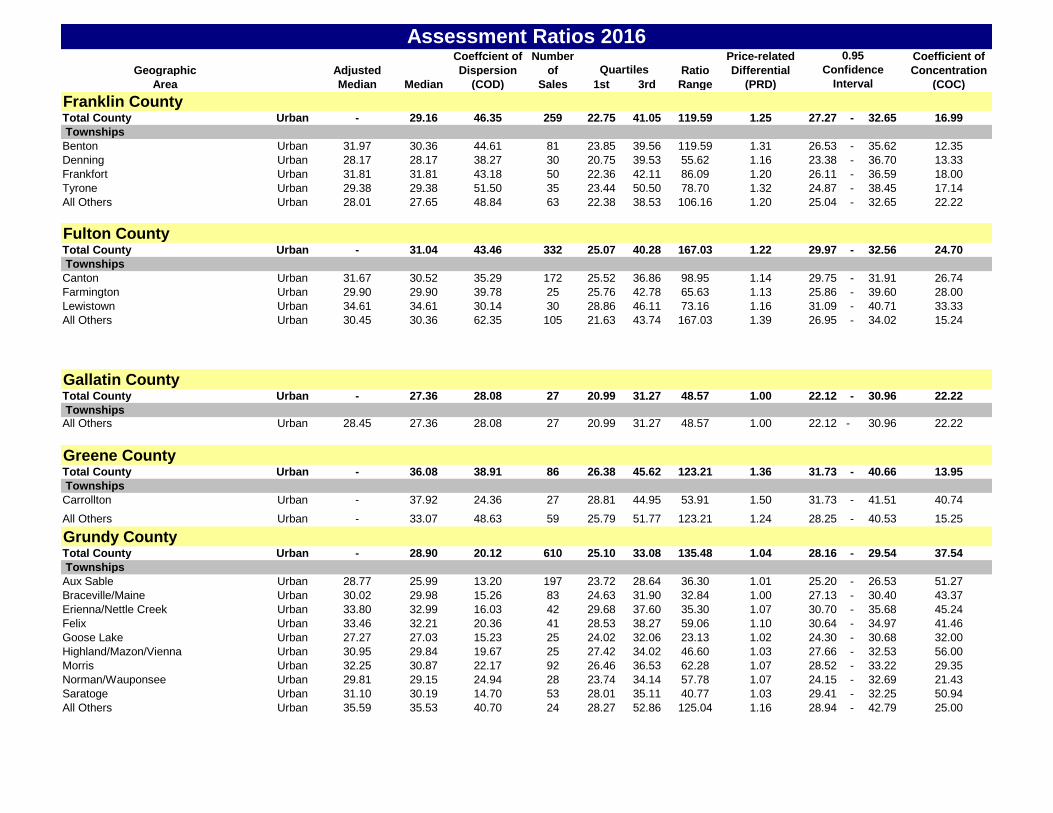
Franklin CountyTotal County Urban - 29.16 46.35 259 22.75 41.05 119.59 1.25 27.27 - 32.65 16.99
Townships
Benton Urban 31.97 30.36 44.61 81 23.85 39.56 119.59 1.31 26.53 - 35.62 12.35
Denning Urban 28.17 28.17 38.27 30 20.75 39.53 55.62 1.16 23.38 - 36.70 13.33
Frankfort Urban 31.81 31.81 43.18 50 22.36 42.11 86.09 1.20 26.11 - 36.59 18.00
Tyrone Urban 29.38 29.38 51.50 35 23.44 50.50 78.70 1.32 24.87 - 38.45 17.14
All Others Urban 28.01 27.65 48.84 63 22.38 38.53 106.16 1.20 25.04 - 32.65 22.22
Fulton CountyTotal County Urban - 31.04 43.46 332 25.07 40.28 167.03 1.22 29.97 - 32.56 24.70
Townships
Canton Urban 31.67 30.52 35.29 172 25.52 36.86 98.95 1.14 29.75 - 31.91 26.74
Farmington Urban 29.90 29.90 39.78 25 25.76 42.78 65.63 1.13 25.86 - 39.60 28.00
Lewistown Urban 34.61 34.61 30.14 30 28.86 46.11 73.16 1.16 31.09 - 40.71 33.33
All Others Urban 30.45 30.36 62.35 105 21.63 43.74 167.03 1.39 26.95 - 34.02 15.24
Gallatin CountyTotal County Urban - 27.36 28.08 27 20.99 31.27 48.57 1.00 22.12 - 30.96 22.22
TownshipsAll Others Urban 28.45 27.36 28.08 27 20.99 31.27 48.57 1.00 22.12 - 30.96 22.22
Greene CountyTotal County Urban - 36.08 38.91 86 26.38 45.62 123.21 1.36 31.73 - 40.66 13.95
Townships
Carrollton Urban - 37.92 24.36 27 28.81 44.95 53.91 1.50 31.73 - 41.51 40.74
All Others Urban - 33.07 48.63 59 25.79 51.77 123.21 1.24 28.25 - 40.53 15.25
Grundy CountyTotal County Urban - 28.90 20.12 610 25.10 33.08 135.48 1.04 28.16 - 29.54 37.54
Townships
Aux Sable Urban 28.77 25.99 13.20 197 23.72 28.64 36.30 1.01 25.20 - 26.53 51.27
Braceville/Maine Urban 30.02 29.98 15.26 83 24.63 31.90 32.84 1.00 27.13 - 30.40 43.37
Erienna/Nettle Creek Urban 33.80 32.99 16.03 42 29.68 37.60 35.30 1.07 30.70 - 35.68 45.24
Felix Urban 33.46 32.21 20.36 41 28.53 38.27 59.06 1.10 30.64 - 34.97 41.46
Goose Lake Urban 27.27 27.03 15.23 25 24.02 32.06 23.13 1.02 24.30 - 30.68 32.00
Highland/Mazon/Vienna Urban 30.95 29.84 19.67 25 27.42 34.02 46.60 1.03 27.66 - 32.53 56.00
Morris Urban 32.25 30.87 22.17 92 26.46 36.53 62.28 1.07 28.52 - 33.22 29.35
Norman/Wauponsee Urban 29.81 29.15 24.94 28 23.74 34.14 57.78 1.07 24.15 - 32.69 21.43
Saratoge Urban 31.10 30.19 14.70 53 28.01 35.11 40.77 1.03 29.41 - 32.25 50.94
All Others Urban 35.59 35.53 40.70 24 28.27 52.86 125.04 1.16 28.94 - 42.79 25.00
Coeffcient of Number Price-related Coefficient of
Geographic Adjusted Dispersion of Ratio Differential Concentration
Area Median Median (COD) Sales 1st 3rd Range (PRD) (COC)
Assessment Ratios 2016
Quartiles
0.95
Confidence
Interval
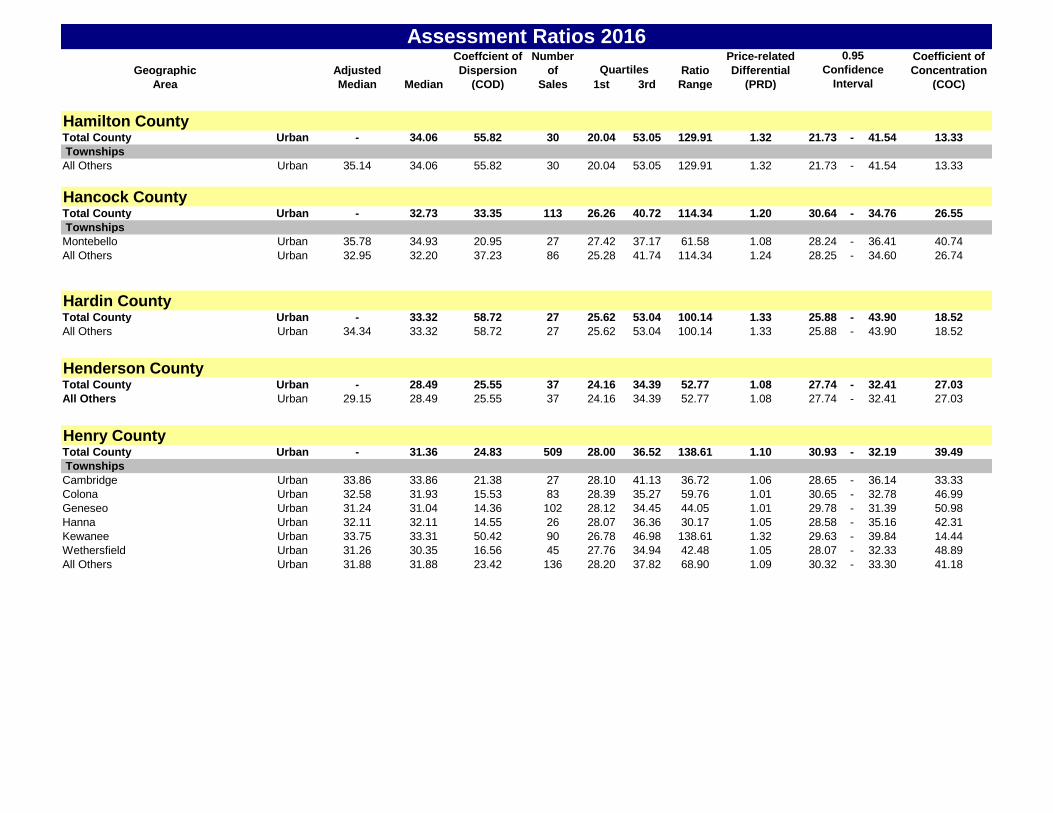
Hamilton CountyTotal County Urban - 34.06 55.82 30 20.04 53.05 129.91 1.32 21.73 - 41.54 13.33
Townships
All Others Urban 35.14 34.06 55.82 30 20.04 53.05 129.91 1.32 21.73 - 41.54 13.33
Hancock CountyTotal County Urban - 32.73 33.35 113 26.26 40.72 114.34 1.20 30.64 - 34.76 26.55
Townships
Montebello Urban 35.78 34.93 20.95 27 27.42 37.17 61.58 1.08 28.24 - 36.41 40.74
All Others Urban 32.95 32.20 37.23 86 25.28 41.74 114.34 1.24 28.25 - 34.60 26.74
Hardin CountyTotal County Urban - 33.32 58.72 27 25.62 53.04 100.14 1.33 25.88 - 43.90 18.52
All Others Urban 34.34 33.32 58.72 27 25.62 53.04 100.14 1.33 25.88 - 43.90 18.52
Henderson CountyTotal County Urban - 28.49 25.55 37 24.16 34.39 52.77 1.08 27.74 - 32.41 27.03
All Others Urban 29.15 28.49 25.55 37 24.16 34.39 52.77 1.08 27.74 - 32.41 27.03
Henry CountyTotal County Urban - 31.36 24.83 509 28.00 36.52 138.61 1.10 30.93 - 32.19 39.49
Townships
Cambridge Urban 33.86 33.86 21.38 27 28.10 41.13 36.72 1.06 28.65 - 36.14 33.33
Colona Urban 32.58 31.93 15.53 83 28.39 35.27 59.76 1.01 30.65 - 32.78 46.99
Geneseo Urban 31.24 31.04 14.36 102 28.12 34.45 44.05 1.01 29.78 - 31.39 50.98
Hanna Urban 32.11 32.11 14.55 26 28.07 36.36 30.17 1.05 28.58 - 35.16 42.31
Kewanee Urban 33.75 33.31 50.42 90 26.78 46.98 138.61 1.32 29.63 - 39.84 14.44
Wethersfield Urban 31.26 30.35 16.56 45 27.76 34.94 42.48 1.05 28.07 - 32.33 48.89
All Others Urban 31.88 31.88 23.42 136 28.20 37.82 68.90 1.09 30.32 - 33.30 41.18
Coeffcient of Number Price-related Coefficient of
Geographic Adjusted Dispersion of Ratio Differential Concentration
Area Median Median (COD) Sales 1st 3rd Range (PRD) (COC)
Assessment Ratios 2016
Quartiles
0.95
Confidence
Interval
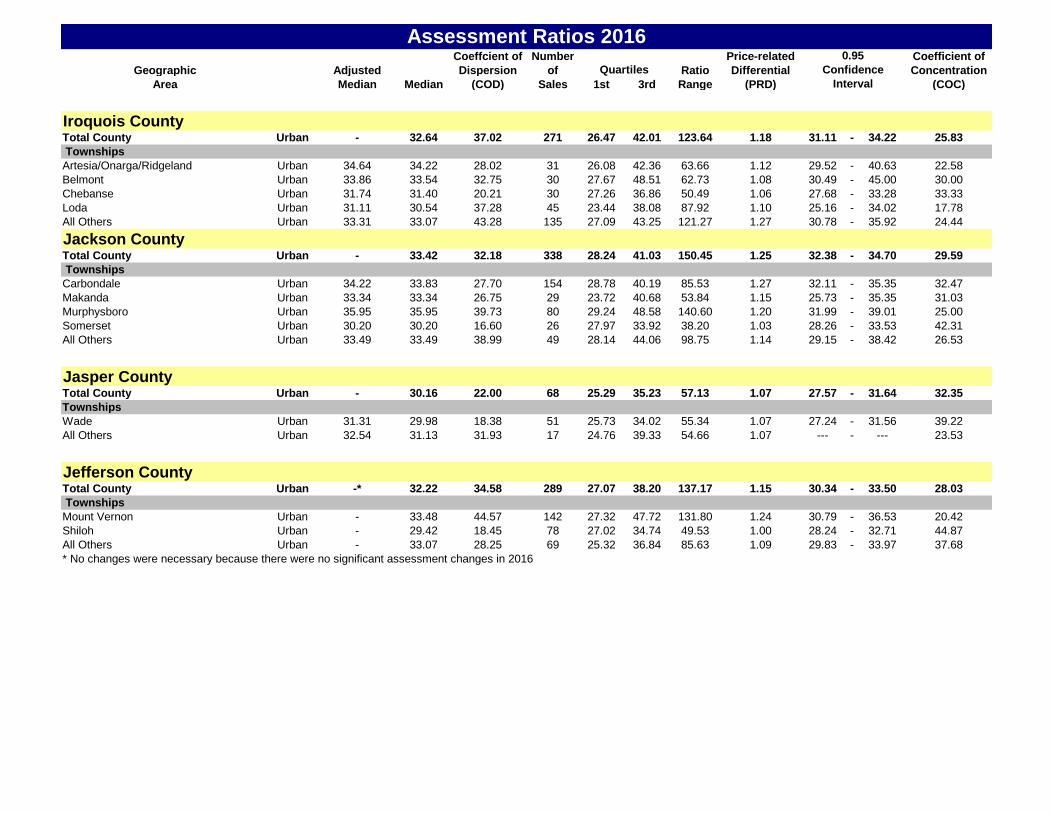
Iroquois CountyTotal County Urban - 32.64 37.02 271 26.47 42.01 123.64 1.18 31.11 - 34.22 25.83
Townships
Artesia/Onarga/Ridgeland Urban 34.64 34.22 28.02 31 26.08 42.36 63.66 1.12 29.52 - 40.63 22.58
Belmont Urban 33.86 33.54 32.75 30 27.67 48.51 62.73 1.08 30.49 - 45.00 30.00
Chebanse Urban 31.74 31.40 20.21 30 27.26 36.86 50.49 1.06 27.68 - 33.28 33.33
Loda Urban 31.11 30.54 37.28 45 23.44 38.08 87.92 1.10 25.16 - 34.02 17.78
All Others Urban 33.31 33.07 43.28 135 27.09 43.25 121.27 1.27 30.78 - 35.92 24.44
Jackson CountyTotal County Urban - 33.42 32.18 338 28.24 41.03 150.45 1.25 32.38 - 34.70 29.59
Townships
Carbondale Urban 34.22 33.83 27.70 154 28.78 40.19 85.53 1.27 32.11 - 35.35 32.47
Makanda Urban 33.34 33.34 26.75 29 23.72 40.68 53.84 1.15 25.73 - 35.35 31.03
Murphysboro Urban 35.95 35.95 39.73 80 29.24 48.58 140.60 1.20 31.99 - 39.01 25.00
Somerset Urban 30.20 30.20 16.60 26 27.97 33.92 38.20 1.03 28.26 - 33.53 42.31
All Others Urban 33.49 33.49 38.99 49 28.14 44.06 98.75 1.14 29.15 - 38.42 26.53
Jasper CountyTotal County Urban - 30.16 22.00 68 25.29 35.23 57.13 1.07 27.57 - 31.64 32.35
Townships
Wade Urban 31.31 29.98 18.38 51 25.73 34.02 55.34 1.07 27.24 - 31.56 39.22
All Others Urban 32.54 31.13 31.93 17 24.76 39.33 54.66 1.07 --- - --- 23.53
Jefferson CountyTotal County Urban -* 32.22 34.58 289 27.07 38.20 137.17 1.15 30.34 - 33.50 28.03
Townships
Mount Vernon Urban - 33.48 44.57 142 27.32 47.72 131.80 1.24 30.79 - 36.53 20.42
Shiloh Urban - 29.42 18.45 78 27.02 34.74 49.53 1.00 28.24 - 32.71 44.87
All Others Urban - 33.07 28.25 69 25.32 36.84 85.63 1.09 29.83 - 33.97 37.68
* No changes were necessary because there were no significant assessment changes in 2016
Coeffcient of Number Price-related Coefficient of
Geographic Adjusted Dispersion of Ratio Differential Concentration
Area Median Median (COD) Sales 1st 3rd Range (PRD) (COC)
Assessment Ratios 2016
Quartiles
0.95
Confidence
Interval
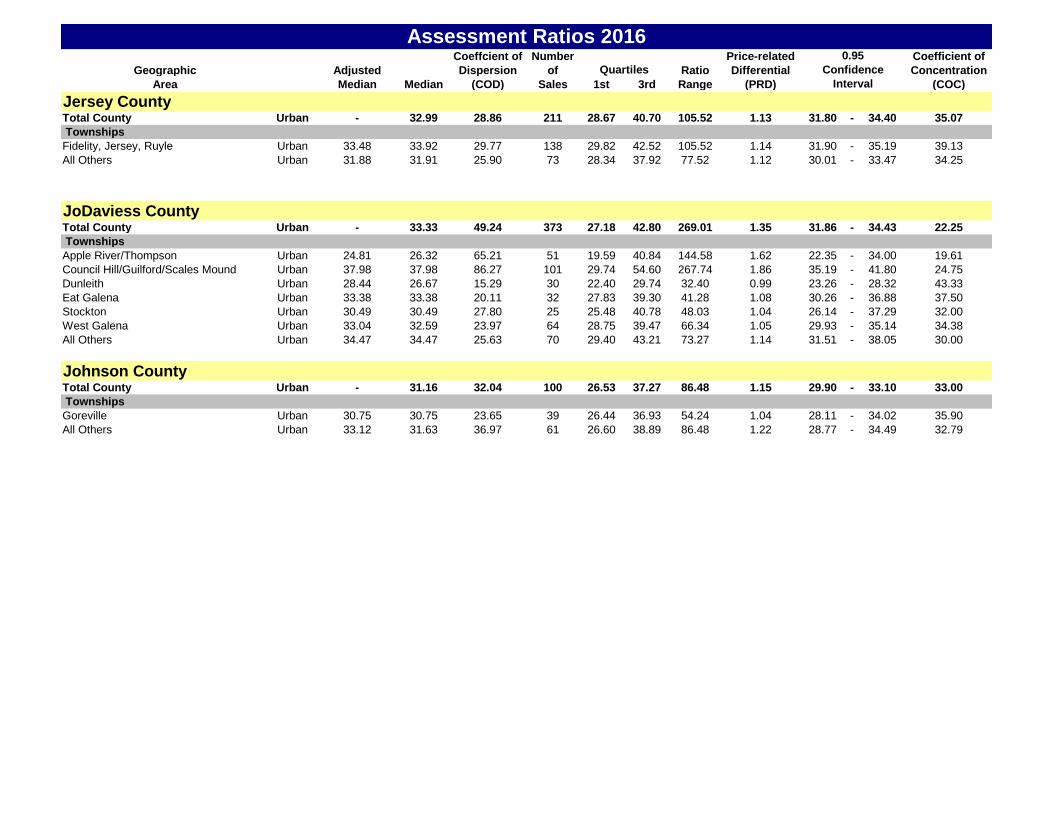
Jersey CountyTotal County Urban - 32.99 28.86 211 28.67 40.70 105.52 1.13 31.80 - 34.40 35.07
Townships
Fidelity, Jersey, Ruyle Urban 33.48 33.92 29.77 138 29.82 42.52 105.52 1.14 31.90 - 35.19 39.13
All Others Urban 31.88 31.91 25.90 73 28.34 37.92 77.52 1.12 30.01 - 33.47 34.25
JoDaviess CountyTotal County Urban - 33.33 49.24 373 27.18 42.80 269.01 1.35 31.86 - 34.43 22.25
Townships
Apple River/Thompson Urban 24.81 26.32 65.21 51 19.59 40.84 144.58 1.62 22.35 - 34.00 19.61
Council Hill/Guilford/Scales Mound Urban 37.98 37.98 86.27 101 29.74 54.60 267.74 1.86 35.19 - 41.80 24.75
Dunleith Urban 28.44 26.67 15.29 30 22.40 29.74 32.40 0.99 23.26 - 28.32 43.33
Eat Galena Urban 33.38 33.38 20.11 32 27.83 39.30 41.28 1.08 30.26 - 36.88 37.50
Stockton Urban 30.49 30.49 27.80 25 25.48 40.78 48.03 1.04 26.14 - 37.29 32.00
West Galena Urban 33.04 32.59 23.97 64 28.75 39.47 66.34 1.05 29.93 - 35.14 34.38
All Others Urban 34.47 34.47 25.63 70 29.40 43.21 73.27 1.14 31.51 - 38.05 30.00
Johnson CountyTotal County Urban - 31.16 32.04 100 26.53 37.27 86.48 1.15 29.90 - 33.10 33.00
Townships
Goreville Urban 30.75 30.75 23.65 39 26.44 36.93 54.24 1.04 28.11 - 34.02 35.90
All Others Urban 33.12 31.63 36.97 61 26.60 38.89 86.48 1.22 28.77 - 34.49 32.79
Coeffcient of Number Price-related Coefficient of
Geographic Adjusted Dispersion of Ratio Differential Concentration
Area Median Median (COD) Sales 1st 3rd Range (PRD) (COC)
Assessment Ratios 2016
Quartiles
0.95
Confidence
Interval
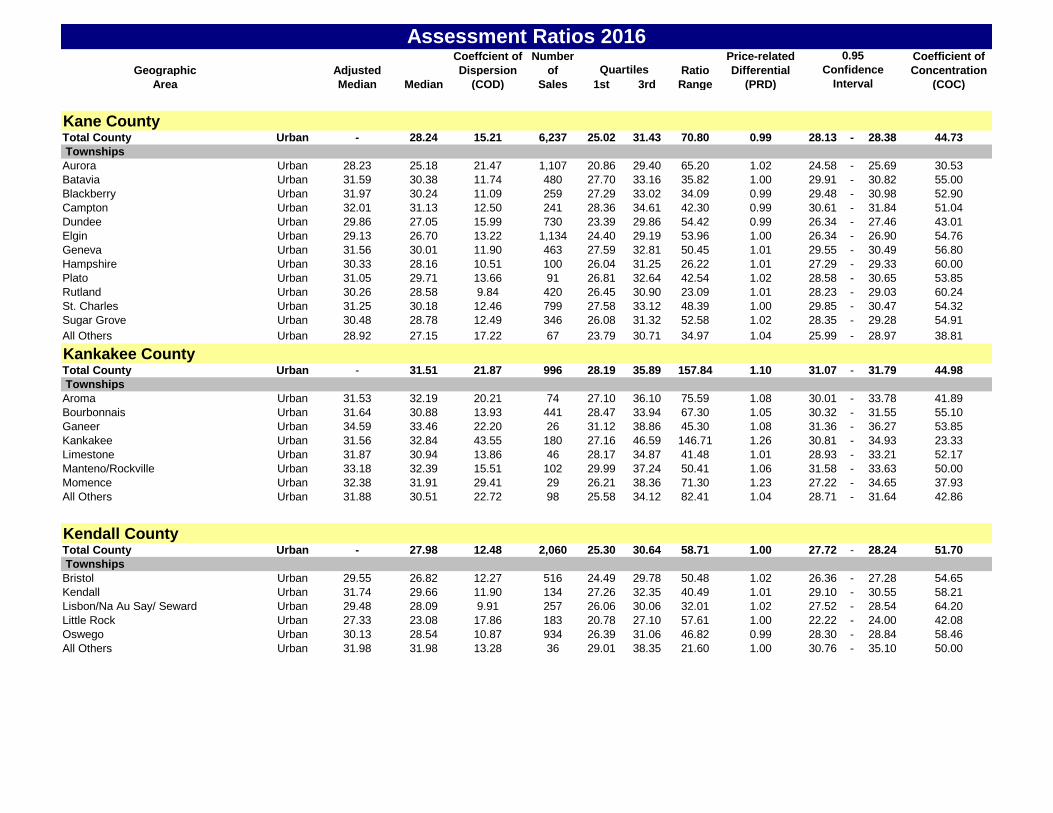
Kane CountyTotal County Urban - 28.24 15.21 6,237 25.02 31.43 70.80 0.99 28.13 - 28.38 44.73
Townships
Aurora Urban 28.23 25.18 21.47 1,107 20.86 29.40 65.20 1.02 24.58 - 25.69 30.53
Batavia Urban 31.59 30.38 11.74 480 27.70 33.16 35.82 1.00 29.91 - 30.82 55.00
Blackberry Urban 31.97 30.24 11.09 259 27.29 33.02 34.09 0.99 29.48 - 30.98 52.90
Campton Urban 32.01 31.13 12.50 241 28.36 34.61 42.30 0.99 30.61 - 31.84 51.04
Dundee Urban 29.86 27.05 15.99 730 23.39 29.86 54.42 0.99 26.34 - 27.46 43.01
Elgin Urban 29.13 26.70 13.22 1,134 24.40 29.19 53.96 1.00 26.34 - 26.90 54.76
Geneva Urban 31.56 30.01 11.90 463 27.59 32.81 50.45 1.01 29.55 - 30.49 56.80
Hampshire Urban 30.33 28.16 10.51 100 26.04 31.25 26.22 1.01 27.29 - 29.33 60.00
Plato Urban 31.05 29.71 13.66 91 26.81 32.64 42.54 1.02 28.58 - 30.65 53.85
Rutland Urban 30.26 28.58 9.84 420 26.45 30.90 23.09 1.01 28.23 - 29.03 60.24
St. Charles Urban 31.25 30.18 12.46 799 27.58 33.12 48.39 1.00 29.85 - 30.47 54.32
Sugar Grove Urban 30.48 28.78 12.49 346 26.08 31.32 52.58 1.02 28.35 - 29.28 54.91
All Others Urban 28.92 27.15 17.22 67 23.79 30.71 34.97 1.04 25.99 - 28.97 38.81
Kankakee CountyTotal County Urban - 31.51 21.87 996 28.19 35.89 157.84 1.10 31.07 - 31.79 44.98
Townships
Aroma Urban 31.53 32.19 20.21 74 27.10 36.10 75.59 1.08 30.01 - 33.78 41.89
Bourbonnais Urban 31.64 30.88 13.93 441 28.47 33.94 67.30 1.05 30.32 - 31.55 55.10
Ganeer Urban 34.59 33.46 22.20 26 31.12 38.86 45.30 1.08 31.36 - 36.27 53.85
Kankakee Urban 31.56 32.84 43.55 180 27.16 46.59 146.71 1.26 30.81 - 34.93 23.33
Limestone Urban 31.87 30.94 13.86 46 28.17 34.87 41.48 1.01 28.93 - 33.21 52.17
Manteno/Rockville Urban 33.18 32.39 15.51 102 29.99 37.24 50.41 1.06 31.58 - 33.63 50.00
Momence Urban 32.38 31.91 29.41 29 26.21 38.36 71.30 1.23 27.22 - 34.65 37.93
All Others Urban 31.88 30.51 22.72 98 25.58 34.12 82.41 1.04 28.71 - 31.64 42.86
Kendall CountyTotal County Urban - 27.98 12.48 2,060 25.30 30.64 58.71 1.00 27.72 - 28.24 51.70
Townships
Bristol Urban 29.55 26.82 12.27 516 24.49 29.78 50.48 1.02 26.36 - 27.28 54.65
Kendall Urban 31.74 29.66 11.90 134 27.26 32.35 40.49 1.01 29.10 - 30.55 58.21
Lisbon/Na Au Say/ Seward Urban 29.48 28.09 9.91 257 26.06 30.06 32.01 1.02 27.52 - 28.54 64.20
Little Rock Urban 27.33 23.08 17.86 183 20.78 27.10 57.61 1.00 22.22 - 24.00 42.08
Oswego Urban 30.13 28.54 10.87 934 26.39 31.06 46.82 0.99 28.30 - 28.84 58.46
All Others Urban 31.98 31.98 13.28 36 29.01 38.35 21.60 1.00 30.76 - 35.10 50.00
Coeffcient of Number Price-related Coefficient of
Geographic Adjusted Dispersion of Ratio Differential Concentration
Area Median Median (COD) Sales 1st 3rd Range (PRD) (COC)
Assessment Ratios 2016
Quartiles
0.95
Confidence
Interval
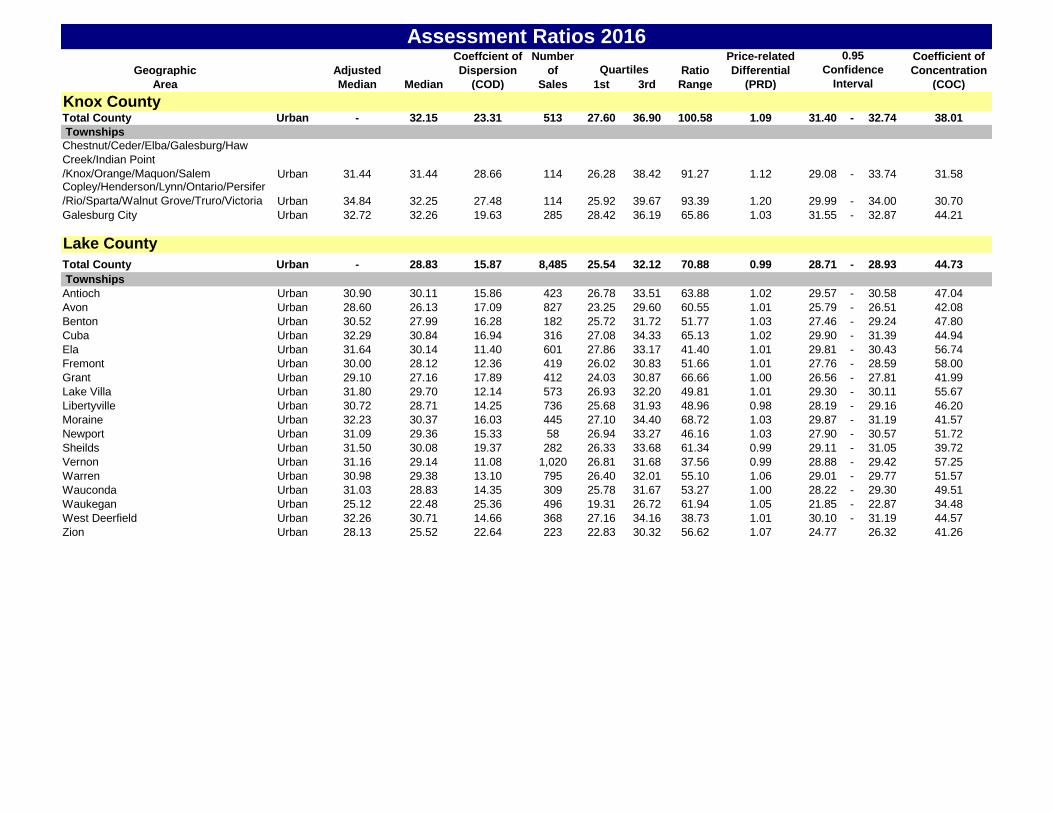
Knox CountyTotal County Urban - 32.15 23.31 513 27.60 36.90 100.58 1.09 31.40 - 32.74 38.01
Townships
Chestnut/Ceder/Elba/Galesburg/Haw
Creek/Indian Point
/Knox/Orange/Maquon/Salem Urban 31.44 31.44 28.66 114 26.28 38.42 91.27 1.12 29.08 - 33.74 31.58Copley/Henderson/Lynn/Ontario/Persifer
/Rio/Sparta/Walnut Grove/Truro/Victoria Urban 34.84 32.25 27.48 114 25.92 39.67 93.39 1.20 29.99 - 34.00 30.70
Galesburg City Urban 32.72 32.26 19.63 285 28.42 36.19 65.86 1.03 31.55 - 32.87 44.21
Lake County
Total County Urban - 28.83 15.87 8,485 25.54 32.12 70.88 0.99 28.71 - 28.93 44.73
Townships
Antioch Urban 30.90 30.11 15.86 423 26.78 33.51 63.88 1.02 29.57 - 30.58 47.04
Avon Urban 28.60 26.13 17.09 827 23.25 29.60 60.55 1.01 25.79 - 26.51 42.08
Benton Urban 30.52 27.99 16.28 182 25.72 31.72 51.77 1.03 27.46 - 29.24 47.80
Cuba Urban 32.29 30.84 16.94 316 27.08 34.33 65.13 1.02 29.90 - 31.39 44.94
Ela Urban 31.64 30.14 11.40 601 27.86 33.17 41.40 1.01 29.81 - 30.43 56.74
Fremont Urban 30.00 28.12 12.36 419 26.02 30.83 51.66 1.01 27.76 - 28.59 58.00
Grant Urban 29.10 27.16 17.89 412 24.03 30.87 66.66 1.00 26.56 - 27.81 41.99
Lake Villa Urban 31.80 29.70 12.14 573 26.93 32.20 49.81 1.01 29.30 - 30.11 55.67
Libertyville Urban 30.72 28.71 14.25 736 25.68 31.93 48.96 0.98 28.19 - 29.16 46.20
Moraine Urban 32.23 30.37 16.03 445 27.10 34.40 68.72 1.03 29.87 - 31.19 41.57
Newport Urban 31.09 29.36 15.33 58 26.94 33.27 46.16 1.03 27.90 - 30.57 51.72
Sheilds Urban 31.50 30.08 19.37 282 26.33 33.68 61.34 0.99 29.11 - 31.05 39.72
Vernon Urban 31.16 29.14 11.08 1,020 26.81 31.68 37.56 0.99 28.88 - 29.42 57.25
Warren Urban 30.98 29.38 13.10 795 26.40 32.01 55.10 1.06 29.01 - 29.77 51.57
Wauconda Urban 31.03 28.83 14.35 309 25.78 31.67 53.27 1.00 28.22 - 29.30 49.51
Waukegan Urban 25.12 22.48 25.36 496 19.31 26.72 61.94 1.05 21.85 - 22.87 34.48
West Deerfield Urban 32.26 30.71 14.66 368 27.16 34.16 38.73 1.01 30.10 - 31.19 44.57
Zion Urban 28.13 25.52 22.64 223 22.83 30.32 56.62 1.07 24.77 26.32 41.26
Coeffcient of Number Price-related Coefficient of
Geographic Adjusted Dispersion of Ratio Differential Concentration
Area Median Median (COD) Sales 1st 3rd Range (PRD) (COC)
Assessment Ratios 2016
Quartiles
0.95
Confidence
Interval
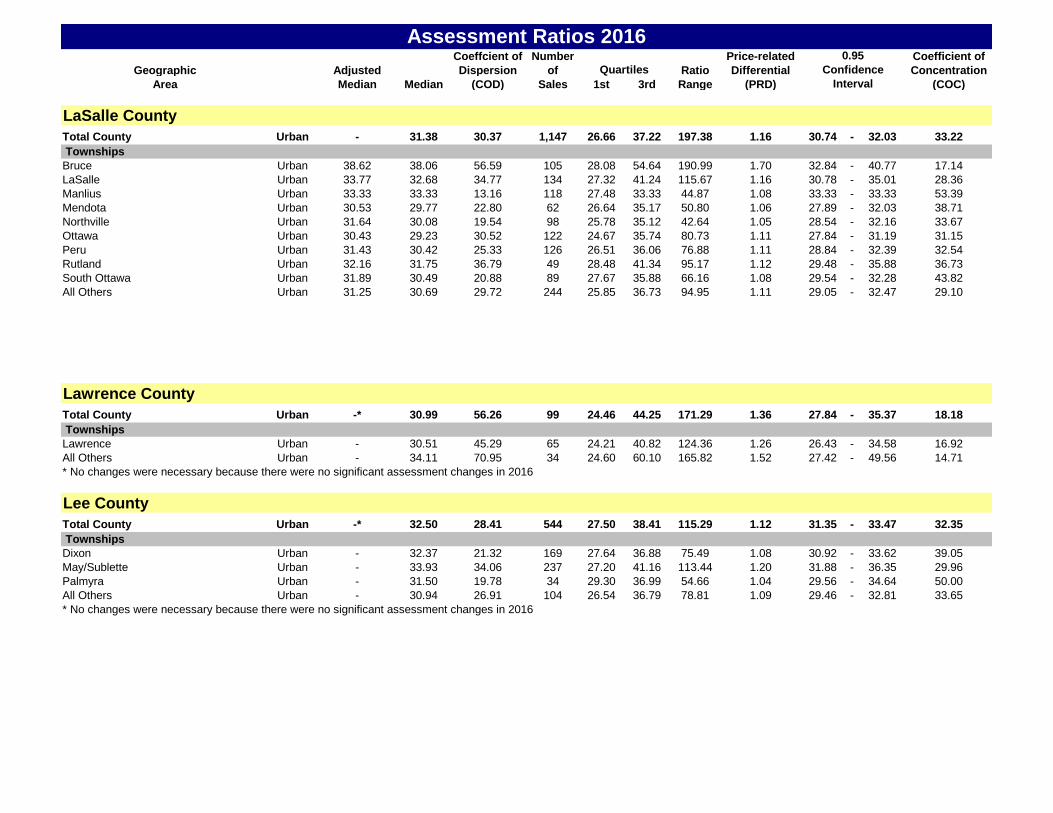
LaSalle County
Total County Urban - 31.38 30.37 1,147 26.66 37.22 197.38 1.16 30.74 - 32.03 33.22
Townships
Bruce Urban 38.62 38.06 56.59 105 28.08 54.64 190.99 1.70 32.84 - 40.77 17.14
LaSalle Urban 33.77 32.68 34.77 134 27.32 41.24 115.67 1.16 30.78 - 35.01 28.36
Manlius Urban 33.33 33.33 13.16 118 27.48 33.33 44.87 1.08 33.33 - 33.33 53.39
Mendota Urban 30.53 29.77 22.80 62 26.64 35.17 50.80 1.06 27.89 - 32.03 38.71
Northville Urban 31.64 30.08 19.54 98 25.78 35.12 42.64 1.05 28.54 - 32.16 33.67
Ottawa Urban 30.43 29.23 30.52 122 24.67 35.74 80.73 1.11 27.84 - 31.19 31.15
Peru Urban 31.43 30.42 25.33 126 26.51 36.06 76.88 1.11 28.84 - 32.39 32.54
Rutland Urban 32.16 31.75 36.79 49 28.48 41.34 95.17 1.12 29.48 - 35.88 36.73
South Ottawa Urban 31.89 30.49 20.88 89 27.67 35.88 66.16 1.08 29.54 - 32.28 43.82
All Others Urban 31.25 30.69 29.72 244 25.85 36.73 94.95 1.11 29.05 - 32.47 29.10
Lawrence County
Total County Urban -* 30.99 56.26 99 24.46 44.25 171.29 1.36 27.84 - 35.37 18.18
Townships
Lawrence Urban - 30.51 45.29 65 24.21 40.82 124.36 1.26 26.43 - 34.58 16.92
All Others Urban - 34.11 70.95 34 24.60 60.10 165.82 1.52 27.42 - 49.56 14.71
Lee County
Total County Urban -* 32.50 28.41 544 27.50 38.41 115.29 1.12 31.35 - 33.47 32.35
Townships
Dixon Urban - 32.37 21.32 169 27.64 36.88 75.49 1.08 30.92 - 33.62 39.05
May/Sublette Urban - 33.93 34.06 237 27.20 41.16 113.44 1.20 31.88 - 36.35 29.96
Palmyra Urban - 31.50 19.78 34 29.30 36.99 54.66 1.04 29.56 - 34.64 50.00
All Others Urban - 30.94 26.91 104 26.54 36.79 78.81 1.09 29.46 - 32.81 33.65
* No changes were necessary because there were no significant assessment changes in 2016
* No changes were necessary because there were no significant assessment changes in 2016
Coeffcient of Number Price-related Coefficient of
Geographic Adjusted Dispersion of Ratio Differential Concentration
Area Median Median (COD) Sales 1st 3rd Range (PRD) (COC)
Assessment Ratios 2016
Quartiles
0.95
Confidence
Interval
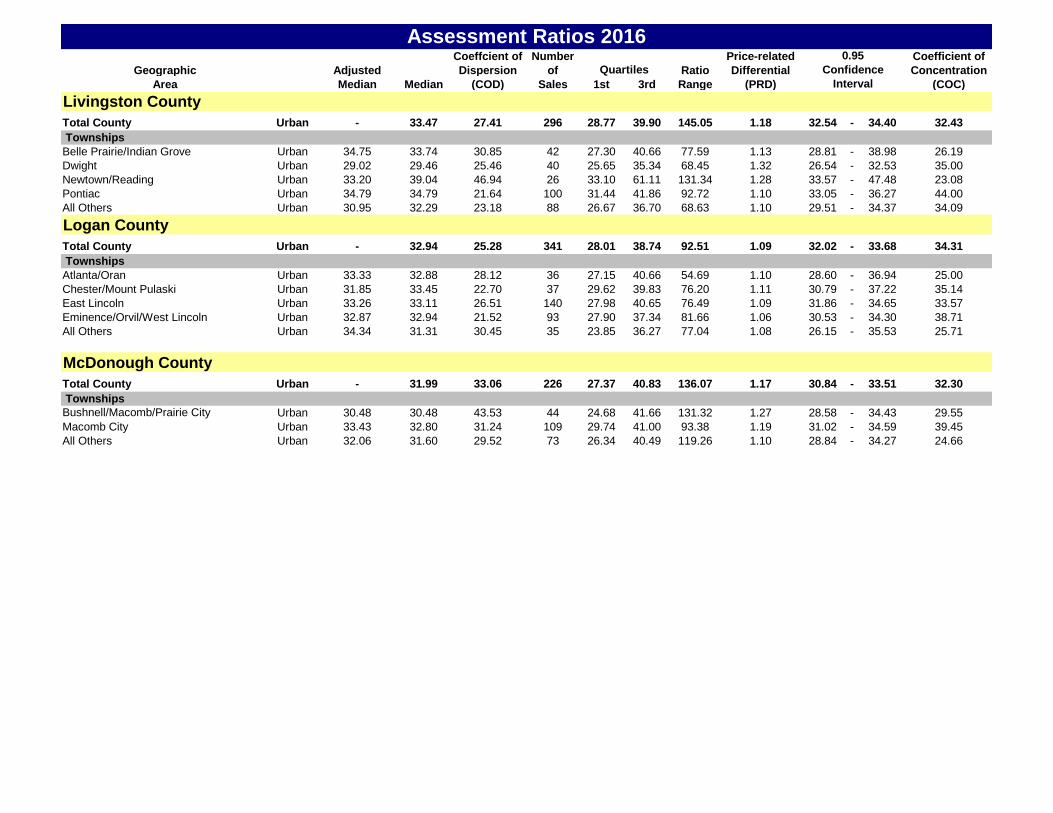
Livingston County
Total County Urban - 33.47 27.41 296 28.77 39.90 145.05 1.18 32.54 - 34.40 32.43
Townships
Belle Prairie/Indian Grove Urban 34.75 33.74 30.85 42 27.30 40.66 77.59 1.13 28.81 - 38.98 26.19
Dwight Urban 29.02 29.46 25.46 40 25.65 35.34 68.45 1.32 26.54 - 32.53 35.00
Newtown/Reading Urban 33.20 39.04 46.94 26 33.10 61.11 131.34 1.28 33.57 - 47.48 23.08
Pontiac Urban 34.79 34.79 21.64 100 31.44 41.86 92.72 1.10 33.05 - 36.27 44.00
All Others Urban 30.95 32.29 23.18 88 26.67 36.70 68.63 1.10 29.51 - 34.37 34.09
Logan County
Total County Urban - 32.94 25.28 341 28.01 38.74 92.51 1.09 32.02 - 33.68 34.31
Townships
Atlanta/Oran Urban 33.33 32.88 28.12 36 27.15 40.66 54.69 1.10 28.60 - 36.94 25.00
Chester/Mount Pulaski Urban 31.85 33.45 22.70 37 29.62 39.83 76.20 1.11 30.79 - 37.22 35.14
East Lincoln Urban 33.26 33.11 26.51 140 27.98 40.65 76.49 1.09 31.86 - 34.65 33.57
Eminence/Orvil/West Lincoln Urban 32.87 32.94 21.52 93 27.90 37.34 81.66 1.06 30.53 - 34.30 38.71
All Others Urban 34.34 31.31 30.45 35 23.85 36.27 77.04 1.08 26.15 - 35.53 25.71
McDonough County
Total County Urban - 31.99 33.06 226 27.37 40.83 136.07 1.17 30.84 - 33.51 32.30
Townships
Bushnell/Macomb/Prairie City Urban 30.48 30.48 43.53 44 24.68 41.66 131.32 1.27 28.58 - 34.43 29.55
Macomb City Urban 33.43 32.80 31.24 109 29.74 41.00 93.38 1.19 31.02 - 34.59 39.45
All Others Urban 32.06 31.60 29.52 73 26.34 40.49 119.26 1.10 28.84 - 34.27 24.66
Coeffcient of Number Price-related Coefficient of
Geographic Adjusted Dispersion of Ratio Differential Concentration
Area Median Median (COD) Sales 1st 3rd Range (PRD) (COC)
Assessment Ratios 2016
Quartiles
0.95
Confidence
Interval
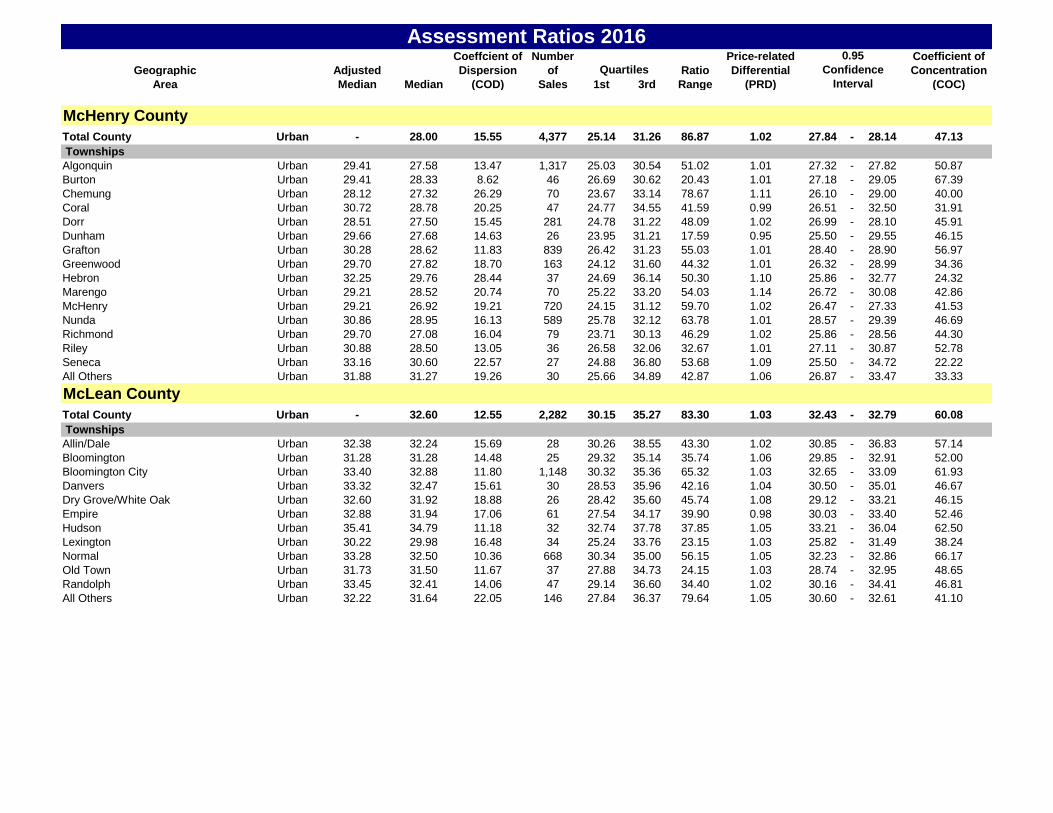
McHenry County
Total County Urban - 28.00 15.55 4,377 25.14 31.26 86.87 1.02 27.84 - 28.14 47.13
Townships
Algonquin Urban 29.41 27.58 13.47 1,317 25.03 30.54 51.02 1.01 27.32 - 27.82 50.87
Burton Urban 29.41 28.33 8.62 46 26.69 30.62 20.43 1.01 27.18 - 29.05 67.39
Chemung Urban 28.12 27.32 26.29 70 23.67 33.14 78.67 1.11 26.10 - 29.00 40.00
Coral Urban 30.72 28.78 20.25 47 24.77 34.55 41.59 0.99 26.51 - 32.50 31.91
Dorr Urban 28.51 27.50 15.45 281 24.78 31.22 48.09 1.02 26.99 - 28.10 45.91
Dunham Urban 29.66 27.68 14.63 26 23.95 31.21 17.59 0.95 25.50 - 29.55 46.15
Grafton Urban 30.28 28.62 11.83 839 26.42 31.23 55.03 1.01 28.40 - 28.90 56.97
Greenwood Urban 29.70 27.82 18.70 163 24.12 31.60 44.32 1.01 26.32 - 28.99 34.36
Hebron Urban 32.25 29.76 28.44 37 24.69 36.14 50.30 1.10 25.86 - 32.77 24.32
Marengo Urban 29.21 28.52 20.74 70 25.22 33.20 54.03 1.14 26.72 - 30.08 42.86
McHenry Urban 29.21 26.92 19.21 720 24.15 31.12 59.70 1.02 26.47 - 27.33 41.53
Nunda Urban 30.86 28.95 16.13 589 25.78 32.12 63.78 1.01 28.57 - 29.39 46.69
Richmond Urban 29.70 27.08 16.04 79 23.71 30.13 46.29 1.02 25.86 - 28.56 44.30
Riley Urban 30.88 28.50 13.05 36 26.58 32.06 32.67 1.01 27.11 - 30.87 52.78
Seneca Urban 33.16 30.60 22.57 27 24.88 36.80 53.68 1.09 25.50 - 34.72 22.22
All Others Urban 31.88 31.27 19.26 30 25.66 34.89 42.87 1.06 26.87 - 33.47 33.33
McLean County
Total County Urban - 32.60 12.55 2,282 30.15 35.27 83.30 1.03 32.43 - 32.79 60.08
Townships
Allin/Dale Urban 32.38 32.24 15.69 28 30.26 38.55 43.30 1.02 30.85 - 36.83 57.14
Bloomington Urban 31.28 31.28 14.48 25 29.32 35.14 35.74 1.06 29.85 - 32.91 52.00
Bloomington City Urban 33.40 32.88 11.80 1,148 30.32 35.36 65.32 1.03 32.65 - 33.09 61.93
Danvers Urban 33.32 32.47 15.61 30 28.53 35.96 42.16 1.04 30.50 - 35.01 46.67
Dry Grove/White Oak Urban 32.60 31.92 18.88 26 28.42 35.60 45.74 1.08 29.12 - 33.21 46.15
Empire Urban 32.88 31.94 17.06 61 27.54 34.17 39.90 0.98 30.03 - 33.40 52.46
Hudson Urban 35.41 34.79 11.18 32 32.74 37.78 37.85 1.05 33.21 - 36.04 62.50
Lexington Urban 30.22 29.98 16.48 34 25.24 33.76 23.15 1.03 25.82 - 31.49 38.24
Normal Urban 33.28 32.50 10.36 668 30.34 35.00 56.15 1.05 32.23 - 32.86 66.17
Old Town Urban 31.73 31.50 11.67 37 27.88 34.73 24.15 1.03 28.74 - 32.95 48.65
Randolph Urban 33.45 32.41 14.06 47 29.14 36.60 34.40 1.02 30.16 - 34.41 46.81
All Others Urban 32.22 31.64 22.05 146 27.84 36.37 79.64 1.05 30.60 - 32.61 41.10
Coeffcient of Number Price-related Coefficient of
Geographic Adjusted Dispersion of Ratio Differential Concentration
Area Median Median (COD) Sales 1st 3rd Range (PRD) (COC)
Assessment Ratios 2016
Quartiles
0.95
Confidence
Interval
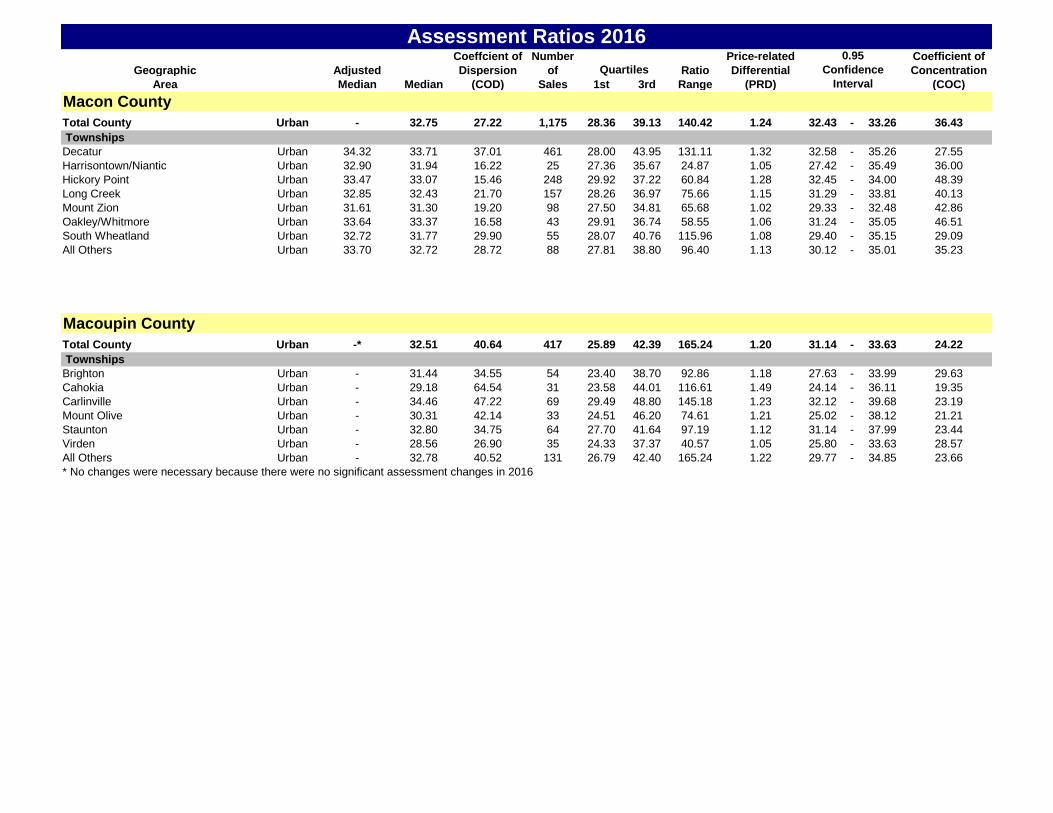
Macon County
Total County Urban - 32.75 27.22 1,175 28.36 39.13 140.42 1.24 32.43 - 33.26 36.43
Townships
Decatur Urban 34.32 33.71 37.01 461 28.00 43.95 131.11 1.32 32.58 - 35.26 27.55
Harrisontown/Niantic Urban 32.90 31.94 16.22 25 27.36 35.67 24.87 1.05 27.42 - 35.49 36.00
Hickory Point Urban 33.47 33.07 15.46 248 29.92 37.22 60.84 1.28 32.45 - 34.00 48.39
Long Creek Urban 32.85 32.43 21.70 157 28.26 36.97 75.66 1.15 31.29 - 33.81 40.13
Mount Zion Urban 31.61 31.30 19.20 98 27.50 34.81 65.68 1.02 29.33 - 32.48 42.86
Oakley/Whitmore Urban 33.64 33.37 16.58 43 29.91 36.74 58.55 1.06 31.24 - 35.05 46.51
South Wheatland Urban 32.72 31.77 29.90 55 28.07 40.76 115.96 1.08 29.40 - 35.15 29.09
All Others Urban 33.70 32.72 28.72 88 27.81 38.80 96.40 1.13 30.12 - 35.01 35.23
Macoupin County
Total County Urban -* 32.51 40.64 417 25.89 42.39 165.24 1.20 31.14 - 33.63 24.22
Townships
Brighton Urban - 31.44 34.55 54 23.40 38.70 92.86 1.18 27.63 - 33.99 29.63
Cahokia Urban - 29.18 64.54 31 23.58 44.01 116.61 1.49 24.14 - 36.11 19.35
Carlinville Urban - 34.46 47.22 69 29.49 48.80 145.18 1.23 32.12 - 39.68 23.19
Mount Olive Urban - 30.31 42.14 33 24.51 46.20 74.61 1.21 25.02 - 38.12 21.21
Staunton Urban - 32.80 34.75 64 27.70 41.64 97.19 1.12 31.14 - 37.99 23.44
Virden Urban - 28.56 26.90 35 24.33 37.37 40.57 1.05 25.80 - 33.63 28.57
All Others Urban - 32.78 40.52 131 26.79 42.40 165.24 1.22 29.77 - 34.85 23.66
* No changes were necessary because there were no significant assessment changes in 2016
Coeffcient of Number Price-related Coefficient of
Geographic Adjusted Dispersion of Ratio Differential Concentration
Area Median Median (COD) Sales 1st 3rd Range (PRD) (COC)
Assessment Ratios 2016
Quartiles
0.95
Confidence
Interval
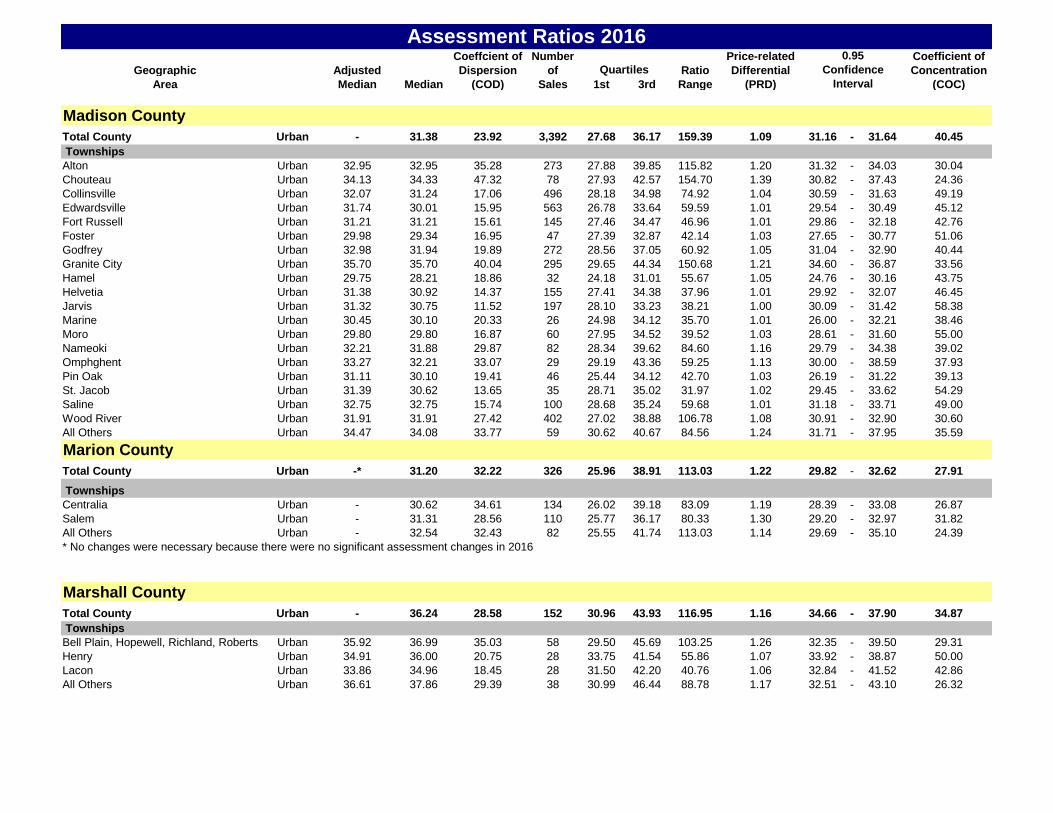
Madison County
Total County Urban - 31.38 23.92 3,392 27.68 36.17 159.39 1.09 31.16 - 31.64 40.45
Townships
Alton Urban 32.95 32.95 35.28 273 27.88 39.85 115.82 1.20 31.32 - 34.03 30.04
Chouteau Urban 34.13 34.33 47.32 78 27.93 42.57 154.70 1.39 30.82 - 37.43 24.36
Collinsville Urban 32.07 31.24 17.06 496 28.18 34.98 74.92 1.04 30.59 - 31.63 49.19
Edwardsville Urban 31.74 30.01 15.95 563 26.78 33.64 59.59 1.01 29.54 - 30.49 45.12
Fort Russell Urban 31.21 31.21 15.61 145 27.46 34.47 46.96 1.01 29.86 - 32.18 42.76
Foster Urban 29.98 29.34 16.95 47 27.39 32.87 42.14 1.03 27.65 - 30.77 51.06
Godfrey Urban 32.98 31.94 19.89 272 28.56 37.05 60.92 1.05 31.04 - 32.90 40.44
Granite City Urban 35.70 35.70 40.04 295 29.65 44.34 150.68 1.21 34.60 - 36.87 33.56
Hamel Urban 29.75 28.21 18.86 32 24.18 31.01 55.67 1.05 24.76 - 30.16 43.75
Helvetia Urban 31.38 30.92 14.37 155 27.41 34.38 37.96 1.01 29.92 - 32.07 46.45
Jarvis Urban 31.32 30.75 11.52 197 28.10 33.23 38.21 1.00 30.09 - 31.42 58.38
Marine Urban 30.45 30.10 20.33 26 24.98 34.12 35.70 1.01 26.00 - 32.21 38.46
Moro Urban 29.80 29.80 16.87 60 27.95 34.52 39.52 1.03 28.61 - 31.60 55.00
Nameoki Urban 32.21 31.88 29.87 82 28.34 39.62 84.60 1.16 29.79 - 34.38 39.02
Omphghent Urban 33.27 32.21 33.07 29 29.19 43.36 59.25 1.13 30.00 - 38.59 37.93
Pin Oak Urban 31.11 30.10 19.41 46 25.44 34.12 42.70 1.03 26.19 - 31.22 39.13
St. Jacob Urban 31.39 30.62 13.65 35 28.71 35.02 31.97 1.02 29.45 - 33.62 54.29
Saline Urban 32.75 32.75 15.74 100 28.68 35.24 59.68 1.01 31.18 - 33.71 49.00
Wood River Urban 31.91 31.91 27.42 402 27.02 38.88 106.78 1.08 30.91 - 32.90 30.60
All Others Urban 34.47 34.08 33.77 59 30.62 40.67 84.56 1.24 31.71 - 37.95 35.59
Marion County
Total County Urban -* 31.20 32.22 326 25.96 38.91 113.03 1.22 29.82 - 32.62 27.91
Townships
Centralia Urban - 30.62 34.61 134 26.02 39.18 83.09 1.19 28.39 - 33.08 26.87
Salem Urban - 31.31 28.56 110 25.77 36.17 80.33 1.30 29.20 - 32.97 31.82
All Others Urban - 32.54 32.43 82 25.55 41.74 113.03 1.14 29.69 - 35.10 24.39
Marshall County
Total County Urban - 36.24 28.58 152 30.96 43.93 116.95 1.16 34.66 - 37.90 34.87
Townships
Bell Plain, Hopewell, Richland, Roberts Urban 35.92 36.99 35.03 58 29.50 45.69 103.25 1.26 32.35 - 39.50 29.31
Henry Urban 34.91 36.00 20.75 28 33.75 41.54 55.86 1.07 33.92 - 38.87 50.00
Lacon Urban 33.86 34.96 18.45 28 31.50 42.20 40.76 1.06 32.84 - 41.52 42.86
All Others Urban 36.61 37.86 29.39 38 30.99 46.44 88.78 1.17 32.51 - 43.10 26.32
* No changes were necessary because there were no significant assessment changes in 2016
Coeffcient of Number Price-related Coefficient of
Geographic Adjusted Dispersion of Ratio Differential Concentration
Area Median Median (COD) Sales 1st 3rd Range (PRD) (COC)
Assessment Ratios 2016
Quartiles
0.95
Confidence
Interval
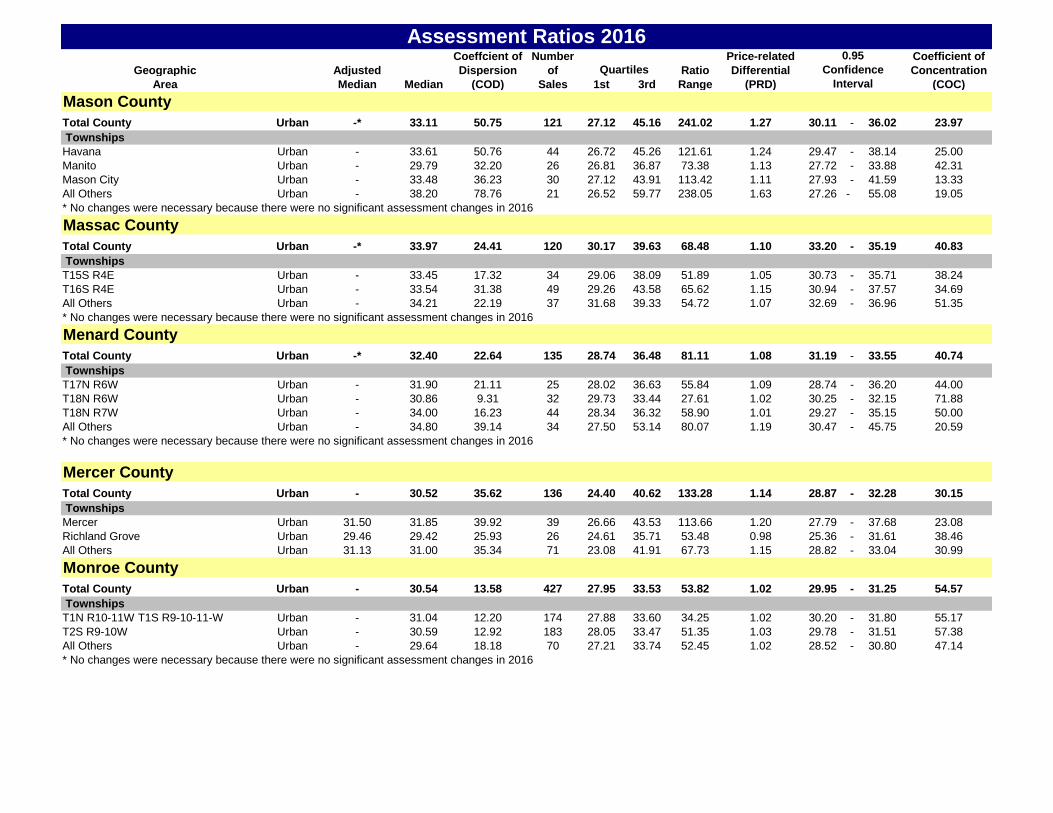
Mason County
Total County Urban -* 33.11 50.75 121 27.12 45.16 241.02 1.27 30.11 - 36.02 23.97
Townships
Havana Urban - 33.61 50.76 44 26.72 45.26 121.61 1.24 29.47 - 38.14 25.00
Manito Urban - 29.79 32.20 26 26.81 36.87 73.38 1.13 27.72 - 33.88 42.31
Mason City Urban - 33.48 36.23 30 27.12 43.91 113.42 1.11 27.93 - 41.59 13.33
All Others Urban - 38.20 78.76 21 26.52 59.77 238.05 1.63 27.26 - 55.08 19.05
* No changes were necessary because there were no significant assessment changes in 2016
Massac County
Total County Urban -* 33.97 24.41 120 30.17 39.63 68.48 1.10 33.20 - 35.19 40.83
Townships
T15S R4E Urban - 33.45 17.32 34 29.06 38.09 51.89 1.05 30.73 - 35.71 38.24
T16S R4E Urban - 33.54 31.38 49 29.26 43.58 65.62 1.15 30.94 - 37.57 34.69
All Others Urban - 34.21 22.19 37 31.68 39.33 54.72 1.07 32.69 - 36.96 51.35
* No changes were necessary because there were no significant assessment changes in 2016
Menard County
Total County Urban -* 32.40 22.64 135 28.74 36.48 81.11 1.08 31.19 - 33.55 40.74
Townships
T17N R6W Urban - 31.90 21.11 25 28.02 36.63 55.84 1.09 28.74 - 36.20 44.00
T18N R6W Urban - 30.86 9.31 32 29.73 33.44 27.61 1.02 30.25 - 32.15 71.88
T18N R7W Urban - 34.00 16.23 44 28.34 36.32 58.90 1.01 29.27 - 35.15 50.00
All Others Urban - 34.80 39.14 34 27.50 53.14 80.07 1.19 30.47 - 45.75 20.59
* No changes were necessary because there were no significant assessment changes in 2016
Mercer County
Total County Urban - 30.52 35.62 136 24.40 40.62 133.28 1.14 28.87 - 32.28 30.15
Townships
Mercer Urban 31.50 31.85 39.92 39 26.66 43.53 113.66 1.20 27.79 - 37.68 23.08
Richland Grove Urban 29.46 29.42 25.93 26 24.61 35.71 53.48 0.98 25.36 - 31.61 38.46
All Others Urban 31.13 31.00 35.34 71 23.08 41.91 67.73 1.15 28.82 - 33.04 30.99
Monroe County
Total County Urban - 30.54 13.58 427 27.95 33.53 53.82 1.02 29.95 - 31.25 54.57
Townships
T1N R10-11W T1S R9-10-11-W Urban - 31.04 12.20 174 27.88 33.60 34.25 1.02 30.20 - 31.80 55.17
T2S R9-10W Urban - 30.59 12.92 183 28.05 33.47 51.35 1.03 29.78 - 31.51 57.38
All Others Urban - 29.64 18.18 70 27.21 33.74 52.45 1.02 28.52 - 30.80 47.14
* No changes were necessary because there were no significant assessment changes in 2016
Coeffcient of Number Price-related Coefficient of
Geographic Adjusted Dispersion of Ratio Differential Concentration
Area Median Median (COD) Sales 1st 3rd Range (PRD) (COC)
Assessment Ratios 2016
Quartiles
0.95
Confidence
Interval
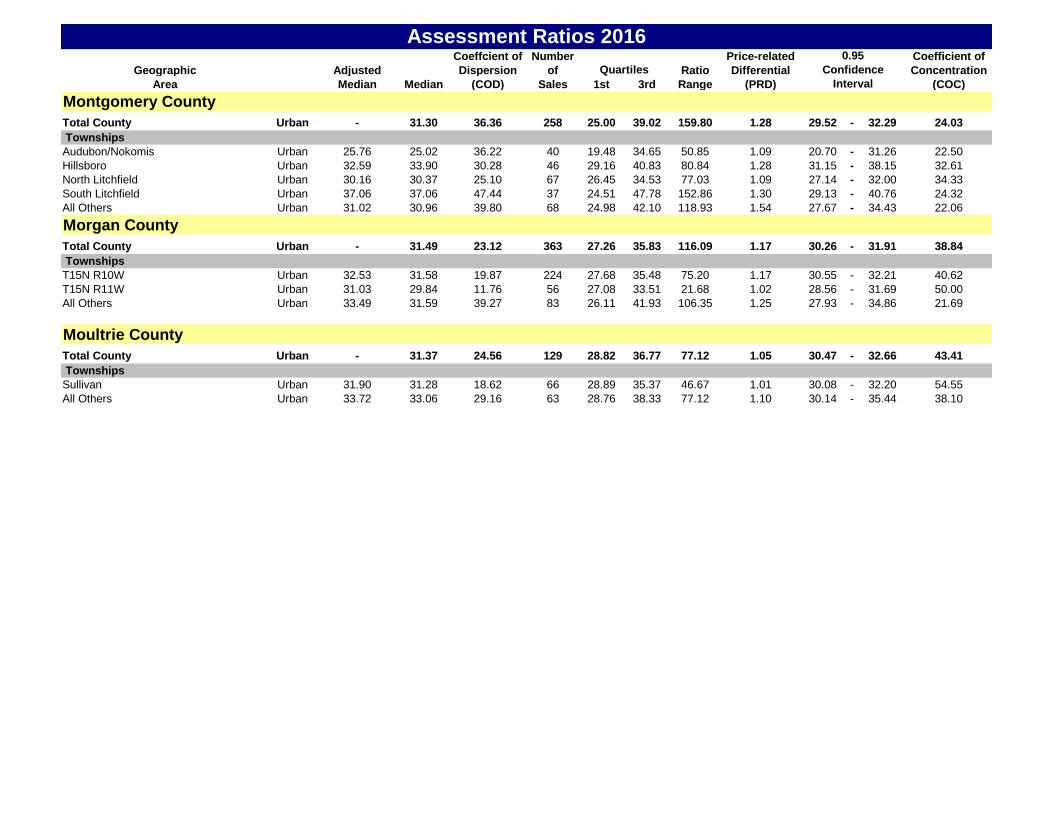
Montgomery County
Total County Urban - 31.30 36.36 258 25.00 39.02 159.80 1.28 29.52 - 32.29 24.03
Townships
Audubon/Nokomis Urban 25.76 25.02 36.22 40 19.48 34.65 50.85 1.09 20.70 - 31.26 22.50
Hillsboro Urban 32.59 33.90 30.28 46 29.16 40.83 80.84 1.28 31.15 - 38.15 32.61
North Litchfield Urban 30.16 30.37 25.10 67 26.45 34.53 77.03 1.09 27.14 - 32.00 34.33
South Litchfield Urban 37.06 37.06 47.44 37 24.51 47.78 152.86 1.30 29.13 - 40.76 24.32
All Others Urban 31.02 30.96 39.80 68 24.98 42.10 118.93 1.54 27.67 - 34.43 22.06
Morgan County
Total County Urban - 31.49 23.12 363 27.26 35.83 116.09 1.17 30.26 - 31.91 38.84
Townships
T15N R10W Urban 32.53 31.58 19.87 224 27.68 35.48 75.20 1.17 30.55 - 32.21 40.62
T15N R11W Urban 31.03 29.84 11.76 56 27.08 33.51 21.68 1.02 28.56 - 31.69 50.00
All Others Urban 33.49 31.59 39.27 83 26.11 41.93 106.35 1.25 27.93 - 34.86 21.69
Moultrie County
Total County Urban - 31.37 24.56 129 28.82 36.77 77.12 1.05 30.47 - 32.66 43.41
Townships
Sullivan Urban 31.90 31.28 18.62 66 28.89 35.37 46.67 1.01 30.08 - 32.20 54.55
All Others Urban 33.72 33.06 29.16 63 28.76 38.33 77.12 1.10 30.14 - 35.44 38.10
Coeffcient of Number Price-related Coefficient of
Geographic Adjusted Dispersion of Ratio Differential Concentration
Area Median Median (COD) Sales 1st 3rd Range (PRD) (COC)
Assessment Ratios 2016
Quartiles
0.95
Confidence
Interval
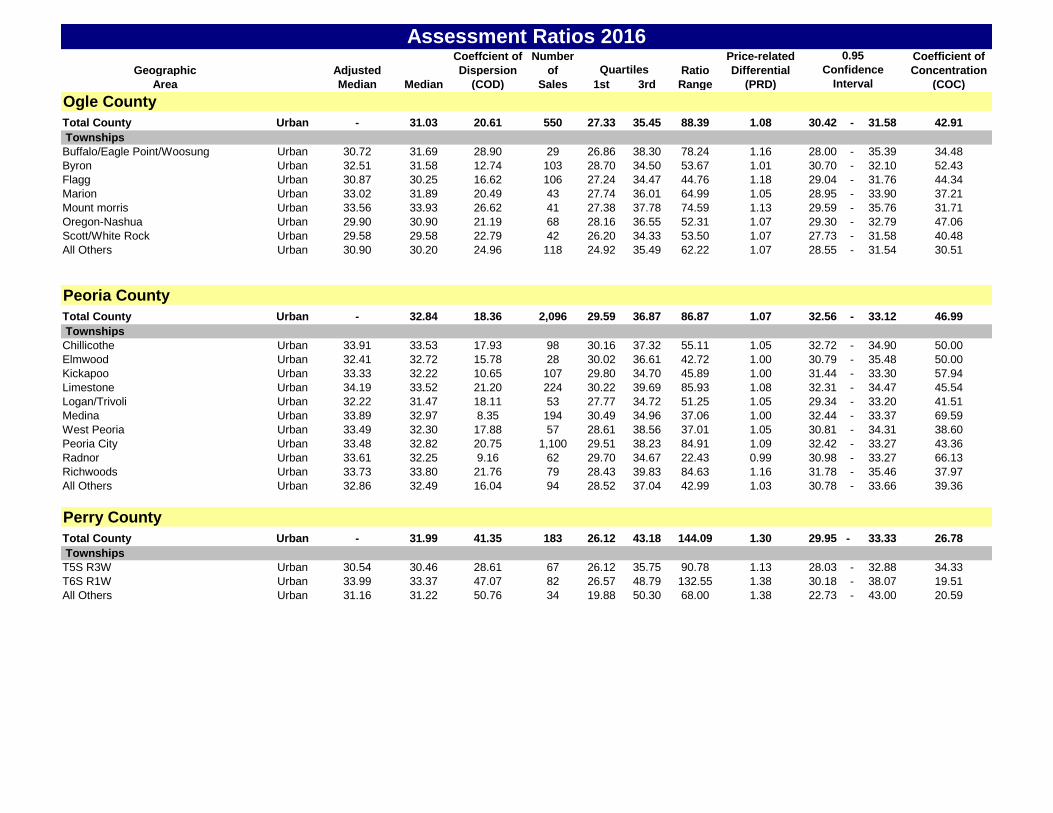
Ogle County
Total County Urban - 31.03 20.61 550 27.33 35.45 88.39 1.08 30.42 - 31.58 42.91
Townships
Buffalo/Eagle Point/Woosung Urban 30.72 31.69 28.90 29 26.86 38.30 78.24 1.16 28.00 - 35.39 34.48
Byron Urban 32.51 31.58 12.74 103 28.70 34.50 53.67 1.01 30.70 - 32.10 52.43
Flagg Urban 30.87 30.25 16.62 106 27.24 34.47 44.76 1.18 29.04 - 31.76 44.34
Marion Urban 33.02 31.89 20.49 43 27.74 36.01 64.99 1.05 28.95 - 33.90 37.21
Mount morris Urban 33.56 33.93 26.62 41 27.38 37.78 74.59 1.13 29.59 - 35.76 31.71
Oregon-Nashua Urban 29.90 30.90 21.19 68 28.16 36.55 52.31 1.07 29.30 - 32.79 47.06
Scott/White Rock Urban 29.58 29.58 22.79 42 26.20 34.33 53.50 1.07 27.73 - 31.58 40.48
All Others Urban 30.90 30.20 24.96 118 24.92 35.49 62.22 1.07 28.55 - 31.54 30.51
Peoria County
Total County Urban - 32.84 18.36 2,096 29.59 36.87 86.87 1.07 32.56 - 33.12 46.99
Townships
Chillicothe Urban 33.91 33.53 17.93 98 30.16 37.32 55.11 1.05 32.72 - 34.90 50.00
Elmwood Urban 32.41 32.72 15.78 28 30.02 36.61 42.72 1.00 30.79 - 35.48 50.00
Kickapoo Urban 33.33 32.22 10.65 107 29.80 34.70 45.89 1.00 31.44 - 33.30 57.94
Limestone Urban 34.19 33.52 21.20 224 30.22 39.69 85.93 1.08 32.31 - 34.47 45.54
Logan/Trivoli Urban 32.22 31.47 18.11 53 27.77 34.72 51.25 1.05 29.34 - 33.20 41.51
Medina Urban 33.89 32.97 8.35 194 30.49 34.96 37.06 1.00 32.44 - 33.37 69.59
West Peoria Urban 33.49 32.30 17.88 57 28.61 38.56 37.01 1.05 30.81 - 34.31 38.60
Peoria City Urban 33.48 32.82 20.75 1,100 29.51 38.23 84.91 1.09 32.42 - 33.27 43.36
Radnor Urban 33.61 32.25 9.16 62 29.70 34.67 22.43 0.99 30.98 - 33.27 66.13
Richwoods Urban 33.73 33.80 21.76 79 28.43 39.83 84.63 1.16 31.78 - 35.46 37.97
All Others Urban 32.86 32.49 16.04 94 28.52 37.04 42.99 1.03 30.78 - 33.66 39.36
Perry County
Total County Urban - 31.99 41.35 183 26.12 43.18 144.09 1.30 29.95 - 33.33 26.78
Townships
T5S R3W Urban 30.54 30.46 28.61 67 26.12 35.75 90.78 1.13 28.03 - 32.88 34.33
T6S R1W Urban 33.99 33.37 47.07 82 26.57 48.79 132.55 1.38 30.18 - 38.07 19.51
All Others Urban 31.16 31.22 50.76 34 19.88 50.30 68.00 1.38 22.73 - 43.00 20.59
Coeffcient of Number Price-related Coefficient of
Geographic Adjusted Dispersion of Ratio Differential Concentration
Area Median Median (COD) Sales 1st 3rd Range (PRD) (COC)
Assessment Ratios 2016
Quartiles
0.95
Confidence
Interval
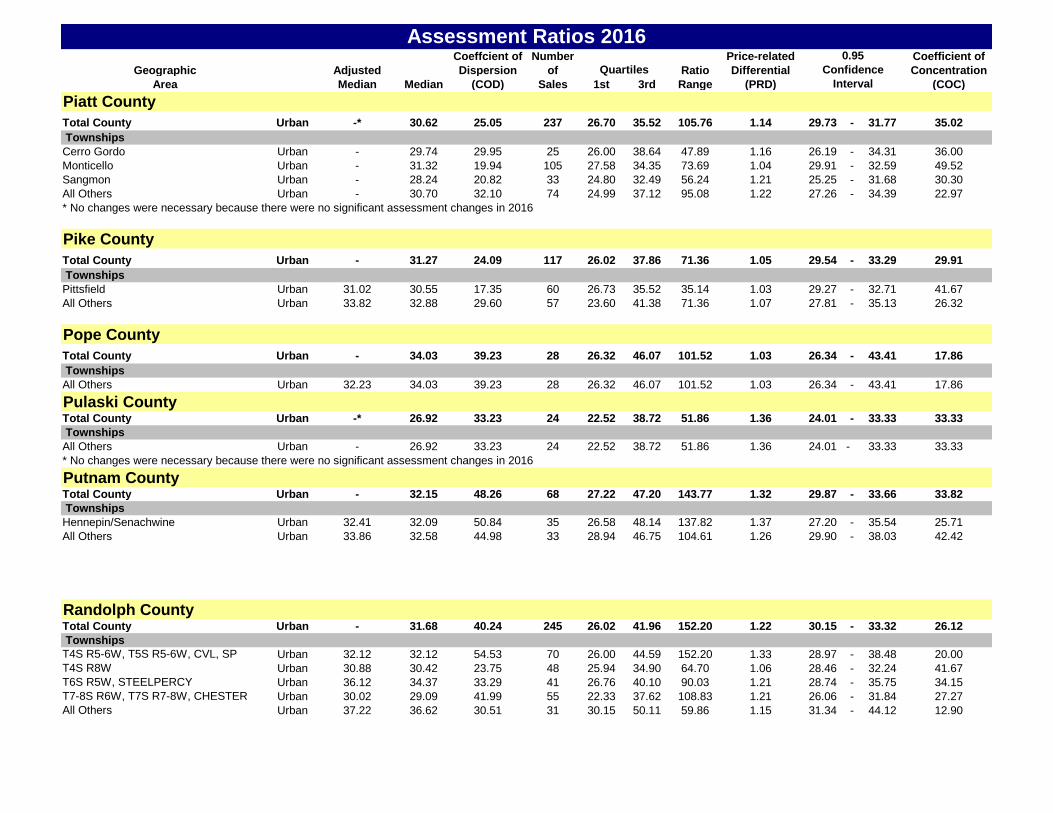
Piatt County
Total County Urban -* 30.62 25.05 237 26.70 35.52 105.76 1.14 29.73 - 31.77 35.02
Townships
Cerro Gordo Urban - 29.74 29.95 25 26.00 38.64 47.89 1.16 26.19 - 34.31 36.00
Monticello Urban - 31.32 19.94 105 27.58 34.35 73.69 1.04 29.91 - 32.59 49.52
Sangmon Urban - 28.24 20.82 33 24.80 32.49 56.24 1.21 25.25 - 31.68 30.30
All Others Urban - 30.70 32.10 74 24.99 37.12 95.08 1.22 27.26 - 34.39 22.97
* No changes were necessary because there were no significant assessment changes in 2016
Pike County
Total County Urban - 31.27 24.09 117 26.02 37.86 71.36 1.05 29.54 - 33.29 29.91
Townships
Pittsfield Urban 31.02 30.55 17.35 60 26.73 35.52 35.14 1.03 29.27 - 32.71 41.67
All Others Urban 33.82 32.88 29.60 57 23.60 41.38 71.36 1.07 27.81 - 35.13 26.32
Pope County
Total County Urban - 34.03 39.23 28 26.32 46.07 101.52 1.03 26.34 - 43.41 17.86
Townships
All Others Urban 32.23 34.03 39.23 28 26.32 46.07 101.52 1.03 26.34 - 43.41 17.86
Pulaski CountyTotal County Urban -* 26.92 33.23 24 22.52 38.72 51.86 1.36 24.01 - 33.33 33.33
Townships
All Others Urban - 26.92 33.23 24 22.52 38.72 51.86 1.36 24.01 - 33.33 33.33
Putnam CountyTotal County Urban - 32.15 48.26 68 27.22 47.20 143.77 1.32 29.87 - 33.66 33.82
Townships
Hennepin/Senachwine Urban 32.41 32.09 50.84 35 26.58 48.14 137.82 1.37 27.20 - 35.54 25.71
All Others Urban 33.86 32.58 44.98 33 28.94 46.75 104.61 1.26 29.90 - 38.03 42.42
Randolph CountyTotal County Urban - 31.68 40.24 245 26.02 41.96 152.20 1.22 30.15 - 33.32 26.12
Townships
T4S R5-6W, T5S R5-6W, CVL, SP Urban 32.12 32.12 54.53 70 26.00 44.59 152.20 1.33 28.97 - 38.48 20.00
T4S R8W Urban 30.88 30.42 23.75 48 25.94 34.90 64.70 1.06 28.46 - 32.24 41.67
T6S R5W, STEELPERCY Urban 36.12 34.37 33.29 41 26.76 40.10 90.03 1.21 28.74 - 35.75 34.15
T7-8S R6W, T7S R7-8W, CHESTER Urban 30.02 29.09 41.99 55 22.33 37.62 108.83 1.21 26.06 - 31.84 27.27
All Others Urban 37.22 36.62 30.51 31 30.15 50.11 59.86 1.15 31.34 - 44.12 12.90
* No changes were necessary because there were no significant assessment changes in 2016
Coeffcient of Number Price-related Coefficient of
Geographic Adjusted Dispersion of Ratio Differential Concentration
Area Median Median (COD) Sales 1st 3rd Range (PRD) (COC)
Assessment Ratios 2016
Quartiles
0.95
Confidence
Interval
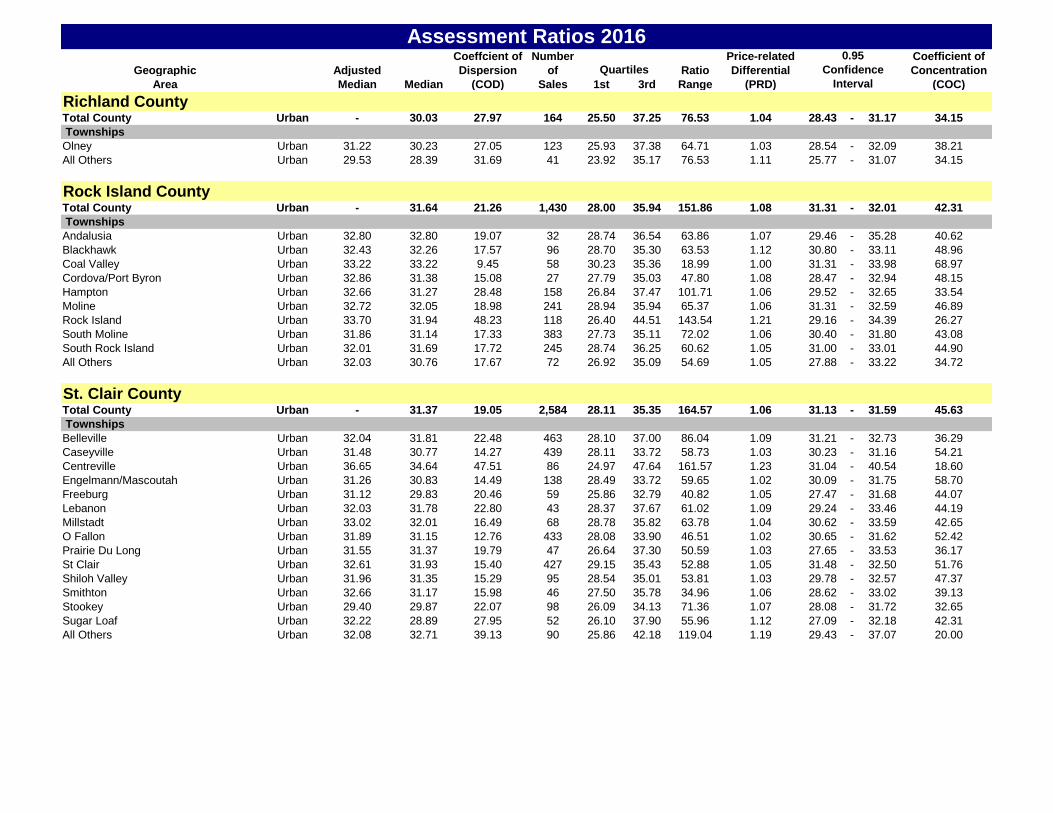
Richland CountyTotal County Urban - 30.03 27.97 164 25.50 37.25 76.53 1.04 28.43 - 31.17 34.15
Townships
Olney Urban 31.22 30.23 27.05 123 25.93 37.38 64.71 1.03 28.54 - 32.09 38.21
All Others Urban 29.53 28.39 31.69 41 23.92 35.17 76.53 1.11 25.77 - 31.07 34.15
Rock Island CountyTotal County Urban - 31.64 21.26 1,430 28.00 35.94 151.86 1.08 31.31 - 32.01 42.31
Townships
Andalusia Urban 32.80 32.80 19.07 32 28.74 36.54 63.86 1.07 29.46 - 35.28 40.62
Blackhawk Urban 32.43 32.26 17.57 96 28.70 35.30 63.53 1.12 30.80 - 33.11 48.96
Coal Valley Urban 33.22 33.22 9.45 58 30.23 35.36 18.99 1.00 31.31 - 33.98 68.97
Cordova/Port Byron Urban 32.86 31.38 15.08 27 27.79 35.03 47.80 1.08 28.47 - 32.94 48.15
Hampton Urban 32.66 31.27 28.48 158 26.84 37.47 101.71 1.06 29.52 - 32.65 33.54
Moline Urban 32.72 32.05 18.98 241 28.94 35.94 65.37 1.06 31.31 - 32.59 46.89
Rock Island Urban 33.70 31.94 48.23 118 26.40 44.51 143.54 1.21 29.16 - 34.39 26.27
South Moline Urban 31.86 31.14 17.33 383 27.73 35.11 72.02 1.06 30.40 - 31.80 43.08
South Rock Island Urban 32.01 31.69 17.72 245 28.74 36.25 60.62 1.05 31.00 - 33.01 44.90
All Others Urban 32.03 30.76 17.67 72 26.92 35.09 54.69 1.05 27.88 - 33.22 34.72
St. Clair CountyTotal County Urban - 31.37 19.05 2,584 28.11 35.35 164.57 1.06 31.13 - 31.59 45.63
Townships
Belleville Urban 32.04 31.81 22.48 463 28.10 37.00 86.04 1.09 31.21 - 32.73 36.29
Caseyville Urban 31.48 30.77 14.27 439 28.11 33.72 58.73 1.03 30.23 - 31.16 54.21
Centreville Urban 36.65 34.64 47.51 86 24.97 47.64 161.57 1.23 31.04 - 40.54 18.60
Engelmann/Mascoutah Urban 31.26 30.83 14.49 138 28.49 33.72 59.65 1.02 30.09 - 31.75 58.70
Freeburg Urban 31.12 29.83 20.46 59 25.86 32.79 40.82 1.05 27.47 - 31.68 44.07
Lebanon Urban 32.03 31.78 22.80 43 28.37 37.67 61.02 1.09 29.24 - 33.46 44.19
Millstadt Urban 33.02 32.01 16.49 68 28.78 35.82 63.78 1.04 30.62 - 33.59 42.65
O Fallon Urban 31.89 31.15 12.76 433 28.08 33.90 46.51 1.02 30.65 - 31.62 52.42
Prairie Du Long Urban 31.55 31.37 19.79 47 26.64 37.30 50.59 1.03 27.65 - 33.53 36.17
St Clair Urban 32.61 31.93 15.40 427 29.15 35.43 52.88 1.05 31.48 - 32.50 51.76
Shiloh Valley Urban 31.96 31.35 15.29 95 28.54 35.01 53.81 1.03 29.78 - 32.57 47.37
Smithton Urban 32.66 31.17 15.98 46 27.50 35.78 34.96 1.06 28.62 - 33.02 39.13
Stookey Urban 29.40 29.87 22.07 98 26.09 34.13 71.36 1.07 28.08 - 31.72 32.65
Sugar Loaf Urban 32.22 28.89 27.95 52 26.10 37.90 55.96 1.12 27.09 - 32.18 42.31
All Others Urban 32.08 32.71 39.13 90 25.86 42.18 119.04 1.19 29.43 - 37.07 20.00
Coeffcient of Number Price-related Coefficient of
Geographic Adjusted Dispersion of Ratio Differential Concentration
Area Median Median (COD) Sales 1st 3rd Range (PRD) (COC)
Assessment Ratios 2016
Quartiles
0.95
Confidence
Interval
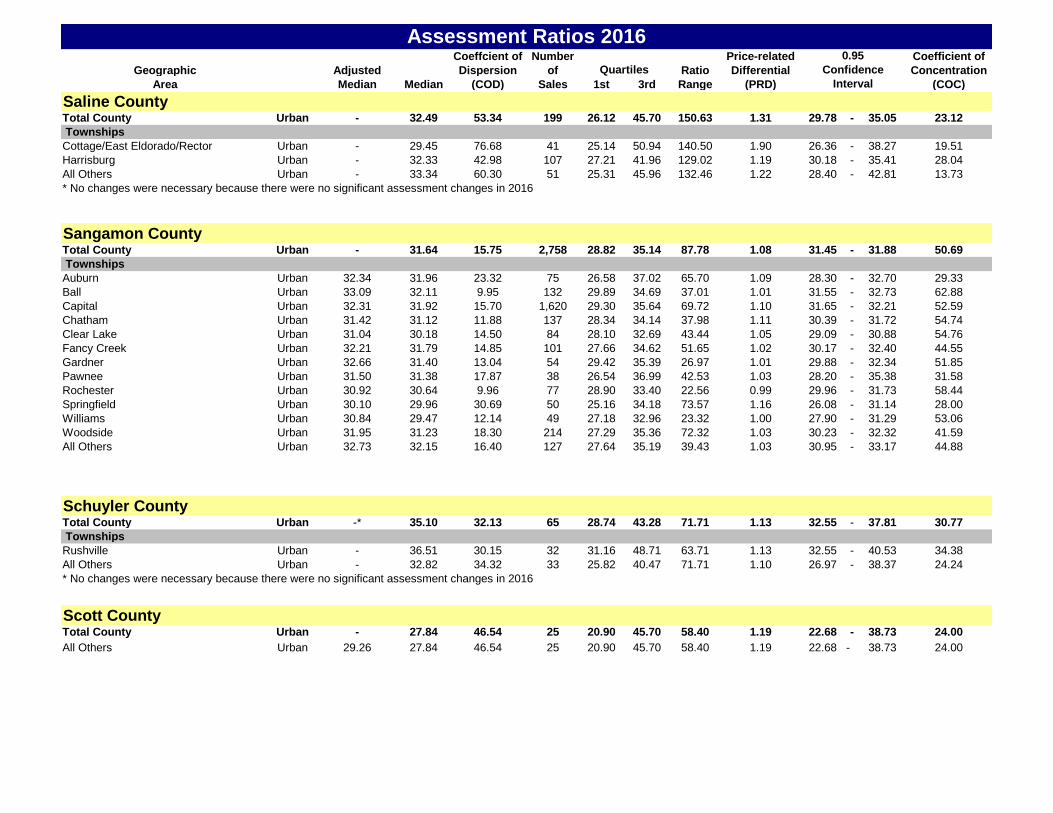
Saline CountyTotal County Urban - 32.49 53.34 199 26.12 45.70 150.63 1.31 29.78 - 35.05 23.12
Townships
Cottage/East Eldorado/Rector Urban - 29.45 76.68 41 25.14 50.94 140.50 1.90 26.36 - 38.27 19.51
Harrisburg Urban - 32.33 42.98 107 27.21 41.96 129.02 1.19 30.18 - 35.41 28.04
All Others Urban - 33.34 60.30 51 25.31 45.96 132.46 1.22 28.40 - 42.81 13.73
* No changes were necessary because there were no significant assessment changes in 2016
Sangamon CountyTotal County Urban - 31.64 15.75 2,758 28.82 35.14 87.78 1.08 31.45 - 31.88 50.69
Townships
Auburn Urban 32.34 31.96 23.32 75 26.58 37.02 65.70 1.09 28.30 - 32.70 29.33
Ball Urban 33.09 32.11 9.95 132 29.89 34.69 37.01 1.01 31.55 - 32.73 62.88
Capital Urban 32.31 31.92 15.70 1,620 29.30 35.64 69.72 1.10 31.65 - 32.21 52.59
Chatham Urban 31.42 31.12 11.88 137 28.34 34.14 37.98 1.11 30.39 - 31.72 54.74
Clear Lake Urban 31.04 30.18 14.50 84 28.10 32.69 43.44 1.05 29.09 - 30.88 54.76
Fancy Creek Urban 32.21 31.79 14.85 101 27.66 34.62 51.65 1.02 30.17 - 32.40 44.55
Gardner Urban 32.66 31.40 13.04 54 29.42 35.39 26.97 1.01 29.88 - 32.34 51.85
Pawnee Urban 31.50 31.38 17.87 38 26.54 36.99 42.53 1.03 28.20 - 35.38 31.58
Rochester Urban 30.92 30.64 9.96 77 28.90 33.40 22.56 0.99 29.96 - 31.73 58.44
Springfield Urban 30.10 29.96 30.69 50 25.16 34.18 73.57 1.16 26.08 - 31.14 28.00
Williams Urban 30.84 29.47 12.14 49 27.18 32.96 23.32 1.00 27.90 - 31.29 53.06
Woodside Urban 31.95 31.23 18.30 214 27.29 35.36 72.32 1.03 30.23 - 32.32 41.59
All Others Urban 32.73 32.15 16.40 127 27.64 35.19 39.43 1.03 30.95 - 33.17 44.88
Schuyler CountyTotal County Urban -* 35.10 32.13 65 28.74 43.28 71.71 1.13 32.55 - 37.81 30.77
Townships
Rushville Urban - 36.51 30.15 32 31.16 48.71 63.71 1.13 32.55 - 40.53 34.38
All Others Urban - 32.82 34.32 33 25.82 40.47 71.71 1.10 26.97 - 38.37 24.24
* No changes were necessary because there were no significant assessment changes in 2016
Scott CountyTotal County Urban - 27.84 46.54 25 20.90 45.70 58.40 1.19 22.68 - 38.73 24.00
All Others Urban 29.26 27.84 46.54 25 20.90 45.70 58.40 1.19 22.68 - 38.73 24.00
Coeffcient of Number Price-related Coefficient of
Geographic Adjusted Dispersion of Ratio Differential Concentration
Area Median Median (COD) Sales 1st 3rd Range (PRD) (COC)
Assessment Ratios 2016
Quartiles
0.95
Confidence
Interval
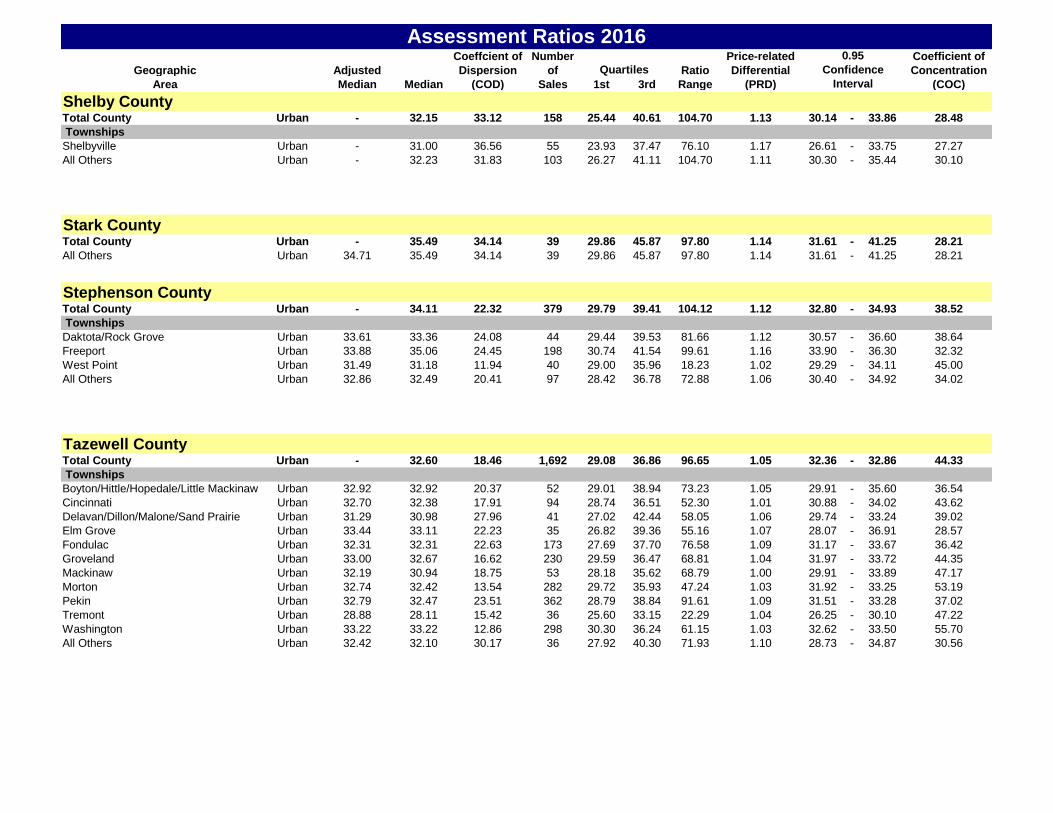
Shelby CountyTotal County Urban - 32.15 33.12 158 25.44 40.61 104.70 1.13 30.14 - 33.86 28.48
Townships
Shelbyville Urban - 31.00 36.56 55 23.93 37.47 76.10 1.17 26.61 - 33.75 27.27
All Others Urban - 32.23 31.83 103 26.27 41.11 104.70 1.11 30.30 - 35.44 30.10
Stark CountyTotal County Urban - 35.49 34.14 39 29.86 45.87 97.80 1.14 31.61 - 41.25 28.21
All Others Urban 34.71 35.49 34.14 39 29.86 45.87 97.80 1.14 31.61 - 41.25 28.21
Stephenson CountyTotal County Urban - 34.11 22.32 379 29.79 39.41 104.12 1.12 32.80 - 34.93 38.52
Townships
Daktota/Rock Grove Urban 33.61 33.36 24.08 44 29.44 39.53 81.66 1.12 30.57 - 36.60 38.64
Freeport Urban 33.88 35.06 24.45 198 30.74 41.54 99.61 1.16 33.90 - 36.30 32.32
West Point Urban 31.49 31.18 11.94 40 29.00 35.96 18.23 1.02 29.29 - 34.11 45.00
All Others Urban 32.86 32.49 20.41 97 28.42 36.78 72.88 1.06 30.40 - 34.92 34.02
Tazewell CountyTotal County Urban - 32.60 18.46 1,692 29.08 36.86 96.65 1.05 32.36 - 32.86 44.33
Townships
Boyton/Hittle/Hopedale/Little Mackinaw Urban 32.92 32.92 20.37 52 29.01 38.94 73.23 1.05 29.91 - 35.60 36.54
Cincinnati Urban 32.70 32.38 17.91 94 28.74 36.51 52.30 1.01 30.88 - 34.02 43.62
Delavan/Dillon/Malone/Sand Prairie Urban 31.29 30.98 27.96 41 27.02 42.44 58.05 1.06 29.74 - 33.24 39.02
Elm Grove Urban 33.44 33.11 22.23 35 26.82 39.36 55.16 1.07 28.07 - 36.91 28.57
Fondulac Urban 32.31 32.31 22.63 173 27.69 37.70 76.58 1.09 31.17 - 33.67 36.42
Groveland Urban 33.00 32.67 16.62 230 29.59 36.47 68.81 1.04 31.97 - 33.72 44.35
Mackinaw Urban 32.19 30.94 18.75 53 28.18 35.62 68.79 1.00 29.91 - 33.89 47.17
Morton Urban 32.74 32.42 13.54 282 29.72 35.93 47.24 1.03 31.92 - 33.25 53.19
Pekin Urban 32.79 32.47 23.51 362 28.79 38.84 91.61 1.09 31.51 - 33.28 37.02
Tremont Urban 28.88 28.11 15.42 36 25.60 33.15 22.29 1.04 26.25 - 30.10 47.22
Washington Urban 33.22 33.22 12.86 298 30.30 36.24 61.15 1.03 32.62 - 33.50 55.70
All Others Urban 32.42 32.10 30.17 36 27.92 40.30 71.93 1.10 28.73 - 34.87 30.56
Coeffcient of Number Price-related Coefficient of
Geographic Adjusted Dispersion of Ratio Differential Concentration
Area Median Median (COD) Sales 1st 3rd Range (PRD) (COC)
Assessment Ratios 2016
Quartiles
0.95
Confidence
Interval
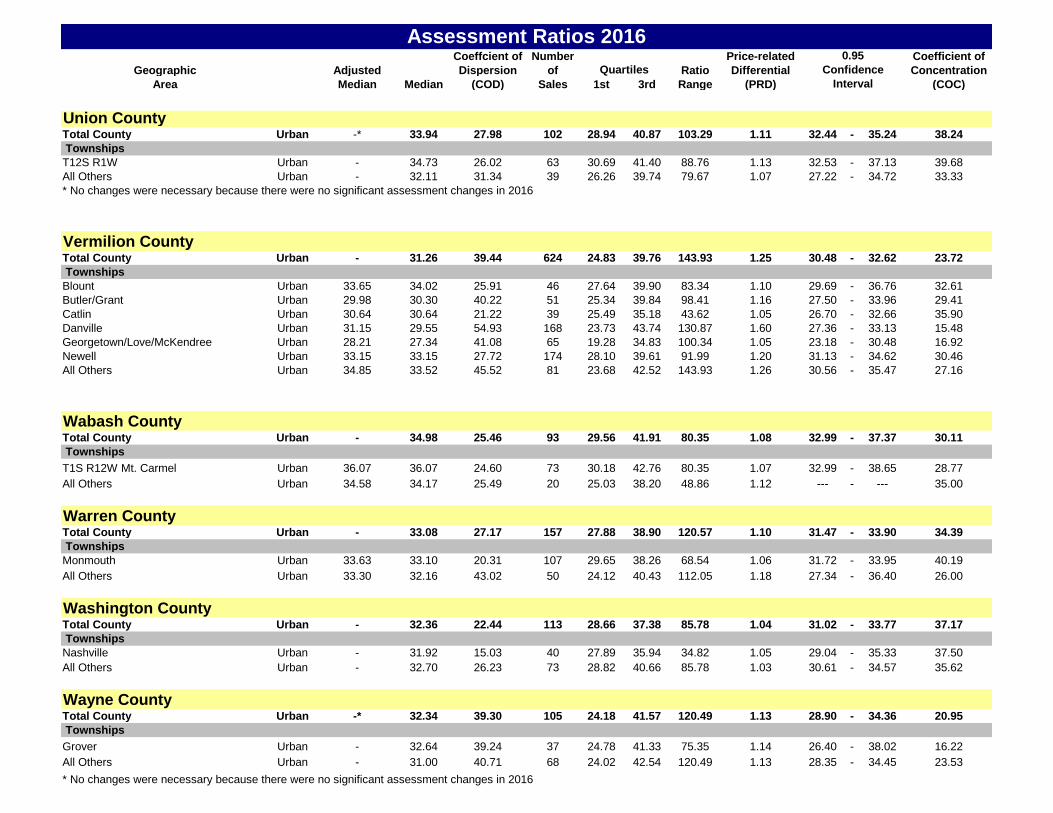
Union CountyTotal County Urban -* 33.94 27.98 102 28.94 40.87 103.29 1.11 32.44 - 35.24 38.24
Townships
T12S R1W Urban - 34.73 26.02 63 30.69 41.40 88.76 1.13 32.53 - 37.13 39.68
All Others Urban - 32.11 31.34 39 26.26 39.74 79.67 1.07 27.22 - 34.72 33.33
* No changes were necessary because there were no significant assessment changes in 2016
Vermilion CountyTotal County Urban - 31.26 39.44 624 24.83 39.76 143.93 1.25 30.48 - 32.62 23.72
Townships
Blount Urban 33.65 34.02 25.91 46 27.64 39.90 83.34 1.10 29.69 - 36.76 32.61
Butler/Grant Urban 29.98 30.30 40.22 51 25.34 39.84 98.41 1.16 27.50 - 33.96 29.41
Catlin Urban 30.64 30.64 21.22 39 25.49 35.18 43.62 1.05 26.70 - 32.66 35.90
Danville Urban 31.15 29.55 54.93 168 23.73 43.74 130.87 1.60 27.36 - 33.13 15.48
Georgetown/Love/McKendree Urban 28.21 27.34 41.08 65 19.28 34.83 100.34 1.05 23.18 - 30.48 16.92
Newell Urban 33.15 33.15 27.72 174 28.10 39.61 91.99 1.20 31.13 - 34.62 30.46
All Others Urban 34.85 33.52 45.52 81 23.68 42.52 143.93 1.26 30.56 - 35.47 27.16
Wabash CountyTotal County Urban - 34.98 25.46 93 29.56 41.91 80.35 1.08 32.99 - 37.37 30.11
Townships
T1S R12W Mt. Carmel Urban 36.07 36.07 24.60 73 30.18 42.76 80.35 1.07 32.99 - 38.65 28.77
All Others Urban 34.58 34.17 25.49 20 25.03 38.20 48.86 1.12 --- - --- 35.00
Warren CountyTotal County Urban - 33.08 27.17 157 27.88 38.90 120.57 1.10 31.47 - 33.90 34.39
Townships
Monmouth Urban 33.63 33.10 20.31 107 29.65 38.26 68.54 1.06 31.72 - 33.95 40.19
All Others Urban 33.30 32.16 43.02 50 24.12 40.43 112.05 1.18 27.34 - 36.40 26.00
Washington CountyTotal County Urban - 32.36 22.44 113 28.66 37.38 85.78 1.04 31.02 - 33.77 37.17
Townships
Nashville Urban - 31.92 15.03 40 27.89 35.94 34.82 1.05 29.04 - 35.33 37.50
All Others Urban - 32.70 26.23 73 28.82 40.66 85.78 1.03 30.61 - 34.57 35.62
Wayne CountyTotal County Urban -* 32.34 39.30 105 24.18 41.57 120.49 1.13 28.90 - 34.36 20.95
Townships
Grover Urban - 32.64 39.24 37 24.78 41.33 75.35 1.14 26.40 - 38.02 16.22
All Others Urban - 31.00 40.71 68 24.02 42.54 120.49 1.13 28.35 - 34.45 23.53
* No changes were necessary because there were no significant assessment changes in 2016
Coeffcient of Number Price-related Coefficient of
Geographic Adjusted Dispersion of Ratio Differential Concentration
Area Median Median (COD) Sales 1st 3rd Range (PRD) (COC)
Assessment Ratios 2016
Quartiles
0.95
Confidence
Interval
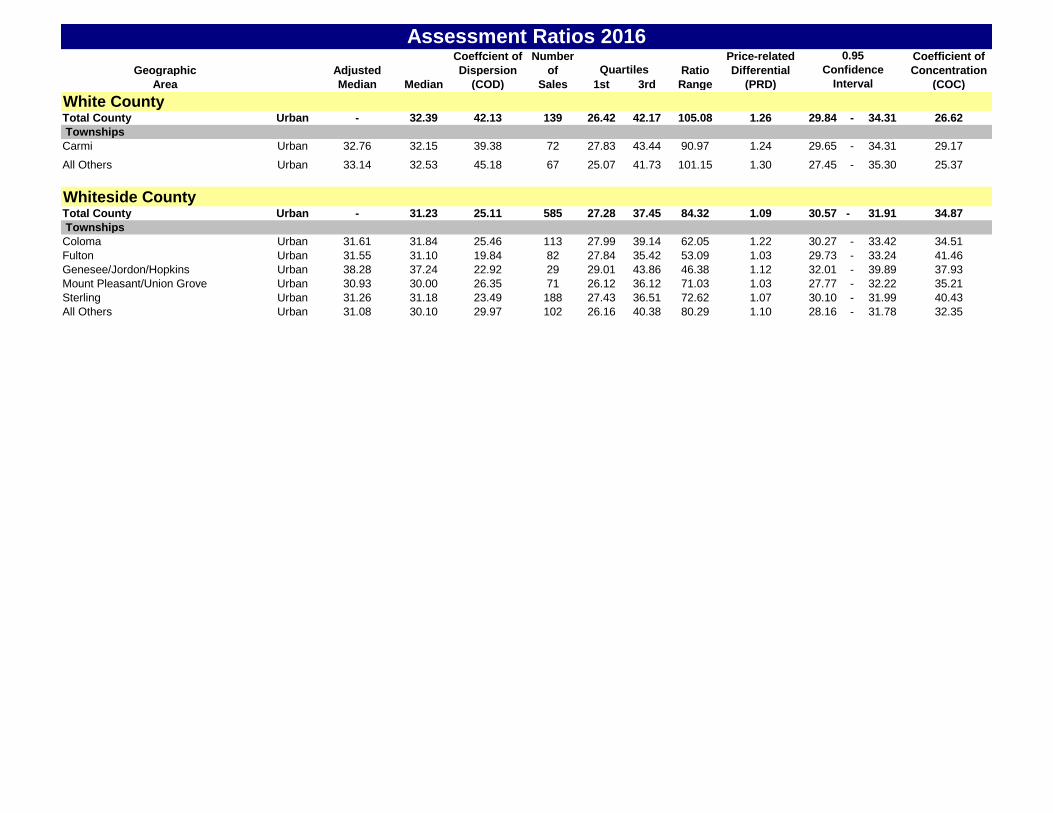
White CountyTotal County Urban - 32.39 42.13 139 26.42 42.17 105.08 1.26 29.84 - 34.31 26.62
Townships
Carmi Urban 32.76 32.15 39.38 72 27.83 43.44 90.97 1.24 29.65 - 34.31 29.17
All Others Urban 33.14 32.53 45.18 67 25.07 41.73 101.15 1.30 27.45 - 35.30 25.37
Whiteside CountyTotal County Urban - 31.23 25.11 585 27.28 37.45 84.32 1.09 30.57 - 31.91 34.87
Townships
Coloma Urban 31.61 31.84 25.46 113 27.99 39.14 62.05 1.22 30.27 - 33.42 34.51
Fulton Urban 31.55 31.10 19.84 82 27.84 35.42 53.09 1.03 29.73 - 33.24 41.46
Genesee/Jordon/Hopkins Urban 38.28 37.24 22.92 29 29.01 43.86 46.38 1.12 32.01 - 39.89 37.93
Mount Pleasant/Union Grove Urban 30.93 30.00 26.35 71 26.12 36.12 71.03 1.03 27.77 - 32.22 35.21
Sterling Urban 31.26 31.18 23.49 188 27.43 36.51 72.62 1.07 30.10 - 31.99 40.43
All Others Urban 31.08 30.10 29.97 102 26.16 40.38 80.29 1.10 28.16 - 31.78 32.35
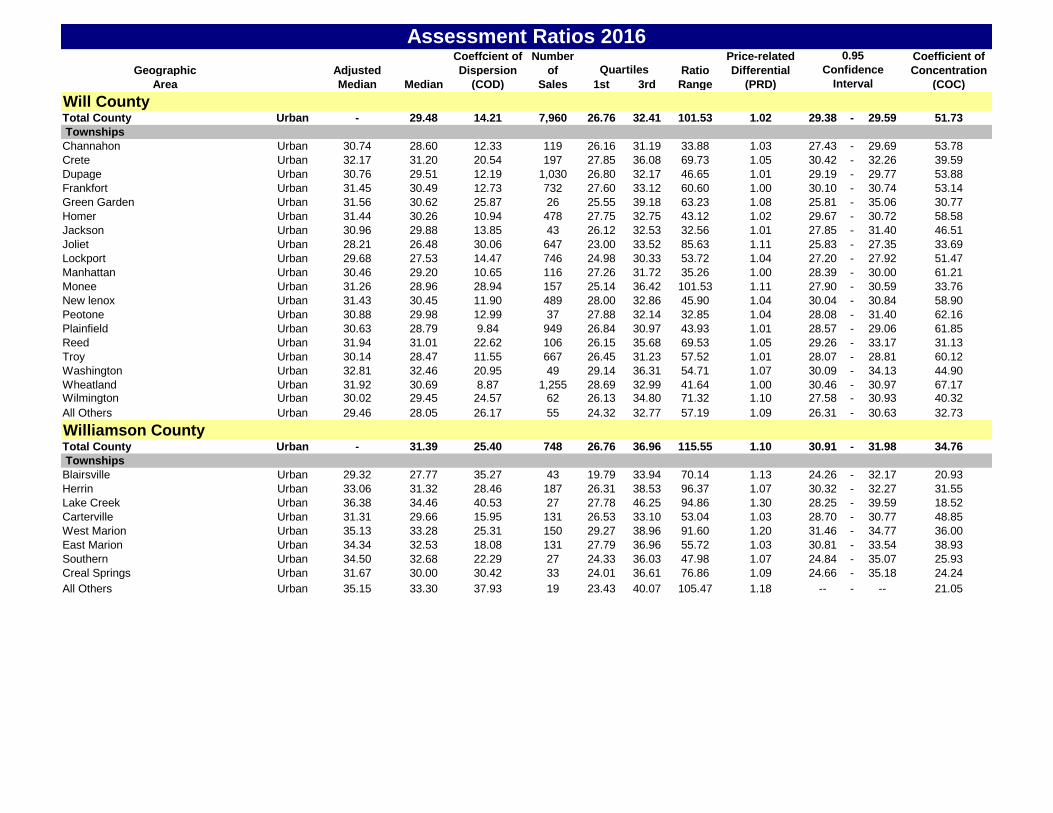
Coeffcient of Number Price-related Coefficient of
Geographic Adjusted Dispersion of Ratio Differential Concentration
Area Median Median (COD) Sales 1st 3rd Range (PRD) (COC)
Assessment Ratios 2016
Quartiles
0.95
Confidence
Interval
Will CountyTotal County Urban - 29.48 14.21 7,960 26.76 32.41 101.53 1.02 29.38 - 29.59 51.73
Townships
Channahon Urban 30.74 28.60 12.33 119 26.16 31.19 33.88 1.03 27.43 - 29.69 53.78
Crete Urban 32.17 31.20 20.54 197 27.85 36.08 69.73 1.05 30.42 - 32.26 39.59
Dupage Urban 30.76 29.51 12.19 1,030 26.80 32.17 46.65 1.01 29.19 - 29.77 53.88
Frankfort Urban 31.45 30.49 12.73 732 27.60 33.12 60.60 1.00 30.10 - 30.74 53.14
Green Garden Urban 31.56 30.62 25.87 26 25.55 39.18 63.23 1.08 25.81 - 35.06 30.77
Homer Urban 31.44 30.26 10.94 478 27.75 32.75 43.12 1.02 29.67 - 30.72 58.58
Jackson Urban 30.96 29.88 13.85 43 26.12 32.53 32.56 1.01 27.85 - 31.40 46.51
Joliet Urban 28.21 26.48 30.06 647 23.00 33.52 85.63 1.11 25.83 - 27.35 33.69
Lockport Urban 29.68 27.53 14.47 746 24.98 30.33 53.72 1.04 27.20 - 27.92 51.47
Manhattan Urban 30.46 29.20 10.65 116 27.26 31.72 35.26 1.00 28.39 - 30.00 61.21
Monee Urban 31.26 28.96 28.94 157 25.14 36.42 101.53 1.11 27.90 - 30.59 33.76
New lenox Urban 31.43 30.45 11.90 489 28.00 32.86 45.90 1.04 30.04 - 30.84 58.90
Peotone Urban 30.88 29.98 12.99 37 27.88 32.14 32.85 1.04 28.08 - 31.40 62.16
Plainfield Urban 30.63 28.79 9.84 949 26.84 30.97 43.93 1.01 28.57 - 29.06 61.85
Reed Urban 31.94 31.01 22.62 106 26.15 35.68 69.53 1.05 29.26 - 33.17 31.13
Troy Urban 30.14 28.47 11.55 667 26.45 31.23 57.52 1.01 28.07 - 28.81 60.12
Washington Urban 32.81 32.46 20.95 49 29.14 36.31 54.71 1.07 30.09 - 34.13 44.90
Wheatland Urban 31.92 30.69 8.87 1,255 28.69 32.99 41.64 1.00 30.46 - 30.97 67.17Wilmington Urban 30.02 29.45 24.57 62 26.13 34.80 71.32 1.10 27.58 - 30.93 40.32
All Others Urban 29.46 28.05 26.17 55 24.32 32.77 57.19 1.09 26.31 - 30.63 32.73
Williamson CountyTotal County Urban - 31.39 25.40 748 26.76 36.96 115.55 1.10 30.91 - 31.98 34.76
Townships
Blairsville Urban 29.32 27.77 35.27 43 19.79 33.94 70.14 1.13 24.26 - 32.17 20.93
Herrin Urban 33.06 31.32 28.46 187 26.31 38.53 96.37 1.07 30.32 - 32.27 31.55
Lake Creek Urban 36.38 34.46 40.53 27 27.78 46.25 94.86 1.30 28.25 - 39.59 18.52
Carterville Urban 31.31 29.66 15.95 131 26.53 33.10 53.04 1.03 28.70 - 30.77 48.85
West Marion Urban 35.13 33.28 25.31 150 29.27 38.96 91.60 1.20 31.46 - 34.77 36.00
East Marion Urban 34.34 32.53 18.08 131 27.79 36.96 55.72 1.03 30.81 - 33.54 38.93
Southern Urban 34.50 32.68 22.29 27 24.33 36.03 47.98 1.07 24.84 - 35.07 25.93
Creal Springs Urban 31.67 30.00 30.42 33 24.01 36.61 76.86 1.09 24.66 - 35.18 24.24
All Others Urban 35.15 33.30 37.93 19 23.43 40.07 105.47 1.18 -- - -- 21.05

Coeffcient of Number Price-related Coefficient of
Geographic Adjusted Dispersion of Ratio Differential Concentration
Area Median Median (COD) Sales 1st 3rd Range (PRD) (COC)
Assessment Ratios 2016
Quartiles
0.95
Confidence
Interval
Winnebago CountyTotal County Urban - 30.96 19.95 2,952 28.01 35.44 136.93 1.10 30.72 - 31.24 45.16
Townships
Cherry Valley Urban 31.49 30.91 15.12 191 28.12 34.71 55.24 1.06 30.09 - 31.72 49.74
Durand/Laona Urban 31.87 31.87 45.16 65 28.45 45.03 124.01 1.41 29.68 - 35.68 32.31
Harlem Urban 31.17 30.62 14.89 392 28.18 34.61 53.96 1.05 30.01 - 31.34 49.23
Owen Urban 30.68 30.09 16.76 37 27.96 36.06 31.34 1.02 28.16 - 33.83 45.95
Pecatonica/Seward Urban 32.94 32.61 15.60 72 29.20 37.82 34.89 1.07 30.94 - 34.21 43.06
Rockford Urban 31.14 31.14 23.30 1,651 27.73 36.60 88.97 1.14 30.65 - 31.48 39.79
Rockton Urban 30.95 30.24 12.14 210 28.10 33.30 45.76 1.02 29.51 - 31.03 60.00
Roscoe Urban 32.05 31.13 11.42 254 28.66 33.96 44.61 1.01 30.41 - 31.76 59.06
Winnebago Urban 31.40 31.40 13.95 58 28.14 34.45 39.69 1.04 30.03 - 33.12 50.00
All Others Urban 29.92 29.40 18.01 22 26.36 36.32 24.73 1.02 26.47 - 34.41 36.36
Woodford CountyTotal County Urban - 32.44 20.41 414 28.57 36.81 107.89 1.06 31.75 - 32.99 43.96
Townships
Cruger/Olio Urban 34.40 33.54 13.66 48 29.98 38.31 24.31 1.01 30.96 - 34.91 35.42
El Paso Urban 32.15 31.24 19.77 45 27.86 38.04 37.67 1.02 29.27 - 35.78 35.56
Metamora Urban 33.20 32.17 14.67 57 29.12 34.75 42.30 1.02 30.88 - 32.69 56.14
Roanoke Urban 31.63 31.43 25.60 35 27.88 40.13 60.29 1.09 28.58 - 35.70 34.29
Spring Bay Urban 33.14 33.54 26.91 34 27.67 37.27 64.86 1.07 29.46 - 36.05 35.29
Worth Urban 33.85 32.99 11.95 113 30.40 35.67 48.94 1.02 32.41 - 34.16 61.06
All Others Urban 30.49 30.29 36.43 82 25.49 39.42 105.01 1.20 28.08 - 32.30 26.83