2016 market update - winthrop university, rock hill, … card for 2015 1. positive for us stocks...
TRANSCRIPT

Riding An Aging Bull 2016 Market Update
Larry W. Carroll, CFP®
Securities offered through Cetera Advisor Networks LLC, member FINRA/SIPC. Advisory services offered through Carroll Financial Associates, Inc., a Registered Investment Advisor. Carroll Financial and Cetera Advisor Networks are not affiliated.
4201 Congress Street Suite 210 Charlotte, NC 28209

2015 Returns by Asset Classes
1.4%
-3.0%
-4.4% -5.7%
-14.9%
-4.6%
0.6%
-24.7%
-30.0%
-25.0%
-20.0%
-15.0%
-10.0%
-5.0%
0.0%
5.0%
S&P 500 S&P ex FANG Small Cap MSCI ACWIex US
MSCI EM High YieldBonds
Barclays AGG Commodities
Source: JP Morgan, Bank of America

FANG Stocks
For the full year, the market was led higher by a narrowing group of momentum stocks, best illustrated by the performance of the FANG (Facebook, Amazon, Netflix and Google) which returned +67% in 2015. • This compares to a +1% for the S&P 500 and -3% for the S&P 500 excluding FANG
Source: Bank of America
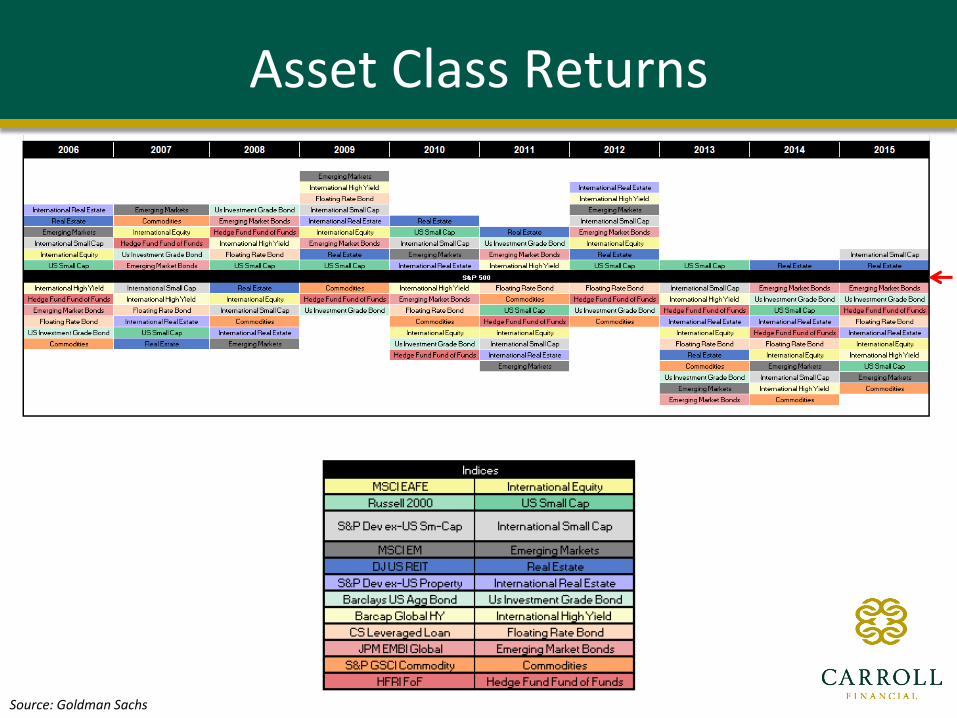
Asset Class Returns
Source: Goldman Sachs

Annualized Returns during Lost Decade (12/31/99 – 12/31/15)
12.9%
8.5%
6.3% 5.7%
5.2%
4.3%
2.9%
0.8%
0.0%
2.0%
4.0%
6.0%
8.0%
10.0%
12.0%
14.0%
Source: JP Morgan, Bank of America

Sector Breakdown 2015
10.1%
6.9% 6.6% 5.9%
3.4% 1.4%
-1.5% -2.5%
-4.8%
-8.4%
-21.1% -25.0%
-20.0%
-15.0%
-10.0%
-5.0%
0.0%
5.0%
10.0%
15.0%
Source: JP Morgan

Report Card for 2015
1. Positive for US Stocks S&P 500 1.4%
B- saved by dividends
B 2. Stocks Outperform Bonds S&P 500 1.4% Barclays Bond 0.5%
I gave you 6 Investment Themes for 2015
Source: Morningstar

Report Card for 2015
3. Hybrids and Spread product again BarCap Agg 0.5% Preferred 7.7% Emerging Debt 1.2% Floating Rate -0.7% Convertibles -3.2% High Yield -4.5%
B-
4. Europe outperforms the US Currency Hedged S&P 500 1.4% MSCI Europe -2.8% USD (+4.9% LCL)
A
Source: Morningstar, MSCI, JP Morgan

Report Card for 2015
5) Oil stays below $65 per barrel A+
Source: CBOE

Report Card for 2015
6) Increased Dividends, Increased
Buybacks, Increased M&A
A
Overall: A- Source: JP Morgan

Pyrrhic Victory
Noun: a victory in which the victor’s losses are as great as those of the defeated
A victory that is accompanied by enormous losses and leaves the winners in as desperate shape as if they had lost. Pyrrhus was an ancient general who, after defeating the Romans, told those who wished to congratulate him, “One more such victory and Pyrrhus is
undone.”
Source: dictonary.com

2016?
Securities offered through Cetera Advisor Networks LLC, member FINRA/SIPC. Advisory services offered through Carroll Financial Associates, Inc., a Registered Investment Advisor. Carroll Financial and Cetera Advisor Networks are not affiliated.
4201 Congress Street Suite 210 Charlotte, NC 28209

Business Cycle Stages
Source: Pring Turner, January 29, 2014

Two Changes For 2016
1. All predictions are:
February 10 – December 31, 2016
2. Grading will be Pass/Fail

2016 Predictions
1. Due to concerns about the global economy the Fed only raises rates once or twice rather than the promised four times.
2. Bond Market
1. High Yield Outperforms the Bond Index
2. Floating Rate Outperforms the Bond Index
3. Preferreds Outperform the Bond Index
3. International Market
1. Europe Outperforms the US (currency hedged)
2. Japan Outperforms the US (currency hedged)
2016 Predictions (cont.)
4. Oil
1. Goes below $25 per barrel
2. Goes above $40 per barrel in the second half of the year
5. Companies continue to return cash to shareholders
1. Dividends
2. Buybacks
3. Increased M&A

Stock Market Volatility
Odds of experiencing stock market volatility:
100%

Annual Returns & Declines
Source: JP Morgan, December 31, 2015

Stock Volatility… But…
Source: JP Morgan, December 31, 2015

Pessimism vs. Optimism
Despite the record of things getting better for most people most of the time, pessimism isn’t just more
common than optimism, it also sounds smarter. It’s intellectually captivating, and paid more
attention to than the optimist who is often viewed as an oblivious sucker.
- Morgan Housel
Source: www.fool.com/investing/general/2016/01/21/why-does-pessimism-sound-so-smart.aspx

Earnings Lead To Higher Prices
1. Cash
2. Pay Down Debt
3. Capital Expenditures
4. Research & Development
5. Acquisitions
6. Stock Buybacks
7. Dividends

Other Thoughts
1. Risk takers may want to consider owning Technology, Healthcare, and Financials
2. Contact your Financial Advisor for potential
opportunities if Oil is Under $25
3. Bond buyers beware
4. It gets more difficult

Questions
?

Required Disclosures
• Securities offered through Cetera Advisor Networks LLC, member FINRA/SIPC. Advisory services offered through Carroll Financial Associates, Inc., a Registered Investment Advisor. Carroll Financial and Cetera Advisor Networks are not affiliated.
• Additional risks are associated with international investing, such as currency fluctuations, political and economic stability, and differences in accounting standards.
• Past performance is no guarantee of future results. Indices are unmanaged and cannot be invested in directly.
• The S&P 500 ® is a market-value-weighted index of 500 stocks that is generally considered representative of the US large cap equity market. The index is unmanaged and not available for direct investment.
• The views are those of Larry W. Carroll and Kristopher W. Carroll and should not be construed as investment advice. All information is believed to be from reliable sources: however, we make no representation as to its completeness or accuracy. All economic and performance information is historical and not indicative of future results. Consult your financial advisor for more information.

Required Disclosures
• Small Cap: Russell 2000 Index- The Russell 2000 Index is an unmanaged index of small capitalization common stocks. It consists of the 2000 smallest companies in the Russell 3000 index, which consists of the 3000 largest U.S. companies based on market capitalization. You cannot invest directly in the Russell 2000 Index.
• S&P 500: S&P 500 Index - The S&P 500 is an unmanaged, capitalization-weighted index. Performance figures assume reinvestment of capital gains, dividends, but do not include any fees or expenses. It is not possible to invest directly in the S&P 500.
• MSCI ACWI: MSCI ACWI captures large and mid cap representation across 23 Developed Markets (DM) and 23 Emerging Markets (EM) countries*. With 2,490 constituents, the index covers approximately 85% of the global investable equity opportunity set. You cannot invest directly in an index.
• MSCI EM: The MSCI Emerging Markets Index captures large and mid cap representation across 23 Emerging Markets (EM) countries*. With 837 constituents, the index covers approximately 85% of the free float-adjusted market capitalization in each country. You cannot invest directly in an index
• High Yield: The Barclays US Corporate High Yield Bond Index measures the USD-denominated, high yield, fixed-rate corporate bond market. Securities are classified as high yield if the middle rating of Moody’s, Fitch and S&P is Ba1/BB+/BB+ or below. Bonds from issuers with an emerging markets country of risk, based on Barclays EM country definition, are excluded. The US Corporate High Yield Index is a component of the US Universal and Global High Yield Indices. The index was created in 1986, with history backfilled to July 1, 1983. You cannot invest directly in an index
• Barclays Agg: The Barclays US Aggregate Bond Index is a broad-based flagship benchmark that measures the investment grade, US dollar-denominated, fixed-rate taxable bond market. The index includes Treasuries, government-related and corporate securities, MBS (agency fixed-rate and hybrid ARM pass-throughs), ABS and CMBS (agency and non-agency). Provided the necessary inclusion rules are met, US Aggregate eligible securities also contribute to the multi-currency Global Aggregate Index and the US Universal Index, which includes high yield and emerging markets debt. The US Aggregate Index was created in 1986 with history backfilled to January 1, 1976. You cannot invest directly in an index
• S&P 500: S&P 500 ex FANG Index - The S&P 500 is an unmanaged, capitalization-weighted index. Performance figures assume reinvestment of capital gains, dividends, but do not include any fees or expenses. It is not possible to invest directly in the S&P 500. This index excludes the performance of Facebook, Amazon, Netflix, and Google (Alphabet).
• Commodities: The S&P GSCI® is a composite index of commodity sector returns representing an unleveraged, long-only investment in commodity futures that is broadly diversified across the spectrum of commodities. The returns are calculated on a fully collateralized basis with full reinvestment. The combination of these attributes provides investors with a representative and realistic picture of realizable returns attainable in the commodities markets. You cannot invest directly in an index.