2017 nadadata | nada
TRANSCRIPT

2017ANNUAL FINANCIAL PROFILE OF AMERICA’S FRANCHISED NEW-CAR DEALERSHIPS
NATIONAL
AUTOMOBILE
DEALERS
ASSOCIATION

Overview
CONTENTSNew Light-Vehicle Dealerships � � � � � � � � � � � � � � � � � � � � � � � � � � � � � � � � � � � � 2Dealership Financial Trends� � � � � � � � � � � � � � � � � � � � � � � � � � � � � � � � � � � � � 19New Light-Vehicle Department � � � � � � � � � � � � � � � � � � � � � � � � � � � � � � � � � � 23F&I Department � � � � � � � � � � � � � � � � � � � � � � � � � � � � � � � � � � � � � � � � � � � � � 26Used-Vehicle Department � � � � � � � � � � � � � � � � � � � � � � � � � � � � � � � � � � � � � � 27Service and Parts Department � � � � � � � � � � � � � � � � � � � � � � � � � � � � � � � � � � � 28Body Shop Department � � � � � � � � � � � � � � � � � � � � � � � � � � � � � � � � � � � � � � � � 30Dealership Advertising � � � � � � � � � � � � � � � � � � � � � � � � � � � � � � � � � � � � � � � � 31Employment and Payroll � � � � � � � � � � � � � � � � � � � � � � � � � � � � � � � � � � � � � � � 33New- and Used-Vehicle Consumer � � � � � � � � � � � � � � � � � � � � � � � � � � � � � � � � 36
This latest NADA Data, our comprehensive financial profile of new-car dealerships, includes the many major milestones achieved by the auto retail industry in 2017 (also look for our mid-year update, available in third quarter 2018)� Among them:
• The nation’s 16,802 franchised dealers sold 17�14 million light-duty vehicles�
• Total new-vehicle sales topped $1 trillion�
• Dealerships wrote more than 316 million repair orders, with service and parts sales exceeding $114 billion�
At the end of 2017, dealership employment topped 1�1 million and by year-end 2018 should hit reach an all-time high� In addition to direct employment by dealerships, hundreds of thousands of other jobs in local communities depend on auto retail�
Plus, dealerships spend billions of dollars in their communities on contracting and other services� This, of course, includes dealership employees’ wages, which in 2017 totaled more than $66 billion� Dealership compensation is far higher than that of other retail sectors� In fact, auto retail continues to boast one of the highest average salaries of any industry�
While employment at a dealership has for decades been one of the best paths to the middle-class American dream, customers also have benefited� There is healthy competition between dealers to sell and service vehicles—which has meant good deals for consumers� With sales in the average U�S� dealership relatively flat in 2017, the opening of new retail outlets became the main driver of the year’s total dealership sales increase� And as margins on new-car sales have fallen since the recession, dealers have done an excellent job focusing on service and parts—with those sales in the average dealership increasing 6 percent per year on an average annualized basis since 2009�
There is also a section on the new- and used-vehicle consumer, with in-depth data from Experian� These stats include average monthly payment, average loan term, leasing and much more�
Note: NADA Data was first published decades ago, and some of the methodology and data sources have naturally changed along the way. Therefore, previous reports may not be directly comparable to the current version.
Patrick Manzi Senior Economist, NADA
NADA DATA 2017 | nada.org 1
Boyi Xu Economist, NADA

NADA DATA 2017 | nada.org 2
New Light-Vehicle Dealerships
Average Light-Vehicle Dealership Profile
2015 2016 2017
Total sales $56,723,576 $59,590,891 $59,672,779
Total gross1 $6,572,760 $6,771,320 $6,795,692
As % of total sales 11.6% 11.4% 11.4%
Total expense $6,099,768 $6,495,666 $6,706,134
As % of total sales 10.8% 10.9% 11.2%
As % of total gross 92.8% 95.9% 98.7%
Total operating profit $472,981 $275,662 $91,774
As % of total sales 0.8% 0.5% 0.2%
As % of total gross 7.2% 4.1% 1.4%
Net profit before tax $1,503,432 $1,466,799 $1,394,756
As % of total sales 2.7% 2.5% 2.3%
As % of total gross 22.9% 21.7% 20.5%
New-vehicle department2
New-vehicle department total sales $33,006,319 $34,546,139 $34,393,462
New-vehicle department sales as % of total sales 58.2% 58.0% 57.6%
New-vehicle department gross as % of total gross 29.5% 27.8% 26.6%
New-vehicle selling price (retail)3 $33,456 $34,449 $34,670
Gross as % of selling price 6.4% 6.0% 5.7%
Retail gross profit per new vehicle retailed $2,152 $2,066 $1,959
Retail net profit per new vehicle retailed ($22) ($217) ($421)
Average number of new vehicles retailed 916 928 922
F&I income as % of new-vehicle department sales 2.8% 2.8% 2.9%
F&I penetration (new) 90.3% 90.4% 90.3%
1 Gross profit includes cost of goods sold, but not SG&A or advertising.2 Includes F&I sales unless otherwise noted.3 Excludes F&I sales.
NADA DATA 2017 | nada.org 3
New Light-Vehicle Dealerships (continued)
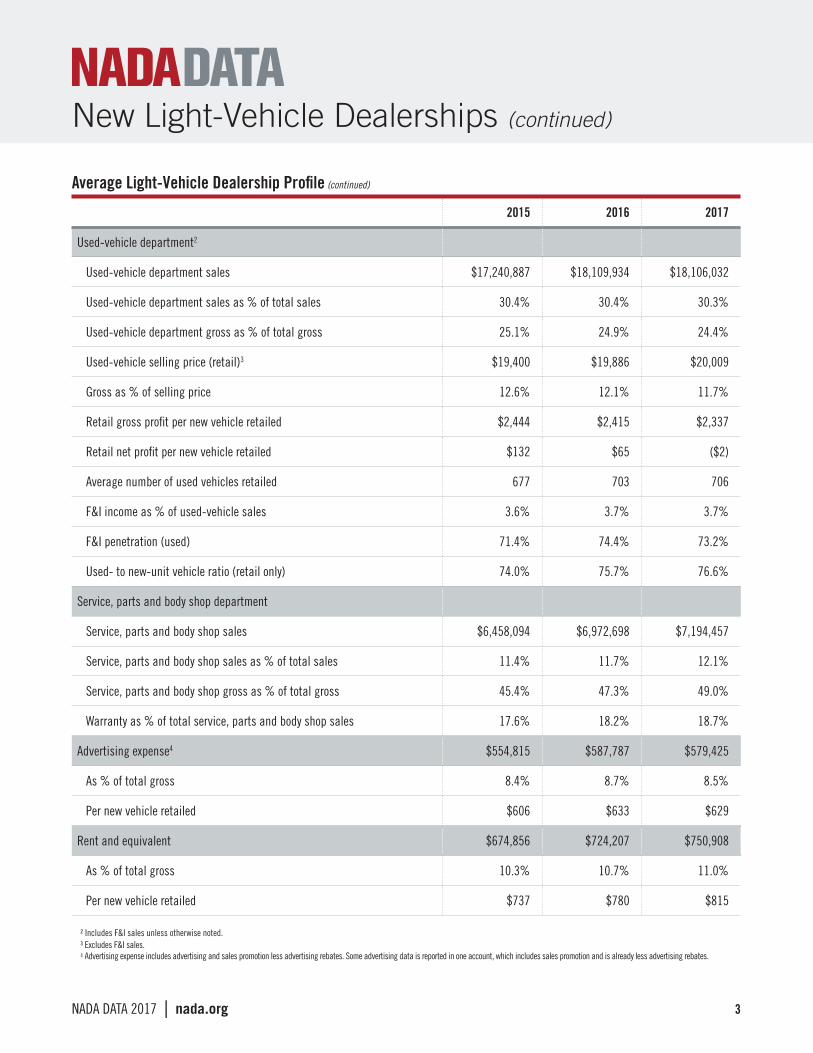
Average Light-Vehicle Dealership Profile (continued)
2015 2016 2017
Used-vehicle department2
Used-vehicle department sales $17,240,887 $18,109,934 $18,106,032
Used-vehicle department sales as % of total sales 30.4% 30.4% 30.3%
Used-vehicle department gross as % of total gross 25.1% 24.9% 24.4%
Used-vehicle selling price (retail)3 $19,400 $19,886 $20,009
Gross as % of selling price 12.6% 12.1% 11.7%
Retail gross profit per new vehicle retailed $2,444 $2,415 $2,337
Retail net profit per new vehicle retailed $132 $65 ($2)
Average number of used vehicles retailed 677 703 706
F&I income as % of used-vehicle sales 3.6% 3.7% 3.7%
F&I penetration (used) 71.4% 74.4% 73.2%
Used- to new-unit vehicle ratio (retail only) 74.0% 75.7% 76.6%
Service, parts and body shop department
Service, parts and body shop sales $6,458,094 $6,972,698 $7,194,457
Service, parts and body shop sales as % of total sales 11.4% 11.7% 12.1%
Service, parts and body shop gross as % of total gross 45.4% 47.3% 49.0%
Warranty as % of total service, parts and body shop sales 17.6% 18.2% 18.7%
Advertising expense4 $554,815 $587,787 $579,425
As % of total gross 8.4% 8.7% 8.5%
Per new vehicle retailed $606 $633 $629
Rent and equivalent $674,856 $724,207 $750,908
As % of total gross 10.3% 10.7% 11.0%
Per new vehicle retailed $737 $780 $815
2 Includes F&I sales unless otherwise noted.3 Excludes F&I sales.4 Advertising expense includes advertising and sales promotion less advertising rebates. Some advertising data is reported in one account, which includes sales promotion and is already less advertising rebates.

NADA DATA 2017 | nada.org 4
New Light-Vehicle Dealerships (continued)
Average Light-Vehicle Dealership Profile (continued)
2015 2016 2017
Floor plan interest ($134,238) ($114,979) ($51,802)
As % of total sales -2.0% -1.7% -0.8%
Per new vehicle retailed ($147) ($124) ($56)
Selling, general and administrative expense $5,628,310 $5,970,593 $6,069,902
As % of total sales 9.9% 10.0% 10.2%
As % of total gross 85.6% 88.2% 89.3%
Source: NADA

NADA DATA 2017 | nada.org 5
New Light-Vehicle Dealerships (continued)
Domestic Dealership Profile
2015 2016 2017
Total sales $49,882,081 $53,647,345 $53,477,979
Total gross1 $5,655,845 $5,905,305 $5,902,681
As % of total sales 11.3% 11.0% 11.0%
Total expense $5,142,563 $5,560,929 $5,663,390
As % of total sales 10.3% 10.4% 10.6%
As % of total gross 90.9% 94.2% 95.9%
Total operating profit $513,282 $344,398 $244,258
As % of total sales 1.0% 0.6% 0.5%
As % of total gross 9.1% 5.8% 4.1%
Net profit before tax $1,306,329 $1,235,709 $1,101,694
As % of total sales 2.6% 2.3% 2.1%
As % of total gross 23.1% 20.9% 18.7%
New-vehicle department2
New-vehicle department total sales $28,732,592 $31,205,348 $31,168,978
New-vehicle department sales as % of total sales 57.6% 58.2% 58.3%
New-vehicle department gross as % of total gross 30.5% 29.0% 28.9%
New-vehicle selling price (retail)3 $35,606 $36,920 $37,924
Gross as % of selling price 6.6% 6.1% 5.9%
Retail gross profit per new vehicle retailed $2,351 $2,252 $2,250
Retail net profit per new vehicle retailed $203 ($31) ($169)
Average number of new vehicles retailed 734 762 746
F&I income as % of new-vehicle department sales 2.7% 2.6% 2.7%
F&I penetration (new) 93.4% 93.5% 93.6%
1 Gross profit includes cost of goods sold, but not SG&A or advertising.2 Includes F&I sales unless otherwise noted.3 Excludes F&I sales.

NADA DATA 2017 | nada.org 6
New Light-Vehicle Dealerships (continued)
Domestic Dealership Profile (continued)
2015 2016 2017
Used-vehicle department2
Used-vehicle department sales $15,715,175 $16,636,530 $16,409,141
Used-vehicle department sales as % of total sales 31.5% 31.0% 30.7%
Used-vehicle department gross as % of total gross 27.3% 27.0% 26.6%
Used-vehicle selling price (retail)3 $18,897 $19,531 $19,831
Gross as % of selling price 13.2% 12.8% 12.5%
Retail gross profit per new vehicle retailed $2,503 $2,498 $2,481
Retail net profit per new vehicle retailed $228 $171 $159
Average number of used vehicles retailed 631 656 645
F&I income as % of used-vehicle sales 3.5% 3.6% 3.7%
F&I penetration (used) 70.1% 74.5% 74.0%
Used- to new-unit vehicle ratio (retail only) 86.0% 86.1% 86.5%
Service, parts and body shop department
Service, parts and body shop sales $5,401,407 $5,875,582 $5,949,085
Service, parts and body shop sales as % of total sales 10.8% 11.0% 11.1%
Service, parts and body shop gross as % of total gross 42.2% 43.9% 44.6%
Warranty as % of total service, parts and body shop sales 17.1% 17.4% 16.8%
Advertising expense4 $466,041 $510,014 $494,080
As % of total gross 8.2% 8.6% 8.4%
Per new vehicle retailed $635 $670 $663
Rent and equivalent $527,532 $574,209 $595,380
As % of total gross 9.3% 9.7% 10.1%
Per new vehicle retailed $719 $754 $799
2 Includes F&I sales unless otherwise noted.3 Excludes F&I sales.4 Advertising expense includes advertising and sales promotion less advertising rebates. Some advertising data is reported in one account, which includes sales promotion and is already less advertising rebates.

NADA DATA 2017 | nada.org 7
New Light-Vehicle Dealerships (continued)
Domestic Dealership Profile (continued)
2015 2016 2017
Floor plan interest ($115,927) ($92,998) ($19,011)
As % of total sales -2.0% -1.6% -0.3%
Per new vehicle retailed ($158) ($122) ($26)
Selling, general and administrative expense $4,767,377 $5,114,044 $5,102,890
As % of total sales 9.6% 9.5% 9.5%
As % of total gross 84.3% 86.6% 86.5%
Source: NADA

NADA DATA 2017 | nada.org 8
New Light-Vehicle Dealerships (continued)
Import Dealership Profile
2015 2016 2017
Total sales $64,952,534 $66,739,795 $64,568,304
Total gross1 $7,675,626 $7,812,964 $7,501,406
As % of total sales 11.8% 11.7% 11.6%
Total expense $7,251,095 $7,619,970 $7,530,177
As % of total sales 11.2% 11.4% 11.7%
As % of total gross 94.5% 97.5% 100.4%
Total operating profit $424,506 $192,986 ($28,728)
As % of total sales 0.7% 0.3% 0.0%
As % of total gross 5.5% 2.5% -0.4%
Net profit before tax $1,740,509 $1,744,755 $1,626,353
As % of total sales 2.7% 2.6% 2.5%
As % of total gross 22.7% 22.3% 21.7%
New-vehicle department2
New-vehicle department total sales $38,146,762 $38,564,446 $36,941,655
New-vehicle department sales as % of total sales 58.7% 57.8% 57.2%
New-vehicle department gross as % of total gross 28.5% 26.8% 25.2%
New-vehicle selling price (retail)3 $31,785 $32,443 $32,863
Gross as % of selling price 6.3% 5.9% 5.5%
Retail gross profit per new vehicle retailed $1,998 $1,915 $1,798
Retail net profit per new vehicle retailed ($198) ($369) ($562)
Average number of new vehicles retailed 1,135 1,128 1,061
F&I income as % of new-vehicle department sales 2.9% 3.0% 3.1%
F&I penetration (new) 88.0% 87.8% 88.4%
1 Gross profit includes cost of goods sold, but not SG&A or advertising.2 Includes F&I sales unless otherwise noted.3 Excludes F&I sales.

NADA DATA 2017 | nada.org 9
New Light-Vehicle Dealerships (continued)
Import Dealership Profile (continued)
2015 2016 2017
Used-vehicle department2
Used-vehicle department sales $19,076,016 $19,882,147 $19,447,023
Used-vehicle department sales as % of total sales 29.4% 29.8% 30.1%
Used-vehicle department gross as % of total gross 23.2% 23.0% 23.1%
Used-vehicle selling price (retail)3 $19,920 $20,254 $20,129
Gross as % of selling price 12.0% 11.5% 11.1%
Retail gross profit per new vehicle retailed $2,383 $2,329 $2,240
Retail net profit per new vehicle retailed $32 ($46) ($111)
Average number of used vehicles retailed 734 760 755
F&I income as % of used-vehicle sales 3.7% 3.8% 3.8%
F&I penetration (used) 72.7% 74.4% 72.6%
Used- to new-unit vehicle ratio (retail only) 64.6% 67.3% 71.2%
Service, parts and body shop department
Service, parts and body shop sales $7,729,079 $8,292,311 $8,178,630
Service, parts and body shop sales as % of total sales 11.9% 12.4% 12.7%
Service, parts and body shop gross as % of total gross 48.2% 50.3% 51.8%
Warranty as % of total service, parts and body shop sales 18.0% 18.9% 19.8%
Advertising expense4 $661,593 $681,333 $646,870
As % of total gross 8.6% 8.7% 8.6%
Per new vehicle retailed $583 $604 $610
Rent and equivalent $852,057 $904,625 $873,816
As % of total gross 11.1% 11.6% 11.6%
Per new vehicle retailed $751 $802 $824
2 Includes F&I sales unless otherwise noted.3 Excludes F&I sales.4 Advertising expense includes advertising and sales promotion less advertising rebates. Some advertising data is reported in one account, which includes sales promotion and is already less advertising rebates.
NADA DATA 2017 | nada.org 10
New Light-Vehicle Dealerships (continued)
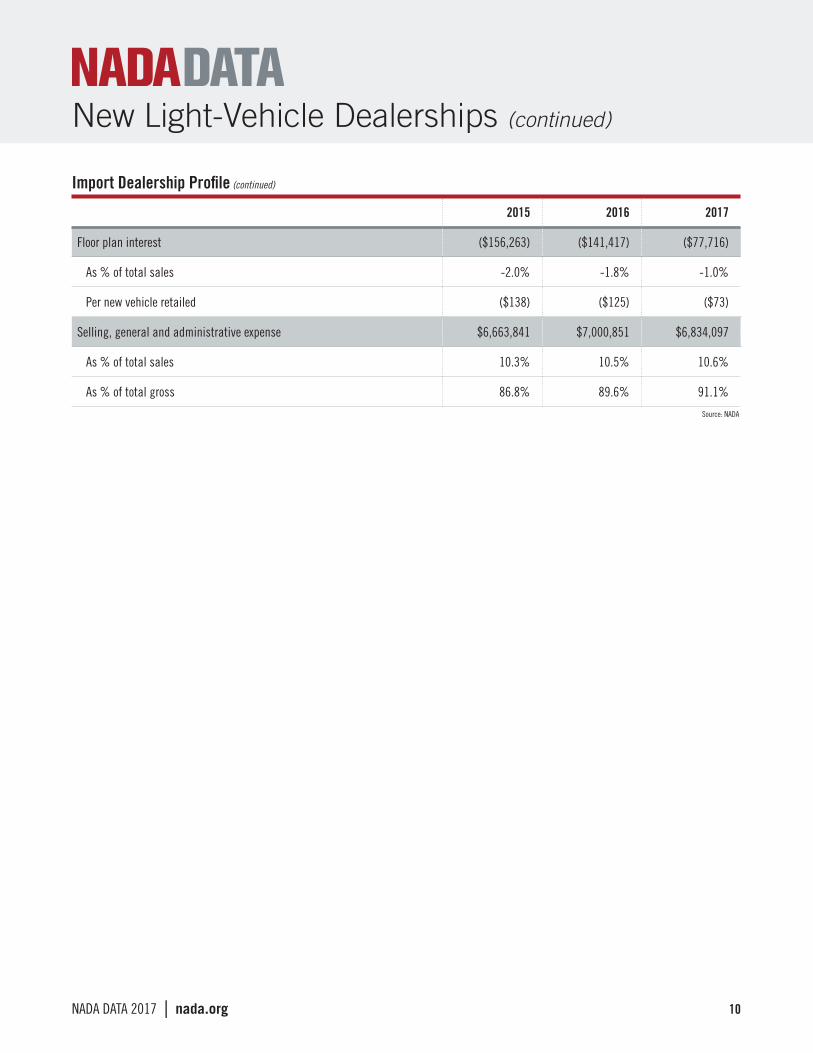
Import Dealership Profile (continued)
2015 2016 2017
Floor plan interest ($156,263) ($141,417) ($77,716)
As % of total sales -2.0% -1.8% -1.0%
Per new vehicle retailed ($138) ($125) ($73)
Selling, general and administrative expense $6,663,841 $7,000,851 $6,834,097
As % of total sales 10.3% 10.5% 10.6%
As % of total gross 86.8% 89.6% 91.1%
Source: NADA

NADA DATA 2017 | nada.org 11
New Light-Vehicle Dealerships (continued)
Luxury Dealership Profile
2015 2016 2017
Total sales $93,016,150 $94,128,296 $86,306,866
Total gross1 $9,980,162 $10,215,697 $9,652,044
As % of total sales 10.7% 10.9% 11.2%
Total expense $9,785,416 $10,072,428 $9,701,416
As % of total sales 10.5% 10.7% 11.2%
As % of total gross 98.0% 98.6% 100.5%
Total operating profit $194,619 $143,233 ($49,181)
As % of total sales 0.2% 0.2% -0.1%
As % of total gross 2.0% 1.4% -0.5%
Net profit before tax $2,606,132 $2,524,279 $2,409,299
As % of total sales 2.8% 2.7% 2.8%
As % of total gross 26.1% 24.7% 25.0%
New-vehicle department2
New-vehicle department total sales $53,270,605 $52,197,235 $46,508,524
New-vehicle department sales as % of total sales 57.3% 55.5% 53.9%
New-vehicle department gross as % of total gross 23.4% 22.7% 20.6%
New-vehicle selling price (retail)3 $50,191 $52,296 $53,044
Gross as % of selling price 5.1% 5.1% 4.6%
Retail gross profit per new vehicle retailed $2,579 $2,661 $2,430
Retail net profit per new vehicle retailed ($732) ($711) ($1,122)
Average number of new vehicles retailed 1,003 939 807
F&I income as % of new-vehicle department sales 2.0% 2.0% 2.1%
F&I penetration (new) 66.4% 69.8% 70.7%
1 Gross profit includes cost of goods sold, but not SG&A or advertising.2 Excludes F&I sales unless otherwise noted.3 Excludes F&I sales.

NADA DATA 2017 | nada.org 12
New Light-Vehicle Dealerships (continued)
Luxury Dealership Profile (continued)
2015 2016 2017
Used-vehicle department2
Used-vehicle department sales $27,916,848 $29,261,825 $27,660,353
Used-vehicle department sales as % of total sales 30.0% 31.1% 32.0%
Used-vehicle department gross as % of total gross 18.8% 18.5% 18.7%
Used-vehicle selling price (retail)3 $30,205 $30,553 $30,379
Gross as % of selling price 8.7% 8.4% 8.3%
Retail gross profit per new vehicle retailed $2,623 $2,556 $2,507
Retail net profit per new vehicle retailed ($37) ($144) ($197)
Average number of used vehicles retailed 683 723 700
F&I income as % of used-vehicle sales 2.3% 2.4% 2.5%
F&I penetration (used) 45.8% 50.2% 52.6%
Used- to new-unit vehicle ratio (retail only) 68.1% 77.0% 86.7%
Service, parts and body shop department
Service, parts and body shop sales $11,826,547 $12,665,377 $12,133,618
Service, parts and body shop sales as % of total sales 12.7% 13.5% 14.1%
Service, parts and body shop gross as % of total gross 57.7% 58.9% 60.6%
Warranty as % of total service, parts and body shop sales 20.6% 19.0% 20.8%
Advertising expense4 $635,917 $599,152 $537,352
As % of total gross 6.4% 5.9% 5.6%
Per new vehicle retailed $634 $638 $666
Rent and equivalent $1,244,705 $1,320,896 $1,185,167
As % of total gross 12.5% 12.9% 12.3%
Per new vehicle retailed $1,241 $1,407 $1,469
2 Includes F&I sales unless otherwise noted.3 Excludes F&I sales.4 Advertising expense includes advertising and sales promotion less advertising rebates. Some advertising data is reported in one account, which includes sales promotion and is already less advertising rebates.

NADA DATA 2017 | nada.org 13
New Light-Vehicle Dealerships (continued)
Luxury Dealership Profile (continued)
2015 2016 2017
Floor plan interest ($193,876) ($208,544) ($122,710)
As % of total sales -1.9% -2.0% -1.3%
Per new vehicle retailed ($193) ($222) ($152)
Selling, general and administrative expense $8,949,810 $9,330,490 $8,815,579
As % of total sales 9.6% 9.9% 10.2%
As % of total gross 89.7% 91.3% 91.3%
Source: NADA

NADA DATA 2017 | nada.org 14
New Light-Vehicle Dealerships (continued)
Mass-Market Dealership Profile
2015 2016 2017
Total sales $52,689,062 $55,741,355 $55,903,286
Total gross1 $6,194,993 $6,387,677 $6,391,168
As % of total sales 11.8% 11.5% 11.4%
Total expense $5,690,071 $6,097,607 $6,280,899
As % of total sales 10.8% 10.9% 11.2%
As % of total gross 91.8% 95.5% 98.3%
Total operating profit $504,923 $290,082 $112,772
As % of total sales 1.0% 0.5% 0.2%
As % of total gross 8.2% 4.5% 1.8%
Net profit before tax $1,381,859 $1,349,840 $1,251,327
As % of total sales 2.6% 2.4% 2.2%
As % of total gross 22.3% 21.1% 19.6%
New-vehicle department2
New-vehicle department total sales $30,760,162 $32,586,978 $32,687,910
New-vehicle department sales as % of total sales 58.4% 58.5% 58.5%
New-vehicle department gross as % of total gross 30.6% 28.7% 27.9%
New-vehicle selling price (retail)3 $31,359 $32,399 $32,426
Gross as % of selling price 6.7% 6.2% 5.9%
Retail gross profit per new vehicle retailed $2,099 $1,997 $1,901
Retail net profit per new vehicle retailed $65 ($162) ($335)
Average number of new vehicles retailed 908 929 939
F&I income as % of new-vehicle department sales 3.0% 2.9% 3.1%
F&I penetration (new) 93.3% 92.7% 92.6%
1 Gross profit includes cost of goods sold, but not SG&A or advertising.2 Includes F&I sales unless otherwise noted.3 Excludes F&I sales.
NADA DATA 2017 | nada.org 15
New Light-Vehicle Dealerships (continued)
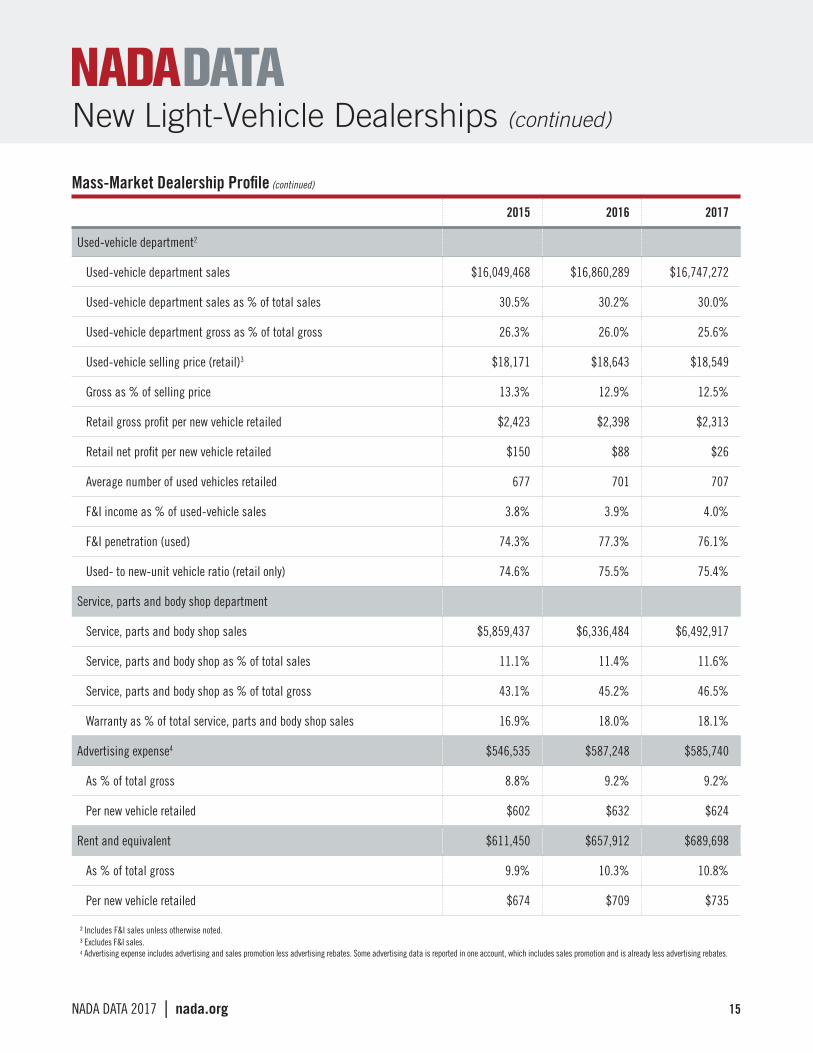
Mass-Market Dealership Profile (continued)
2015 2016 2017
Used-vehicle department2
Used-vehicle department sales $16,049,468 $16,860,289 $16,747,272
Used-vehicle department sales as % of total sales 30.5% 30.2% 30.0%
Used-vehicle department gross as % of total gross 26.3% 26.0% 25.6%
Used-vehicle selling price (retail)3 $18,171 $18,643 $18,549
Gross as % of selling price 13.3% 12.9% 12.5%
Retail gross profit per new vehicle retailed $2,423 $2,398 $2,313
Retail net profit per new vehicle retailed $150 $88 $26
Average number of used vehicles retailed 677 701 707
F&I income as % of used-vehicle sales 3.8% 3.9% 4.0%
F&I penetration (used) 74.3% 77.3% 76.1%
Used- to new-unit vehicle ratio (retail only) 74.6% 75.5% 75.4%
Service, parts and body shop department
Service, parts and body shop sales $5,859,437 $6,336,484 $6,492,917
Service, parts and body shop as % of total sales 11.1% 11.4% 11.6%
Service, parts and body shop as % of total gross 43.1% 45.2% 46.5%
Warranty as % of total service, parts and body shop sales 16.9% 18.0% 18.1%
Advertising expense4 $546,535 $587,248 $585,740
As % of total gross 8.8% 9.2% 9.2%
Per new vehicle retailed $602 $632 $624
Rent and equivalent $611,450 $657,912 $689,698
As % of total gross 9.9% 10.3% 10.8%
Per new vehicle retailed $674 $709 $735
2 Includes F&I sales unless otherwise noted.3 Excludes F&I sales.4 Advertising expense includes advertising and sales promotion less advertising rebates. Some advertising data is reported in one account, which includes sales promotion and is already less advertising rebates.

NADA DATA 2017 | nada.org 16
New Light-Vehicle Dealerships (continued)
Mass-Market Dealership Profile (continued)
2015 2016 2017
Floor plan interest ($128,653) ($105,632) ($42,803)
As % of total sales -2.1% -1.7% -0.7%
Per new vehicle retailed ($142) ($114) ($46)
Selling, general and administrative expense $5,259,782 $5,596,597 $5,680,419
As % of total sales 10.0% 10.0% 10.2%
As % of total gross 84.9% 87.6% 88.9%
Source: NADA
NADA DATA 2017 | nada.org 17
New Light-Vehicle Dealerships (continued)
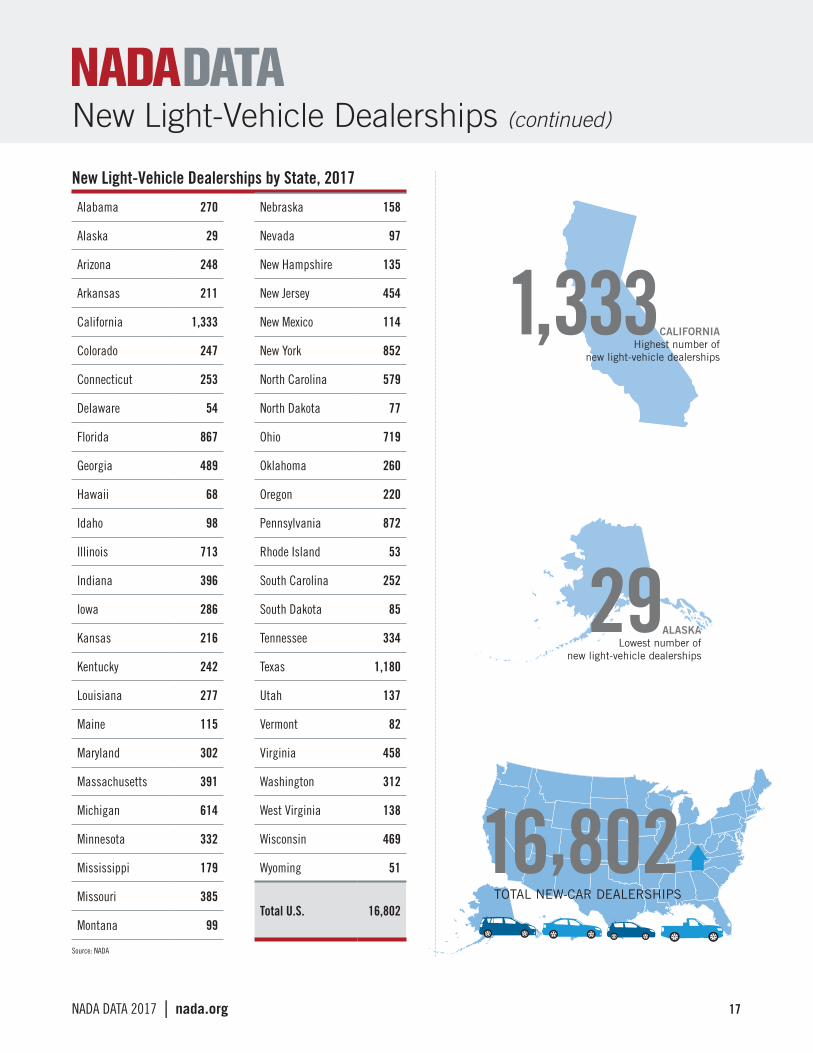
Alabama 270
Alaska 29
Arizona 248
Arkansas 211
California 1,333
Colorado 247
Connecticut 253
Delaware 54
Florida 867
Georgia 489
Hawaii 68
Idaho 98
Illinois 713
Indiana 396
Iowa 286
Kansas 216
Kentucky 242
Louisiana 277
Maine 115
Maryland 302
Massachusetts 391
Michigan 614
Minnesota 332
Mississippi 179
Missouri 385
Montana 99
New Light-Vehicle Dealerships by State, 2017
Nebraska 158
Nevada 97
New Hampshire 135
New Jersey 454
New Mexico 114
New York 852
North Carolina 579
North Dakota 77
Ohio 719
Oklahoma 260
Oregon 220
Pennsylvania 872
Rhode Island 53
South Carolina 252
South Dakota 85
Tennessee 334
Texas 1,180
Utah 137
Vermont 82
Virginia 458
Washington 312
West Virginia 138
Wisconsin 469
Wyoming 51
Total U.S. 16,802
16,802Source: NADA
TOTAL NEW-CAR DEALERSHIPS
ALASKALowest number of
new light-vehicle dealerships
29
1,333CALIFORNIAHighest number of
new light-vehicle dealerships
NADA DATA 2017 | nada.org 18
New Light-Vehicle Dealerships (continued)
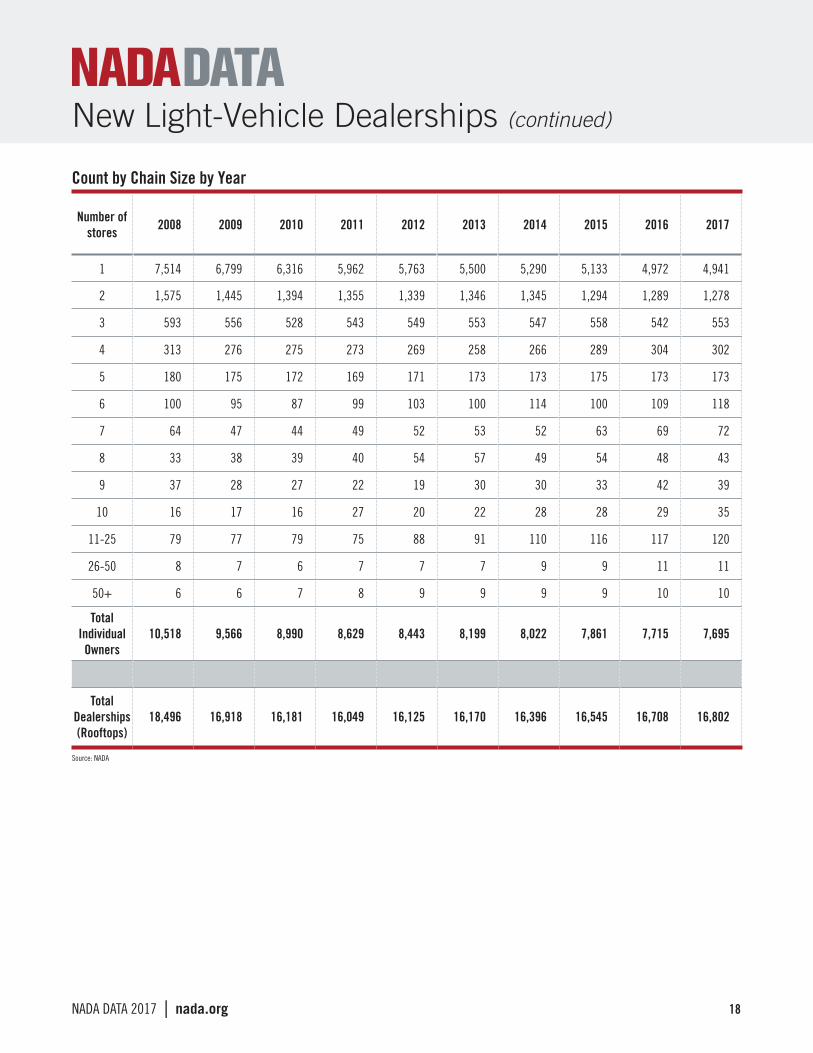
Count by Chain Size by Year
Number of stores 2008 2009 2010 2011 2012 2013 2014 2015 2016 2017
1 7,514 6,799 6,316 5,962 5,763 5,500 5,290 5,133 4,972 4,941
2 1,575 1,445 1,394 1,355 1,339 1,346 1,345 1,294 1,289 1,278
3 593 556 528 543 549 553 547 558 542 553
4 313 276 275 273 269 258 266 289 304 302
5 180 175 172 169 171 173 173 175 173 173
6 100 95 87 99 103 100 114 100 109 118
7 64 47 44 49 52 53 52 63 69 72
8 33 38 39 40 54 57 49 54 48 43
9 37 28 27 22 19 30 30 33 42 39
10 16 17 16 27 20 22 28 28 29 35
11-25 79 77 79 75 88 91 110 116 117 120
26-50 8 7 6 7 7 7 9 9 11 11
50+ 6 6 7 8 9 9 9 9 10 10
Total Individual Owners
10,518 9,566 8,990 8,629 8,443 8,199 8,022 7,861 7,715 7,695
Total Dealerships (Rooftops)
18,496 16,918 16,181 16,049 16,125 16,170 16,396 16,545 16,708 16,802
Source: NADA

NADA DATA 2017 | nada.org 19
Dealership Financial Trends
StateAll
dealerships ($ millions)
Average per dealership
($ thousands)
Alabama $12,589 $46,624
Alaska $1,642 $56,633
Arizona $22,246 $89,703
Arkansas $7,979 $37,815
California $119,696 $89,999
Colorado $17,169 $69,511
Connecticut $10,289 $40,667
Delaware $2,961 $54,826
Florida $77,423 $89,300
Georgia $29,293 $59,903
Hawaii $5,082 $74,734
Idaho $3,969 $40,498
Illinois $38,256 $53,655
Indiana $14,414 $36,398
Iowa $7,889 $27,582
Kansas $6,029 $27,914
Kentucky $8,707 $35,981
Louisiana $12,157 $43,888
Maine $3,706 $32,230
Maryland $19,646 $65,054
Massachusetts $21,299 $54,474
Michigan $40,344 $65,707
Minnesota $14,835 $44,682
Mississippi $7,217 $40,320
Missouri $18,425 $47,856
Montana $3,512 $35,478
StateAll
dealerships ($ millions)
Average per dealership
($ thousands)
Nebraska $5,179 $32,775
Nevada $8,471 $87,333
New Hampshire $5,780 $42,813
New Jersey $34,326 $75,609
New Mexico $5,097 $44,711
New York $60,348 $70,831
North Carolina $26,508 $45,782
North Dakota $2,198 $28,552
Ohio $35,907 $49,941
Oklahoma $43,712 $168,124
Oregon $11,064 $50,291
Pennsylvania $39,028 $44,757
Rhode Island $2,906 $54,823
South Carolina $13,344 $52,953
South Dakota $2,371 $27,899
Tennessee $15,780 $47,244
Texas $90,072 $76,332
Utah $8,578 $62,610
Vermont $2,559 $31,698
Virginia $22,771 $49,718
Washington $18,125 $58,092
West Virginia $4,772 $34,577
Wisconsin $15,131 $32,263
Wyoming $1,507 $29,553
Total U.S. $1,002,622 $59,673
Total Sales by State, 2017
Source: NADA* State-level estimates are calculated using the share of total U.S. new vehicle registrations in that state.
Oklahoma has an unusually high share of fleet registrations, which inflates dealership sales estimates.
*
NADA DATA 2017 | nada.org 20
Dealership Financial Trends (continued)
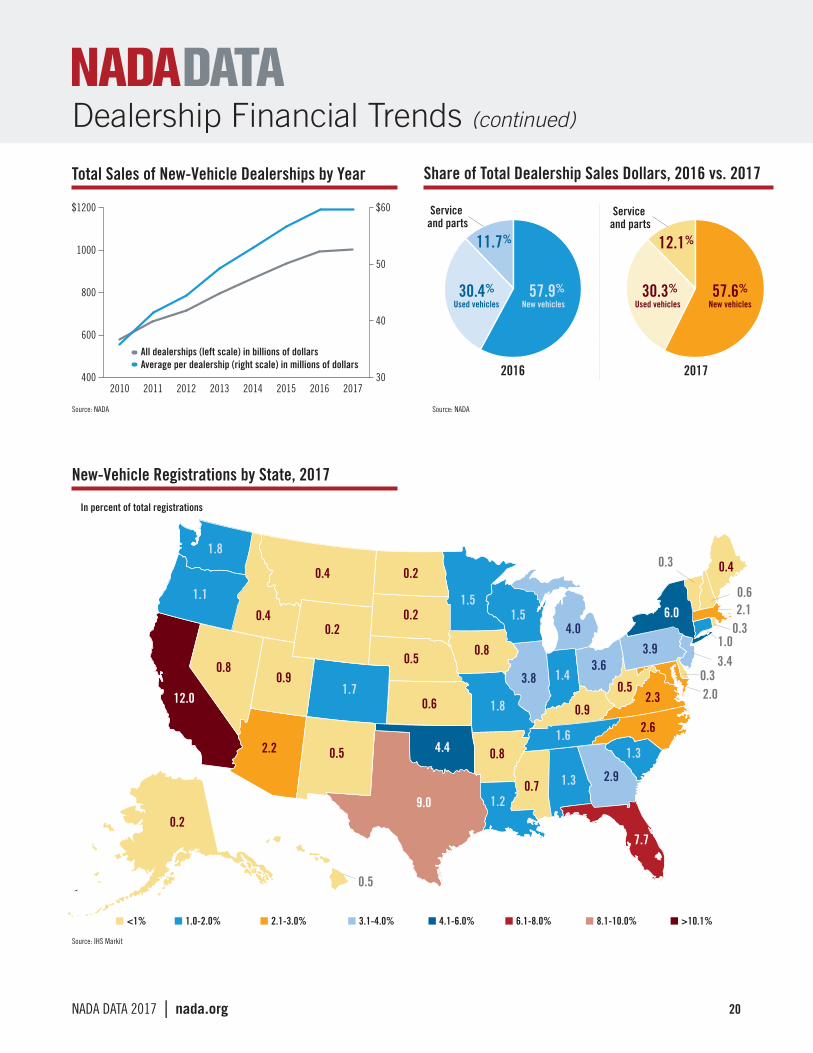
All dealerships (left scale) in billions of dollarsAverage per dealership (right scale) in millions of dollars
400
600
800
1000
$1200
2017201620152014201320122011201030
40
50
$60
Total Sales of New-Vehicle Dealerships by Year
Source: NADA
20172016
12.1%
New vehicles57.6%
Used vehicles 30.3%
Service and parts
11.7%
Service and parts
New vehicles57.9%
Used vehicles30.4%
Share of Total Dealership Sales Dollars, 2016 vs. 2017
Source: NADA
■ <1% ■ 1.0-2.0% ■ 2.1-3.0% ■ 3.1-4.0% ■ 4.1-6.0% ■ 6.1-8.0% ■ 8.1-10.0% ■ >10.1% ■ data not available
1.8
1.1
12.0
0.8
0.4
0.4 0.2
0.9
0.2
0.5
2.2 0.5
9.0
0.6
0.8
1.20.7 1.3 2.9
1.3
2.6
2.30.5
0.9
1.6
1.8
0.8
3.8
1.51.5
1.43.6
3.9
6.0
2.0
3.4
2.1
0.4
0.6
0.3
1.00.3
0.5
0.3
0.2
HI
7.7
1.7
4.0
4.4
0.2
In percent of total registrations
New-Vehicle Registrations by State, 2017
Source: IHS Markit

NADA DATA 2017 | nada.org 21
Dealership Financial Trends (continued)
0.0
0.5
1.0
$2.0
1.5
Average dealership, in millions of dollars, including F&I
2.02010 2011 2012 2013 2014 2015 2016 2017
New-Vehicle Department Gross Profit by Year
Source: NADA
0
0.5
1.0
1.5
$2.0
2010 2011 2012 2013 2014 2015 2016 2017
Average dealership, in millions of dollars, including F&I
Used-Vehicle Department Gross Profit by Year
Source: NADA

NADA DATA 2017 | nada.org 22
Dealership Financial Trends (continued)
2010 2011 2012 2013 2014 2015 2016 2017
Average dealership, in millions of dollars
0
.5
1.0
1.5
2.0
2.5
3.0
$3.5
0
.5
1.0
1.5
2.0
2.5
3.0%
Average dealership, in percent of sales
2010 2011 2012 2013 2014 2015 2016 2017
Service and Parts Department Gross Profit by Year
Total Net Profit Share of Sales by Year
Source: NADA
Source: NADA

NADA DATA 2017 | nada.org 23
New Light-Vehicle Department
New-Vehicle Inventories and Days’ Supply by Year
0
.5
1.0
1.5
2.0
2.5
3.0
3.5
4.0
Inventory (in millions) Days’ supply
Import
Domestic
Import
Total
20172010 20172010
Domestic
40
45
50
55
60
65
70
75
80
Average Number of New Vehicles Sold and Selling Price
Year New vehicles sold Average retail selling price
2010 714 $30,079
2011 793 $30,982
2012 896 $31,194
2013 960 $32,035
2014 1,003 $32,824
2015 1,051 $33,456
2016 1,045 $34,449
2017 1,020 $34,670
Source: Automotive News
NEW-VEHICLE DAYS’ SUPPLY 70 56
domestic import
NEW-CAR INVENTORY
1,923,100domestic
1,866,400import
3,789,500
SOLD
$34,670AVERAGE SELLING PRICE OF
NEW VEHICLES SOLD(by new-vehicle dealerships)
Source: WardsAuto, NADA

NADA DATA 2017 | nada.org 24
New Light-Vehicle Department (continued)
New Light-Duty Vehicle Sales by Year
Year New cars Light-duty trucks Total light-duty vehicles
Light-duty trucks as % of total
2006 7,780,800 8,721,000 16,502,700 52.8%
2007 7,618,400 8,470,900 16,089,300 52.6%
2008 6,813,550 6,381,050 13,194,600 48.4%
2009 5,456,300 4,945,400 10,401,700 47.5%
2010 5,635,400 5,919,100 11,554,500 51.2%
2011 6,089,300 6,644,900 12,734,200 52.2%
2012 7,242,800 7,199,000 14,441,800 49.8%
2013 7,582,500 7,942,300 15,524,800 51.2%
2014 7,688,900 8,748,100 16,437,000 53.2%
2015 7,525,023 9,861,024 17,386,047 56.7%
2016 6,873,158 10,591,862 17,465,020 60.6%
2017 6,079,584 11,055,149 17,134,733 64.5%
Gross Margin as Percentage of Selling Price by Year (excluding F&I)
New vehicles retailed
2016 2017201520142013201220112010
2
2.5
3.5
3
4
4.5%
Source: NADA
Source: WardsAuto

NADA DATA 2017 | nada.org 25
● gain ● no change ● lossAll Figures are Year to Date / Year to Date Changes
Loss/G
ain
Market Share, by manufacturer
SubaruBMW
Other*
Hyundai-Kia
*Other is Jaquar/Land Rover, Mitsubishi, Mazda, Tesla, Volvo
Daimler
Nissan
Toyota
2.0%
1.8
1.6
1.4
1.2
1.0
0.8
0.6
0.4
0.2
0
-0.2
-0.4
-0.6
-0.8
-1.0
-1.2
-1.4
-1.6
-1.8
-2.0%
Honda
VW
FCAFord
GM
New Light-Vehicle Department (continued)
Manufacturer Gains/Losses in Market Share, 2017
New-Vehicle Sales and Market Share by Manufacturer
Year FCA Ford GM Toyota Honda Nissan Volkswagen Other Total
20172,042,173 2,512,881 3,000,147 2,434,515 1,641,429 1,593,464 339,676 3,570,448
17,134,733 11.9% 14.7% 17.5% 14.2% 9.6% 9.3% 2.0% 20.8%
Source: WardsAuto
Loss
/Gai
n

NADA DATA 2017 | nada.org 26
F&I Department
Aftermarket Income by Year
0
10
20
30
40
50 Total
2010 2011 2012 2013 2014 2015 2016 2017
As % of new- and used-vehicle department gross profit
Service contract and other
Finance and insurance
60%
Service Contract Penetration Rates by Year
As a % of vehicles retailed
30
40
50%
2010 2011 2012 2013 2014 2015 20172016
■ New ■ Used
Source: NADA
Source: NADA

NADA DATA 2017 | nada.org 27
Used-Vehicle Department
Used-Vehicle Sales by New-Vehicle Dealerships, by Year
In millions
0
3
6
9
12
15
201520142013201220112010 2016 2017
Average Retail Selling Price of Used Vehicles Sold by New-Vehicle Dealerships
In thousands
2015 2016 201720142013201220112010
15.0
17.5
$20.0
42.9%
22.7%
25.5%
4.8%
4.1%
Trade-in onnew vehicle
Trade-in onused vehicle
Auctionpurchase
Streetpurchase
Other
Sources of Used Vehicles Retailed by New-Vehicle Dealerships, 2017
SOLD
$20,009AVERAGE RETAIL SELLING PRICE
OF USED VEHICLES SOLD(by new-vehicle dealerships)
Source: NADA Source: NADA
Source: NADA

NADA DATA 2017 | nada.org 28
Service and Parts Department
Service labor sales (in billions of dollars)
0
5
10
15
$20
OtherInternalSubletWarrantyCustomer body
Customermechanical
Dealerships’ Total Service and Parts Sales, 2017
Service labor sales (in billions of dollars)
Parts sales (in billions of dollars)
0
5
10
15
$20
OtherInternalWarrantyCounterWholesaleCustomer body
Customer mechanical
Dealerships’ Total Service andParts Sales, 2017 (in billions of dollars)
Service labor sales
Customer mechanical $20.00
Customer body $4.08
Warranty $9.86
Sublet $3.96
Internal $8.73
Other $4.13
Total service labor $50.75
Parts sales
Customer mechanical $17.42
Customer body $3.56
Wholesale $17.58
Counter $2.91
Warranty $12.70
Internal $6.21
Other $7.10
Total parts $67.48
Parts sales (in billions of dollars)
$114.15 billionSERVICE AND PARTS SALES
(for all new-vehicle dealerships)
60
80
$120
100
201520142013201220112010
In billions of dollars
2016 2017
Dealerships’ Total Service and Parts Sales by Year
Source: NADA
Source: NADA
Source: NADA
NADA DATA 2017 | nada.org 29
Service and Parts Department (continued)
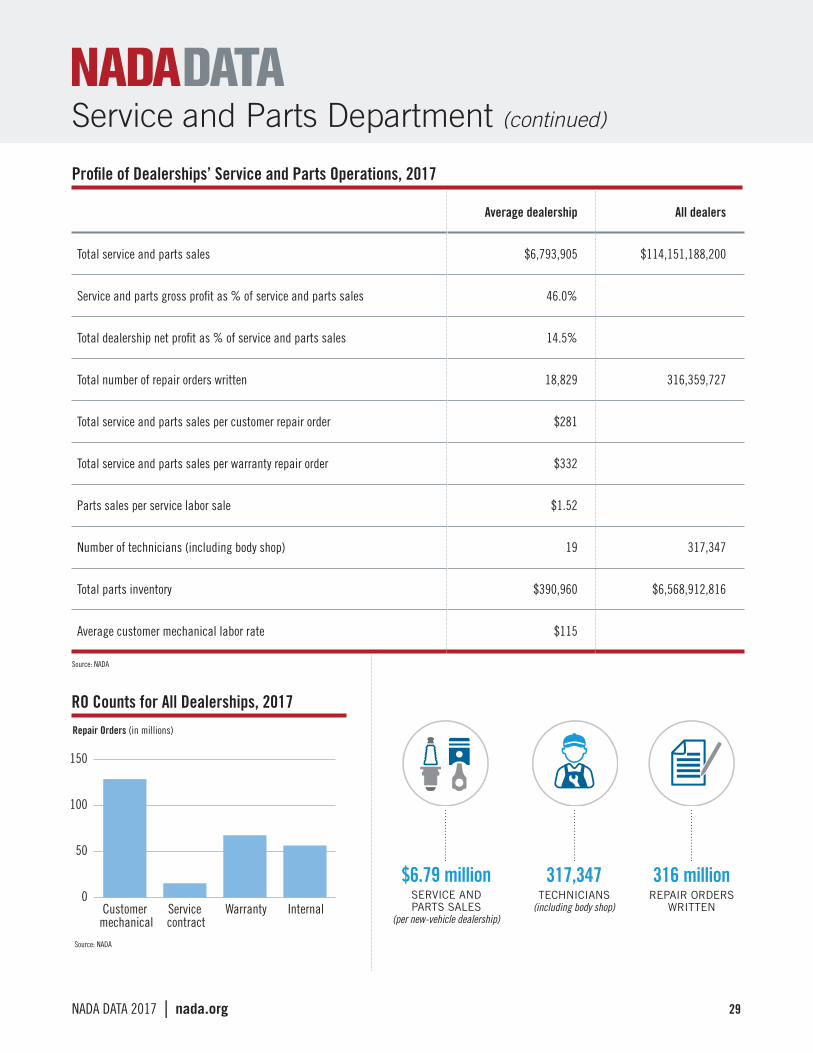
Profile of Dealerships’ Service and Parts Operations, 2017
Average dealership All dealers
Total service and parts sales $6,793,905 $114,151,188,200
Service and parts gross profit as % of service and parts sales 46.0%
Total dealership net profit as % of service and parts sales 14.5%
Total number of repair orders written 18,829 316,359,727
Total service and parts sales per customer repair order $281
Total service and parts sales per warranty repair order $332
Parts sales per service labor sale $1.52
Number of technicians (including body shop) 19 317,347
Total parts inventory $390,960 $6,568,912,816
Average customer mechanical labor rate $115
$6.79 millionSERVICE AND PARTS SALES
(per new-vehicle dealership)
317,347TECHNICIANS
(including body shop)
316 millionREPAIR ORDERS
WRITTEN
Repair Orders (in millions)
0
50
100
150
InternalWarrantyService contract
Customer mechanical
RO Counts for All Dealerships, 2017
Source: NADA
Source: NADA
NADA DATA 2017 | nada.org 30
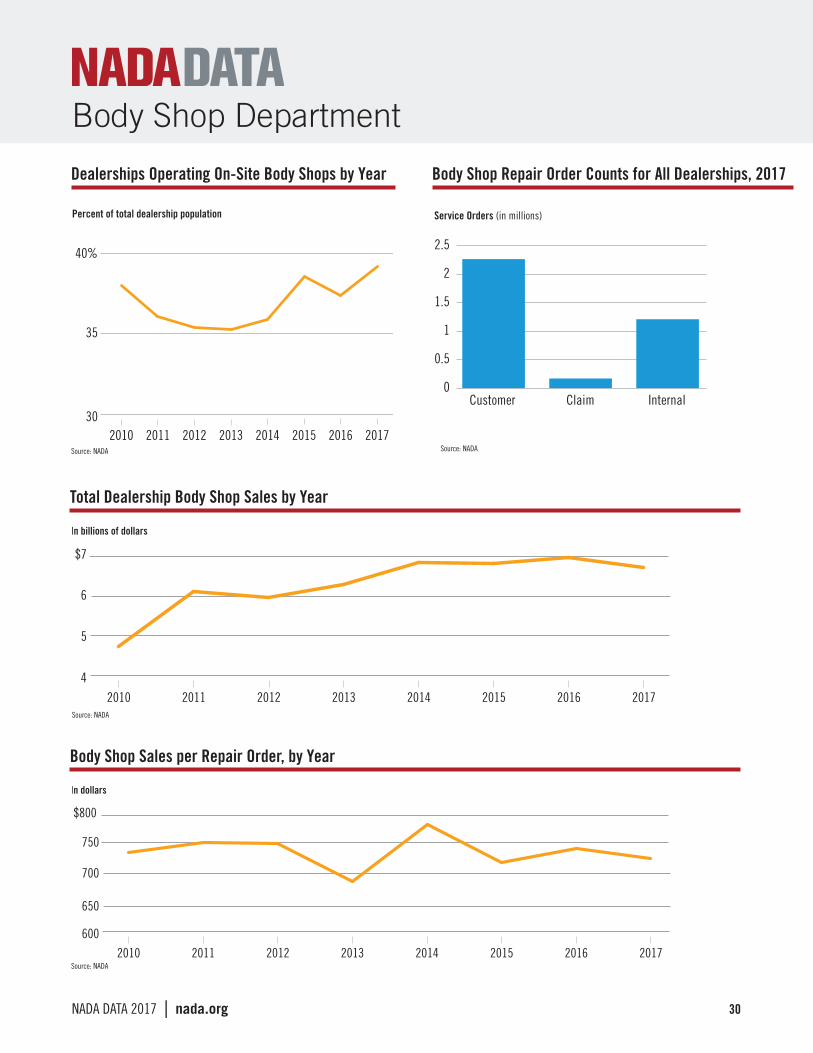
Body Shop Department
Dealerships Operating On-Site Body Shops by Year
30
40%
2014 20152013201220112010
35
Percent of total dealership population
2016 2017Source: NADA
Total Dealership Body Shop Sales by Year
4
5
$7
201520142013201220112010
In billions of dollars
6
2016 2017Source: NADA
Body Shop Sales per Repair Order, by Year
600
650
700
750
$800
201520142013201220112010
In dollars
2016 2017Source: NADA
Service Orders (in millions)
0
1
1.5
2
0.5
2.5
InternalClaimCustomer
Body Shop Repair Order Counts for All Dealerships, 2017
Source: NADA

NADA DATA 2017 | nada.org 31
Dealership Advertising
Total Dealership Advertising Expenditures by Year
4
8
$10
201520142013201220112010
In billions of dollars
6
2016 2017
Average Dealership Advertising per New Unit Sold, by Year
600
640
$650
201520142013201220112010
In dollars
620
2016 2017
630
610
Source: NADA
Source: NADA

NADA DATA 2017 | nada.org 32
Radio
Other
Direct mail
15.0%
55.4%
6.1%
10.0%
Newspaper
6.3%
7.2%Internet
TV
Dealership Advertising (continued)
Advertising Expenditures by Medium, 2017
Estimated Advertising Expenses per Dealership, 2017
Source: NADA
By media used Average of all dealerships
Newspapers $36,620
Radio $57,942
Television $86,914
Direct mail $41,719
Internet $321,001
Other $35,171
Total $579,425
Total advertising as % of total sales 1.0%
Source: NADA

NADA DATA 2017 | nada.org 33
Employment and Payroll
Number of Dealership Employees by State, 2017
1,135,700DEALERSHIP EMPLOYEES
State Total number, all dealers
Average number per dealership
Alabama 15,125 56
Alaska 2,001 69
Arizona 24,480 99
Arkansas 10,123 48
California 121,438 91
Colorado 19,378 78
Connecticut 14,114 56
Delaware 4,320 80
Florida 81,072 94
Georgia 33,324 68
Hawaii 4,427 65
Idaho 6,315 64
Illinois 45,921 64
Indiana 23,078 58
Iowa 12,814 45
Kansas 10,322 48
Kentucky 13,835 57
Louisiana 16,393 59
Maine 5,571 48
Maryland 23,960 79
Massachusetts 24,327 62
Michigan 36,644 60
Minnesota 20,536 62
Mississippi 8,402 47
Missouri 22,561 59
Montana 4,016 41
Nebraska 7,812 49
Nevada 9,137 69
New Hampshire 6,765 50
New Jersey 32,694 72
New Mexico 6,968 61
New York 51,213 60
State Total number, all dealers
Average number per dealership
North Carolina 36,429 63
North Dakota 3,834 50
Ohio 43,576 61
Oklahoma 13,926 54
Oregon 13,491 61
Pennsylvania 50,275 58
Rhode Island 3,475 66
South Carolina 16,085 64
South Dakota 4,326 51
Tennessee 22,314 67
Texas 100,699 85
Utah 10,302 75
Vermont 3,032 37
Virginia 32,510 71
Washington 22,789 73
West Virginia 6,437 47
Wisconsin 24,401 52
Wyoming 2,208 43
Total U.S. 1,135,700 69
69Average per dealership
Source: Bureau of Labor Statistics, NADA

NADA DATA 2017 | nada.org 34
Dealership Employment by Position, 2017
Employment and Payroll (continued)
Estimated Number of Dealership Employees by Year
20.9%
New and used-carsalespeople
Technicians
Supervisors,others
Other service andparts employees
28.7%
27.6%
27.6%
Total of all dealerships (left scale)Average number per dealership (right scale)
2010
50
60
70
80
800
1,000
1,200
2011 2012 2013 2014 2015 2016 2017
Average Weekly Earnings of New Light-Vehicle Dealership Employees by State, 2017*
Alabama $1,061
Alaska $1,144
Arizona $1,133
Arkansas $1,013
California $1,270
Colorado $1,169
Connecticut $1,184
Delaware $1,062
Florida $1,124
Georgia $1,095
Hawaii $1,210
Idaho $1,014
Illinois $1,026
Indiana $976
Iowa $1,011
Kansas $975
Kentucky $997
Louisiana $1,054
Maine $990
Maryland $1,111
Massachusetts $1,264
Michigan $1,138
Minnesota $1,004
Mississippi $975
Missouri $1,021
Montana $1,013
Nebraska $1,010
Nevada $1,260
New Hampshire $1,233
New Jersey $1,282
New Mexico $1,007
New York $1,201
North Carolina $1,035
North Dakota $1,025
Ohio $1,010
Oklahoma $1,025
Oregon $1,096
Pennsylvania $1,001
Rhode Island $1,041
South Carolina $1,039
South Dakota $1,045
Tennessee $1,117
Texas $1,194
Utah $1,060
Vermont $1,073
Virginia $1,098
Washington $1,125
West Virginia $877
Wisconsin $903
Wyoming $970
Total U.S. $1,113
Source: Bureau of Labor Statistics, NADA
Source: Bureau of Labor Statistics, NADA
Source: NADA
* We are aware that there are differences in methodologies used to calculate wages and earnings both across federal agencies and in our published reports. These differing methodologies will lead to some discrepancies in the wages and earnings reported here and in other publications. It is not the result of errors.

NADA DATA 2017 | nada.org 35
Employment and Payroll (continued)
StateTotal all dealers(billions)
Average per dealership(millions)
Alabama $0.83 $3.09
Alaska $0.12 $4.10
Arizona $1.44 $5.81
Arkansas $0.53 $2.53
California $8.02 $6.01
Colorado $1.18 $4.77
Connecticut $0.87 $3.44
Delaware $0.24 $4.42
Florida $4.74 $5.47
Georgia $1.90 $3.88
Hawaii $0.28 $4.10
Idaho $0.33 $3.40
Illinois $2.45 $3.44
StateTotal all dealers(billions)
Average per dealership(millions)
Indiana $1.17 $2.96
Iowa $0.67 $2.35
Kansas $0.52 $2.42
Kentucky $0.72 $2.97
Louisiana $0.90 $3.24
Maine $0.29 $2.49
Maryland $1.38 $4.58
Massachusetts $1.60 $4.09
Michigan $2.17 $3.53
Minnesota $1.07 $3.23
Mississippi $0.43 $2.38
Missouri $1.20 $3.11
Montana $0.21 $2.14
Annual Payroll of New-Vehicle Dealerships by State, 2017
Annual Payroll of New-Vehicle Dealerships by Year
Total of all dealerships (left scale), in billionsAverage per dealership (right scale), in millions
2010 2011 2012 2013 2014 2015
30
40
50
60
$70
2.5
3.0
3.5
$4.0
2016 2017
StateTotal all dealers(billions)
Average per dealership(millions)
Nebraska $0.41 $2.60
Nevada $0.60 $6.17
New Hampshire $0.43 $3.21
New Jersey $2.18 $4.80
New Mexico $0.36 $3.20
New York $3.20 $3.75
North Carolina $1.96 $3.39
North Dakota $0.20 $2.65
Ohio $2.29 $3.18
Oklahoma $0.74 $2.85
Oregon $0.77 $3.49
Pennsylvania $2.62 $3.00
Rhode Island $0.12 $2.29
South Carolina $0.87 $3.45
South Dakota $0.24 $2.76
Tennessee $1.30 $3.88
Texas $6.25 $5.30
Utah $0.57 $4.15
Vermont $0.17 $2.06
Virginia $1.86 $4.05
Washington $1.33 $4.27
West Virginia $0.29 $2.13
Wisconsin $1.15 $2.44
Wyoming $0.11 $2.18
Total U.S. $65.28 $3.89
Source: Bureau of Labor Statistics, NADA

NADA DATA 2017 | nada.org 36
New- and Used-Vehicle Consumer
Credit Score Ranges
Category Score Range
Superprime 781-850
Prime 661-780
Nonprime 601-660
Subprime 501-600
Deep subprime 300-500
Percentage of Vehicles with Financing
Q4 2017Q4 2016Q4 2015Q4 2014Q4 2013Q4 2012Q4 2011Q4 20100
20
40
60
80
100%
81.4%
50.9%
82.2%
53.3%
82.1%
52.8%
83.7%
53.5%
84.0%
55.2%
85.9%
54.7%
85.2% 85.1%
53.5% 53.8%
■ New ■ Used
Consumer Leasing of New Vehicles
15
20
30%
25
Q4 2015Q4 2014Q4 2013Q4 2012Q4 2011Q4 2010 Q4 2016 Q4 2017
■ Superprime ■ Prime ■ Nonprime ■ Subprime
0
20
40
60
80
100%
Q4 2017Q4 2016
6.40%6.93%
15.71%16.32%
48.37%48.12%
29.09%28.15%
New Leasing by Risk Segment
Source: Experian
Source: Experian
Source: Experian

NADA DATA 2017 | nada.org 37
New- and Used-Vehicle Consumer (continued)
UsedNew59
60
61
62
63
64
65
66
67
68
69
One month
■ Q4 2016 ■ Q4 2017
68
63
69
64
One month
Average Loan Term, in Months
UsedNew
■ Q4 2016 ■ Q4 2017
0
100
200
300
400
500
$600
$364
$515
$371
$506
$9
$7
Average Monthly Payment New-Vehicle Market Share by Lender Type, 2017
Finance
Credit union
Captive BHPH
Bank29.4%
4.7%
52.4%
13.4%
0.1%
Source: Experian
Source: Experian
Source: Experian

NADA DATA 2017 | nada.org 38
New- and Used-Vehicle Consumer (continued)
Q4 2014Q4 2013Q4 2012Q4 2011Q4 2010Q4 2009Q4 2008Q4 2007 Q4 2015 Q4 2016 Q4 2017600
650
700
750
800■ New ■ Used
711726
736 732 727 723 715 712
640 647657 659 653 650 646 648
711
649
711
654
716
656
Average Loan Credit Scores by Vehicle Type
For more information on Experian data, contact auto@experian�com�
Source: Experian