24 session of the ccsa 11 september 2014 fao hq,...
TRANSCRIPT

24th Session of the CCSA
11th September 2014
FAO HQ, Rome, Italy
Part I ◦ FAO Statistics System Statistics Governance Statistical Programme of Work 2014-15 Statistics Quality Assurance Framework
Part II ◦ FAO’s new Strategic Framework + M&E Framework Corporate baseline survey Measuring the impact of statistical activities

Brief Overview
FAO has a decentralized statistical system involving 17
divisions in 8 departments
◦ 5 Regional Statisticians provide dedicated support to member countries
FAO Statistics covers all sectors related to food & agriculture:
crops, livestock, forestry, fisheries, natural resources (land
& water), agri-business, food security and nutrition.
Statistical activities cover 5 key functions:
◦ Data collection, processing & dissemination
◦ Monitoring & analysis
◦ Norms & standards
◦ Capacity development
◦ Statistics coordination
Recently new institutional roles and bodies established to ensure stronger governance of the FAO statistical systems
Inter-Departmental Working Group on FAO Statistics ◦ formal statistics coordination mechanism, membership includes
all units within FAO concerned with the collection, compilation & dissemination of statistics, including the Regional Offices
◦ promotes inter-divisional coordination and cooperation on statistical programmes, as well as corporate consistency and alignment in statistical practices
Chief Statistician ◦ manages the overall governance and coordination of the FAO
statistical system, represents FAO in international forums ◦ ensures the quality and integrity of the technical and normative
work of the Organization

First International Advisory Group on FAO Statistics (IAGFS) in 2013
Very successful meeting, with high participation from IOs
However, informal body with a strictly advisory function, based on a limited country membership
Working towards establishing an FAO Global Commission on Statistics
To increase member country involvement , participation and ownership in strategic discussions on FAO Statistics
Process in place (for legal, financial & senior management review & approval). Endorsement foreseen in June 2015 (FAO conference)
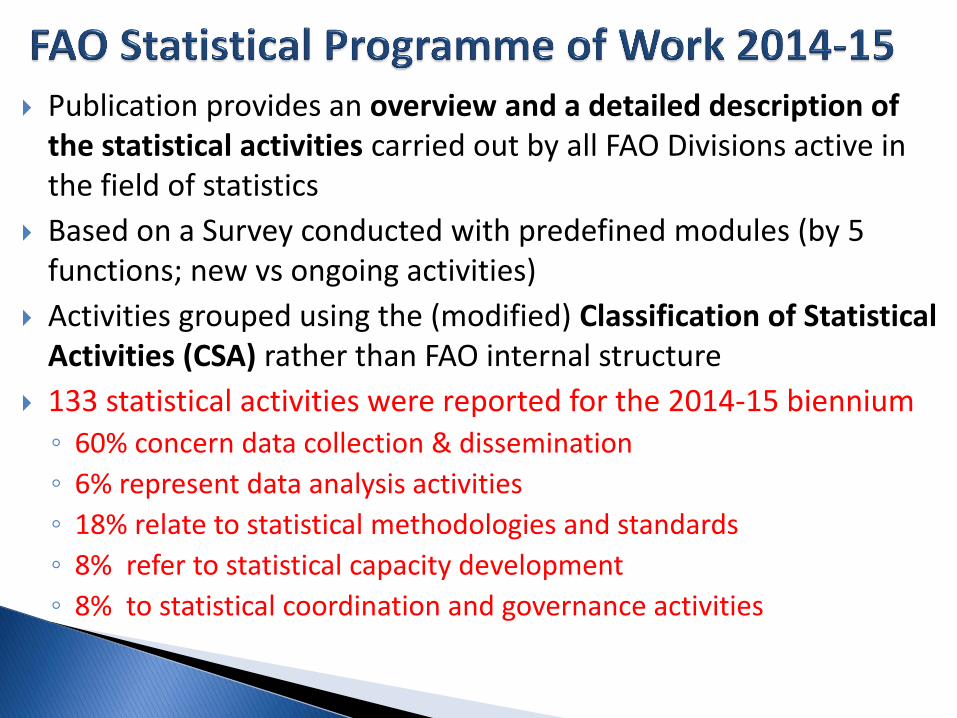
Publication provides an overview and a detailed description of the statistical activities carried out by all FAO Divisions active in the field of statistics
Based on a Survey conducted with predefined modules (by 5 functions; new vs ongoing activities)
Activities grouped using the (modified) Classification of Statistical Activities (CSA) rather than FAO internal structure
133 statistical activities were reported for the 2014-15 biennium ◦ 60% concern data collection & dissemination
◦ 6% represent data analysis activities
◦ 18% relate to statistical methodologies and standards
◦ 8% refer to statistical capacity development
◦ 8% to statistical coordination and governance activities
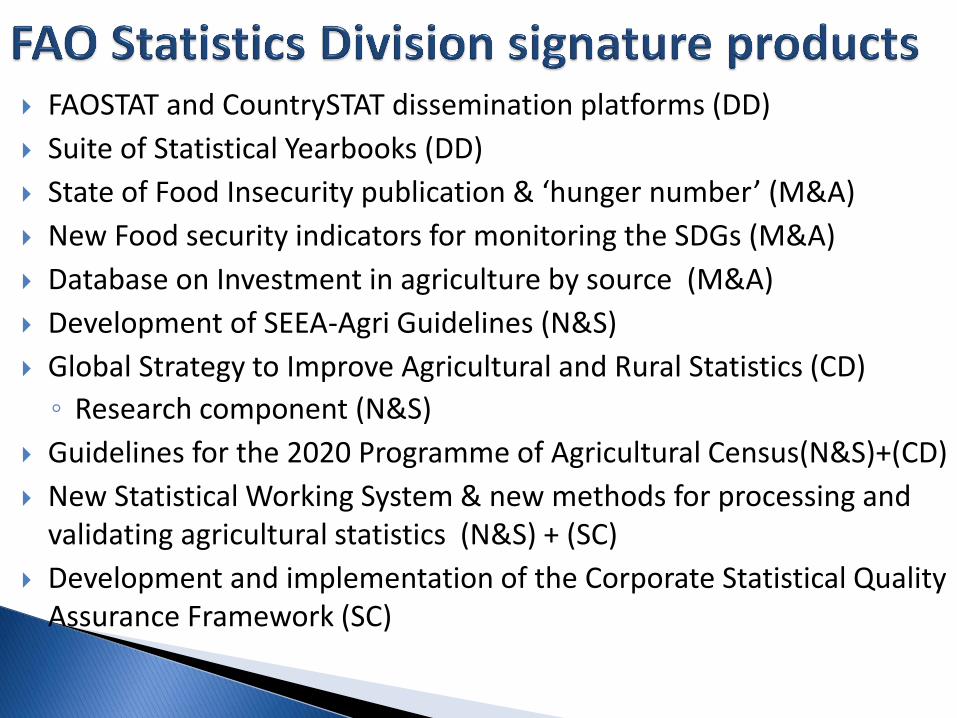
FAOSTAT and CountrySTAT dissemination platforms (DD)
Suite of Statistical Yearbooks (DD)
State of Food Insecurity publication & ‘hunger number’ (M&A)
New Food security indicators for monitoring the SDGs (M&A)
Database on Investment in agriculture by source (M&A)
Development of SEEA-Agri Guidelines (N&S)
Global Strategy to Improve Agricultural and Rural Statistics (CD)
◦ Research component (N&S)
Guidelines for the 2020 Programme of Agricultural Census(N&S)+(CD)
New Statistical Working System & new methods for processing and validating agricultural statistics (N&S) + (SC)
Development and implementation of the Corporate Statistical Quality Assurance Framework (SC)
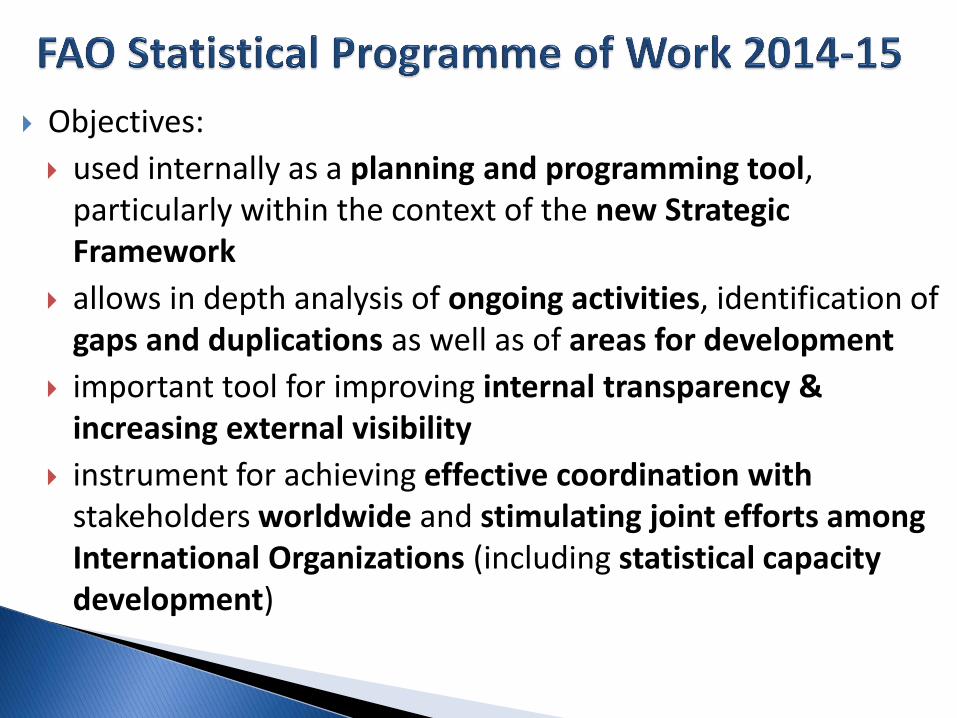
Objectives:
used internally as a planning and programming tool, particularly within the context of the new Strategic Framework
allows in depth analysis of ongoing activities, identification of gaps and duplications as well as of areas for development
important tool for improving internal transparency & increasing external visibility
instrument for achieving effective coordination with stakeholders worldwide and stimulating joint efforts among International Organizations (including statistical capacity development)
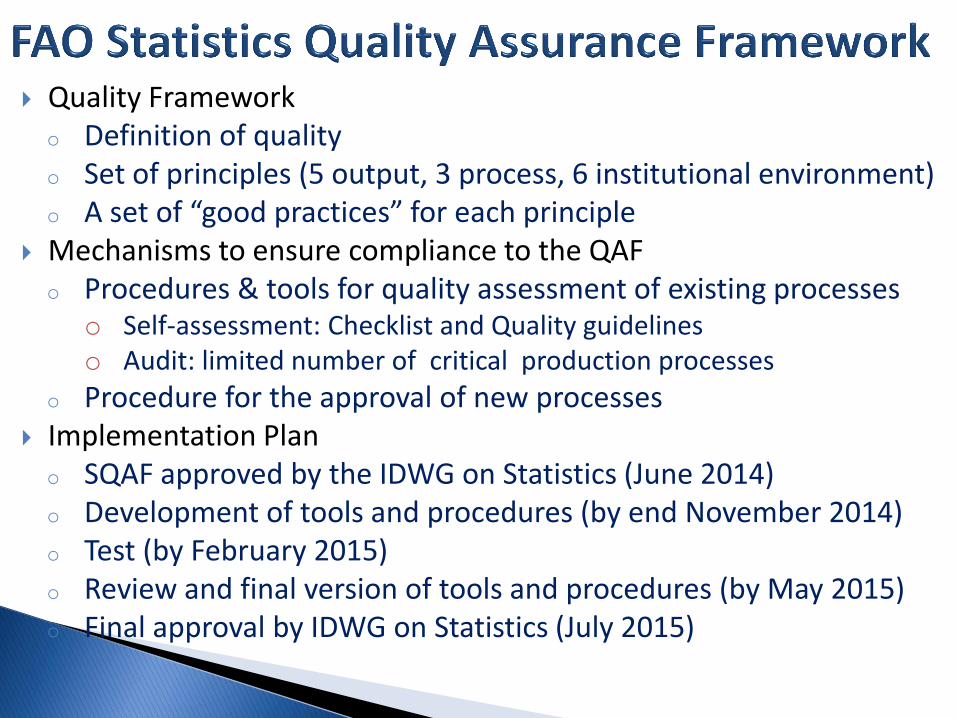
Quality Framework o Definition of quality o Set of principles (5 output, 3 process, 6 institutional environment) o A set of “good practices” for each principle
Mechanisms to ensure compliance to the QAF o Procedures & tools for quality assessment of existing processes
o Self-assessment: Checklist and Quality guidelines o Audit: limited number of critical production processes
o Procedure for the approval of new processes Implementation Plan o SQAF approved by the IDWG on Statistics (June 2014) o Development of tools and procedures (by end November 2014) o Test (by February 2015) o Review and final version of tools and procedures (by May 2015) o Final approval by IDWG on Statistics (July 2015)

Five Strategic Objectives: ◦ SO1: Contribute to the eradication of hunger, food insecurity
and malnutrition ◦ SO2: Increase and improve provision of goods and services
from agriculture, forestry and fisheries in a sustainable manner
◦ SO3: Reduce Rural Poverty ◦ SO4: Enable more inclusive and efficient food and agricultural
systems ◦ SO5: Increase the resilience of livelihoods to threats and
crises
Objective 6: ◦ Technical quality, knowledge & services, governance, &
gender mainstreaming

Dual role:
1. Contribute to specific outputs & activities of the individual Strategic Objectives (SOs)
2. Create internal and external enabling environments that facilitate the delivery of corporate results under all of the Strategic Objectives (Objective 6)
3. Global public goods (Objective 6)
Statistics is also the basis for the corporate M&E system:
1. Indicators at all levels of the results chain
2. Evidence base on which priorities are set
3. Specific data collections to produce measures of progress
Importance of strong internal and external governance system

Sustainable management and utilization of natural resources
Global Goals
Eradicate hunger, food insecurity and malnutrition
Elimination of poverty through economic and social progress for all
SO1: Contribute to the eradication of hunger, food insecurity and malnutrition
SO 4: Enable more inclusive and efficient agricultural and food systems at local, national and international levels
SO 3: Reduce rural poverty
SO 5: Increase the resilience of livelihoods to threats and crises
SO 2: Increase and improve provision of goods and services from agriculture, forestry and fisheries in a sustainable manner
Organizational Outcomes
Organizational Outcomes
Organizational Outcomes
Organizational Outcomes
Organizational Outcomes
Outputs
Outputs
Outputs
Outputs
Outputs
Outputs
Outputs
Outputs
Outputs
Outputs
FAO Enabling Environment
Development outcome indicators for monitoring progress, which measure the long term effects to which OOs contribute
Organizational Outcome indicators to measure changes produced from the use of FAO outputs, among others
Enabling functions for improved corporate performance monitored by key performance indicators
Output indicators for monitoring FAO deliverables
Outreach
Efficient and effective administration
Information Technology
FAO Governance, Oversight and
Direction
14
Objective on technical quality, knowledge and services, including Statistics and the cross-cutting themes Gender and
Governance
OVERVIEW - FAO’s results chain model
Technical Cooperation Programme
Capital Expenditures
Security Expenditure
Contingencies

• Limited number of indicators
• 20 SO-level indicators
• 34 OO-level indicators
• 50 Output-level indicators
• Based as much as possible on available data
Simple to interpret:
Clearly demonstrates high performance
Allows for effective identification of FAO contribution
Identifies where responsive action is needed
• Built on lessons learned from monitoring previous FAO SF and best practices of other agencies (DFID, WB, AfDB)
15
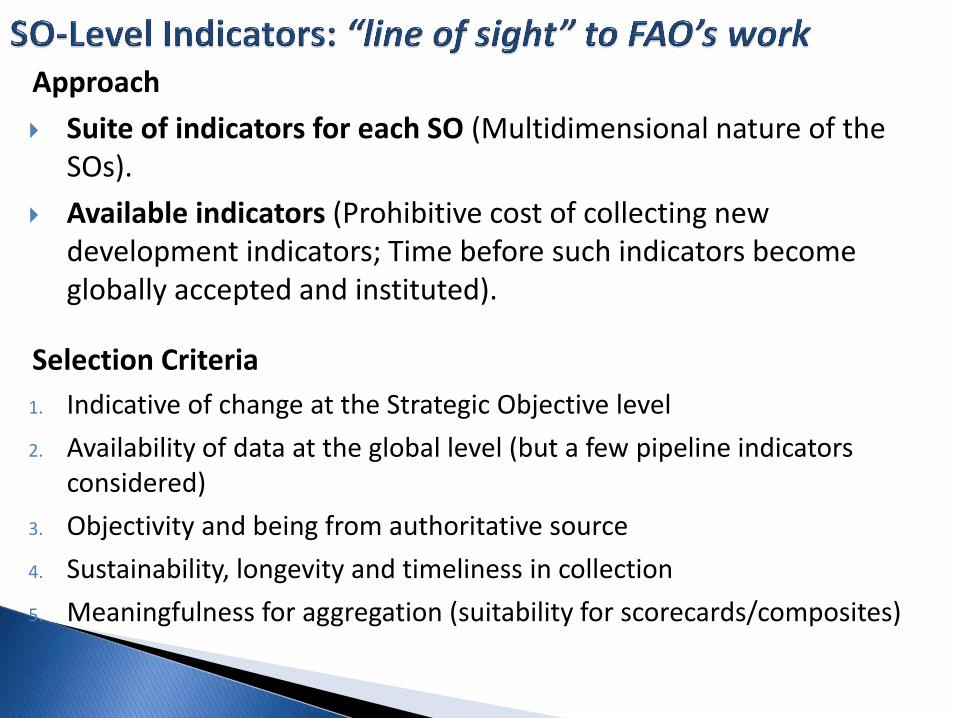
Approach
Suite of indicators for each SO (Multidimensional nature of the SOs).
Available indicators (Prohibitive cost of collecting new development indicators; Time before such indicators become globally accepted and instituted).
Selection Criteria
1. Indicative of change at the Strategic Objective level
2. Availability of data at the global level (but a few pipeline indicators considered)
3. Objectivity and being from authoritative source
4. Sustainability, longevity and timeliness in collection
5. Meaningfulness for aggregation (suitability for scorecards/composites)
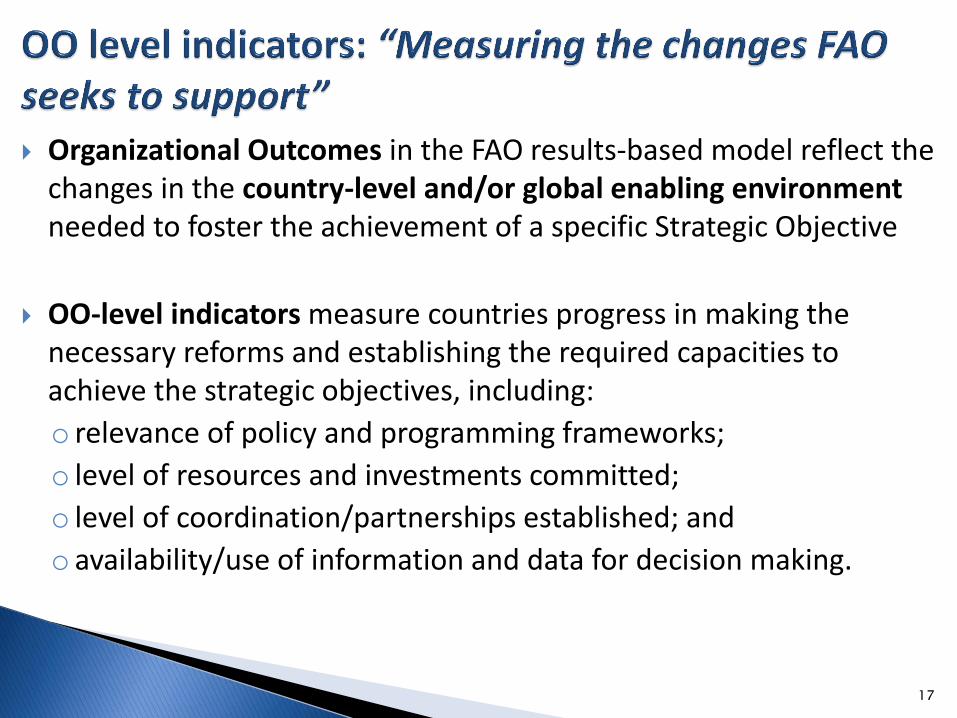
Organizational Outcomes in the FAO results-based model reflect the changes in the country-level and/or global enabling environment needed to foster the achievement of a specific Strategic Objective
OO-level indicators measure countries progress in making the necessary reforms and establishing the required capacities to achieve the strategic objectives, including:
o relevance of policy and programming frameworks;
o level of resources and investments committed;
o level of coordination/partnerships established; and
o availability/use of information and data for decision making.
17
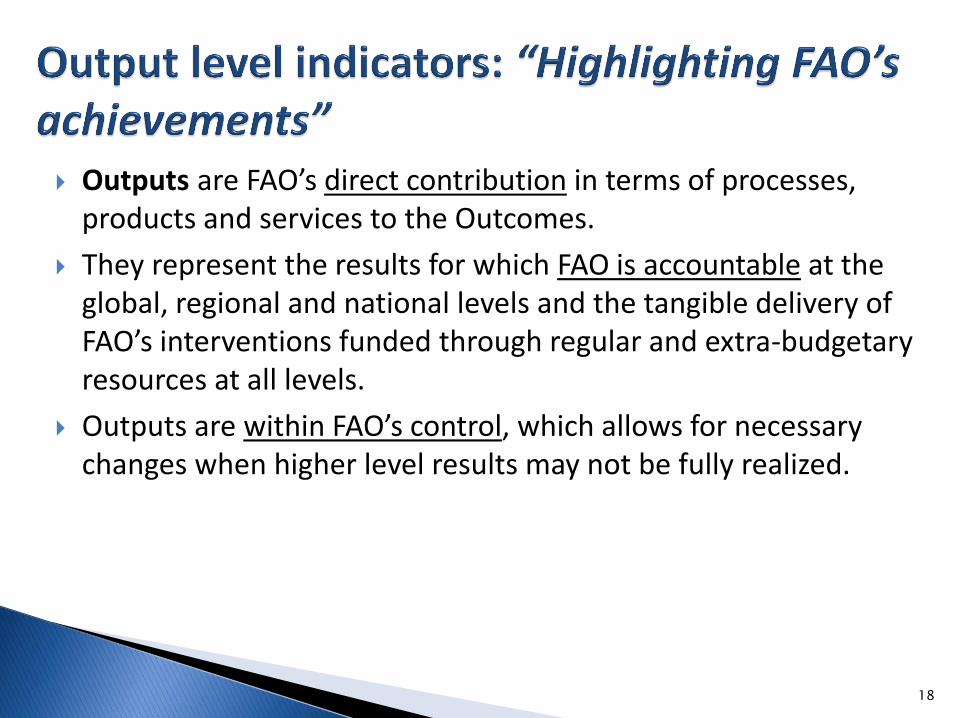
Outputs are FAO’s direct contribution in terms of processes, products and services to the Outcomes.
They represent the results for which FAO is accountable at the global, regional and national levels and the tangible delivery of FAO’s interventions funded through regular and extra-budgetary resources at all levels.
Outputs are within FAO’s control, which allows for necessary changes when higher level results may not be fully realized.
18
Corporate Assessment ◦ at baseline (2013/14), and ◦ at the end of 2015 and 2017 to measure progress in the
achievement of outcomes and FAO contribution
Data is obtained, for a sample of 81 countries, from:
− Secondary sources, including a review of key national policy documents
− Survey at country level to collect data not already available
A corporate baseline survey was conducted in 2014. The Statistics Division designed the survey, supported its organization, and delivered training on it to the field offices.
20

• Population: countries with FAO project activities in 2011-2012 (149 countries)
Sample size: 39 countries (1st phase) + 42 countries (2 phase)
Controlled random selection to ensure representativeness with respect to:
◦ Geographical distribution (5 FAO regions + 2 sub-regions)
◦ SO-level indicator for each SO
◦ FAO expenditures by country in 2011-2012
Sampling scheme: selection with probability proportional to expenditures and distributing the sample between strata (region and SOs) in proportion to the delivery of each strata
Balanced sampling method, an efficient methodology studied for the selection of a random sample respecting marginals (no full stratification because of small sample size)

Minimize response burden: Questionnaire only collecting information not already available from other sources (policy review and secondary data)
Type of questions: Closed questions (or with predefined statements to select), and open space for clarifications or comments
Questionnaire structured in sections and sub-sections: 5 sections (one per each SO) and a separate subsection for each OO
Each section can be considered as a separate questionnaire, in order to allow splitting or merging the questionnaire according to the type of respondent
Flexibility in the data collection: Certain respondents only fill in one section, while other respondents more than one (sections can then be shared between relevant staff within the same organization)

Integrated database with primary data and secondary data for OO indicators, SO indicators, for corporate monitoring
Statistical procedures to check and clean the data
Aggregation methodology to build the indicators from collected data (depending on each SO approach)
Final report : results in terms of OO-level indicators, analyzed for each SO with a cross-region perspective
Dashboard: for the dissemination of the corporate results to a variety of users

2 indicators in the FAO results framework Number of countries having shown significant progress in their
capacity to produce & disseminate food & agricultural statistics Number of countries in which statistics exist and are used for
policy-making processes in the fields of the five FAO SOs Possible available indicators:
WB indicator on Statistical Capacity: ◦ Pros = produced every year for almost all IDA countries ◦ Cons = no sectoral breakdown
Paris21 indicator on the use of statistics in policy making ◦ Pros = Objective assessment from a third party Institution ◦ Cons = Methodology to be further validated (subjectivity of results);
No sectoral breakdown (agr. not well represented); One off exercise.
In general = Very difficult to assess the specific contribution of each International Agency
FAO interim solution ◦ Results of the country assessment of the Global Strategy to Improve
Agricultural and Rural Statistics (2013) ◦ FAO corporate baseline survey (introduction of a specific question for
each of the SOs)
All IOs moving towards RBM. Measuring the impact of statistical activities still remains a challenge for the global community ◦ Need to develop standard methodologies; ◦ Need to avoid duplications in data collections; ◦ Need of an objective assessment (third party Institution)
Role for the CCSA? Forum to exchange good practices Paris21 as a third party Institution conducting the assessment
for all Int. Agencies?