5 pakistan - keio university
TRANSCRIPT

5 Pakistan Shafi Ullah Khan Niazi I. Introduction
The Islamic Republic of Pakistan situated in the north-west of South Asian sub-continent emerged as an independent state on the 14th of August, 1947. It is bordered by Afghanistan and Iran on the west, India in the east, China in the north and Arabian Sea in the south. The name Pakistan is derived from the Persian words Pak (meaning pure) and stan (meaning territory). Geography and Climate
Pakistan covers an area of 796,095 sq km lying between latitude 24 degree and 37 degree North and longitude 62 degree and 75 degree East. Total land boundary of Pakistan is 6774 km. Pakistan is a land of many splendors. The scenery changes northward from coastal beaches, lagoons and mangrove swamps in the south to sandy deserts, desolate plateaus, fertile plains, and upland in the middle and high mountains with beautiful valleys, snow-covered peaks and eternal glaciers in the north. The variety of landscape divides Pakistan into six major regions: the North High Mountainous Region, the Western Low Mountainous Region, the Balochistan Plateau, the Potohar Upland, the Punjab and the Sindh Plains.
Stretching to the north, from east to west is a series of high mountain ranges, which separate Pakistan from China, Russia and Afghanistan. They include the Himalayas, the Karakoram and the Hindu Kush. With assembly of 35 giant peaks over 24,000 ft (7,315 m) high, the region is the climber's paradise. Many peaks are higher than 6,000 ft. The world's second highest peak K 2 (the "K" stands for the initial letter of the name of mountain Karakoram) tops at 28,250 ft.
Pakistan has a continental type of climate characterized by extreme variations of temperatures. The areas close to the snow-covered mountains are cold. Temperatures on the Balochistan Plateau are comparatively high. Along the coastal strip, the climate is modified by sea breezes. In the rest of the country, temperature rises steeply in the summer and hot winds called "loo" blow across the plains during the day. The temperature soars to 40 degree centigrade and beyond. The highest recorded temperature at Jacobabad is 53 degree centigrade. Winters are cold with average minimum and maximum temperature 4 degree and 18 degree centigrade respectively. Pakistan experiences a general deficiency of rainfall. In the plains the annual average ranges from 13 cm, in the northern parts of the lower Indus Plains to 89 cm in the Himalayan Region. Rains are of monsoon origin and fall late in summer. People and Culture
The population of the country is around 163.76 million (2008-09 estimates). The current growth rate of 1.73% is one of the highest amongst nine most populous countries of the world. Of the four provinces Punjab has 55.46% of the total population, Sindh has 22.92%, NWFP including Federally Administered Tribal Areas (FATA) is 16.10%, Balochistan has 5.15%, and Islamabad capital territory has 0.7%. Sindh is the urbanized province with 48.8% of the people living in urban areas including Karachi. There are about 14 cities with population of 200,000 and above, and about 32 cities with population of 100,000 and above. Life expectancy is 65.4 years. Karachi is the largest city and Islamabad is the seat of the government.
The people of Pakistan speak many languages and dialects, reflecting the country's ethnic diversity. The main regional languages are Punjabi, Sindhi, Pushto, Balochi and Saraiki. Urdu is a national language and its use is encouraged to foster unity. Main official language is English and is used in government and education. Common dress used in both rural and urban areas is shalwar-qameez. Usually it is made of cotton. It differs for men and women. Men wear solid, plain colors and add a vest or coat for a formal occasion. The women, however, wear bright patterned colors, with more tailoring. Women also wear a dupatta (long scarf). The joint family system is quite common. In a joint family system father, mother, children and their families live together in the same household. The presiding male of the family has
213

significant influence over the lives of all family members. The elder members of the family grandfather and grandmother etc. are highly respected. Arranged marriages are still a standard tradition. Chapati or roti unleavened bread similar to pita bread) is a staple food in Pakistan although rice is also a part of most meals and deserts. The food is generally spicy and oily.
Pakistan has been the cradle of a civilization that dates back more than five millennium. Over the centuries, through successive waves of migrations from the north-west, as well as by internal migrations across the subcontinent, Aryans, Persians, Greeks, Arabs, and Mughals came and settled in this region. However, it was Islam and Islamic traditions that finally took roots and formed the mainspring of Pakistan's cultural heritage.
Muslims from the earliest days, built cities, forts, palaces, mosques, tombs and mausoleums which are marked by simplicity and grandeur, with open spaces and abundance of light. Pakistan therefore, inherits immense treasure of culture. History and Political Structure
Pakistan has its roots into the remote past. Its establishment was the culmination of the long struggle by Muslims of the South-Asian subcontinent for a separate homeland of their own. In 1947 the Indian subcontinent was divided into two independent countries of Pakistan and India by the British. Mohammad Ali Jinnah was the great leader and the father of the nation.
The Constitution of the Islamic Republic of Pakistan provides for a federal parliamentary system of government, with President as Head of State and the popularly elected Prime Minister as Head of Government and the country's Chief Executive. The Parliament of Pakistan consists of the President and two Houses known as the National Assembly and the Senate. The National Assembly is elected for a five year term on the basis of adult franchise. In a country with 97 per cent Muslim population, and minimum chance of Non-Muslim securing a general seat, 10 seats have been reserved for Non Muslims in a House of 342 seats. Out of total seats of the lower house, 60 seats are reserved for women. The Senate of Pakistan is the Upper House of the Parliament. The Senate derives equal representation from all the four federating units (Punjab, Sindh, Balochistan, NWFP, FATA, and Islamabad being the capital territory) and has total membership of 99. The Provincial Assemblies of the four Provinces elect 22 members each from their respective provinces. The Federally Administered Tribal Areas (FATA) is represented by 8 members, whereas the Federal Capital has 3 seats in the Upper House of Parliament. To administer the subjects falling within the jurisdiction of the Federation, there are Ministries, Divisions, attached departments, subordinate offices, autonomous and semi- autonomous bodies. A ministry may comprise one or more divisions. There are other statuary bodies having an important role in the affairs of the Federation, such as the Attorney General, the Auditor General, the Election Commission, the Federal Public Service Commission, the Council of Islamic Ideology, and Federal Ombudsman. Judiciary is headed by the Chief Justice of the Supreme Court and enjoys independence in dealing with judicial matters.
214

II. Overview of Macroeconomic Activity and Fiscal Position Table 1: Selected Macro-Economic Indicators
FY03-04 FY04-05 FY05-06 FY06-07 FY07-08 FY08-09 Gross rates (percent) Real GDP (at factor cost) 7.5 9.0 5.8 6.8 4.1 2.0 Agriculture 2.4 6.5 6.3 4.1 1.1 4.7 Manufacturing 14.0 15.5 8.7 8.3 4.8 -3.3 Commodity producing sector 9.2 9.5 5.1 6.6 1.4 0.2 Services sector 5.9 8.5 6.5 7 6.6 3.6 Consumer Price Index (growth %) 4.6 9.3 7.9 7.8 12.0 22.3 Monetary Assets (M2) 19.6 19.3 15.2 19.3 15.3 4.6 Domestic Assets 23.7 22.4 15.8 14.2 33.6 11 Exports (fob) 13.8 16.2 13.8 4.5 16.5 -2.6 Imports (fob) 20.1 37.8 31.4 8.0 31.2 -6.8 As % of GDP Total Investment 16.6 19.1 22.1 22.5 22.0 19.7 National Savings 17.9 17.5 18.2 17.4 13.5 14.3 Total Revenue 14.3 13.8 14.2 14.9 14.6 14.6 Tax Revenue 11.0 10.1 10.6 10.2 10.6 10.5 Total Expenditure 16.7 17.2 18.5 19.1 22.2 18.6 Overall Deficit 2.4 3.3 4.3 4.3 7.6 4.3 Domestic Debt 2.9 2.7 2.7 3.3 4.3 4.2 Foreign debt & liabilities 36.1 32.7 29.5 28.3 28.1 30.2 Total debt & liabilities 39.0 35.4 32.2 31.6 32.4 34.4
Sources: Economic Survey 08-09 of Pakistan; Budget & Economic Advisor Wings, Ministry of Finance, Government of Pakistan. II.1 Macro-Economic Activity:
Pakistan’s economy weathered an unprecedented set of challenges during the year 2008-09 that witnessed the culmination of four separate and severe shocks Pakistan has had to endure over the course of past two years. The first negative shock to the economy emanated from a severe macroeconomic crisis that resulted from policy induced imbalances of the past several years that have assumed unsustainable proportions by 2007-08. This was reinforced by a second shock involving a large deterioration in Pakistan’s net external terms of trade as a result of the spike in world commodity prices that had occurred during 2007 and a large part of 2008. Largely as a result, the economy suffered a significant supply shock, especially in the case of provision of energy. In addition to the foregoing, a third shock the economy has had to cope with emanated from the adverse effects of turmoil in global financial markets which has resulted in a collapse of external demand for its exports, and a sharp decline in the availability of external capital to finance its fiscal and current account deficits.
A spillover effect of the global financial crisis was felt on market and investor confidence in many developing countries including Pakistan, as banking systems and asset markets came under periods of stress. Finally, 2008-09 witnessed the intensification of an unprecedented domestic security challenges that exacted an extremely high cost on the economy, both in terms of direct costs of the fight against terrorism, as well as in terms of a knock-on effect on investment inflows and market confidence. Significant collateral impact has been borne by Pakistan in terms of the squeezing of fiscal space for critical development and social sector expenditure.
The cumulative effect of these challenges has been a significant loss of growth momentum in the economy. Real GDP growth in the year 2008-09 is estimated at 2% compared to a 4.1% in the previous year and an average of above 7% in the earlier three years. Likewise, the commodity producing sector, as indicated showing only 0.2% rise, is the lowest since 1992-93. Agriculture was the only sector that showed a rise of 4.7% in the year 2008-09 when compared to past two years; however, the manufacturing sector gave a decline of 3.3% as against 4.8% growth in the previous year. The services sector showing a growth of 3.6% was also recorded lowest in the year 2008-09 when compared to past five fiscal years.
215

Total investment in 2008-09 declined to 19.7% of GDP compared to an average of above 22% of GDP in the previous three fiscal years. Similarly, growth of CPI recorded at 22.3% in 2008-09 is the highest in last six years.
II.1.1 International Environment
Pakistan’s greater integration with the world economy is reflected by the trade openness indicator, the trade to GDP ratio, which has increased from 25.8% of GDP from 1999-2000 to 36% of GDP in 2007-08. With enhanced level of globalization, Pakistan’s economy is likely to face some fallouts of the global financial crisis which is affecting all global and regional players with varying degrees. Pakistan is awkwardly placed to face the challenges of the global economic melt down given its high level of external debt and unbridled inflation.
The contraction in global demand, trade, and related activity has adversely impacted exports and remittances from the US and the EU in particular. Similarly constricted access to the international credit markets and lower investor appetite for risk affected capital inflows. (a)Trade Balance
During the first ten months (July – April) of the fiscal year 2008-09, the merchandise trade deficit narrowed by $2.7 billion to $14,160 million as compared to $16,836 million in the same period of the year 2007-08 thereby, showing an improvement of 15.9%. Improvement in trade deficit took place due to massive decline in imports on the back of import compression measures taken by the government, decrease in international oil prices and depreciation in the value of rupee.
The net export of goods and services (exports minus imports) along with investment and consumption are figuratively considered to be “the three horses of Troika” that drives economic growth. Over a period of a decade, the contribution of net exports in GDP growth can be observed as given below in Figure 1. Figure 1: Contribution to GDP Growth
-4-202468
10
%
2000-01
2002-03
2004-05
2006-07
2008-09
Figure-1: Contribution to GDP Growth
Net Exports Investment Consumption GDP Growth
Source: Economic Survey of Pakistan - 2008-09
The real terms of trade during 2008-09 have improved as the exports real growth outpaced the import growth. The net exports contributed the highest ever share in real GDP at market price growth in the year 2008-09. The contribution of net exports has traditionally been negative for most part of the history of Pakistan’s economy and it was only during the short-lived brief interval (2000–2004) of external sector buoyancy that the net exports contributed positively.
Exports / imports as components of balance of payments (as percentage of GDP) spread over last three decades of the country’s economy are reflected by the following Table 2.
216

Table 2: Components of Balance of Payments (as percent of GDP) Year Exports^ Imports^ Trade Credit^ Worker's Remittances # Current Account Deficit #
1990-91 13.5 16.7 3.3 4.1 4.8 1991-92 14.2 19.1 4.8 3.0 2.8 1992-93 13.3 19.4 6.1 3.0 7.2 1993-94 13.1 16.6 3.4 2.8 3.8 1994-95 13.5 17.2 3.7 3.1 4.1 1995-96 13.8 18.7 4.9 2.3 7.2 1996-97 13.4 19.1 5.7 2.3 6.2 1997-98 13.9 16.3 2.4 2.4 3.1 1998-99 13.3 16.1 2.8 1.8 4.1 1999-00 11.7 14.1 2.4 1.3 1.6 2000-01 12.9 15.1 2.1 1.5 0.7 2001-02 12.8 14.4 1.7 3.3 1.9 2002-03 13.5 14.8 1.3 5.1 3.8 2003-04 12.5 15.9 3.3 3.9 1.3 2004-05 13.0 18.5 5.5 3.7 1.6 2005-06 13.0 22.5 9.5 2.9 4.5 2006-07 11.8 21.2 9.4 3.8 5.1 2007-08 11.7 24.3 12.6 3.9 8.5 Jul-April 2007-08* 9.2 19.3 10.1 3.2 6.7 2008-09* 8.9 17.4 8.5 3.8 5.1
^Based on the data compiled by Federal Bureau of Statistics # Based on the data compiled by SBP * Provisional Source: Federal Bureau of Statistics, SBP & Economic Advisor Wing, Finance Division. Table 3: Pakistan's Major Exports
(Percentage share)
Commodity 01-02 02-03 03-04 04-05 05-06 06-07 07-08 July-March 07-08 08-09
Cotton Manufacturers 59.4 63.3 62.3 57.4 59.4 59.7 51.9 57.5 53.3Leather 6.8 6.2 5.4 5.8 6.9 5.2 5.8 6.8 5.6Rice 4.9 5.0 5.2 6.5 7.0 6.6 9.8 7.4 11.3Synthetic Textiles 4.5 5.1 3.8 2.1 1.2 2.5 2.1 2.5 1.7Sports Goods 3.3 3.0 2.6 2.1 2.1 1.7 1.6 1.6 1.6Sub-Total 78.9 82.6 79.3 73.9 76.6 75.7 71.2 75.8 73.5Others 21.1 17.4 20.7 26.1 23.4 24.3 28.8 24.2 26.5Total 100 100 100 100 100 100 100 100 100
*July-March (Provisional) Source: Federal Bureau of Statistics Figure 2: Pakistan’s Major Exports (%)(2008-09)
Figure-2: Pakistan's Major Exports % (2008-09)
Rice Leather
Sports GoodsCotton
Manufacturers
Others
Synthetic Textiles
Source: Economic Survey of Pakistan - 2008-09.
217

Pakistan is moving gradually towards higher value addition in exports of textile manufacturers. The shares of bed wear, knitwear and towels (value added exports) have increased while those of cotton yarn and synthetic textiles have declined. The shares of other components of textile manufactures either remained constant or fluctuated during the last decade.
However, Pakistan’s exports composition has changed significantly during the last decade. A sharp decline has been observed in the share of primary and semi-manufactured exports and increase in manufactured goods. If semi-manufactured and manufactured goods are taken together, more than 85 percent of export earnings during 2007-08 originated from Manufactured Exports and only less than 15 percent came from Primary Commodities. This trend shows that Pakistan does not rely heavily on Primary Commodities for foreign exchange earnings.
Pakistan’s exports are highly concentrated in few countries as well. The seven countries, namely USA, Germany, Japan, UK, Hong Kong, Dubai and Saudi Arabia used to account for almost 50 percent of its exports till 2005-06. This trend is, however gradually changing and during the first nine months of fiscal year 2008-09, it has declined to around 32 percent meaning thereby that during the last few years Pakistan has tried to explore non traditional markets as well. The United States has, however, remained the single largest export market for Pakistan, accounting for more than 20 percent of its exports followed by the United Kingdom, Germany, Saudi Arabia and Hong Kong. Japan as Pakistan’s export destination is fast vanishing as less than one percent of its exports entering Japan. Pakistan needs more to diversify its exports not only in terms of commodities but also in terms of markets. Heavy concentration of exports in few commodities and few markets might cause serious export instability. Table 4: Major Export Markets
(Percentage share)
Country 02-03 03-04 04-05 05-06 06-07 07-08 July-March % Change 07-08 08-09* USA 23.5 23.9 23.9 25.5 24.6 19.5 20.3 18.8 -7.4Germany 5.2 4.9 4.8 4.2 4.1 4.3 4.4 4.1 -6.8Japan 1.3 1.1 1.1 0.8 0.7 0.7 0.8 0.7 -12.5UK 7.1 7.6 6.2 5.4 5.6 5.4 5.5 4.8 -12.7Hong Kong 4.6 4.7 3.9 4.1 3.9 2.7 2.9 2.2 -24.1Dubai 9.0 7.3 3.3 5.6 1.1 0 0 0 _Saudi Arabia 4.3 2.8 2.5 2.0 1.7 2.0 1.9 2.2 15.8Sub-Total 55.0 52.3 45.7 47.6 41.7 34.6 35.8 32.8 -8.4Others Countries 45.0 47.7 54.3 52.4 58.3 65.4 64.2 67.2 4.7Total 100 100 100 100 100 100 100 100
*Provisional Source: Federal Bureau of Statistics Table 5: Pakistan's Major Imports
(Percentage share)
Commodities 02-03 03-04 04-05 05-06 06-07 07-08 July-March 07-08 08-09*
Machinery * * 18.5 17.8 22.5 18.0 22.1 18.5 18.4 18.9Petroleum & Products 25.1 20.3 19.4 22.3 24.0 28.8 26.5 28.4Chemicals @ 15.1 16.1 15.5 13.4 13.0 12.3 12.4 13.5Transport Equipments 5.6 5.6 6.2 7.7 7.6 5.5 5.9 3.7Edible Oil 4.8 4.2 3.7 2.7 3.1 4.3 4.2 4.1Iron & Steel 3.3 3.3 4.3 5.1 3.9 3.3 3.3 3.7Fertilizer 2.1 1.8 2.0 2.4 1.5 2.2 2.7 1.5Tea 1.4 1.2 1.1 0.9 0.7 0.5 0.5 0.7Sub-Total 75.9 70.3 74.7 72.5 75.9 75.4 73.9 74.5Others 24.1 29.7 25.3 27.5 24.1 24.6 26.1 25.5Total 100 100 100 100 100 100 100 100
* July-March ** Excluding Transport Equipments @ Excluding Fertilizer Source: Federal Bureau of Statistics
218

Table 6: Major Sources of Imports (Percentage share)
Country 02-03 03-04 04-05 05-06 06-07 07-08 July-March 07-08 08-09*
USA 6.0 8.5 7.6 5.8 7.5 6.1 6.5 4.7Japan 6.6 6.0 7.0 5.6 5.7 4.6 4.4 3.6Kuwait 6.6 6.4 4.6 6.2 5.7 7.5 6.7 7.9Saudi Arabia 10.7 11.4 12.0 11.2 11.4 13.4 12.6 13.6Germany 4.6 3.9 4.4 4.7 3.9 3.2 3.2 3.8U.K. 2.9 2.8 2.6 2.8 2.3 1.9 1.9 2.2Malaysia 4.6 3.9 2.6 3.0 3.1 3.9 3.8 4.1Sub-Total 42.0 42.9 40.8 39.3 39.6 40.6 39.1 39.9Others Countries 58.0 57.1 59.2 60.7 60.4 59.4 60.9 60.1Total 100 100 100 100 100 100 100 100
*Provisional Source: Federal Bureau of Statistics
Pakistan’s imports are also highly concentrated in few countries. Over 40 percent of them continue to originate from just seven countries i.e. the USA, Japan, Kuwait, Saudi Arabia, Germany, the UK and Malaysia. Saudi Arabia and Kuwait are emerging as major suppliers to Pakistan followed by the USA and Japan. (b) Current Account Balance
Pakistan’s current account deficit has improved by $2.6 billion and stood at $8.547 billion during July-April 2008-09 as against $11.173 billion in the corresponding period of 2007-08, thereby showing an improvement of 23.5 percent. In the Month of February 2009, the current account witnessed a surplus of $128 million which was first monthly surplus since July 2007. However, it turned out to be deficit of $457 million in April 2009. The current account deficit was $3.8 billion during the first quarter of the year 2008-09 which declined to $0.3 billion in the third quarter of the year.
The current account deficit was deteriorating up to October 2008 when it peaked to $2.2 billion in a single month. The improvement in the current account deficit started in the period November-April 2009 when it showed remarkable improvement by 74 percent over the corresponding period of the previous year due to reduction in trade and services account deficits. On the other hand, current account deficit worsened by 100.8 percent during the first four months of the year 2008-09 owing to higher import prices for edibles and petroleum products. Trade deficit decelerated by 12.3 percent during July-April 2008-09 and the improvement was contributed by deceleration in import growth owing to easing of demand pressures and helped by commodity and petroleum prices crash.
219

Table 7: Balance of Payments Items 98-99 99-00 00-01 01-02 02-03 03-04 04-05 05-06 06-07 07-08 July-April
07-08 08-09 (P)1. Trade Balance -2085 -1412 -1269 -294 -444 -1208 -4352 -8259 -9495 -14895 -10734 -9402 Exports (f.o.b) 7528 8190 8933 9140 10889 122396 14401 16388 17119 20207 14310 14328 Imports (f.o.b) -9613 -9602 -10202 -9434 -11333 -13604 -18753 -24647 -26614 -35102 -25044 -237302. Services (Net) -2618 -2794 -3142 -2617 -2128 -3594 -5841 -7304 -7968 -10316 -7623 -6374 Receipts 1409 1501 1464 2027 2967 2894 3837 4718 5239 5410 3810 3518 Payments -4027 -4295 -4606 -4644 -5095 -6488 -9678 -12022 -13207 -15726 -11433 -9892 Shipment -844 -802 -877 -809 -951 -1253 -1713 -2203 -2337 -2924 -2096 -2135 Investment income -1903 -2135 -2274 -2430 -2381 -2394 -2823 -3451 -4522 -5522 -3987 -4034 Others -1280 -1358 -1455 -1405 -1763 -2841 -5142 -6368 -6348 -7280 -5350 -37233. Private Unrequited Transfers (net) 2274 3063 3898 4249 5737 6116 8440 9914 10102 11048 8332 8001 (Workers Remittances) 1060 983 1087 2389 4237 3871 4168 4600 5494 6451 4728 5,6584. Current Account Balance -2729 -1143 -513 1338 3165 1314 -1753 -5649 -7361 -14163 -10025 -77755. Long-term Capital (net) 1836 525 171 1280 1035 -201 2562 6016 9268 7978 4683 4090 Private Capital (net) 466 277 -68 -177 225 691 1221 4153 7088 6181 3601 3088 Official Capital (net)@ 1370 248 239 1457 810 -892 1341 1863 2180 1797 1082 10026. Basic Balance -593 -618 -342 2618 4200 1113 809 367 1907 -6185 -5342 -36857. Errors and Omissions (net)* -1375 -2282 313 961 909 -137 -854 36 507 -1002 213 -10178. Balance Requiring Official -1968 -2900 -29 3579 5109 976 -45 403 2414 -7187 -5129 -4702 Financing 9. official Assistance & Debt
relief -1174 -996 338 -925 -520 -95 472 470 1789 1173 551 44
Medium and Short Term capital -863 -221 431 -334 -180 -317 147 -193 -83 560 460 -26 Other Short-Term Assets/ Liabilities FEBC, DBC FEBC, Euro& Special
US$ Bonds (Net), GDR -311 -775 -93 -591 -340 222 335 663 1872 613 91 7010. Exceptional Financing 3966 3966 692 138 620 -55 -55 -55 100 0 0 011. Change in Reserves (*ve=increase) -824 -71 -1001 -2792 -5209 -826 -372 -818 -4303 6014 4578 4658
@ Includes Official Unrequited Transfers * Includes Private Short-term Capital (P) Provisional Source: State Bank of Pakistan (c) Exchange Rate and Exchange System
The State Bank of Pakistan (The Central Bank) is responsible to keep the exchange rate of the rupee at an appropriate level and prevent it from wide fluctuations in order to maintain competitiveness of exports and maintain stability in the foreign exchange market. To achieve the objective, various exchange policies have been adopted from time to time keeping in view the given circumstances. Pak-rupee remained linked to Pound Sterling till September, 1971 and subsequently to U.S. Dollar. However, it was decided to adopt the managed floating exchange rate system in January 1982 under which the value of the rupee was determined on daily basis, with reference to a basket of currencies of Pakistan’s major trading partners and competitors.
After nuclear detonation by Pakistan in 1998, a two-tier exchange rate system was introduced from July 1998, with a view to reduce the pressure on official reserves and prevent the economy to some extent from adverse implications of sanctions imposed on Pakistan. However, effective from May 1999, the exchange rate has been unified, with the introduction of market-based floating exchange rate system, under which the exchange rate is determined by the demand and supply positions in the foreign exchange market. The surrender requirement of foreign exchange receipts on account of exports and services, previously required to be made to State Bank through authorized dealers, has now been done away with and the commercial banks and other authorized dealers have been made free to hold and undertake transaction in foreign currencies. As the custodian of country’s external reserves, the State Bank is also responsible for the management of the foreign exchange reserves. The task is being performed by an Investment Committee.
Main source of foreign exchange earning and foreign exchange reserves is from exports and remittances from expatriates as well as Foreign Direct Investments. The position of foreign exchange reserves over the period of last seven years can be observed from the following Table 8.
220

Table 8: Foreign Exchange Reserves (Million $) End Period Net Reserves with SBP Net Reserves with other Banks Total Liquid Reserves
02-03 9529.1 1240.6 10769.7 03-04 10563.9 1825.4 12389.3 04-05 9804.7 2792.9 12597.6 05-06 10765.2 2357.2 13122.4 06-07 13345.4 2301.8 15647.2 07-08 8577.0 2821.7 11398.7 08-09 (July-May) 8196.1 3298.1 11494.9
Source: State Bank of Pakistan (d) Foreign Direct Investment
In the today’s global economy, foreign direct investment has emerged as one of the biggest sources of private external finance for developing countries. The developing countries like Pakistan are able to bridge their widening saving-investment gap through this important non debt creating inflow. Pakistan by pursuing trade openness and liberalized FDI regime was able to attract gradually more and more FDI since 2001-02.
FDI in 2005-06 reached $3.5 billion, and grew above $5 billion successively during 2006-07 and 2007-08 – the highest ever in the country’s history. However, a decline of 38.2 percent in FDI during 2008-09 over 2007-08 was witnessed, and it is mainly attributed to the growing non conducive investment environment owing to prevailing security reasons and the ongoing war against terrorism in Pakistan.
From Table 9, it can be seen that FDI grew on a steady pace from fiscal year 2002-03 onwards. It was more than six times in the year 2007-08 from that of in year 2002-03. Table10 shows sector wise distribution of the FDI. Transport, communication, financial business, oil exploration and power sectors are the dominant sectors where most of the FDI inflows are concentrated. From Table 11, it can be observed that the UAE, the US, the UK, Switzerland, and Norway are the major investors in terms of FDI. Table 9: Position of Foreign Direct Investment
(Million $) 02-03 03-04 04-05 05-06 06-07 07-08 08-09
FDI 798.0 949.4 1524.0 3521.0 5139.6 5152.8 3179.6Portfolio Investment 22.1 -27.7 152.6 351.5 1820.0 19.3 -510.3Total 820.1 921.7 1676.6 3872.5 6959.6 5172.1 2669.6
Source: Board of Investment Pakistan Table 10: Major Sectors Attracting FDI
(Million $) Sector 03-04 04-05 05-06 06-07 07-08 08-09
Oil and Gas 202.4 193.8 312.7 545.1 634.8 775.0Financial Business 242.1 269.4 329.2 930.3 1864.9 707.4Textiles 35.4 39.3 47.0 59.4 30.1 36.9Trade 35.6 52.1 118.0 172.1 175.9 166.6Construction 32.0 42.7 89.5 157.1 89.0 93.4Power 14.2 73.4 320.6 193.4 70.3 130.6Chemical 15.3 51.0 62.9 46.1 79.3 74.3Transport 8.8 10.6 18.4 30.2 74.2 93.2Communication 221.9 517.6 1937.7 1898.7 1626.8 879.1Others 170.1 274.0 285.0 1107.2 764.5 763.4
Source: Board of Investment Pakistan
221

Table 11: Country Wise FDI Inflows (Million $)
Country 03-04 04-05 05-06 06-07 07-08 08-09 USA 238.4 325.9 516.7 913.1 1309.3 869.9UK 64.6 181.5 244.0 860.1 460.2 263.4UAE 134.6 367.5 1424.5 661.5 589.2 178.1Japan 15.1 45.2 57.0 64.4 131.2 74.3Hong Kong 6.3 32.3 24.0 32.6 339.8 156.1Switzerland 205.3 137.5 170.6 174.7 169.3 227.3Saudi Arabia 7.2 18.4 277.8 103.5 46.2 92.3Germany 7.0 13.1 28.6 78.9 69.6 76.9South Korea 1.0 1.4 1.6 1.5 1.2 2.3Norway 146.6 31.4 252.6 25.1 274.9 101.1China 14.3 0.4 1.7 712.0 13.7 101.4Others 108.6 369.3 521.9 1512.2 2005.2 1964.2
Source: Board of Investment Pakistan (e) Borrowing from Abroad
Pakistan’s total stock of external debt and foreign exchange liabilities grew at an average rate of 7.4 percent per annum during 1990-99 – rising from $ 20.5 billion in 1990 to $ 38.9 billion by end June 1999. Foreign exchange earnings on the other hand, either remained stagnant or increased at a snail’s pace during the same period. Despite the accumulation of almost $ 18.4 billion debt in the 1990s, foreign exchange earnings rose by only $ 4.0 billion. Consequently the debt burden (external debt and foreign exchange liabilities as a percentage of foreign exchange earnings) rose from 256.6 percent in 1989-90 to 335.4 percent in 1998-99.
Following a credible strategy of debt reduction over the last decade, Pakistan has succeeded in reducing the country’s debt burden. External debt and foreign exchange liabilities, instead of growing at the pace of the 1990s, were in fact reduced from U.S. $38.9 billion in 1998-99 to $ 35.8 billion by end of 2005 — a reduction of $3.1 billion in six years. Most importantly, the burden of the debt has declined substantially during the same period. Although external debt and foreign exchange liabilities have again risen up to $50.1 billion as by end March-2009, however, in percentage of GDP, these declined from 32.7 percent in the year 2005 to 30.2 percent at the end-March 2009, as is evident below from Table12 and illustrated in Figure 3.
The continuous build up in foreign exchange reserves in the last decade helped Pakistan retire its expensive debt. In 1999-2000, Pakistan paid $ 3.756 billion on account of debt servicing and $ 4.081 billion worth of payments were rolled over. The combination of re-profiling of Paris Club bilateral debt on a long-term horizon, the substantial write-off of the US bilateral debt stock, the prepayment of expensive debt worth $ 1.1 billion and the relative shift in contracting new loans on concessional term yielded dividends to economy. As is explained below in Table 13 and also illustrated in Figure 4, the annual debt servicing payments made by Pakistan during the periods 1999-2000 to 2003-04 averaged just above $ 5 billion per annum. This amount has drastically come down to an average of around $ 3.1 billion in the periods 2004-05 to 2008-09.
222

Table 12: Pakistan: External Debt and Liabilities End-June
2004 2005 2006 2007 2008 2009*(In billions of US dollars)
1. Public and Publically Generated Debt 29.94 31.08 32.90 35.35 40.24 40.48 A. Medium and long term (>1 year) 29.91 30.81 32.73 35.32 39.53 39.75 Paris club 13.63 13.01 12.79 12.69 13.93 13.66 Multilateral 14.35 15.36 16.82 18.69 21.58 21.84 Other lateral 0.69 0.81 0.92 1.00 1.19 1.94 Euro Bonds/Saindak Bonds 0.82 1.27 1.91 2.71 2.67 2.15 Military Debt 0.20 0.19 0.13 0.08 0.04 0.01 Commercial Loan/credit 0.22 0.18 0.17 0.15 0.12 0.17 B. Short Term (<1 year) 0.02 0.27 0.17 0.03 0.71 0.732. Private Non-generated Debt (>1 year) 1.67 1.34 1.59 2.25 2.89 3.303. IMF 1.76 1.61 1.49 1.41 1.34 4.19Total External Debt (1 through 3) 33.4 34.0 36.0 39.0 44.5 48.0 Of which public 31.3 32.1 33.9 36.5 40.7 43.84. Foreign Exchange liabilities 2.0 1.8 1.6 1.5 1.8 2.2Total External Debt and Liabilities (1 through 4) 35.3 35.8 37.6 40.5 46.3 50.1 (In percentage of GDP)Total External Debt (1 through 3) 34.1 31.1 28.2 27.3 27.0 28.91. Public and Publically Degenerated debt 30.6 28.4 25.8 24.7 24.5 24.4 A. Medium and long term (>1 year) 30.5 28.1 25.7 24.7 24.0 23.9 B. Short Term (<1 year) 0.0 0.2 0.1 0.0 0.4 0.43. IMF 1.8 1.5 1.2 1.0 0.8 2.5Total External Debt 34.1 31.1 28.2 27.3 27.0 28.94. Foreign Exchange Liabilities 2.0 1.6 1.2 1.0 1.1 1.3Total External Debt and Liabilities (1 through 4) 36.1 32.7 29.5 28.3 28.1 30.2Memo: GDP (in billions of US dollars) 98.0 109.5 127.4 143.0 164.4 166.1
*End March Source: State Bank of Pakistan Figure 3: External Debt & Liabilities (% of GDP)
Figure-3: External Debt & Liabilities (% of GDP)
36.1 32.7 29.5 28.3 28.1 30.2
0
10
20
30
40
2004 2005 2006 2007 2008 2009* * EndMarch
Source: Ministry of Finance Government of Pakistan
223

Table 13: Pakistan's External Debt and Liabilities Servicing ($ Million)
Years Actual Amount Paid Amount Rolled Over Total 1999-00 3756 4081 7837 2000-01 5101 2795 7896 2001-02 6327 2243 8570 2002-03 4349 1908 6257 2003-04 5274 1300 6574 2004-05 2965 1300 4265 2005-06 3115 1300 4415 2006-07 2977 1300 4277 2007-08 3161 1200 4361 2008-09* 3654 1650 5304
* July-March Source: State Bank of Pakistan Figure 4: Debt Servicing
Figure-4: Debt Servicing
0
2000
4000
6000
8000
10000
1999-00
2000-01
2001-02
2002-03
2003-04
2004-05
2005-06
2006-07
2007-08
2008-09
Years
Mill
ion
$ Actual Amount PaidAmount Rolled OverTotal
Source: State Bank of Pakistan II.1.2 Domestic Environment (a) Economic Growth Rate
Pakistan’s economy overcame adverse pressures to achieve strong growth for successive five fiscal years prior to the year 2008-09. Despite unexpectedly weak harvests of some key crops (cotton, sugarcane and wheat), the impact of the October 2005 earthquake, a tight monetary policy, and an unprecedented rise in oil prices, real GDP growth remained strong from fiscal year 2003-04 to 2007-08. However, there was a visible decline in growth during 2008-09 when compared with previous five fiscal years. The decline in growth as reflected in Table 14 prepared by IMF in April 2009, shows a comparative stability of Pakistan’s economy when viewed in context and comparison with the other developing economies
Despite decline in growth during 2008-09 over the previous year, as is obvious from Figure 5, the economy relied heavily on agriculture and services. Agriculture re-gained its proportionate share; though the other major commodity producing sector i.e. the manufacturing showed a negative growth at the same time. Services sector in the year 2008-09 continued as before to be amongst one of the major contributors to growth.
224

Table 14: Comparative Real GDP Growth Rates (%) Region/Country 2005-06 2006-07 2007-08 2008-09 Diff (FY-09-FY-08)
World GDP 5.1 5.2 3.2 -1.3 -4.5Euro Area 2.9 2.7 0.9 -4.2 -5.1United States 2.8 2 1.1 -2.8 -3.9Japan 2 2.4 -0.6 -6.2 -5.6Germany 3 2.5 1.3 -5.6 -6.9Canada 2.9 2.7 0.5 -2.5 -3Developing Countries 8 8.3 6.1 1.6 -4.5China 10.4 10.7 10.4 10.7 0.3Hong Kong SAR 7 6.4 2.5 -4.5 -7Korea 5.2 5.1 2.2 -4 -6.2Singapore 8.4 7.8 1.1 -10 -11.1Vietnam 8.4 8.2 8.4 8.2 -0.2 Asian Indonesia 5.5 6.3 6.1 2.5 -3.6Malaysia 5.8 6.3 4.6 -3.5 -8.1Thailand 5.2 4.9 2.6 -3 -5.6Philippines 5.4 7.2 4.6 0 -4.6 South Asia India 9.8 9.3 7.3 4.5 -2.8Bangladesh 6.5 6.3 5.6 5 -0.6Sri Lanka 7.7 6.8 6 2.2 -3.8Pakistan 5.8 6.8 4.1 2.4 -1.7 Middle East Saudi Arabia 3 3.5 4.6 -0.9 -5.5Kuwait 5.1 2.5 6.3 -1.1 -7.4Iran 5.8 7.8 4.5 3.2 -1.3Egypt 6.8 7.1 7.2 3.6 -3.6 Africa Algeria 2 3 3 2.1 -0.9Morocco 7.8 2.7 5.4 4.4 -1Tunisia 5.5 6.3 4.5 3.3 -1.2Nigeria 6.2 6.4 5.3 2.9 -2.4Kenya 6.4 7 2 3 1South Africa 5 4.8 5.1 5 -0.1
Source: World Economic Outlook (IMF), April 2009.
Over the period of years, the percentage share of various sectors of the economy has been subject to change. In early 1990’s the share of agricultural sector was dominant in GDP. The change in composition started and the share of industrial and services sector grew at a steady pace. The share of services sector which was at 48% in financial year 2004-05, rose to even more at 69% in the year 2005-06. This still remains to be the biggest single contributor to the economic growth in 2007-08 and 2008-09.The share of agriculture was reduced from eighteen percent (2004-05) to eight percent (2005-06), however, during the latest completed fiscal year (2008-09), where there was a severe set back to the manufacturing sector, and also a relative reduction in the service sector as well, it was the agriculture sector that happened to be the single largest share provider to the economic growth (Figure 5).
Per capita income, defined as Gross National Product at market price in dollar term divided by the country’s population, grew at a much slower pace of 1.4 percent per annum in the 1990s, mainly due to slower economic growth, declining trend in workers’ remittances and fast depreciating exchange rate. The pendulum swung to other extreme during the last few years and the per capita income grew at a tremendous pace. The per capita income in dollar term has grown at an average rate of 13.6 percent per annum during the last six years rising from $ 669 in 2003-04 to $ 836 in 2005-06, and further improving to $1046 in the year 2008-09. The main factor responsible for the sharp rise in per capita income include acceleration in real GDP growth in 2004 -- 2008, stable or even appreciation in exchange rate and four fold increase in the inflows of workers’ remittances. Per capita income in dollar term rose from $ 669 in 2003-04 to $ 1042 in 2007-08, depicting an increase of 55 percent within a short span of four years. This
225

increase during the year 2008-09 over the previous year is, however, negligible 0.003 percent. The Figure 6 shows the improvement in per capita income during the last six years.
Figure 5: Contribution to the Real GDP Growth
Figure-5: Contribution to the Real GDP Growth
-60
-40
-20
0
20
40
60
80
100
Agriculture Industry Services
2007-08 2008-09
Source: Economic Survey of Pakistan 2008-09
Figure 6: Per Capita Income ($)
Figure-6: Per Capita Income ($)
669 733836 921
1,042 1,046
0200400600800
10001200
2003-04 2004-05 2005-06 2006-07 2007-08 2008-09
Source: Economic Survey of Pakistan 2008-09
(b) Inflation Inflation seemed to be a chronic problem in Pakistan as in many other parts of the world. There is a
wide spread recognition that inflation results in inefficient resource allocation and hence reduces potential economic growth. Inflation imposes high cost on economies and societies; disproportionately hurts the poor and fixed income groups and creates uncertainty throughout the economy and undermines macroeconomic stability.
High inflation has always penalized the poor more than the rich because the poor are less able to protect themselves against the consequences, and less able to hedge against the risks that high inflation poses Prices remained volatile during the decade of the 1990s, ranging between 5.7 percent and 13.0 percent mainly because of decelerating economic growth, expansionary monetary policies, output set-backs, higher duties and taxes, a depreciating Pak Rupee, frequent adjustments in the administered prices of gas, electricity and POL products, etc. The changes introduced in the economy added a major element of distortion in economic relations with an inevitable pressure on prices, GDP growth and the performance of
226
the large-scale industrial sector. The pressure on prices intensified in 1994-95 when inflation went up to 13 percent. Both the food and non-food inflation contributed to the persistence of double digit inflation, averaging 12.2 and 10.7 percent.
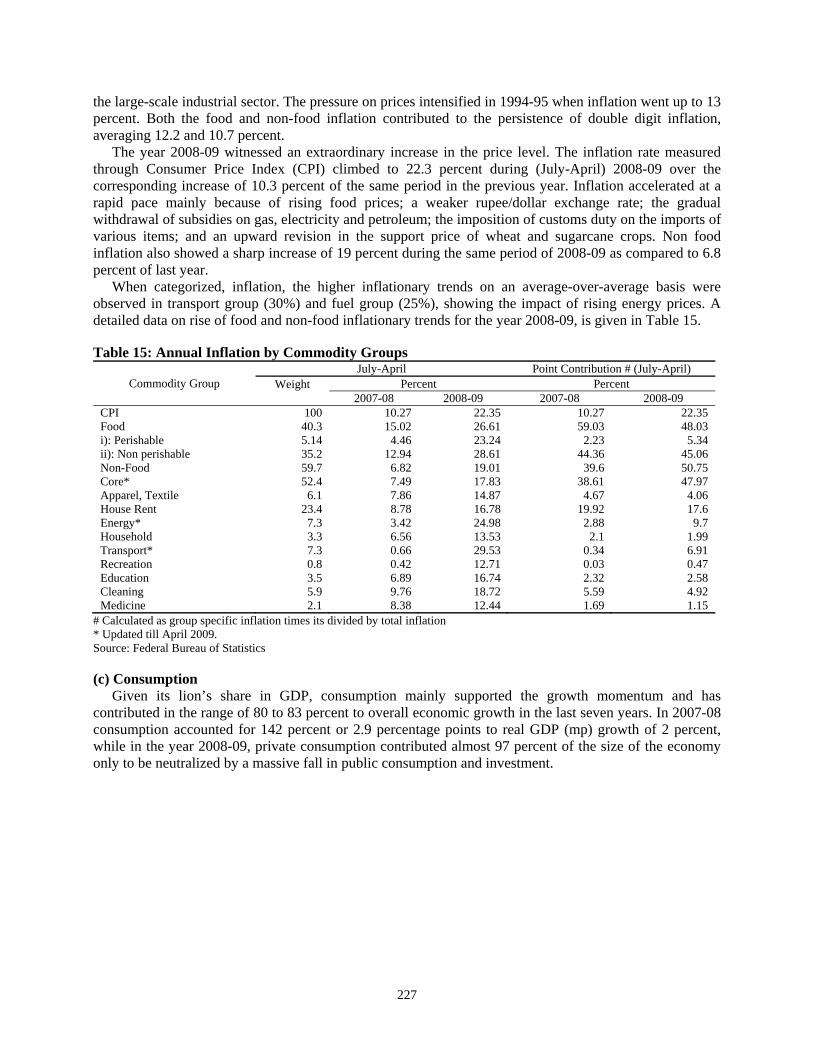
The year 2008-09 witnessed an extraordinary increase in the price level. The inflation rate measured through Consumer Price Index (CPI) climbed to 22.3 percent during (July-April) 2008-09 over the corresponding increase of 10.3 percent of the same period in the previous year. Inflation accelerated at a rapid pace mainly because of rising food prices; a weaker rupee/dollar exchange rate; the gradual withdrawal of subsidies on gas, electricity and petroleum; the imposition of customs duty on the imports of various items; and an upward revision in the support price of wheat and sugarcane crops. Non food inflation also showed a sharp increase of 19 percent during the same period of 2008-09 as compared to 6.8 percent of last year.
When categorized, inflation, the higher inflationary trends on an average-over-average basis were observed in transport group (30%) and fuel group (25%), showing the impact of rising energy prices. A detailed data on rise of food and non-food inflationary trends for the year 2008-09, is given in Table 15. Table 15: Annual Inflation by Commodity Groups
Commodity Group July-April Point Contribution # (July-April)
Weight
Percent Percent 2007-08 2008-09 2007-08 2008-09
CPI 100 10.27 22.35 10.27 22.35Food 40.3 15.02 26.61 59.03 48.03i): Perishable 5.14 4.46 23.24 2.23 5.34ii): Non perishable 35.2 12.94 28.61 44.36 45.06Non-Food 59.7 6.82 19.01 39.6 50.75Core* 52.4 7.49 17.83 38.61 47.97Apparel, Textile 6.1 7.86 14.87 4.67 4.06House Rent 23.4 8.78 16.78 19.92 17.6Energy* 7.3 3.42 24.98 2.88 9.7Household 3.3 6.56 13.53 2.1 1.99Transport* 7.3 0.66 29.53 0.34 6.91Recreation 0.8 0.42 12.71 0.03 0.47Education 3.5 6.89 16.74 2.32 2.58Cleaning 5.9 9.76 18.72 5.59 4.92Medicine 2.1 8.38 12.44 1.69 1.15
# Calculated as group specific inflation times its divided by total inflation * Updated till April 2009. Source: Federal Bureau of Statistics (c) Consumption
Given its lion’s share in GDP, consumption mainly supported the growth momentum and has contributed in the range of 80 to 83 percent to overall economic growth in the last seven years. In 2007-08 consumption accounted for 142 percent or 2.9 percentage points to real GDP (mp) growth of 2 percent, while in the year 2008-09, private consumption contributed almost 97 percent of the size of the economy only to be neutralized by a massive fall in public consumption and investment.
227

Table 16: Composition of GDP Growth Point Contribution
Flows 2002-03 2003-04 2004-05 2005-06 2006-07 2007-08 2008-09 Private Consumption 0.3 7.1 8.7 0.8 3.4 -0.9 3.6Public Consumption 0.6 0.1 0.1 3.9 -1.1 3.8 -1.8Total Consumption [C] 0.9 7.2 9.4 4.7 2.3 2.9 1.8Gross fixed Investment 0.6 -1 1.8 2.9 2.2 0.7 -1.2Change in Stocks 0.4 0.1 0.1 0.1 0.1 0.1 -0.1Total Investment [I] 1.1 -0.9 2 2.9 2.3 0.7 -1.2Exports (Goods & Serv.) [X] 4.5 -0.3 1.7 1.8 0.4 -1 1.5Imports (Goods & Serv.) [M] 1.6 -1.3 5.4 3.2 -0.7 0.6 -1.6Net Exports [X-M] 2.8 1 -3.7 -1.5 1.1 -1.6 3.2Aggregate Demand (C+I+X) 6.5 6 13 9.4 5 2.6 2.1Domestic Demand (C+I) 2 6.3 11.3 7.6 4.6 3.6 0.6GDP MP 4.8 7.4 7.7 6.2 5.7 2 3.7
Source: Federal Bureau of Statistics
The contribution of private sector dominated the scene. It was 87.51 % of total consumption in fiscal year 2001-02 and it grew to 92.38% for the period 2005-06. The government or the public sector consumption has experienced declining trend which has declined from 12.39 % of total consumption in fiscal year 2001-02 to 7.62% for the period 2005-06. The balance between consumption and investment which had improved during 2004-05 to 2006-07, disturbed significantly during 2007-08 and 2008-09 as indicated in Table 16. (d) Investment and Saving
Investment is a key determinant of growth and its fluctuation reflects the intensification of economic activity. The total investment has declined from 22.5 percent of GDP in 2006-07 to 19.7 percent of GDP in 2008-09. Fixed investment in 2008-09 decreased to 18.1 percent of GDP from 20.4 percent. Gross fixed capital formation in real terms has contracted in 2008-09 by 6.5 percent compared to an expansion of 3.8 percent last year. However, in nominal terms gross fixed capital formation increased by 13.1 percent in 2008-09 against 15.5 percent of the previous year.
Private sector investment also witnessed a contraction of 7 percent in real terms and expansion of 12 percent in nominal terms during 2008-09 compared to a growth of 3.6 percent in real and 15.1 percent in nominal terms in the previous year. The composition of investment in private and public sectors has changed considerably during the last three years. Private sector investment was decelerating persistently since 2004-05 and its ratio to GDP has declined from 15.7 percent in 2004-05 to 13.2 percent in 2008-09.
Public sector investment to GDP ratio was rising persistently from 4 percent in 2003-04 to 5.6 percent in 2006-07, however, declined to 4.9 percent in 2008-09. Public sector investment is crucial for catalyzing economic development and it has created spillover effects for private sector investment through massive increase in development spending particularly infrastructure (See Table 17). However, squeeze on development expenditure made it decelerate at brisk space.
The contribution of national savings to the domestic investment is indirectly the mirror image of foreign savings required to meet investment demand. National savings at 13.5 percent of GDP in 2007-08 is the lowest ever level since 1999-2000 and has financed 61.5 percent of fixed investment in 2007-08. The fiscal year 2008-09 has improved upon this performance and national savings as percentage of GDP stood at 14.3 percent. Domestic savings have also declined substantially from 16.3 percent of GDP in 2005-06 to 11.2 percent of GDP in 2008-09. In the current scenario, net foreign resource inflows are coming in a huge quantum and financing savings -- investment gap. In the fiscal year 2008-09 too, inflows remained at 5.3 percent of GDP.
228
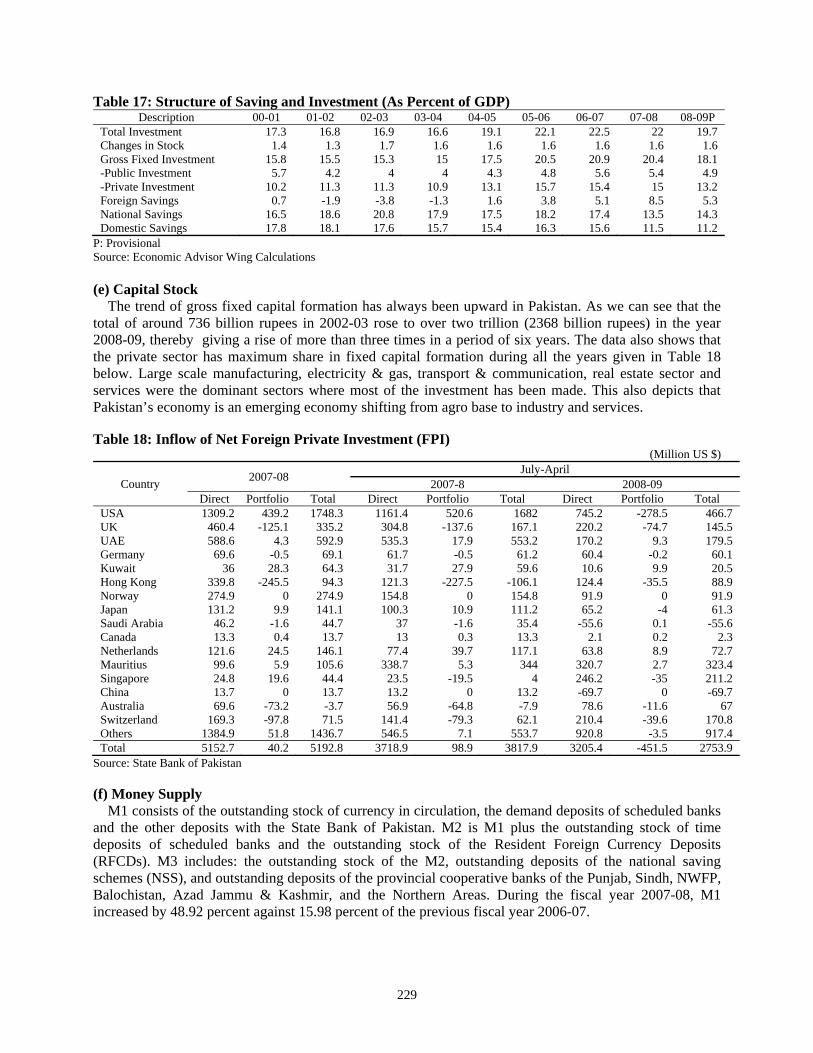
Table 17: Structure of Saving and Investment (As Percent of GDP) Description 00-01 01-02 02-03 03-04 04-05 05-06 06-07 07-08 08-09P
Total Investment 17.3 16.8 16.9 16.6 19.1 22.1 22.5 22 19.7Changes in Stock 1.4 1.3 1.7 1.6 1.6 1.6 1.6 1.6 1.6Gross Fixed Investment 15.8 15.5 15.3 15 17.5 20.5 20.9 20.4 18.1-Public Investment 5.7 4.2 4 4 4.3 4.8 5.6 5.4 4.9-Private Investment 10.2 11.3 11.3 10.9 13.1 15.7 15.4 15 13.2Foreign Savings 0.7 -1.9 -3.8 -1.3 1.6 3.8 5.1 8.5 5.3National Savings 16.5 18.6 20.8 17.9 17.5 18.2 17.4 13.5 14.3Domestic Savings 17.8 18.1 17.6 15.7 15.4 16.3 15.6 11.5 11.2
P: Provisional Source: Economic Advisor Wing Calculations (e) Capital Stock
The trend of gross fixed capital formation has always been upward in Pakistan. As we can see that the total of around 736 billion rupees in 2002-03 rose to over two trillion (2368 billion rupees) in the year 2008-09, thereby giving a rise of more than three times in a period of six years. The data also shows that the private sector has maximum share in fixed capital formation during all the years given in Table 18 below. Large scale manufacturing, electricity & gas, transport & communication, real estate sector and services were the dominant sectors where most of the investment has been made. This also depicts that Pakistan’s economy is an emerging economy shifting from agro base to industry and services. Table 18: Inflow of Net Foreign Private Investment (FPI)
(Million US $)
Country 2007-08 July-April 2007-8 2008-09
Direct Portfolio Total Direct Portfolio Total Direct Portfolio Total USA 1309.2 439.2 1748.3 1161.4 520.6 1682 745.2 -278.5 466.7UK 460.4 -125.1 335.2 304.8 -137.6 167.1 220.2 -74.7 145.5UAE 588.6 4.3 592.9 535.3 17.9 553.2 170.2 9.3 179.5Germany 69.6 -0.5 69.1 61.7 -0.5 61.2 60.4 -0.2 60.1Kuwait 36 28.3 64.3 31.7 27.9 59.6 10.6 9.9 20.5Hong Kong 339.8 -245.5 94.3 121.3 -227.5 -106.1 124.4 -35.5 88.9Norway 274.9 0 274.9 154.8 0 154.8 91.9 0 91.9Japan 131.2 9.9 141.1 100.3 10.9 111.2 65.2 -4 61.3Saudi Arabia 46.2 -1.6 44.7 37 -1.6 35.4 -55.6 0.1 -55.6Canada 13.3 0.4 13.7 13 0.3 13.3 2.1 0.2 2.3Netherlands 121.6 24.5 146.1 77.4 39.7 117.1 63.8 8.9 72.7Mauritius 99.6 5.9 105.6 338.7 5.3 344 320.7 2.7 323.4Singapore 24.8 19.6 44.4 23.5 -19.5 4 246.2 -35 211.2China 13.7 0 13.7 13.2 0 13.2 -69.7 0 -69.7Australia 69.6 -73.2 -3.7 56.9 -64.8 -7.9 78.6 -11.6 67Switzerland 169.3 -97.8 71.5 141.4 -79.3 62.1 210.4 -39.6 170.8Others 1384.9 51.8 1436.7 546.5 7.1 553.7 920.8 -3.5 917.4Total 5152.7 40.2 5192.8 3718.9 98.9 3817.9 3205.4 -451.5 2753.9
Source: State Bank of Pakistan (f) Money Supply
M1 consists of the outstanding stock of currency in circulation, the demand deposits of scheduled banks and the other deposits with the State Bank of Pakistan. M2 is M1 plus the outstanding stock of time deposits of scheduled banks and the outstanding stock of the Resident Foreign Currency Deposits (RFCDs). M3 includes: the outstanding stock of the M2, outstanding deposits of the national saving schemes (NSS), and outstanding deposits of the provincial cooperative banks of the Punjab, Sindh, NWFP, Balochistan, Azad Jammu & Kashmir, and the Northern Areas. During the fiscal year 2007-08, M1 increased by 48.92 percent against 15.98 percent of the previous fiscal year 2006-07.
229

Table 19: Income Velocity of Money (Rs billion)
End June Stock Narrow Money M1 Monetary Assets (M2) (Rs million) Growth Percentage Income Velocity of
Monetary Assets (M2)1980-81 73.56 104.62 13.2 2.71981-82 80.93 116.51 11.4 2.71982-83 96.54 146.03 25.3 2.71983-84 103.45 163.27 11.8 2.71984-85 118.97 183.91 12.6 2.71985-86 134.83 211.11 14.8 2.61986-87 159.63 240.02 13.7 2.51987-88 185.08 289.51 12.3 2.61988-89 206.36 290.46 7.8 2.71989-90 240.16 341.25 17.5 2.71990-91 265.14 400.64 17.4 2.71991-92 302.91 505.57 26.2 2.71992-93 327.82 595.39 17.8 2.31993-94 358.77 703.43 18.1 2.41994-95 423.14 824.73 17.2 2.41995-96 448.01 938.68 13.8 2.41996-97 443.55 1,053.23 12.2 2.51997-98 480.33 1,206.32 14.5 2.31998-99 643.04 1,280.55 6.2 2.41999-2000 739.03 1,400.63 9.4 2.22000-01 1275.6 1,526.04 9.0 2.62001-02 1494.14 1,751.88 14.8 2.52002-03 1797.36 2,078.48 18.6 2.32003-04 2174.74 2,485.49 19.6 2.32004-05 2512.21 2,960.64 19.1 2.42005-06 2720.68 3,406.91 15.1 2.12006-07 3155.63 4,065.16 19.3 2.02007-08 4699.44 4,689.14 15.3 2.2End March 2007-08 _ 4,395.15 8.1 _2008-09 _ 4,767.27 1.7 _
P: Provisional Source: State Bank of Pakistan
M2 recorded a growth of 15.3 percent during the year 2007-08 compared to 19.3 percent the previous fiscal year 2006-07. A growth of 1.7 percent in M2 was, however, recorded during first nine months of the fiscal year 2008-09 compared to 8.1 percent growth in the corresponding period of the last year 2007-08. During July-May 2008-09, currency in circulation increased to Rs. 199.9 billion as compared to Rs. 186.1 billion during the same period in last year.
The State Bank of Pakistan has taken a number of proactive and forward looking steps during the last few years to strengthen the prudential regulations and monitoring framework. These measures are also meant to facilitate the farming community, ensure participation of non-banks in the secondary market for government papers/bonds, induce private sector to invest in the infrastructure development projects, promote consumer and housing finance, SME (Small and Medium Enterprise) sector and for improved governance of the financial system. (g) Employment
Employment comprises of all the persons of ten years of age and above who work at least one hour during the reference period and were either “paid employed” or “self employed”. Persons employed on permanent / regular basis who have not worked for any reason during the reference period are also treated as employed regardless of the duration of the absence or salary received during the absence. During the period 1999-2000 to 2005-06, 11.33 million work opportunities were created, mainly due to the strong economic growth. In the subsequent year 2007-08, an increase of 1.44 million employed was observed, bulk of the opportunities were created in rural areas, (1.37 million) compared to only 0.07 million in urban
230

areas (see Table 20). This is indicative of a weaker labor market situation, especially in the urban areas of country. Nevertheless, the employment opportunities increased from the previous year. Table 20: Employment Trend and Changes from 1996-97 and 2007-08 (million)
Year Pakistan Rural Urban Employed Change Employed Change Employed Change
1998-99 34.13 - 23.87 - 10.78 - 1999-00 36.32 2.19 25.55 1.68 10.77 -0.01 2001-02 38.88 2.56 26.66 1.11 12.22 1.45 2003-04 42.00 3.12 28.81 2.15 13.19 0.97 2005-06 46.95 4.95 32.49 3.68 14.46 1.27 2006-07 47.65 0.70 33.11 0.62 14.54 0.08 2007-08 49.09 1.44 34.48 1.37 14.61 0.07
Source: Labor Force Surveys 2001-02, 2003-04, 2005-06 & 2006-07, Federal Bureau of Statistics
Unemployment in Pakistan comprises of all persons of ten years of age and above who during the reference period were without work, that is, were not in paid employment or self employment. Unemployed labor force during the year 2007-08 is estimated at 2.69 million. The unemployment rate is the unemployed population expressed as a percentage of the active population in the reference period. The active population comprises of all persons of ten years of age and above who fulfill the requirements of being included among employed or unemployed during the reference period. The male unemployment rate has decreased while that of females has increased. The rural unemployment rate is stagnant. II.2 Fiscal Development
Pakistan has gained some momentum on fiscal side. Revenues are buoyant, expenditure is rationalized, fiscal deficit is at sustainable level and revenue deficit has almost been eliminated. Resultantly, public debt is fast moving towards a sustainable level. Much progress has been made towards fiscal consolidation. The wide-ranging tax and tariff reforms as well as reforms in tax administration have started paying dividends. Tax collection by the Federal Board of Revenue (FBR) has picked up pace. As a result of prudent fiscal management over the last seven years, the burden of interest payment in domestic budget has declined sharply, thereby releasing resources for development and social sector program. Table 21: Fiscal Indicators as Percent of GDP
Year Real GDP growth
Overall Fiscal Deficit
Expenditure Revenue
Total Current Development Total Rev. Tax Non-Tax
FY91 5.4 9.5 25.6 19.2 6.4 16.9 12.7 4.2 FY92 7.6 8.7 26.5 19 7.5 19.2 13.7 5.5 FY93 2.1 8.1 26.2 20.5 5.7 18.1 13.4 4.7 FY94 4.4 5.9 23.4 18.8 4.6 17.5 13.4 4.1 FY95 5.1 5.6 22.9 18.5 4.4 17.3 13.8 3.5 FY96 6.6 6.5 24.4 20 4.4 17.9 14.4 3.5 FY97 1.7 6.4 22.3 18.8 3.5 15.8 13.4 2.4 FY98 3.5 7.7 23.7 19.8 3.9 16 13.2 2.8 FY99 4.2 5 22 18.6 3.3 15.9 13.3 2.7 FY00 3.9 5.4 18.9 16.4 2.5 13.4 10.6 2.8 FY01 1.8 4.3 17.4 15.3 2.1 13.1 10.5 2.6 FY02 3.1 3.7 18.5 15.7 2.8 14 10.7 3.3 FY03 4.7 2.3 18.8 16.2 2.6 14.8 11.4 3.4 FY04 7.5 3.3 16.5 13.7 2.8 14.2 11 3.2 FY05 9 4.3 16.8 13.3 3.5 13.8 10.1 3.7 FY06 5.8 4.3 18.4 13.6 4.8 14.1 10.5 3.6 FY07 6.8 7.4 20.8 15.8 5 14.9 10.2 4.7 2007-08 5.8 7.4 22.1 18 4.4 14.6 10.3 4 2008-09P 2 4.3 18.6 15.8 2.8 14.6 11.3 3.8
Source: Economic Survey of Pakistan, 2008-09
231

During the five years from 2000-01 to 2005-06, tax collection by the FBR increased by 81.0%. The Federal Board of Revenue (FBR) for the first time in history of the country surpassed a figure of rupee one trillion (Rs.1025 million) tax collections in the year 2007-08. The tax revenue for the year 2008-09 remained at Rs.1250 million which shows a growth of 16 percent compared to 12 percent of the previous year.
Fiscal year 2008-09 had been a difficult year for Pakistan’s economy due to many unexpected events on both foreign and domestic fronts. Notwithstanding difficulties faced by the economy during the year 2008-09, better fiscal discipline and improving management led to substantial improvement in the fiscal outlook. Total expenditure has fluctuated between 17 and 20 percent of GDP in the past six years. During 2008-09, expenditure remained 18.6 percent of GDP compared to 22.2 percent in the previous year. The spike during 2007-08 was mainly due to unprecedented expenditures incurred on account of subsidies and political expediencies by the outgoing government in the election year. The year 2008-09, however, witnessed correction on this account and expenditure control measures brought significant downward adjustment in expenditure. Interest payments decline from as high as 6.8 percent of GDP or Rs.262 billion in 1999-2000 to 4.8 percent of GDP or Rs.624 billion for 2008-09. The war on terror in some parts of the country has placed a burden on security related expenditure.
Growth in total expenditure witnessed significant decline at the expense of substantial fall in development spending to the extent of 15.1 percent. Elimination of oil subsidies and a decline in development spending led to a significant reduction in public expenditure growth during the first half of the year 2008-09. As a share of GDP, development expenditure dropped to one percent in the first half of 2008-09 which is the lowest level of spending in the last five years. Current expenditure grew by 18.3 percent as compared to 33.3 percent increase in the same period of last year. However, the first half current expenditure growth is still high and needs to be brought down for sustained fiscal consolidation. The main reason for this rise is the tremendous rise in security related expenditure. II.2.1 Government Expenditure
The total expenditure, as pointed out above, remained more or less in band of 17 to 20 percent of GDP during the last six years. The share of current expenditure in total expenditure declined from 88 percent in 1999-2000 to 81.4 percent in 2007-08, mainly because of enormous decline in interest related expenditure. In absolute terms, current expenditure stood at Rs.1858 billion in 2007-08 and budgeted at Rs. 2066 billion in 2008-09.
On the other hand, development expenditure rose from 13.5 percent to 19.8 percent during the same period. During the last nine years, development expenditure increased from 2.1 percent of GDP to or Rs.89.8 billion in 2000-01 to 4.4 percent of GDP or Rs.452.4 billion in 2007-08. In 2008-09, development expenditure budgeted at 2.8 percent of GDP or Rs.365 billion.
Defense, the second largest component of current expenditure, remained stagnant at around 3 percent of GDP during the last six years. In 2008-09, it stood at Rs.313 billion or 2.4 percent of GDP. Non-defense, non-interest expenditure has improved from 8 percent of GDP or Rs.337.4 billion in 2000-01 to 11.4 percent of GDP or Rs.1494 billion in 2008-09. Although in relative terms (percent of GDP), non-interest expenditure in 2008-09 is lower than that of 2007-08, in absolute terms it is still high.
232

Table 22: Federal Government Overall Budgetary Position (Rs. Million)
Fiscal year Item
2007-08 (R.E)
2008-09 (R.E)
A. Revenue 1. Direct Taxes 405.000 405,000 2. Indirect Taxes 519.636 754,000
i. Customs 150,545 170,000 ii. Sales Tax 385,497 472,000 iii. Federal Excise 83,594 112,000
3. Total Tax Revenue 1,024,636 1,159,000 (1+2) 1,059,814 1,212,000
4. Surcharges (Gas and Oil) 35,178 53,000 5. Non-Tax Revenue 370.698 410,776 6. Total Revenue Receipts 1,430,512 1,622,776
Gross (3+4+5) B. EXPENDITURE
9. Current expenditure 1,437,166 1,377,153 i. Defense 277,300 296,077 ii. Interest 489,681 523,172 iii. Grants 87,000 87,000 iv. Economic Services @ 78,900 78,900 v. Subsidies 407,485 295,204 vi. Other 96,800 96,800
10. Development Expenditure (PSDP) 238,000 247,000 11. Total expenditure (9+10) 1,675,166 1,624,153
Source: Budget Wing, Finance Division. Islamabad
233
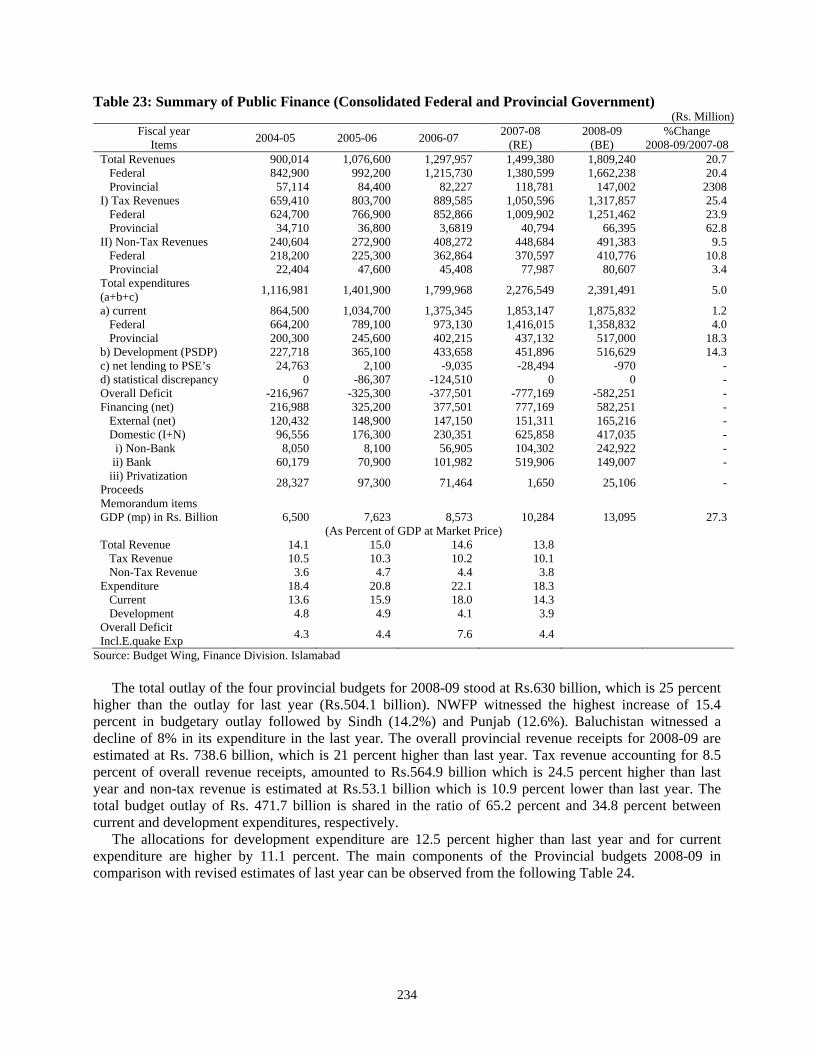
Table 23: Summary of Public Finance (Consolidated Federal and Provincial Government) (Rs. Million)
Fiscal year Items 2004-05 2005-06 2006-07 2007-08
(RE) 2008-09
(BE) %Change
2008-09/2007-08Total Revenues 900,014 1,076,600 1,297,957 1,499,380 1,809,240 20.7 Federal 842,900 992,200 1,215,730 1,380,599 1,662,238 20.4 Provincial 57,114 84,400 82,227 118,781 147,002 2308I) Tax Revenues 659,410 803,700 889,585 1,050,596 1,317,857 25.4 Federal 624,700 766,900 852,866 1,009,902 1,251,462 23.9 Provincial 34,710 36,800 3,6819 40,794 66,395 62.8II) Non-Tax Revenues 240,604 272,900 408,272 448,684 491,383 9.5 Federal 218,200 225,300 362,864 370,597 410,776 10.8 Provincial 22,404 47,600 45,408 77,987 80,607 3.4Total expenditures (a+b+c) 1,116,981 1,401,900 1,799,968 2,276,549 2,391,491 5.0
a) current 864,500 1,034,700 1,375,345 1,853,147 1,875,832 1.2 Federal 664,200 789,100 973,130 1,416,015 1,358,832 4.0 Provincial 200,300 245,600 402,215 437,132 517,000 18.3b) Development (PSDP) 227,718 365,100 433,658 451,896 516,629 14.3c) net lending to PSE’s 24,763 2,100 -9,035 -28,494 -970 -d) statistical discrepancy 0 -86,307 -124,510 0 0 -Overall Deficit -216,967 -325,300 -377,501 -777,169 -582,251 -Financing (net) 216,988 325,200 377,501 777,169 582,251 - External (net) 120,432 148,900 147,150 151,311 165,216 - Domestic (I+N) 96,556 176,300 230,351 625,858 417,035 - i) Non-Bank 8,050 8,100 56,905 104,302 242,922 - ii) Bank 60,179 70,900 101,982 519,906 149,007 - iii) Privatization Proceeds 28,327 97,300 71,464 1,650 25,106 -
Memorandum items GDP (mp) in Rs. Billion 6,500 7,623 8,573 10,284 13,095 27.3
(As Percent of GDP at Market Price) Total Revenue 14.1 15.0 14.6 13.8 Tax Revenue 10.5 10.3 10.2 10.1 Non-Tax Revenue 3.6 4.7 4.4 3.8 Expenditure 18.4 20.8 22.1 18.3 Current 13.6 15.9 18.0 14.3 Development 4.8 4.9 4.1 3.9 Overall Deficit Incl.E.quake Exp 4.3 4.4 7.6 4.4
Source: Budget Wing, Finance Division. Islamabad
The total outlay of the four provincial budgets for 2008-09 stood at Rs.630 billion, which is 25 percent higher than the outlay for last year (Rs.504.1 billion). NWFP witnessed the highest increase of 15.4 percent in budgetary outlay followed by Sindh (14.2%) and Punjab (12.6%). Baluchistan witnessed a decline of 8% in its expenditure in the last year. The overall provincial revenue receipts for 2008-09 are estimated at Rs. 738.6 billion, which is 21 percent higher than last year. Tax revenue accounting for 8.5 percent of overall revenue receipts, amounted to Rs.564.9 billion which is 24.5 percent higher than last year and non-tax revenue is estimated at Rs.53.1 billion which is 10.9 percent lower than last year. The total budget outlay of Rs. 471.7 billion is shared in the ratio of 65.2 percent and 34.8 percent between current and development expenditures, respectively.
The allocations for development expenditure are 12.5 percent higher than last year and for current expenditure are higher by 11.1 percent. The main components of the Provincial budgets 2008-09 in comparison with revised estimates of last year can be observed from the following Table 24.
234

Table 24: Overview of Provincial Budgets (Rs Billion)
Items Punjab Sindh NWFP Baluchistan Total
07-08 08-09 07-08 08-09 07-08 08-09 07-08 08-09 07-08 08-09RE BE RE BE RE BE RE BE RE BE
A. Total Tax Revenue 256.4 329.9 158 188.7 59.1 76.2 30.7 35.2 504.1 630Provincial Taxes 30.6 40.4 16.4 19.8 2.4 3.9 0.9 1 50.3 65.1Share in Federal Taxes 225.8 289.6 141.6 168.9 56.7 72.2 29.8 34.2 453.8 564.9B. Non-Tax Revenue 42.2 36.6 12.1 10.5 3.1 3.5 2.3 2.5 59.6 53.1C. All Others 6.2 7.3 8.7 12.8 17.5 20.7 15.8 14.8 48.2 55.5Total Revenues (A+B+C) 304.7 373.8 178.7 211.9 79.7 100.4 48.8 52.5 611.9 738.6
a) Current Expenditure 232.2 257 163.9 181 61.5 67.3 40 47.5 497.5 552.8b) Development Expenditure 138 160 62.3 77.3 32.9 41.6 28.8 15.7 262 294.7
i) Rev Account 79.2 81.1 14.4 35.8 5.5 8 0 0 99.1 124.9ii) Cap Account 58.8 78.9 47.9 41.5 27.4 33.6 28.8 15.7 162.9 169.8Total Exp (a+b) 370.2 417 226.2 258.3 94.4 108.9 68.8 63.3 759.5 847.4
Source: Provincial Finance Wing. Ministry of Finance II.2.2 Public Borrowings
Pakistan’s public debt grew at an average rate of 18 percent and 15 percent per annum during the 1980s and 1990s, respectively – much faster than the growth in nominal GDP (11.9% and 13.9% respectively).
Resultantly, public debt rose from 56 percent of GDP at the end of the 1970s to 92 percent by the end of the 1980s. The root cause of rising debt burden has been the persistence of large fiscal and current account deficits. Pakistan, on average, sustained fiscal and current account deficits of almost 7 percent and 5 percent of GDP, respectively during 1990-99. In many developing countries including Pakistan, the “twin deficits” have been the prime cause of low economic growth. Large fiscal and current account deficits led to the accumulation of domestic and external debt which increased country’s vulnerability to external shocks, reduced investment rate, and consequently slowed economic growth. Thus, there exist a strong negative relationship between fiscal deficits and economic growth. When a country like Pakistan sustains such a large fiscal and current account deficits for so long a period is bound to experience decrease in economic growth.
It is in this background that the first and foremost challenge for the government six years ago had been to arrest the rising trends of debt. The government had set-up a high level Debt Committee which examined the root cause of the rising debt burden and suggested debt reduction strategy to stabilize debt situation. The government is following the debt strategy as suggested by the Committee. Reduction in the fiscal and current account deficits, lowering the cost of borrowing, raising revenue and foreign exchange earnings, and debt re-profiling from the Paris Club have been the key features of the debt reduction strategy. To provide legal cover to debt reduction strategy a Fiscal Responsibility and Debt Limitation Act 2005 was promulgated in June 2005. As a result of the credible strategy being followed by the Government, the public debt-to-GDP ratio, which stood at almost 85 percent in end June 2000, declined substantially to 61.4 percent by the end of June 2005, 23.6 percentage points decline in country’s debt burden in 5 years. As far year 2008-09, total public debt increased by Rs.1367 billion in the first nine months, reaching a total outstanding amount of Rs.7268 billion; an increase of 23.2 percent in nominal terms. Total public debt had been growing at an average of 12 percent per year since 1999-2000.
The increase in total public debt is shared between rupee and foreign currency debt in the ratio 0f 40:60. The rise in foreign currency debt is mainly is massive depreciation of Pak rupee in the start of fiscal year 2008-09. In absolute terms $3.1 billion are added to the public external debt in the period July-March 2009, however, big chunk of Rs.246 billion has come from depreciation. In the first nine months of 2008-09, the depreciation of rupee against the dollar has been responsible for approximately 18 percent addition to total increase in public debt and 30 percent to public external component. The rupee has lost 20 percent of its value against the dollar in just nine months.
The structure of public debt has also experienced subtle changes since 2001-02. The focus has been shifted more towards domestic borrowings which inched up its share from 48.9 percent in 2001-02 to
235
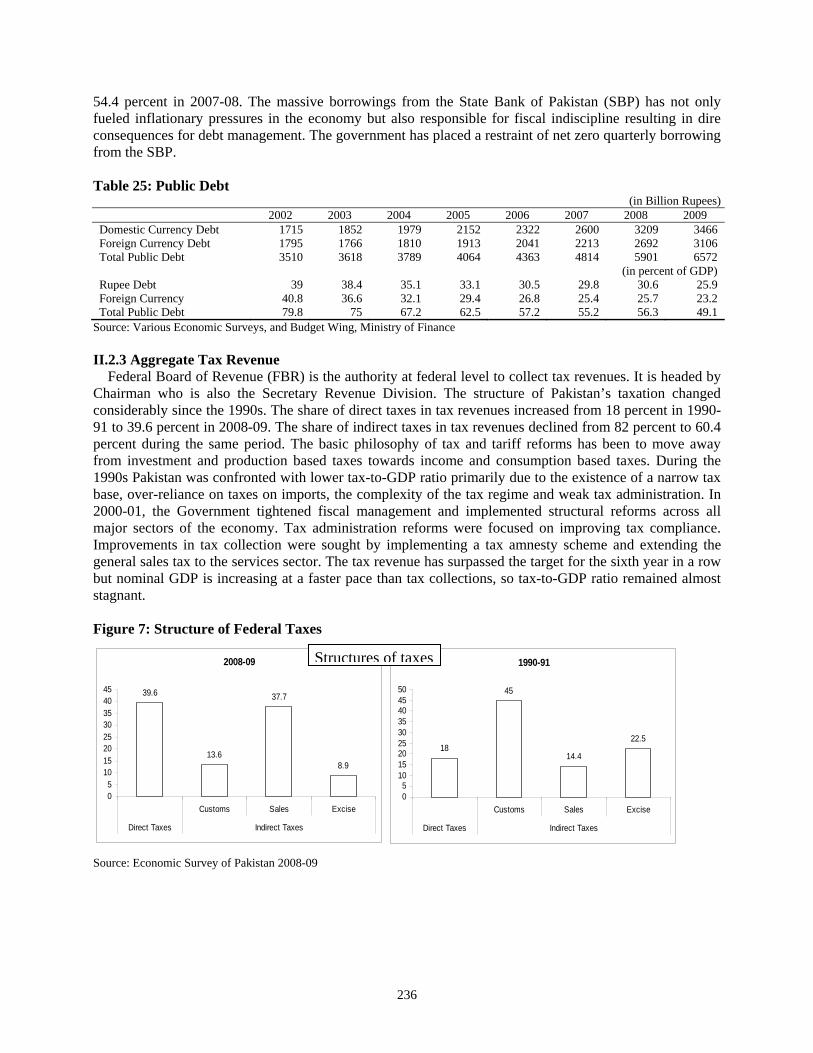
54.4 percent in 2007-08. The massive borrowings from the State Bank of Pakistan (SBP) has not only fueled inflationary pressures in the economy but also responsible for fiscal indiscipline resulting in dire consequences for debt management. The government has placed a restraint of net zero quarterly borrowing from the SBP. Table 25: Public Debt
(in Billion Rupees) 2002 2003 2004 2005 2006 2007 2008 2009 Domestic Currency Debt 1715 1852 1979 2152 2322 2600 3209 3466Foreign Currency Debt 1795 1766 1810 1913 2041 2213 2692 3106Total Public Debt 3510 3618 3789 4064 4363 4814 5901 6572
(in percent of GDP)Rupee Debt 39 38.4 35.1 33.1 30.5 29.8 30.6 25.9Foreign Currency 40.8 36.6 32.1 29.4 26.8 25.4 25.7 23.2Total Public Debt 79.8 75 67.2 62.5 57.2 55.2 56.3 49.1
Source: Various Economic Surveys, and Budget Wing, Ministry of Finance II.2.3 Aggregate Tax Revenue
Federal Board of Revenue (FBR) is the authority at federal level to collect tax revenues. It is headed by Chairman who is also the Secretary Revenue Division. The structure of Pakistan’s taxation changed considerably since the 1990s. The share of direct taxes in tax revenues increased from 18 percent in 1990-91 to 39.6 percent in 2008-09. The share of indirect taxes in tax revenues declined from 82 percent to 60.4 percent during the same period. The basic philosophy of tax and tariff reforms has been to move away from investment and production based taxes towards income and consumption based taxes. During the 1990s Pakistan was confronted with lower tax-to-GDP ratio primarily due to the existence of a narrow tax base, over-reliance on taxes on imports, the complexity of the tax regime and weak tax administration. In 2000-01, the Government tightened fiscal management and implemented structural reforms across all major sectors of the economy. Tax administration reforms were focused on improving tax compliance. Improvements in tax collection were sought by implementing a tax amnesty scheme and extending the general sales tax to the services sector. The tax revenue has surpassed the target for the sixth year in a row but nominal GDP is increasing at a faster pace than tax collections, so tax-to-GDP ratio remained almost stagnant. Figure 7: Structure of Federal Taxes
2008-09
39.6
13.6
37.7
8.9
05
1015202530354045
Customs Sales Excise
Direct Taxes Indirect Taxes
1990-91
18
45
14.4
22.5
05
101520253035404550
Customs Sales Excise
Direct Taxes Indirect Taxes
Structures of taxes
Source: Economic Survey of Pakistan 2008-09
236

Table 26: Trend of Federal Taxes Year Tax Collection (Billion Rs) %age Increase
2002-2003 461 14%2003-2004 519 13.10%2004-2005 589 13.20%2005-2006 713 20.70%2006-2007 847 18.80%2007-2008 1025 21%2008-2009(Provisional) 1250 21.90%
Source: Federal Board of Revenue, Pakistan
237

III. Tax Structure: Institutions and the Reality
An efficient tax system should raise enough revenue to finance essential expenditures without excessive public sector borrowing; and raise the revenue in ways that are equitable and that minimize its disincentive effects on economic activities.
In Pakistan, the establishment of effective and efficient tax system faces some serious challenges. The first of these challenges is the structure of the economy that makes it difficult to impose and collect certain taxes. For example, the economy of Pakistan is often characterized by a large share of agriculture in total output and employment; by large informal sector activities and occupations’ by many small establishments; by a small share of wages in total national income, and so on. All these factors reduce the possibility of relying on certain modern taxes such as income tax, sales tax etc. The structure of the economy in association with low literacy and low human capital make it difficult to develop a good tax administration. When the officials of tax administration are not well educated and well trained, when resources to pay good salary and to establish necessary infrastructure are limited, when the tax payers have limited ability to keep accounts, when the use IT is limited, it is difficult to collect tax effectively.
In consequence all above said factors, Pakistan often ended up with small tax sources, heavy reliance on custom duties, and not on direct taxes. The non-availability of reliable statistics from the businesses makes it even more difficult for tax administration to assess the potential taxes that need to be collected. As a consequence, marginal changes are often preferred over major structural changes. This perpetuates the inefficient tax structure.
Uneven income distribution is also a major constraint in developing efficient tax system. To generate higher tax revenue, the high income earners are supposed to be taxed significantly more proportionately than the low income group. But the economic and political powers are concentrated in the top brackets which set the goals of the tax administration rather more difficult to collect taxes from high income earners. This is one of the major reasons that the number of income tax payers in Pakistan is very low.
The above discussed factors and difficulties prevented Pakistan to raise its tax-to-GDP ratio in line with the average of developing countries at 17%. As a result, Pakistan sustained a large budget deficit throughout the 1990s. Realizing the weaknesses of Pakistan’s tax structure, a concerted reform effort was launched in the early 2000. The government began wide-ranging tax and tariff reforms and worked on fiscal transparency, aimed at reducing tax rates, broadening the tax base to hitherto untaxed or under taxed sectors, and shifting the incidence of taxes from imports and investment to consumption and incomes.
The reduction in tax rates was intended to stimulate investment and production and promote voluntary tax compliance. Broadening of the tax base was intended to ensure the fair distribution of the tax burden among various sectors of the economy. Among the various tax policy reforms, the most significant are the continuous raising of the basic threshold of income tax, reduction of corporate tax rate to ensure parity between the rates applicable to private, public, and banking companies, re-introducing uniformity of General Sales Tax rate, and continuous reduction and rationalization of tariff rates.
The wide-ranging tax and tariff reforms as well as reforms in the tax administration have started paying dividends. Tax collection by the Federal Board of Revenue (FBR) has gone up, the overall budget deficit as percentage of GDP has declined; the revenue deficit has been narrowed. An improved tax structure will reduce the deadweight loss associated with raising a given amount of revenue and a reduction in the relative share of trade taxes, and increase in the relative shares of taxes on income and consumption could be an ample evidence of an improvement in the tax system.
238

Table 27: Structure of Federal Tax Revenue Year Total
(FBR) Tax Rev as
percent of GDP Direct Taxes Indirect Taxes Customs Sales Excise Total
1990-91 111 11 20 50 16 25 91[18.0]* (54.9)^ (17.6)^ (27.5)^ [82.0]*
1999-00 346.6 9.1 112.6 61.6 116.7 55.6 234[32.5] {26.4} {49.9} {23.7} [67.5]
2000-01 392.3 9.4 124.6 65 153.6 49.1 267.7[31.8] {24.3} {57.4} {18.3} [68.2]
2001-02 403.9 9.2 142.5 47.8 166.6 47.2 261.6[35.3] {18.3} {63.7} {18} [64.7]
2002-03 460.6 9.6 148.5 59 205.7 47.5 312.2[32.2] {18.9} {65.9} {15.2} [67.8]
2003-04 518.8 9.2 165.3 89.9 219.1 44.6 353.6[31.9] {25.4} {62} {12.6} [68.1]
2004-05 588.4 8.9 176.9 117 253.5 58.7 411.4[30.1] {28.5} {57.2} {14.3} [68.9]
2005-06 713.4 9.4 224.6 138 294.6 55 487.9[31.5] {28.3} {60.4} {11.3} [68.5]
2006-07 847.2 9.7 333.7 132.3 309.4 71.8 513.5[39.4] {25.8} {60.3} {13.9} [60.6]
2007-08 (R.E) 1025 10 408.2 154 357 91 622.3[39.6] {27.7} {60.3} {14.6} [60.4]
2008-09P 1250 9.5 496 170 472 112 755.5[39.6] {22.5} {62.5} {14.8} [60.4]
* as percent of total taxes ^ as percent of indirect taxes Source: Federal Board of Revenue
The basic principles of tax policy have been set as widening the tax base by reducing exemptions, incentives and concessions, reducing multiplicity of rates, lowering tax rates, shifting the incidence of tax burden from production to consumption, moving away from the excessive reliance on manufacturing and taxing all value additions including services, and re- engineering business process of the tax system to overcome the culture of tax avoidance and evasion; introducing business process changes in tax administration to establish an efficient tax system. It is the continuous policy and effort of the government to implement these principles. But unfortunately despite the recent reforms, the tax effort remained modest in Pakistan on account of various structural problems. The administrative reforms envisaged by the FBR, especially moving towards a functional organizational structure, has helped to enhance tax efficiency, as well as improving the tax climate and governance. However, expanding taxation gradually into the agricultural and service sectors would bring greater yields, as would efforts to reduce evasion.
239

Figure 8: Federal Taxes
Figure-8: Federal Taxes
Federal Taxes
Indirect Taxes Direct Taxes
Income Tax CVTCustoms Duties Federal Excise Sales Tax
Why tax-to-GDP ratio in Pakistan is low in comparison to many developing countries? Despite better growth performance in recent past Pakistan’s tax-to-GDP ratio could not rise. The main reason is that GDP grew at a faster pace than tax revenue. If we analyze the contribution of various sectors of the economy in GDP growth vis-à-vis their share in taxes, we can easily identify the answer. Almost one fourth of contribution to growth came from agriculture but its contribution to tax revenue is as low as 1.2 percent whereas the contribution in GDP by manufacturing is 17.9% but its contribution in tax revenue is close to two-third of the total. The reason behind this disparity is the fact that agricultural income is exempt from taxation under the Constitution of Pakistan. This uneven incidence of taxation among major sectors tells the reasons of low tax to GDP ratio. Ideally speaking all efforts to enhance tax-to-GDP ratio should begin from equitable distribution of tax burden among various sectors according to their contribution in the economic activity including agriculture. Extensive informal economy is yet another contributor to low tax to GDP ratio that needs to be addressed. III.1 Federal Board of Revenue (FBR)
The FBR (known as Central Board of Revenue or CBR before 2007) was created on April 01, 1924 through enactment of the Central Board of Revenue Act, 1924. In 1944, a full-fledged Revenue Division was created under the Ministry of Finance. After independence in 1947, this arrangement continued up to 31st August 1960 when on the recommendations of the Administrative Re-organization Committee, CBR was made an attached department of the Ministry of Finance.
In 1974, further changes were made to streamline the organization and its functions. Consequently, the post of Chairman CBR was created with the status of ex-officio Secretary Revenue division and Secretary Finance was relieved of his duties as ex-officio Chairman of the CBR. The organization was re-structured and re-named as FBR through FBR Act 2007, a law passed by the Parliament of Pakistan. III.1.1 Functions
In the existing setup, the Chairman, FBR, being the executive head of the Board as well as Secretary of the Revenue Division1 has the responsibilities of:
• Formulation and administration of taxation policy;
240

• Levy and collection of federal taxes; • Quasi-judicial function of hearing of appeals; • Enter into double-taxation treaties with other countries; • Liaise with all Ministries as well as Chambers of Trade and Industry; and • Provide an up-date on FBR activities to the President and the Prime Minister of Pakistan.
III.1.2 Functions of Various Wings and Members
Prior to July 2009, the main operational activity in the FBR was carried out under a Direct Tax Wing supervised by Member (Direct Taxes) and an Indirect Tax Wing, supervised by Member (Sales tax) and Member (Customs). However, in pursuance of ongoing administrative, structural, and institutional reforms (started in 2001-02 with the assistance of World Bank and other multi lateral donors, and likely to be completed by the end of year 2009), functional wings have been created within the FBR. The functions and wings of Sales Tax and Federal Excise have been merged with Income Tax wing, and a new occupational service cadre, named as Internal Revenue Service (IRS) has been notified on September12, 2009 by the federal government. Consequent upon these changes, various wings in the FBR have been reconstituted and their supervisory Members re-designated as below:
Operational Members Member (Domestic Operations North) Member (Domestic Operations South) Member (Customs Operations)
Functional Members Member (Facilitation & Taxpayers’ Education) Member (Enforcement & Accounting) Member (Taxpayer Audit)
Policy Members Member (Direct Tax Policy) Member (Indirect Tax Policy) Member (Customs Policy)
Support Members Member (Strategic Planning and Research & Statistics) Member (Legal) Member (Human Resource, Finance & Administration)
Operational Members: They are responsible for looking after the field operations in their given domain. Collection of income tax, sales tax and federal excise in the field formation is supervised by Members (Domestic Operations). There are two Members for domestic operations in the North and South with different areas of territorial jurisdiction in the country. They are in-charge of all domestic tax operations in the given territory. They carry out field operations through Director Generals of Large Taxpayers Units (LTUs) and Regional Tax Offices (RTOs). The Director Generals (BPS-21/20) in turn operate through a team of Commissioners (BPS-20) divided on functional basis such as Audit, Enforcement, Legal, Taxpayer’s Facilitation, HR etc. The Commissioners are assisted in the field operations by Additional Commissioners (BPS-19), Deputy Commissioners (BPS-18), Assistant Commissioners (BPS-17), Income Tax Officers (BPS-16) and other functionaries.
Likewise, the Member (Customs Operation) carry out his responsibilities for customs duty operations, and he operates through Chief Collectors (BPS-21) and Collectors (BPS-20), who in turn are assisted by Additional Collectors (BPS-19), Deputy Collectors (BPS-18), Assistant Collectors (BPS-17) and other staff. In the headquarters, all operational members are assisted by Chiefs (BPS-20), Secretaries (BPS-19) and Second Secretaries (BPS-18/17) etc.
Functional Members: They perform function based assignments. Member (Facilitation and Taxpayers’ Education) is entrusted with the job of facilitating the taxpayers, overseeing the implementation of policies formulated for this purpose, and looking after the taxpayers’ education and awareness about all federal taxes.
241

Member (Enforcement & Accounting) is responsible for planning and designing procedures regarding: Tax returns and tax payments Tax return processing and taxpayer accounts Taxpayer registration matters Control of unregistered taxpayers Control of non filing Collection of arrears
His line of communication to and from field offices is always Members Domestic Operations North and South. He is also responsible to evaluate enforcement activities for all domestic taxes and advise Member Operations North / South accordingly. In addition he also deals with the matters relating to Public Accounts Committee / Departmental Accounts Committee.
Member (Taxpayer Audit) is responsible for planning and designing procedures and evaluating tax audit for all domestic taxes. His main task also includes devising and implementing a National Audit Plan. Preparation of criteria for selection of cases for audit and assuring audit quality are also included in his job description.
Policy Members: Member (Direct tax Policy) is responsible for all policy, rules and regulation matters relating to direct taxes and interpretation of direct tax laws. His line of communication to and from field offices remains through Member Operations North/South. He also deals with all matters relating to direct taxes with International Organizations / agencies.
Member (Indirect Tax policy) is responsible for all policy, rules and regulation matters relating to indirect taxes and interpretation of indirect tax laws. He operates and communicates with field offices through Domestic Operation Members. He also deals with matters relating to indirect taxes with International Organizations / agencies.
Member (Customs Policy) is responsible for all policy, rules and regulation matters relating to customs and interpretation of customs laws. His line of communication to and from field offices is through Member (Customs Operations). He also deals with matters relating to Customs with International Organizations / agencies.
242

Figure 9: Organogram of FBR
Figure-9: Organogram of FBR
Chairman FBR
Members DGs
Operational Members
Functional Members
Policy Members
Support Members
DG(Intelligence & Investigation)
DG(Information Management System)
DG\(Special Initiatives)
DG(Inspection & Audit)
DG(Training)
Domestic Operations North Domestic Operations South Customs Operations
FATE Enforcement & Accounting Taxpayers Audit
Direct Taxes Indirect Taxes Customs
Admin & HRM SPS Legal
Support Members: Member (HR, Finance and Admin) is responsible for human resource management and development as well as budget and assets management of FBR. All financial and general administrative matters relating to the conduct and discipline of the employees of FBR also fall within his domain.
Member (Legal) is entrusted with the job to oversee and pursue the pending legal and adjudication matters before the Federal Tax Ombudsman, the Higher Courts and the Supreme Court of Pakistan. He is also responsible for preparing legal briefs of tax evasion prosecution.
Member (Strategic Planning and Research & Statistics) is responsible for formulation of revenue targets and strategic planning for their achievement. All work relating to fiscal research and statistics in the FBR fall under his job description. He is also Project Director of Tax Administration Reforms Project (TARP) and similar projects to be carried out in future.
Various positions of Director General are also there to perform the allied functions like training, valuation, internal inspection system, Intelligence and investigation. These are the external or attached organs of the FBR. They directly report to the Chairman.
During the process of restructuring of FBR a vision and mission statements were also evolved on the pattern of a modern organization to give its staff a clear direction of their duties and also to set the future path of the newly restructured organization. All the officers of the FBR were practically involved in this exercise. Under a systematic plan the member HRM conducted workshops in all over the country in the field offices and obtained the views and feedback of the field formations for the formulation and construction of the vision, mission and values statements as under.
243

Our Mission
Enhance the Capacity of the Tax System to Collect Due Taxes through Application of Modern Techniques, Providing Taxpayer Assistance and by Creating a Motivated, Satisfied Dedicated and Professional Workforce. Our Values
• Integrity • Professionalism • Teamwork • Courtesy • Fairness • Transparency • Responsiveness
III.2 Evolution of Domestic Taxes into Inland Revenue Service (IRS)
Prior to establishment of reformed tax offices and notification of Internal Revenue Service, two main wings existed with dealing with the implementation of Taxation laws and collection of due taxes in the country at federal level. One of these was Direct Tax Wing headed by a Member Direct Taxes who operated through five Regional Commissioners. Generally there were five to six zones under a Regional Commissioner headed by a commissioner. Then there were Ranges normally four to five in a zone which constituted five to six circles that used to be the actual working unit of the taxation matters at gross root level. The circle was normally headed by and ITO, Assistant Commissioner, or a Deputy Commissioner depending on the type and importance of the circle.
As already stated that the FBR now a days passing through a phase of administrative restructuring. The whole set up of the direct taxes has been changed to functional mode from the previous circle based system. In the new setup there are be twelve Regional Tax Offices. There are three Large Taxpayers Units each at Karachi, Lahore and Islamabad where almost ninety percent of the head offices of the large and medium size corporations are located. For all other taxpayers twelve Regional Tax Offices have been established at Karachi , Hyderabad, Sukker, Quetta, Multan, Faisalabad, Lahore, Gujranwala, Sialkot, Rawalpindi , Abbottabad and Peshawar. The details of new functional division and their assistance by the Tax Facilitation Centers shall be discussed later in this report. However, their organizational structure is given below in Figure 11.
244

Chairman FBR
Operation Members Functional Members Policy Members Support Members
Member (Domestic Operation North) Member (Domestic Operation South)
DG (LTU) DG (RTO)
Commissioner Enforcement
Commissioner Audit
Commissioner Legal
Commissioner HRM
Collector Sales Tax/Federal Excise
Add Commissioner
Add Collector
Deputy Commissioner/Assistant Commissioner
Deputy Collector/Assistant Collector
Figure-11: Organization Structure of Inland Revenue Service
III.2.1 Basic Structure and Functions of a Tax Office
As discussed earlier, the basic structure of an income tax office was based on the concept of one unit performing all basic functions being carried out in a tax office. This basic tax office was called circle. It was headed by a circle officer. This system of administration was inherited from the British India immediately after the independence in 1947. Since then only minor changes were brought in this basic structure from time to time and according to the need but the basic concept was never changed. The circle was normally staffed by few inspectors, one office superintendent, two or three upper division clerks, two or three lower division clerks, a notice server, a bailiff, a daftari and few peons. The total number of the staff usually remained between 12 to15. Normally following main functions were performed by a circle officer.
1) Receiving of Returns 2) Assessment of the cases selected for audit 3) Collection of raised assessment and other delinquencies. 4) Monitoring of withholding taxes falling in its jurisdiction 5) Appellate issues 6) Expanding the tax base in its area and general guidance of the taxpayers in its territory 7) Reporting to the higher authorities on performance and other information. 8) Human resource management and administrative matters of the circle.
245

Regarding types of circles, there were normally five types of circles in the department depending on the type of taxpayers it is dealing. The first type was salary circle dealing with the salary cases falling in an income tax zone. There are normally two to three salary circles in a zone. There used to be a specialized circle which normally dealt with certain classes of taxpayers. There were also few special circles dealing with corporate cases. They also dealt with the salary affairs of the directors of these companies. Then finally all cases which do not fell in any of the above category they would constitute a territorial circle. Territorial circles consisted of a specific territory or area. All the persons doing business activity in there area came in their jurisdiction. There were normally four to five thousand taxpayers in the jurisdiction of a tax circle. Circle offices were monitored and supervised by an Inspecting Additional Commissioner.
Additional Commissioners would report to the Commissioner who was in charge of the zone comprising a few ranges. The Commissioner was the head of the zone. He was given a certain target of collection of taxes for a financial year. He normally divided his target to the ranges and also subsequently the range additional commissioners would fix the targets of the circles under their jurisdiction. The commissioner also monitored every legal and administrative aspect of circles and ranges in his zone. He was also financial head of the zone and also hire and fire authority for the non-gazetted staff. Five to six zones are monitored by a Regional Commissioner. There were five Regions in the country. With a manifold expansion in population and business activity it was difficult for an officer to handle such a large number of cases efficiently. He also had no support of information technology and other adequate resources to run the affairs. The system had become redundant in view of changed circumstances with the advent of new technologies and business activities. The change was therefore necessary to maintain the credibility of the tax system and to enhance the efficiency of the department. A comprehensive program of tax reform was therefore launched to change the age old system based on single unit performing all the functions to functional divisions in a Regional Tax Office. The process of transformation from the old system to the new one in underway and it is hoped that by the end of year 2009 the task of transformation from old system to new functional system shall be complete. III.2.3 Large Taxpayers Units
On the recommendation of the task force constituted to analyze the causes of inefficiencies in the present tax system it was decided to shift the basic working pattern of the tax system from unit based to function based. i.e. at field level one person should be responsible for one function. The first step towards this direction was the establishment of Large Tax payers Units at Karachi being the financial and business capital of the nation. The LTUs at Lahore and now at Islamabad have started functioning. It is an integrated tax administration, catering for all taxes, such as income tax, sales tax and federal excise duty operating jointly from one location. This interfacing and integration is likely to substantially reduce irritants to taxpayers, smooth-out the tax administration and will also prove a role model for developing the approaches, attitudes and behavior that would be followed by other organs of the FBR. Integrity, transparency, accountability and understanding of problems from taxpayer’s point of view are the guiding principles of the workforce. The LTU has the mandate of collection, enforcement and audit of income tax (including the corporate and personal taxes withholding etc.), sales tax and central excise duty of around 300 Large Taxpayers in the Karachi region. While some of the selected taxpayers are liable to pay all the three taxes, the others are required to pay any two or only one of them. Notwithstanding the number of taxes paid by a taxpayer, it is being administered as a single entity by the LTU. There is close liaison between various members of FBR and Director General LTU. The new organizational structure of CBR provides that the functions of LTU will be replicated at other field formations.
Functions of LTU The major functions of LTU are to:- • Assist taxpayers through technical advice and taxpayer services; • Conduct professionally competent audit; • Assessment of cases; • Collection of revenue; • sanctioning and monitoring of refunds/arrears;
246

• Defense of cases under litigation, appellate tribunal, superior courts and other Forums. III.2.4 Tax Process
The process of tax starts with the filing of returns on or before due date by all the tax payers liable to file a return under the provisions of the Income Tax Ordinance 2001. After the due date the returns and all allied materials is consolidated and sent for the entry of data to the Central Data Entry Centre located in Islamabad. After data entry the returns are received back in the offices. In the meantime when returns are with the data entry centre the tax offices issue delinquency notices to the non-filers of returns and works out the amounts of penalties for non-filing of returns. After receipt back of the returns an exercise of desk audit is conducted to identify the risk areas since all the returns are accepted under universal self assessment system at the time of its filing. As a result of desk audit returns are classified in categories for the purpose of selecting some of them for detailed audit. A separate criterion is generally announced for selection of cases for audit every year. After completion of audit the taxpayers are served with the demand raised and are asked to pay it within statutory limits failing which entails penalties and additional taxes.
The taxpayer can also avail appellate remedies if he is not satisfied with the assessment raised against him. There are appellate forums starting from commissioner appeals to Supreme Court of Pakistan. III.3 Taxpayer’s Rights and Obligations III.3.1 Rights
To be fair, reasonable and courteous FBR treats the taxpayers fairly and equitably. This includes:- • Handling of their tax affairs professionally and impartially; • Paying respect and extending all possible help and assistance. • Ensuring uniform interpretation and application of law in letter and spirit; • Requiring the taxpayers to pay what is due under the law. • Treating the taxpayers as being honest • The FBR treat the taxpayer and his representative as honest in tax affairs unless proved otherwise. • Be accountable for what the FBR functionaries do. • The functionaries of FBR are obliged to act and behave in a professional manner and within the
legal framework.
The taxpayers can expect the FBR to: • Facilitate and educate them. • Provide information and extend all cooperation to help them to understand and meet their tax
obligations. • Keep the information confidential. • Maintain confidentiality of their tax affairs and any details, documents, or declarations given
during the course of any tax proceedings.
Provide access to information. It includes: • Right to have access to the information or documents about your tax affairs relied upon by the
Federal Board of Revenue; and • Right to have access to explanatory circulars and public rulings given by the Central Board of
Revenue.
Taxpayers can expect from FBR to allow opportunity of being heard. It includes: • Allowing reasonable opportunity of being heard before concluding their tax affairs; • True appreciation of facts and circumstances relevant to your case; and • Allowing sufficient / reasonable compliance time to respond to queries concerning their tax affairs. • Accept their right of representation
247

Taxpayers can expect FBR to: • Accept your right of appeal, review and alternate dispute resolution
FBR accepts the taxpayer’s right to object: • On disagreements over facts, figures or interpretation of law; or • For any mistake, error or mal-administration that occurred during the conduct of their tax affairs.
The taxpayers can expect FBR to: • Minimize their compliance cost
This is ensured by: • Good governance with a view to facilitate, educate and help the compliant taxpayers in resolving
their tax affairs; • Charging the taxes strictly in accordance with law; • Simplifying the tax laws and processes and introducing the concepts of self- assessment in its true
spirit; • Conducting meetings with them or their representative at agreed time; • Finalizing proceedings in minimum possible time; • Introducing taxpayers friendly, simple and easy to fill tax forms; and • Providing facilitation and tax education tools (literature, brochures, leaflets, software, website,
workshops, seminars, help line etc). III.3.2 Obligations
The FBR as tax administration organ of the government on the other hand expect from the taxpayers to discharge their tax obligations correctly and faithfully. The FBR expects from the taxpayers to voluntarily;
• Register themselves; • Comply with tax laws; • File correct, complete and candid returns and statements within the prescribed time; • Pay due taxes; • Maintain accounts, documents and records of their transactions; • Be truthful and honest in their dealings with tax authorities; and • Provide complete and accurate information and records, if required, as per law.
III.4 Appeals and Redressal of Grievances
A taxpayer aggrieved with the assessment made by the department can choose to prefer for appeal against the treatment by having resort to various options available to him.
1. He can apply to the commissioner to review the order of the subordinate authority. In this case, the Commissioner of Income tax may review the order. In this case, the appellant must waive his further right of appeal to the Commissioner (Appeals).
2. The taxpayer can file an appeal before Commissioner of Appeals to redress his grievance. 3. If the taxpayer is still unsatisfied with the order passed by the appellant authority, he can choose to
appeal against the order of Commissioner Appeals in Income Tax Appellate Tribunal. This appellate authority is independent from the income tax department and is under the Ministry of Law and justice. This is the highest appellate authority to probe the factual matters involved in the issue before it.
4. If the appellant is still aggrieved with the decision of Income Tax Appellate Tribunal, with enough legal ground he can further make a reference to the High and finally if high court feels that the issues still requires to be thrashed out by the Supreme Court It may refer the matter to the Supreme Court of Pakistan. The verdict of the Supreme is final.
248

5. The taxpayer can also prefer to consult the newly created forum of Alternate Dispute Resolution at the same time even his case is pending before some higher court. This mechanism is governed by the provisions of section 134 of the Income Tax Ordinance 2001. Separate Committees have been created for all major areas of the country. A significant aspect of these committees is that representatives of business community are also members of these committees. This not only enhances the trust of the taxpayers on the sanctity of the committee but also makes them convinced to believe in the transparency of the whole process.
6. A few years back, in order to improve the business friendly environment and to create a judicious approach in the tax collector’s behaviors, government has also created an office of Federal Tax Ombudsman. This office has been very effective and successful since its inception in containing the unbridled use of authority by the tax functionaries. It has also been able to create a better atmosphere for respect of the law both among the taxpayers and tax collectors. A retired judge of court or a renowned person is appointed as Tax Ombudsman for tenure of four years. This institution by resorting to the principles of equity, justice, impartiality and speedy trials has gained confidence of the taxpayers. Any taxpayer aggrieved of any maltreatment or maladministration by any tax functionary can seek remedy from this office.
There is no fee for seeking remedy before this forum, and it has become the cheapest and most reliable source for the taxpayers in the cases of maladministration. As a matter of perception in the very start of its establishment, this institution was conceived to have a tilt towards the taxpayers and seemed to treat the tax collectors more harshly. It also gave some decisions against which the affected tax functionaries even preferred appeals before the office of the President of Pakistan who is the appellate authority against his decisions but with the passage of time it has attained more balanced approach and is considered to be more impartial, and in significant number of cases it has given its verdicts in the favor of the department as well. Further, with the continuous process of appeals against its decisions, it has been helpful in distinguishing maladministration from purely legal issues.
249
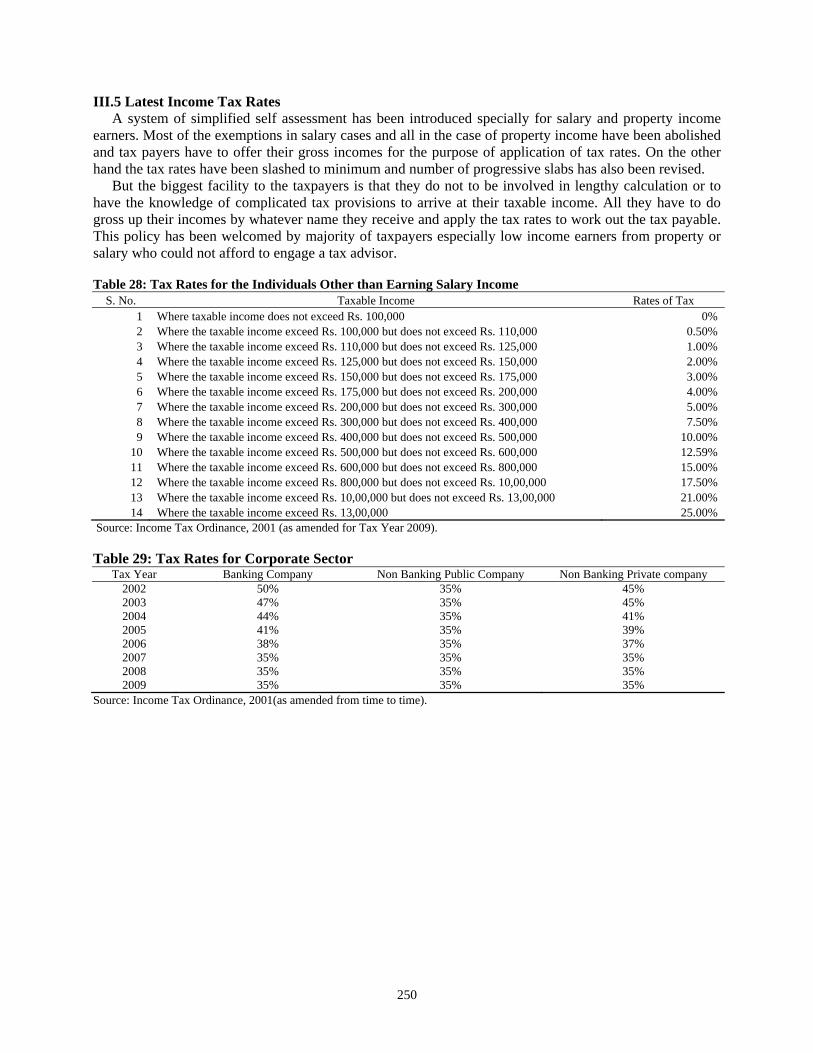
III.5 Latest Income Tax Rates A system of simplified self assessment has been introduced specially for salary and property income
earners. Most of the exemptions in salary cases and all in the case of property income have been abolished and tax payers have to offer their gross incomes for the purpose of application of tax rates. On the other hand the tax rates have been slashed to minimum and number of progressive slabs has also been revised.
But the biggest facility to the taxpayers is that they do not to be involved in lengthy calculation or to have the knowledge of complicated tax provisions to arrive at their taxable income. All they have to do gross up their incomes by whatever name they receive and apply the tax rates to work out the tax payable. This policy has been welcomed by majority of taxpayers especially low income earners from property or salary who could not afford to engage a tax advisor. Table 28: Tax Rates for the Individuals Other than Earning Salary Income
S. No. Taxable Income Rates of Tax 1 Where taxable income does not exceed Rs. 100,000 0%2 Where the taxable income exceed Rs. 100,000 but does not exceed Rs. 110,000 0.50%3 Where the taxable income exceed Rs. 110,000 but does not exceed Rs. 125,000 1.00%4 Where the taxable income exceed Rs. 125,000 but does not exceed Rs. 150,000 2.00%5 Where the taxable income exceed Rs. 150,000 but does not exceed Rs. 175,000 3.00%6 Where the taxable income exceed Rs. 175,000 but does not exceed Rs. 200,000 4.00%7 Where the taxable income exceed Rs. 200,000 but does not exceed Rs. 300,000 5.00%8 Where the taxable income exceed Rs. 300,000 but does not exceed Rs. 400,000 7.50%9 Where the taxable income exceed Rs. 400,000 but does not exceed Rs. 500,000 10.00%
10 Where the taxable income exceed Rs. 500,000 but does not exceed Rs. 600,000 12.59%11 Where the taxable income exceed Rs. 600,000 but does not exceed Rs. 800,000 15.00%12 Where the taxable income exceed Rs. 800,000 but does not exceed Rs. 10,00,000 17.50%13 Where the taxable income exceed Rs. 10,00,000 but does not exceed Rs. 13,00,000 21.00%14 Where the taxable income exceed Rs. 13,00,000 25.00%
Source: Income Tax Ordinance, 2001 (as amended for Tax Year 2009). Table 29: Tax Rates for Corporate Sector
Tax Year Banking Company Non Banking Public Company Non Banking Private company 2002 50% 35% 45% 2003 47% 35% 45% 2004 44% 35% 41% 2005 41% 35% 39% 2006 38% 35% 37% 2007 35% 35% 35% 2008 35% 35% 35% 2009 35% 35% 35%
Source: Income Tax Ordinance, 2001(as amended from time to time).
250

Table 30: Tax Rates for Salaried Persons S. No. Taxable Income Tax Rate
1 Where the income does not exceed Rs. 180000 0%2 Where the taxable income exceed Rs. 180000 but does not exceed Rs. 250000 0.50%3 Where the taxable income exceed Rs. 250000 but does not exceed Rs. 350000 0.75%4 Where the taxable income exceed Rs. 350000 but does not exceed Rs. 400000 1.50%5 Where the taxable income exceed Rs. 400000 but does not exceed Rs. 50000 2.50%6 Where the taxable income exceed Rs. 450000 but does not exceed Rs. 550000 3.50%7 Where the taxable income exceed Rs. 550000 but does not exceed Rs. 650000 4.50%8 Where the taxable income exceed Rs. 650000 but does not exceed Rs. 750000 6%9 Where the taxable income exceed Rs. 750000 but does not exceed Rs. 900000 7.50%
10 Where the taxable income exceed Rs. 900000 but does not exceed Rs. 1050000 9%11 Where the taxable income exceed Rs. 1050000 but does not exceed Rs. 1200000 10%12 Where the taxable income exceed Rs. 1200000 but does not exceed Rs. 1450000 11%13 Where the taxable income exceed Rs. 1450000 but does not exceed Rs. 1700000 12.50%14 Where the taxable income exceed Rs. 1700000 but does not exceed Rs. 1950000 14%15 Where the taxable income exceed Rs. 1950000 but does not exceed Rs. 2250000 15%16 Where the taxable income exceed Rs. 2250000 but does not exceed Rs. 2850000 16%17 Where the taxable income exceed Rs. 2850000 but does not exceed Rs. 3550000 17.50%18 Where the taxable income exceed Rs. 3550000 but does not exceed Rs. 4550000 18.50%19 Where the taxable income exceed Rs. 4550000 but does not exceed Rs. 8650000 19%20 Where the income does not exceed Rs. 8650000 20%
Source: Income Tax Ordinance, 2001 (as amended till Tax Year 2009) III.6 Withholding Taxes
Like other countries in the world, tax at source or withholding tax has also been used as convenient and popular mean to collect tax in advance and at source. It becomes a source of irritation for the taxpayers, when it is treated as full and final discharge of their tax liabilities as the option of adjustment of their tax withheld at source is not provided under the law to certain classes of taxpayers. Some major sectors of the economy at present are covered under presumptive tax regime (or final tax regime).
Under final tax regime, receipts / turnover of taxpayers are treated as their income in accordance with the deeming provisions of tax code. More than half of income tax revenue is collected through withholding activity. Corporations, the federal and provincial governments, local authorities, foreign companies and missions and the employers paying taxable salary are treated as withholding agents under the law. They are obliged to withhold tax from certain payments and deposit it in the government treasury within seven days of tax deduction.
251

Table 31: A Summary of Withholding Rates and Relevant Transactions From whom Rate On
Importers of goods 2% Value of goods as determined under section 25 of the Customs Act, 1969.
Employee Annual average rate (to be calculated as per rate card subject to applicable reductions in tax)
Salary chargeable to tax
Shareholder In case of: Public Company 5%, Insurance Company 5%, Any other resident company 5%, Others 10%
Gross amount of divided
Recipient of yield or profit (profit on debt)
10% Yield or profit (profit on debt) on an account, deposit or a certificate under the National Savings Scheme or Post Office Savings
Recipient of profit on debt on an account or deposit
10% Profit on debt on an account or deposit
Recipient of profit on any security (profit on debt)
10% Profit on debt on any securing
Recipient of Profit on debt
10% Profit on debt on any bond, certificate, debenture, security or instrument of any kind
Non-Resident Person 15% or lower rate as per agreement for avoidance of double taxation
Gross amount of royalty or fee for technical services
Non-Resident Person 6% or lower rate as per agreement for avoidance of double taxation
Gross amount of payment on execution of contract
Resident Person Permanent Establishment in Pakistan of a Non-Resident
Sale of: Rice, cottonseed or edible oils 1.5% Any other goods 3.5% Services rendered or provided 6% Execution of contract 6%
-Gross amount of payment on account of: Sale of goods (inclusive of sales tax); -Rendering or providing of services and; -Execution of contract, other than a contract for the sale of goods or rendering of services
Exporter of goods foreign indenting commission agents
1% Foreign Exchange Proceeds
Recipient of rent of immoveable property
5-10% Rent of immoveable property (including rent of furniture and fixtures, and amount for services relating to such property)
Recipient of prize bonds
10% - On prize of a prize bond Prize on a prize bond;
Every person making a cash withdrawal exceeding Rs. 25,000 per day
0.3% Amount withdrawn in excess of Rs. 25,000 per day
Recipient of brokerage or commission
10% Brokerage or commission
Members of stock exchange
0.01% Purchase or/and sale value of the shares
Owner of motor vehicle
In the case of goods transport vehicles ranging from Rs. 12,00 to Rs. 36,000 per annum In case of passenger transport vehicles plying for hire ranging from Rs. 25 to Rs. 100 per seat per annum Other private motor cars ranging from Rs. 750 to Rs. 8,000 per annum
Registered laden weight of transport vehicles Registered seating capacity of passenger transport vehicles plying for hire Engine capacity for other private motor cars
Commercial and Industrial consumers of electricity
Ranging from Rs. 60 to Rs. 1,500 of the monthly bill, or 10% the bill if it exceeds Rs.20000
Amount of electricity consumption charges
Telephone subscriber Purchaser or prepaid telephone cards
In the case of landline telephone, 10% of the amount of monthly bill if it exceeds Rs. 1,000 In the case of subscriber of mobile telephone and prepaid telephone cards – 10% of the amount of bill or sales price of pre-paid telephone card
Amount of bill or sale price of a pre-paid card
Owners of CNG stations
4% Monthly consumption of CNG
Purchaser of new motor vehicle
Rs. 7,500 to Rs. 5,000 as per engine capacity On purchase of new motor vehicle
Source: Income Tax Ordinance, 2001 (as amended till Tax Year 2009)
252

III.7 Treaties for Avoidance of Double Taxation As an active member of various world organizations Pakistan has also entered in to full scope bilateral
treaties for avoidance of double taxation with fifty seven countries until today, the latest with Moroco executed in October, 2009. The treaties are also re-negotiated regularly in accordance with change in the nature of relations and to respect various protocols entered into. Being the secretary Revenue Division, the Chairman FBR has been given complete responsibility to negotiate the treaty with the tax authorities of the other states. III.8 Advance Ruling
With a view to remove any confusion and to avoid disputes in respect of determination of the income tax liability of a non-resident person, a procedure of Advance Rulings has been brought on statute by way of incorporating Section 206A into the Income Tax Ordinance, 2001, with effect from 1.7.2003. Through this facility non-residents can obtain, in advance, a binding ruling on the issues that could arise in determining their tax liabilities at a later stage. Therefore, time consuming and expensive legal disputes can be avoided. The Federal Board of Revenue is empowered to determine any question of law or of fact as specified in the application made before it in respect of a transaction which has been undertaken or is proposed to be undertaken by a non-resident in Pakistan on its own or in combination with a resident concern. III.9 Indirect Tax Administration
Within the Federal Board of Revenue, there is another wing called Indirect taxes wing. It consists of the administration of customs duties, sales tax and excise duties. But as mentioned earlier, part of indirect taxes known as sales tax and federal excise duties have since been merged along with income tax into a single group, named Inland Revenue Service from September, 2009. However, previously there had been two line members in the indirect tax wing. The Member Customs as the administrative head of Customs department and Member Sales Tax and Federal Excise were responsible respectively to oversee the work of the sales tax and federal excise departments. These members would report to the chairman FBR for their performance. The activities of levying customs duties are carried out within the four corners of Customs Act, 1969 as amended from time to time, whereas Sales Tax and Federal Excise are administered through Sales Tax Act, 1990 and Federal Excise Act, 2005 respectively. III.9.1 Sales Tax
Sales Tax was introduced for the first time in 1949 at a very limited level and on few items. It remained very insignificant until 1990 when in the wake of revenue needs and to transform the taxation system in line with the modern practices in the world a new Sales Tax law was enacted. The sales tax has gradually become the largest single tax of FBR. Many excisable items were replaced by Sales tax gradually. The mechanism of sales tax is somewhat similar to that of a modern VAT which shall be discussed later in this report.
As stated above A Member Sales Tax & Federal Excise used to be the overall in charge of these two departments. The collectors of sales tax and federal excise would report to him. The collectors headed the collectorates of Sales Tax and Federal Excise. However, after the establishment of LTUs and RTOs, the separate collectorate offices have since been abolished and the collectors work under the Directors General of LTUs and RTOs. The collectors are assisted by a number of Additional Collectors. The job of these Additional Collectors is to supervise and guide the Deputy/Assistant Collectors. The Deputy or Assistant Collector is normally the heads of a division or unit. They have a certain number of staff in their subordination that assists them in the discharge of their duties. The staff members normally consist of one senior auditor, a superintendent, few clerks, bailiff, and few peons. Since the Sales Tax department was reorganized in 1990 therefore a system of functional divisions was adopted from the very start. Presently there are Enforcement, Audit, Refunds, Intelligence and investigation, Registration, Legal, and IT divisions in a Sales Tax office in an LTU or RTO.
Sales Tax system in Pakistan functions under the legal framework of Sales Tax Act, 1990 and Rules made under Sales Tax Act 1991. As per sales tax law, a flat tax rate of 15% is chargeable on all goods and
253

services at import stage and on all goods and services produced or provided in Pakistan except otherwise provided at every stage when the title of the goods and services of the concerned transaction is transferred. The exceptions are basic agricultural products, animals and unpacked or processed animal products, education, books, magazines, newspapers, postal services and passengers and goods transportation services etc. Besides, according to the law, any person engaged in selling of goods and services at retail level and subject to sales tax having yearly sale of more than five million rupees has to register with sales tax department. The sales tax collection system in Pakistan is also based on Self Assessment System. Every taxpayer subject to sales tax has to furnish a monthly return declaring his turnover and showing the difference of input and output tax credits claimed and also declaring other basic information. The returns are processed in elaborate computer software and cases are selected for audit.
Every taxpayer is registered with the Sales Tax Department and allocated a Sales Tax Registration Number which the taxpayer has to quote everywhere and also to print on the cash memos and other books. The taxpayer is also required to maintain prescribed books of accounts which should be updated and ready for inspection in case of audit.
The sales tax has emerged as one of the two main revenue sources of federal tax receipts. Due to its buoyant nature, the reliance on GST has increased manifold over the years. This is evident from the fact that the share of GST has reached above 37% in the total federal tax collection during financial year 2008-09 as against 18.6% in the year 95-96. The sales tax collection of Rs. 472 billion during financial year 08-09 was higher by 22.27% over the corresponding period of previous financial year which was Rs.385.5 billion. During year 2007-08, the performance of Sales tax for domestic sector indicates that around 85% of gross collection has been generated by fifteen major revenue spinners. Among the leading resource generators, the shares of telecom and petroleum products have been around 29%. Similarly, the sales tax collection from communication services was close to 22%. The reason for this performance has been multifaceted. For POL, it was largely due to the price factor. However, the sales tax collection from communication services is the outcome of tremendous growth in the telecom sector services.
The government has recently announced to replace the existing sales tax law with a full flagged VAT law from the next fiscal year to commence in July 2010. III.9.2 Customs
The field offices of customs department are headed by a Member (customs operations) who operates through Chief Collector North and South. They are assisted by Collectorates headed by a Collector and staffed by Additional Collectors and Deputy/Assistant Collectors. Largest establishment of Customs department is in Karachi which is also the main port and largest business center of the country. There are also dry ports in up country in major cities of Hyderabad, Quetta, Multan, Faisalabad, Lahore, Sambarial, and Peshawar which facilitate the export and import activities. Pakistan Customs is the guardian of Pakistan borders against movement of contra band goods and is facilitator of bona fide trade. It provides a major source of revenue to the Government of Pakistan in the form of taxes levied on the goods traded across the borders. It also helps to protect the domestic industry, discourage consumptions of luxury goods and stimulate development in the under -developed areas. Pakistan became the member of WTO in 1995 as one of its founding members and is following the decisions of the organization. The share of revenue from customs has declined manifold since 1990. The collection from customs duty used to account for 45 percent of total collection and 55 percent of indirect taxes in 1990-91. Its share in 2008-09 has been reduced to 13.6 percent and 22.5 percent, respectively. This is the consequence of the tariff reforms implemented by successive governments since 1990-91. The share of customs in total federal revenue in 1990-91 has declined tremendously from 45 percent to 13.6 percent in 2008-09.
Federal Excise as a tax is loosing its importance and gradually being faded out or being replaced by sales tax. It has recently been included in the list of domestic taxes and separated from the customs department to newly created IRS. Its share in total and indirect taxes of Rs.755.5 billion was only Rs.112 billion (14.8%) during the year 2008-09.
254

Figure-13: Organization Structure of Customs
Chairman FBR
Operational Members Functional Members Policy Members Support Members
Member Customs
Chief Collector (North) Chief Collector (South)
CollectorsCollectors
Add CollectorsAdd Collectors
Deputy/AssistantCollectors
Deputy/AssistantCollectors
Table 32: Composition of Federal Taxes Financial Year Direct Taxes Indirect Taxes
2000-01 31.80% 68.20% 2001-02 35.30% 64.70% 2002-03 33% 67% 2003-04 31.70% 68.30% 2004-05 33.20% 66.80% 2005-06 34.10% 65.90% 2006-07 39.40% 60.60% 2007-08 39.60% 60.40% 2008-09(P) 39.60% 60.40%
Source: Federal Board of Revenue, Pakistan III.10 Recent Reforms and Their Impact
The tax administration reforms focus on management and institutional development; improving revenue operations; strengthening revenue services; tax compliance culture; adopting responsive IT system; infrastructure up-gradation and development, and program management. The tax administration reform strategy is concentrated on policy reforms, administrative reforms and Organizational reforms. The policy reforms cover simplification of laws, introduction of universal self-assessment, elimination of exemptions, reducing dependence on withholding taxes, and effective dispute resolution mechanism. The administrative reforms aim at transforming income tax organization on functional lines, re-engineering of manual processes of all taxes with the aim to reduce face to face contact between taxpayers and tax collectors, increasing effectiveness of FBR, and improving skills and integrity of the workforce. The organizational reforms include re-organization of FBR headquarter on functional lines, reduction in number of tiers, reduction in workforce from existing level with enhanced financial packages. Simultaneously, the Government has constituted a Cabinet Committee for Federal Revenue (CCFR) to provide functional autonomy to FBR. FBR has already re-structured it’s headquarter operations.
In the tax administration reform program, substantial investment is being made in infrastructure development, end-to end automation of business processes, and human resource development. Tax administration reforms in the FBR include among others, comprise promulgation of new income tax law,
255

universal self-assessment system for income tax, intensification of GST management, streamlining of refund system of sales tax, introduction of the DTRE Scheme, and establishment of Large Taxpayers Units (LTUs) and Regional Tax Offices (RTOs) in the country. Another development that has reduced considerable hassle of the taxpayers is the speedy clearance of goods at Karachi port under the CARE Project. This project has introduced computerized Processing of Customs documents (PACCS) under which the "Goods Declarations" can be filed by an importer "on line" without physical interaction with customs officials. The processing has reduced the clearance time of goods to few hours from more than ten days.
This step reduced the up-front the cost of doing business considerably. This new system has revolutionized the working of Pakistan customs, which is now at par with the modern set ups.
In the year 2005, the government launched Tax Administration Reform Project (TARP) at a cost of $149 million with the assistance of World Bank. This program is for five years and aimed at further boosting the ongoing reforms initiatives. Main feature of the TARP is developing an overall human resource management strategy; promote tax compliance culture, develop a communication program, computerization and appropriate registration system. Thus, the future set up envisages a clear segregation in the operations of domestic and international taxes. The recent notification for establishment of Internal Revenue Service is also one of the significant steps towards this target. Whereas all domestic taxes will operate through Regional Tax Offices (RTOs), the international trade taxes will be handled within a One Window Customs setup. The creation of RTOs have not only led to co-location of the offices of Income and Sales Taxes (including excise duties), but more so, the strengthening of computerization and networking. The later will thus ensure that sharing of information takes place instantaneously. At the same time, the One-Customs will ensure equal treatment of taxpayers at each entry point, i.e., at sea and dry ports and at airfreight units.
Impacts of Reforms
Wide-ranging tax and tariff reforms, as well as reforms in tax administration, have been beneficial. During the five years from 2003-04 to 2008-09, tax collection by the FBR increased by over 140%. The revenue deficit (the difference between total revenue and total current expenditure), a measure of government dis-saving, was at a deficit of 0.7% of GDP in 2004-05 compared to a deficit of 2.2% in 2000-01. It has further progressed towards almost elimination at 0.03 percent of GDP in 2005-06. Pakistan has attained revenue surplus first time since 1984-85 in 2003-04 when it recorded 0.8 percent of GDP surplus. In the past few years revenue deficit did exist as a result of global economic recession, expenditure on war against terror, and some unavoidable increase in committed expenditure heads.
Pakistan economy badly need adequate primary surplus at this critical juncture of fiscal stabilization. The positive aspect of reforms is the structural transformation in the structure of taxes which has undergone considerable changes since the 1990s. Firstly, the share of direct taxes in total taxes (collected by the FBR) has increased from 18 percent to 39.6 percent in 2008-09. The share of indirect taxes declined from 82 percent to 60.4 percent during the same period. Even within the indirect taxes, dramatic changes have taken place. The collection from custom duty used to account for 45 percent of total tax collection and 55 percent of indirect taxes in 1990-91, its share in 2008-09 has been reduced to 13.6 percent and 22.5 percent, respectively. This is the consequence of the tariff reform implemented by successive governments since 1990-91. The share of sales tax increased at a tremendous pace from 14.4 percent to above 37 percent of total taxes and from 17.6 percent to 62.4 percent of indirect taxes during the same period. Federal excise as a tax is loosing its importance and gradually being faded out. Its shares in total taxes and indirect taxes were 22.5 percent and 27.5 percent, respectively in 1990-91. These have now been reduced to 8.9 percent and 14.8 percent, respectively during the period 2008-09. The basic philosophy of tax and tariff reforms has been to move away from investment and production-based taxes (indirect taxes) to income (direct taxes) and consumption (sales tax)-based taxes. Pakistan has succeeded in changing the composition of its taxes, but much more efforts will be required to enhance the share of direct taxes in the total taxes which is 37.6% now in 2008-09 when compared with 18% in 1990.
256

IV. Country Specific Fiscal Issues
Like all other developing countries that are in their take-off stage of economic development, Pakistan is also facing some peculiar fiscal problems and issues which are specific to its history, location, geography and socio-ethnic situation. Although the list can be stretched to many issues directly or indirectly related to the sphere of fiscal activity of the government, but only major and directly related issues to the fiscal policy are discussed in the following. Debt Servicing
As also discussed in the preceding paras, Pakistan is trapped in the vicious circle of huge debts having both foreign and local origin. An amount of 206 billion rupees were set apart for debt servicing/repayments out of total public outlay of 2010 billion rupees which comes to 10.2% of total expenditure in the budget for financial year 2008-09. In 1980-81, almost 12 percent of total revenues were consumed for debt servicing, and by 1989-90, this increased to almost 39 percent. By end of 1990’s (in 1999-2000), almost 69 percent of total revenues were being consumed by one budgetary item, namely, debt servicing, leaving only 31 percent to be spent on development programs, the social sector, civil administration, defense etc. Quite naturally, it was highly inadequate to finance these budgetary items. The high and growing public debt burden has always been the major source of the sharp slowdown in Pakistan’s economic growth, to less than 4 percent per annum in the 1990s and the consequent increase in poverty incidence by 1999-2000. However, due to prudent economic management of debts by paying off costly loans on priority and rescheduling of loans by Paris Club and other international organizations, during the last nine years, the debt servicing liabilities have declined sharply from 65.4 percent of revenue in 1999-2000 to 16.48 percent of revenue and from 53.5 percent to 13.8 percent of current expenditure in 2008-09. The subsequent fiscal space created by bridging the revenue-expenditure gap and low debt servicing cost has enabled the government to increase public sector development expenditures from Rs. 89.8 billion or 2.2% of GDP in 2000-01 to Rs. 550 billion or above 4% of GDP in 2008-09. Defense Expenditure
Pakistan’s expenditure on defense and related areas has always been very high and disproportionate to its size of economy, area, population and resources. Defense related budget expenditure was allocated at Rs. 296 billion (almost 20 % of current expenditure) for the year 2008-09. There are many contributing factors to this situation. The very first and most important factor is its relations with gigantic neighbor India on its east from the very independence of the country from the British rule in 1947. Due to dispute over Kashmir and others areas like Siachin and Sir Creak, the country has been even pushed into war three times by the eastern neighbor. In the wake of this history to incur disproportionately high defense expenditure is an unwanted necessity for a developing country like Pakistan. The result is the slow pace of overall social and economic development. The funds otherwise to be spent on building of infrastructure required for the accelerated growth of society are being diverted to this unproductive area. This situation can be rectified only through a political process and is a separate subject. Likewise, the long mountainous, porous and troubled western boarder with Afghanistan and military operations against Taliban within the tribal areas of the country has also added to the security and defense concerns of the country in wake of the war on terror in the recent past. More Conducive Environment for Investment
As every other developing country in the world Pakistan also aspires for inflow of foreign investment which not only supports the growth of and momentum of economic activities but also helps creation of employment opportunities and skills for the locals. The inflow of investment also improves the position of foreign exchange of a country. Pakistan is a large country with abundant human and natural resources but lacking financial resources. Pakistan is striving hard for creating conducive environment for foreign investors. Pakistan has also introduced many laws guaranteeing security of investments and other rights. Doing business is now very easy in Pakistan. Free mobility of foreign exchange and profits, hundred
257

percent equity owned by foreign investors , creation of Board of Investment are few other important instances which shows the level of seriousness of the government of Pakistan for attracting foreign investment. Nevertheless, the government has still a lot do in many areas for creation of an environment such as ‘curtailing the number of days required to start a business’, installation of business friendly infrastructure, and improving prevailing law in order situation to create an investment friendly environment. Likewise, the control of ‘terror threat perceptions’ from the Taliban within the country, and also to overcome the ‘terror spillover’ from the extremist elements of Al Qaeda, and related groups from Afghanistan through its western boarders also remains as one of the key areas to encourage more foreign investors in a more peaceful and tolerant society. This is also one of the important issues facing country. Reform of the Federal Board of Revenue and Improving Tax to GDP Ratio
As discussed in the preceding topics, the tax system always plays the role of a backbone in the economy of a country. With the changing dynamics of world politics, self-reliance is the only way out for developing economies. The taxes are the main source of a country’s income and an apparatus for resource mobilization. Federal Board of Revenue also requires comprehensive restructuring and administrative overhaul to raise the almost stagnant tax to GDP ratio since late nineties. The World Bank, in its Tax Policy Report on Pakistan, prepared by the Andrew Young School of Public Policy, Georgia State University and FBR, released on September 4, 2009, has estimated amount of tax evasion of Rs. 796 billion in the year 2007-08. As discussed, the government of Pakistan is working on program named TARP (Tax Administration Reforms Project) with the assistance of the World Bank and multilateral donors. This project is scheduled to be completed by the end of year 2009. It is hoped that Pakistan will be able to improve its tax to GDP ratio from long stagnant around ten percent to fifteen percent by the year 2015 as planned. Privatization of State Owned Enterprises
Privatization of state owned enterprises is another area where there are challenges and issues both in front of the government of Pakistan. The government in 1973 under the influence of socialist economic philosophy managed to nationalize many large industrial units, banks and other corporations. In early nineties again, with the change in the direction of wind worldwide, the emergence of Uni-polar World and dominance of capitalist philosophy, the government started to privatize the earlier state owned enterprises and corporations. For this purpose, a separate ministry (Ministry of Privatization) headed by a federal minister was created. The guiding principle was to give priority to those units which were sick and demanded immediate rehabilitation.
Unfortunately, this has not been strictly adhered to. Many profit making organizations have been privatized motivated by political affinities and benefits. The element of transparency has also been ignored in many of the cases. Gradually, this issue was taken cognizance of as a whole and followed severe criticism by masses in general and media in particular, and in some cases, on suo moto interference by the higher courts, the government had to follow the rules of transparency of the process. For instance, the verdict of the Supreme Court of Pakistan on the issue of privatization of Pakistan Steel Mills (the country’s biggest steel enterprise owned by state) underlines lack of elements of transparency in the bidding and under valuation of the enterprise on the part of the government. Likewise, the spending of privatization proceeds is yet another issue that often becomes the headline of the newspapers. Trade Gap and Export Diversification
Pakistan’s export base is very narrow both in terms of merchandize exported and the countries where they are sent. At the same time the trade gap despite strenuous efforts on the part of government, is also beyond manageable limits. In this territory, the government needs to encourage the export of value added products instead of semi-finished or raw materials. It also has to diversify in terms of destinations of its exports. This area also needs special attention.
258
V. Conclusion: Where we stand and where we go?
Pakistan is a developing country having better resource base, strategic location thus with promising future but as well as many challenges to face. Pakistan has been suffering from political instabilities right from its creation. All it lacks is a stable and consistent political system otherwise it has all potential to grow at a faster pace and develop itself into a modern state with vibrant economy. After nine eleven incident it has even more challenges to face on many fronts especially the rise of domestic extremism and the ongoing military operations against Taliban in its north western parts. Majority of the population is moderate in approach and desirous to live in peace with the global community.
Modernization of revenue authorities is another crucial area which can be the key to success and determine a concrete path to a developed future. As discussed earlier, the government is committed to reorganize the FBR on modern and automated footings as a dynamic and effective organization.
Another important area is to cultivate friendly ties with our neighboring countries by resolving all contentious issues. This will not only ensure political stability of the region but would also channelize a more useful spending of the funds from defense towards the social sector and would also accelerate the development of infrastructure necessary for rapid growth.
Consistency of economic policies is another area which requires serious attention. This aspect basically ensures the confidence of the investors and thus accelerated growth of the economy. In past every successive regimes introduced their own policies by nullifying the policies and guarantees by their predecessors. This state of affairs shook the confidence of the investors and gave a way to the flight of capital from the country. Since the year 2000 however, consistency has been observed to some extent in the policies of the government. The continuation of policies in the long run and honoring the commitments of predecessors will also allow the country to build a strong economy by boosting the confidence of the domestic investors as well as attracting more FDI.
Maintenance of law and order should be another priority of the government. Since no one in the world would endanger one’s life and capital for reaping even heavy profits in a high demand market. Unfortunately, the government has not been actually successful on this score. The spillover effects of war on terror in Afghanistan and the military operations against local Taliban in the north west of the country are one of the greatest menaces. Even otherwise, the general law and order situation is also not ideal. This situation not only prevents and discourages the foreign investors to bring their capital to Pakistan but also at times forces the local businessmen to establish their enterprise in the neighboring countries like the UAE. The government should not only take concrete steps to ensure safety of lives and properties of the people but also should make sincere endeavor to uproot extremism and terrorism in all forms and manifestations. Instead of imposing foreign borrowed ‘one size fits all’ policy, it should pay more attention to cope the menace on the ‘domestically tailored’ policies, specially designed in the context of the socio-cultural background of the tribal areas – the epicenter of the ongoing war against terror within the country. Likewise, the collateral damages of life and property of innocent population of these areas should be minimized and attempts should be made to bring them to zero. Such damages coupled with displacement of hundreds of thousands innocent migrants in the ‘operation ridden’ areas are igniting hatred towards the state policies and thereby adding more complications to the war on terror. The ultimate sufferings by wrong policy measures would no doubt distress the socio-economic fabric of the entire society.
Contrary to its growth potential and rich human and physical resource, Pakistan is facing a serious crisis of energy. It is consuming its own sources of natural gas and petroleum at a faster pace and is not developing other reliable alternate sources of energy, especially to hydel energy for which Pakistan has a great potential because of having many rivers and naturally available sites for construction of large dams. Unfortunately due to lack of consensus and political harmony among the federating units, Pakistan has not been able to construct any big dam since late sixties. This situation requires immediate attention and long term planning, because cheap energy can be a crucial factor in keeping the Pakistani products competitive in the world market and also to maintain a high and consistent economic growth rate. Pakistan by realizing the gravity of situation has however initiated few steps which includes starting work on some dams, negotiating cheaper gas import from Iran and start of construction work on a gas pipeline to import natural
259

gas from Turkmenistan in central Asia but Pakistan still needs lot more to do to gain reasonably good and sustainable economic growth.
260

261
References Income Tax Ordinance, 2001 of Pakistan (as amended till Tax Year 2009) Board of Investment, Government of Pakistan, www.pakboi.gov.pk Economic Survey of Pakistan 2007-08, Ministry of Finance, available at www.finance.gov.pk Economic Survey of Pakistan 2008-09, Ministry of Finance, available at www.finance.gov.pk FBR Year Book 2007-08, Federal Board of Revenue, Government of Pakistan available at www.fbr.gov.pk Federal Bureau of Statistics, Government of Pakistan, www.fbs.gov.pk Ministry of Finance, Government of Pakistan, www.finance.gov.pk Reform of Tax Administration in Pakistan: Report of the task force on Reform of Tax Administration,
April 14, 2001, available at www.fbr.gov.pk State Bank of Pakistan, www.sbp.gov.pk World Economic Outlook: IMF, April 2009, available at www.imf.org