61 el nino - wordpress.com geofactsheet january 1999number 61 el niño explained - ‘the little...
TRANSCRIPT

1
Geo FactsheetJanuary 1999 Number 61
El Niño Explained - ‘The Little Child with the Big Kick’
What is El NiñoEl Niño was a term originally used to describe the appearance of warmsurface water in the Eastern Equatorial Pacific along the coasts of Peru andEcuador. The name El Niño means ‘Christ Child’ and was first given to the‘warm event’ by the Peruvian fishermen who noted the anomalously highsea surface temperatures (SSTs) about every 2-3 years around Christmas,largely because it had such a bad impact on the size of their anchovy catch.
What scientists now call the ‘El Niño’ effect is reserved for a strongerevent which leads to the development of a warm water cell off the coasts ofPeru and Ecuador, thus disrupting the normal Pacific ocean circulation.The El Niño refers to this oceanic component, and the SouthernOscillation refers to the see-saw in air pressure which occurs at the sametime. The acronym ENSO (El Niño Southern Oscillation) is used todescribe the combined oceanic and atmospheric impacts of the phenomenonwhich leads to an intermittent disruption of the climate system centred onthe equatorial Pacific. Whist the El Niño affects the climate short-term allaround the Pacific Basin, and the effects are now well documented,increasingly the phenomenon is thought to lead to atmospheric interactionsaround the world (known as teleconnections), largely because of distortionto the jet stream patterns.
As well as warm events in the Eastern Pacific, there are cold events wherethe SSTs become anomalously colder compared to the long-term averagefor the region. The name La Niña refers to the appearance of colder thanaverage conditions. The 1997-98 El Niño would seem to be followed by a1998-99 La Niña event according to the latest monitoring records. This hasalso had different disastrous consequences for the same areas hit by the1997-8 El Niño.
The latest El Niño event has been blamed for extreme weather events in 1997 and 1998, especially in the USA, where the popular presshave nick-named the phenomenon ‘El Meano’ or ‘El Meanie’. This Factsheet will explain how the El Niño occurs (scientists are not surewhy it occurs) and assess the true extent of its impact, with particular reference to the latest 1997-98 event which appears to be the worston record in terms of destruction and human suffering.
Recent El Niño years when there were very high sea surface anomaliesincluded 1976-77, 1982-83, 1986-87, 1990-1994 (the longest on record)and the most recent (1997-1998). There is some concern that occurrencesare increasing, therefore people try to link this to the phenomenon ofglobal warming as an indirect effect. This is yet to be confirmed by scientistsalthough recent drilling on the coral reefs off Southern New Guinea wouldsuggest that the frequency of El Niño events has increased over the last 200years.
Every El Niño is different in terms of its duration (average 12-18 months)and magnitude. Magnitude can be measured by looking at variations in theSouthern Oscillation. The Southern Oscillation Index (SOI) has beendeveloped to monitor the Southern Oscillation using the differences betweensea level atmosphere pressures at Darwin, Australia and Tahiti. Plots ofsea surface temperature anomalies can also be made, to measure sea warmingor cooling.
El Niño events can be detected and monitored by many methods. Firstlythere is much better satellite coverage for looking at oceanic patterns.Secondly the design for buoys has improved so that the TropicalAtmosphere Ocean (TAO) buoy can now measure SST, surface winds, airtemperature, humidity and occasionally subsurface currents. The buoyscan be deployed mid ocean as well as in shallow water and can remainactive for a year. They transmit daily (sometimes hourly) into the weatherforecasting system. Further information can be gained by analysing the sealevels on coasts around the Pacific.
Increasingly, biological surveys are being used. During an El Niño eventthe phytoplankton which is so vital to support the whole of the food webdoes not grow, as there is no upwelling of cold nutrient-rich water from thedeep ocean. Consequently sea birds are starved of food for the breedingseason. On islands off the coast of California scientists have been lookingat 3 different species and how an El Niño can affect feeding habits and thesubsequent breeding season.
DefinitionsEl Niño event describes the appearance of warm surface water fromtime to time in the Eastern Equatorial Pacific i.e. a warm event.
La Niña refers to the appearance of colder than average sea surfacetemperatures in the central and East Equatorial Pacific i.e. a coldevent.
The Southern Oscillation is a see-saw of atmospheric pressurebetween the Pacific and Indo-Australia area.
The Southern Oscillation Index has been developed to monitorthe Southern Oscillation.
ENSO (El Niño-Southern Oscillation) is the term used by scientiststo describe the full range of events including the El Niño oceaniccomponent and the Southern Oscillation atmospheric component.
Teleconnections are defined as atmospheric interactions betweenwidely separated regions - in this context 'knock on' effects of ElNiño.
Thermocline is the sharp boundary between the cold deep water andthe warmer upper layer.
How often does El Niño occur and can we predict it?As can be seen from Fig 1. El Niño occurs irregularly, approximately everyfour to seven years.
Fig 1. Known El Niño events
Thickness of line indicates duration
The phenomenon has been recognised for centuriesand occurs every few years
1600
Verystrong
Strong
Absent
1550 1650 1700 1750 1800 1850 1900 1950 2000

2
El Niño Explained - ‘The Little Child with the Big Kick’ Geo Factsheet
Researchers were very successful in predicting the recent 1997-8 El Niñoevent using a combination of statistical forecasts based on:(i) historical records(ii) satellite coverage(iii) computer modelsThe amount of data available, the range of research, and the use ofsophisticated programs to analyse it is growing exponentially.
Exam Hint - Once you have read through the explanation as to howEl Niño works, practice drawing a simple diagram or map to showsome of the effects (Fig 2 or 3).
Fig 2. How scientists think the El Niño works
How and why does El Niño occur?The actual process is summarised by Fig 2.
In a normal year
1. The great NE and SE trade wind belts occur, which blow equatorwardand westward across the width of the tropical Pacific.
2. The winds blow towards the warm water of the Western Pacific.3. Convectional uplift occurs as the water heats the atmosphere.4. The tradewinds push the warm water westwards, whereas along the
East off the coast of Peru, the shallow position of the thermoclineallows winds to pull up water from below.
5. This results in an upwelling of nutrient rich cold water along thePeruvian coast-heading to optimum fishing conditions because ofthe abundance of phyloplankton.
6. Because of the pressure of the trade winds, sea levels in Australasiaare about half a metre higher than Peru with sea temperatures 8oChigher than in Peru.
7. At this point the air sinks creating the Walker loop.
In an El Niño yearthe entire system relaxes
1. The trade winds weaken or even die in the Western Pacific.2. In an extreme El Niño year there is sometimes even a reverse direction
of flow.3. The piled up water in the West, sloshes back east, leading to a 30cm
rise in sea level in Peru carrying the water pool east with it.4. Thus the region of rising air moves east with the associated
convectional uplift. The upper air disturbances distort the path ofthe jetstreams which can lead to teleconnections all around theworld, not just the Pacific.
5. The Eastern Pacific ocean becomes 6-8oC warmer. The El Niño effectoverrides the cold Northbound Humboldtanment, thus breaking thefoodchain. Lack of phytoplankton has a knock-on effect on thefoodchain. An absence of fish affects fish-eating bird colonies on theGalapagos.
6. Conditions are essentially calmer across the whole of the Pacific.
Although scientists are increasingly confident about the effects of El Niño,they are by no means certain as to why it occurs.
There are two main theories at present:
1. The event is initiated by the reflection from the Western boundary of thePacific of an oceanic Rossby wave. This wave acts as a trigger supposedlyby lowering the thermocline in the west central Pacific, thus warming theSST by reducing the efficiency of upwelling to cool the surface water.Winds blow towards the slightly warmer water and start the event.Presumably if you observe these oceanic Rossby waves prior to reflectionyou can predict the onset of an El Niño.
2. The other theory suggests an essentially random occurrence. Tropicalconvection in the rising air tends to occur in bursts and these bursts propagateout of the Indian Ocean (known as the Madden-Julian Oscillation). If thestorms are violent enough or last long enough, eastward blowing stormwinds start the sloshing of the ocean eastwards from Indonesia to Peru.
The idea of the heat from sea floor venting of volcanoes causing the El Niñowas briefly fashionable but there is no evidence for this. The theory arosebecause researchers noted that the eruption of Mount Chichon precededthe 1982-83 El Niño and the Mount Pinatubo eruption preceded the 1991-92 El Niño.
73
2
6
4
15
12
3
4
5
NORMAL YEARSIn non El-Niño years the tradewinds blow from east to westalong the equator
EL-NIÑO YEARSThe trade winds pattern isdisrupted. It may slacken oreven reverse and this has aknock on effect on the oceancurrents
Warm, moist airrises, cools,condensesformingrain clouds
Walker loop =normal air circulation
Rainforests
Australia The airpushes the warmwater westwards
Thermocline
Warm
water
Trade winds
Deserts
Disrupted trade winds
Aircirculation loop reversed
El N
ino
warm water reversal
Disruptedtrade winds
WARM WATERCOLD WATER
WARM WATERCOLD WATER

3
El Niño Explained - ‘The Little Child with the Big Kick’ Geo Factsheet
Fig 3. The Global Impact of El Niño 1997-8
Dryer
Warmer
Dryer & warmer
Dryer & cooler
WetterWarm ocean currents
Cold ocean currents
AFRICA
INDIANOCEAN
ASIA
Reduced Indian/Asianmonsoon circulation
Warmer winterWarmer winter
NORTHAMERICA ATLANTIC
OCEAN
Suppressedtropical stormactivity
SOUTHAMERICA
Amplified jet stream bringswet and stormy winter
Dry & cool
AUSTRALIA
EQUATOR
WetterDec-Feb
Wettersummer
GulfStream
Wet & warm
Heavytropicalrains
Abnormal warmingof ocean waters(El Niño)
Whilst the direct impacts are very clearly seen in the equatorial Pacific,researchers are increasingly discovering teleconnections which wouldsuggest that although its impact is piecemeal, the cumulative effects areglobal. Most of the impacts are seen to be negative; for example the impactsof the latest El Niño event killed approximately 1000 people in SouthAmerica alone, and hundreds of thousands of livestock. Equally, it caused$20 billion damage. Many of those countries that were badly hit wereLEDC’s lacking the capital to purchase technology to cope with theaftermath of the disasters.
There are some positive impacts too - for example the Caribbean wasalmost free from hurricanes in 1997 and the North Chilean tourist industryflourished as tourists flocked to see the ‘desert in bloom’. The majorproblem however with El Niño is its ability to overturn established climatepatterns in a very unpredictable way (Fig 3). The desiccation of Indonesiaand East Australia led to forest fires in Indonesia and bush fires in Australia,whereas the arrival of torrential rains in Western Peru led to enormous flashfloods in Ica, accompanied by landslips and the cholera epidemic whichfollowed because of contaminated water supplies.
1
23
1 2 3Locations of eye witness accounts (page 5) Peru Papua New Guinea Kenya
Exam Hint - If you find it difficult to draw a block diagram such as Fig2, practice drawing a simple map. You should be able to draw a mapor diagram to explain both the causes and effects of El Niño.
The impact of El NiñoThe impact of El Niño is summarised in Fig 3.
If you relate Fig 3 to Table 1 overleaf you can see the very widespreadimpacts of the El Niño event especially around the Pacific Ocean.
The table also shows impacts of the principal teleconnections betweenthe tropical pacific and the Northern Hemisphere circulation which iscalled the Pacific North America pattern or PNA. The downstream jetwave appears as a result of higher than normal pressures over WesternCanada and lower than normal pressures in south east USA.
In El Niño periods, the jet approaching North America is strengthened.The increased warmth in the Eastern Pacific leads to increased tropicalconvection and the moisture pumped in to the atmosphere is carried NorthEast by sub tropical jet streams, thus contributing to heavier rainfall acrossSouthern USA (but not necessarily to the small scale systems of the Floridatornadoes).
Other important teleconnections include the droughts of Brazil and Africawhich often occur during El Niños. When the warm pool and the Walkerloop moves east during an El Niño, the sinking motion is correspondinglydisplaced, producing drought in the equatorial Atlantic region. It is theeastward displacement of the Walker loop, see Fig 2, which possibly leadsto stronger upper atmosphere winds which sheer off the tops of developingtropical storms preventing them from becoming hurricanes in the Caribbean.
PACIFICOCEAN

4
El Niño Explained - ‘The Little Child with the Big Kick’ Geo Factsheet
LOCATION
Australia
Indonesia
Papua NewGuinea
Hawaii
FrenchPolynesia
ChristmasIsland
India/China/Japan
North America(T)
Caribbean (T)
Columbia
Brazil (T)
Andean States
Galapagos
Paraguay &Argentina
South Africa(T)
El NIÑO CLIMATE CHANGE
Extremely unpredictable conditions.Eastern coast droughts but some rainfallfor harvest in NSW. Victoria warmer.
Severe droughts. Rainfall deficits up to500mm.
Worst drought for 50 years.
Increased hurricanes.
Unusual number of South Pacifichurricanes possibly related to heavyconvectional storms and warm oceans.
From dry hot conditions to moistmonsoon conditions k75mm rainfall perday. Humid.
Reduced Indian/Asian monsoon. Dryerand cooler.
California wetter than normal. Wet coolwinters in south. Wetter in RockyMountains. Dryer and warmer inNewfoundland and Alaska.
Absence of hurricanes.Areas drier than usual.
Drought conditions.
Very dry especially in NE. Regular rainfallelsewhere.
Warmer than usual. Unpredictablethunderstorms. Heavy rainfall in Ecuadorand Peru.
Drought in high Andes.
6°C warmer seas. Increased rainfall.
Much wetter than usual.
Drought in Transvaal in early 1998.
ENVIRONMENTAL IMPACTS
Major bushfires around Sydney.Plague of flies.
Huge rainforest fires. Destruction ofOrang-utan population. Problems ofsmoke throughout SE Asia.
Flashfires.
Some destruction.
Rare corals killed by sedimentation andbleached white. Migration of birdpopulation.
Generally quiet monsoon season. Limitedimpact. Major flood events in 1998possibly associated with La Niña.
Badly eroded Californian coast. Stormsand high tides.
Widespread early snow.
Dried up forests in Guyana, Trinidad.Forest fires in Cuba. Low level in canaldrought - restrictions on Canal (Panama).Loss of water for H.E.P. Dustbowl inCentral Panama.
Low levels in all rivers.
Extreme drought conditions in NE.Amazonian fires of huge proportions.
Flooding events. Sechura desert convertedinto a lake. Floods in Ica, Peru and Chile.
Low snowfall - loss of water for crops andlivestock in high Alteplano.
Drives away fish. Impact on breeding birdse.g. Blue Footed Booby. Loss of seaweedfor iguanas. Extensive bleaching of corals.
Widespread floods in Parana Paraguaysystem.
SOCIO ECONOMIC IMPACTS
Problems of water supply. Falling groundwater levels impact on Queensland cattleindustry. Poor quality wheat harvest. Bestever tourist season along Victorian coast.
Disruption of air travel in SE Asia. Healthrisks to Sarawak people. Disruption ofbusiness and tourism industry e.g. in Bruneiand Sabah.
Low water levels in Fly River disruptedcopper exports. Major famine.
Collapse of scuba tourism. Flooded roads.Collapse of fishing industry.
No major problems in 1997.
No major harvest problem.Difficult opening for New Denver airport.Long ski season.Increased heavy winter oil demand.Booming tourist industry in 1997. CitrusGlut in Florida.
Raised salt levels from irrigation systems(e.g. coastal Guyana), salinised crops. Lossof toll revenue in canal. Famine inGuatemala. Power cuts in central America.(70% power from HEP) 30% Salvadorcoffee lost.
Disruption of river transport on RiverMagdalena.
Bumper season for NE tourism.Good crops in SE Brazil (Sao Paulo).
Huge damage to roads and bridges in Peru.Disaster at Ica floods and landslides buried20 people. Superb 1997 Chilean ski season.Filled reservoirs solved irrigation and HEPproblems in 1997 (reverse in 1998).Disruption of communications networks.Destruction of Perusian fishing industry.Closure of fishmeal plants.
Knock-on effects on tourism.
Disruption of ranching economy. $3billion costs of floods. Loss of rice, soya,tobacco (50%) crops. Storm damage ofvines in Mendoza.
Possible impact on maize crop - sky highprices.
T Teleconnections
Table 1. A summary of the impacts of El Niño around the Pacific Region.
5
El Niño Explained - ‘The Little Child with the Big Kick’ Geo Factsheet
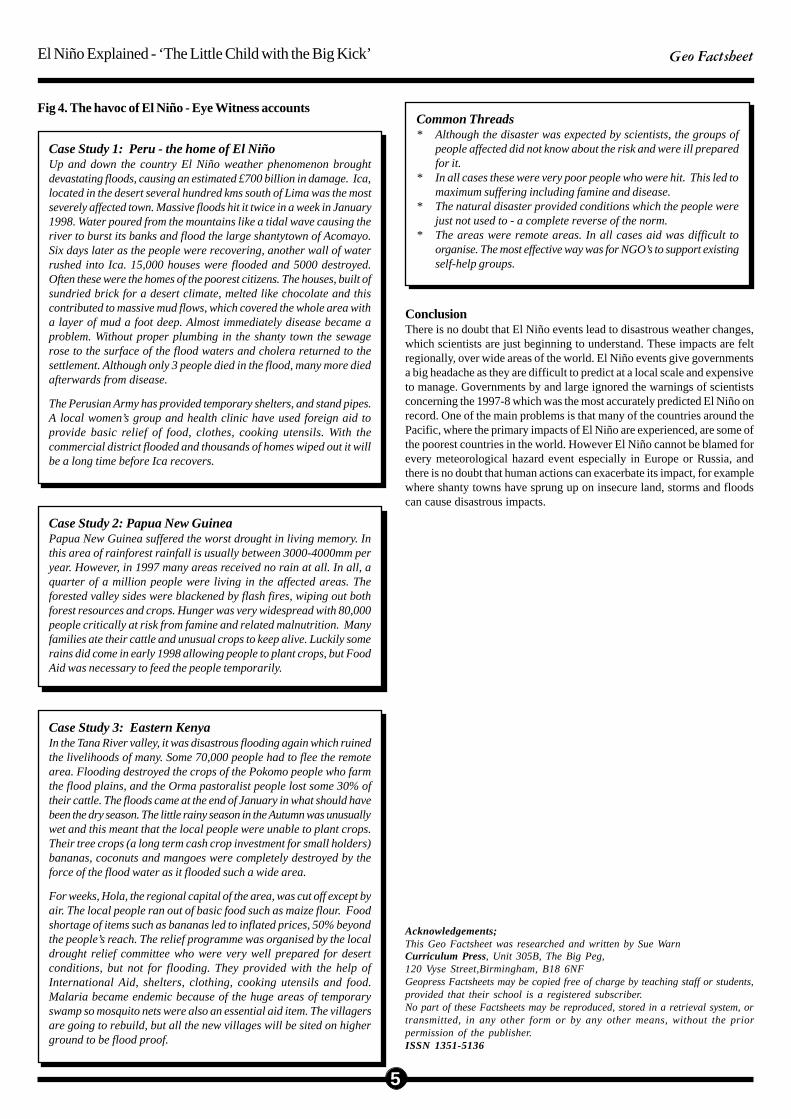
Common Threads* Although the disaster was expected by scientists, the groups of
people affected did not know about the risk and were ill preparedfor it.
* In all cases these were very poor people who were hit. This led tomaximum suffering including famine and disease.
* The natural disaster provided conditions which the people werejust not used to - a complete reverse of the norm.
* The areas were remote areas. In all cases aid was difficult toorganise. The most effective way was for NGO’s to support existingself-help groups.
Case Study 2: Papua New GuineaPapua New Guinea suffered the worst drought in living memory. Inthis area of rainforest rainfall is usually between 3000-4000mm peryear. However, in 1997 many areas received no rain at all. In all, aquarter of a million people were living in the affected areas. Theforested valley sides were blackened by flash fires, wiping out bothforest resources and crops. Hunger was very widespread with 80,000people critically at risk from famine and related malnutrition. Manyfamilies ate their cattle and unusual crops to keep alive. Luckily somerains did come in early 1998 allowing people to plant crops, but FoodAid was necessary to feed the people temporarily.
ConclusionThere is no doubt that El Niño events lead to disastrous weather changes,which scientists are just beginning to understand. These impacts are feltregionally, over wide areas of the world. El Niño events give governmentsa big headache as they are difficult to predict at a local scale and expensiveto manage. Governments by and large ignored the warnings of scientistsconcerning the 1997-8 which was the most accurately predicted El Niño onrecord. One of the main problems is that many of the countries around thePacific, where the primary impacts of El Niño are experienced, are some ofthe poorest countries in the world. However El Niño cannot be blamed forevery meteorological hazard event especially in Europe or Russia, andthere is no doubt that human actions can exacerbate its impact, for examplewhere shanty towns have sprung up on insecure land, storms and floodscan cause disastrous impacts.
Case Study 1: Peru - the home of El NiñoUp and down the country El Niño weather phenomenon broughtdevastating floods, causing an estimated £700 billion in damage. Ica,located in the desert several hundred kms south of Lima was the mostseverely affected town. Massive floods hit it twice in a week in January1998. Water poured from the mountains like a tidal wave causing theriver to burst its banks and flood the large shantytown of Acomayo.Six days later as the people were recovering, another wall of waterrushed into Ica. 15,000 houses were flooded and 5000 destroyed.Often these were the homes of the poorest citizens. The houses, built ofsundried brick for a desert climate, melted like chocolate and thiscontributed to massive mud flows, which covered the whole area witha layer of mud a foot deep. Almost immediately disease became aproblem. Without proper plumbing in the shanty town the sewagerose to the surface of the flood waters and cholera returned to thesettlement. Although only 3 people died in the flood, many more diedafterwards from disease.
The Perusian Army has provided temporary shelters, and stand pipes.A local women’s group and health clinic have used foreign aid toprovide basic relief of food, clothes, cooking utensils. With thecommercial district flooded and thousands of homes wiped out it willbe a long time before Ica recovers.
Fig 4. The havoc of El Niño - Eye Witness accounts
Case Study 3: Eastern KenyaIn the Tana River valley, it was disastrous flooding again which ruinedthe livelihoods of many. Some 70,000 people had to flee the remotearea. Flooding destroyed the crops of the Pokomo people who farmthe flood plains, and the Orma pastoralist people lost some 30% oftheir cattle. The floods came at the end of January in what should havebeen the dry season. The little rainy season in the Autumn was unusuallywet and this meant that the local people were unable to plant crops.Their tree crops (a long term cash crop investment for small holders)bananas, coconuts and mangoes were completely destroyed by theforce of the flood water as it flooded such a wide area.
For weeks, Hola, the regional capital of the area, was cut off except byair. The local people ran out of basic food such as maize flour. Foodshortage of items such as bananas led to inflated prices, 50% beyondthe people’s reach. The relief programme was organised by the localdrought relief committee who were very well prepared for desertconditions, but not for flooding. They provided with the help ofInternational Aid, shelters, clothing, cooking utensils and food.Malaria became endemic because of the huge areas of temporaryswamp so mosquito nets were also an essential aid item. The villagersare going to rebuild, but all the new villages will be sited on higherground to be flood proof.
Acknowledgements;This Geo Factsheet was researched and written by Sue WarnCurriculum Press, Unit 305B, The Big Peg,120 Vyse Street,Birmingham, B18 6NFGeopress Factsheets may be copied free of charge by teaching staff or students,provided that their school is a registered subscriber.No part of these Factsheets may be reproduced, stored in a retrieval system, ortransmitted, in any other form or by any other means, without the priorpermission of the publisher.ISSN 1351-5136