7731900 instruction sheet - ld didactic
TRANSCRIPT
© by LD DIDACTIC GmbH · Leyboldstraße 1 · D-50354 Hürth · www.ld-didactic.com
Tel: +49-2233-604-0 · Fax: +49-2233-604-222 · Email: [email protected] · Technical alterations reserved
•
••
••
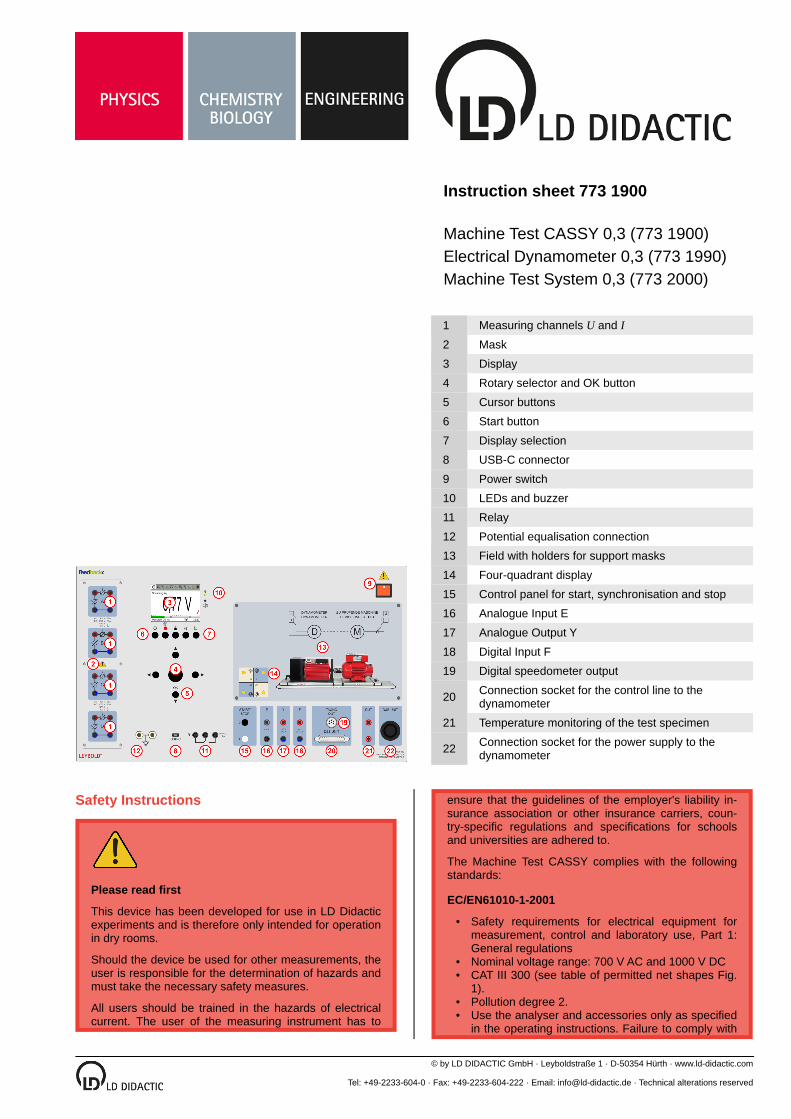
Instruction sheet 773 1900
Machine Test CASSY 0,3 (773 1900)Electrical Dynamometer 0,3 (773 1990)Machine Test System 0,3 (773 2000)
1 Measuring channels U and I
2 Mask
3 Display
4 Rotary selector and OK button
5 Cursor buttons
6 Start button
7 Display selection
8 USB-C connector
9 Power switch
10 LEDs and buzzer
11 Relay
12 Potential equalisation connection
13 Field with holders for support masks
14 Four-quadrant display
15 Control panel for start, synchronisation and stop
16 Analogue Input E
17 Analogue Output Y
18 Digital Input F
19 Digital speedometer output
20 Connection socket for the control line to the dynamometer
21 Temperature monitoring of the test specimen
22 Connection socket for the power supply to the dynamometer
Safety Instructions
Please read first
This device has been developed for use in LD Didactic experiments and is therefore only intended for operation in dry rooms.
Should the device be used for other measurements, the user is responsible for the determination of hazards and must take the necessary safety measures.
All users should be trained in the hazards of electrical current. The user of the measuring instrument has to
ensure that the guidelines of the employer's liability insurance association or other insurance carriers, country-specific regulations and specifications for schools and universities are adhered to.
The Machine Test CASSY complies with the following standards:
EC/EN61010-1-2001
Safety requirements for electrical equipment for measurement, control and laboratory use, Part 1: General regulationsNominal voltage range: 700 V AC and 1000 V DCCAT III 300 (see table of permitted net shapes Fig. 1).Pollution degree 2.Use the analyser and accessories only as specified in the operating instructions. Failure to comply with
2 / 31 Instruction sheet 773 1900
© by LD DIDACTIC GmbH · Leyboldstraße 1 · D-50354 Hürth · www.ld-didactic.com
Tel: +49-2233-604-0 · Fax: +49-2233-604-222 · Email: [email protected] · Technical alterations reserved
•
•••
•
•
•
•
•
•
•
•
•
•
•
•
•
•
••
•
••
••••
••
••
these instructions may impair the protective functions provided by the analyser.
Warning!
To avoid electric shocks and fire hazard:
Carefully read the entire manual before using the analyser and accessories.Read all instructions carefully.Do not work alone.Do not use the product near explosive gases, vapours or in humid or wet environments.Use the product only as intended. Otherwise, the protection provided by the product may be impaired.Only use safety lines that are permitted for the maximum values of the Machine Test CASSY.When using probes, keep your fingers behind the finger guards on the probes.Check the analyser, voltage probes, test leads and accessories for any mechanical damage before use and replace them if necessary.Check for cracks in the insulation (housing, cable sheath) or missing parts. Particular attention should be paid to the insulation on the connectors.Check the function of the meter by measuring a known voltage.Remove all unused probes and measuring tips, measuring leads and accessories.Always connect the Machine Test CASSY to the mains socket before connecting it in the test set-up.Do not touch voltages >25 V AC effective or 60 V DC.Use the equipotential bonding only to ground the Machine Test CASSY. Make sure that no voltage is applied here.The measured values for voltage and current must not exceed the maximum value of the voltage of 1000 V DC and 700 V AC and maximum value of the current of 16 A AC and 16 A DC continuously and pulses up to 24 A.The voltages used should not exceed the specified rated data of the probes and measuring tips, measuring cables and accessories.Use only the correct measuring circuit category (CAT), voltage and current tested test leads and adapters.Never exceed the rated values of the measuring circuit category (CAT) for the lowest rated individual component of a product, test lead or accessory.Comply with local and national safety regulations.Use personal protective equipment (approved rubber gloves, face shield and flame retardant clothing) to prevent electrical shock and fire hazards in case dangerous live conductors are exposedDo not work with the unit when the covers are removed or the housing is open. You could come into contact with dangerous voltages.Do not use bare metal BNC or banana plugs.Do not insert any metal objects into the connectors.
Mechanical hazards from rotating machines
When working on the experimental set-up, please avoid the following:
loose jewellery,wide clothing,ties orlong, open hair.
Loose objects can get caught on the rotating parts and lead to injuries!
Danger from loads
The recommended maximum lifting capacity for occasional lifting and carrying is between 15 and 18 years of age:
for women 15 kgfor men 35 kg
Should machines exceed these limits, then they must be carried by two persons.
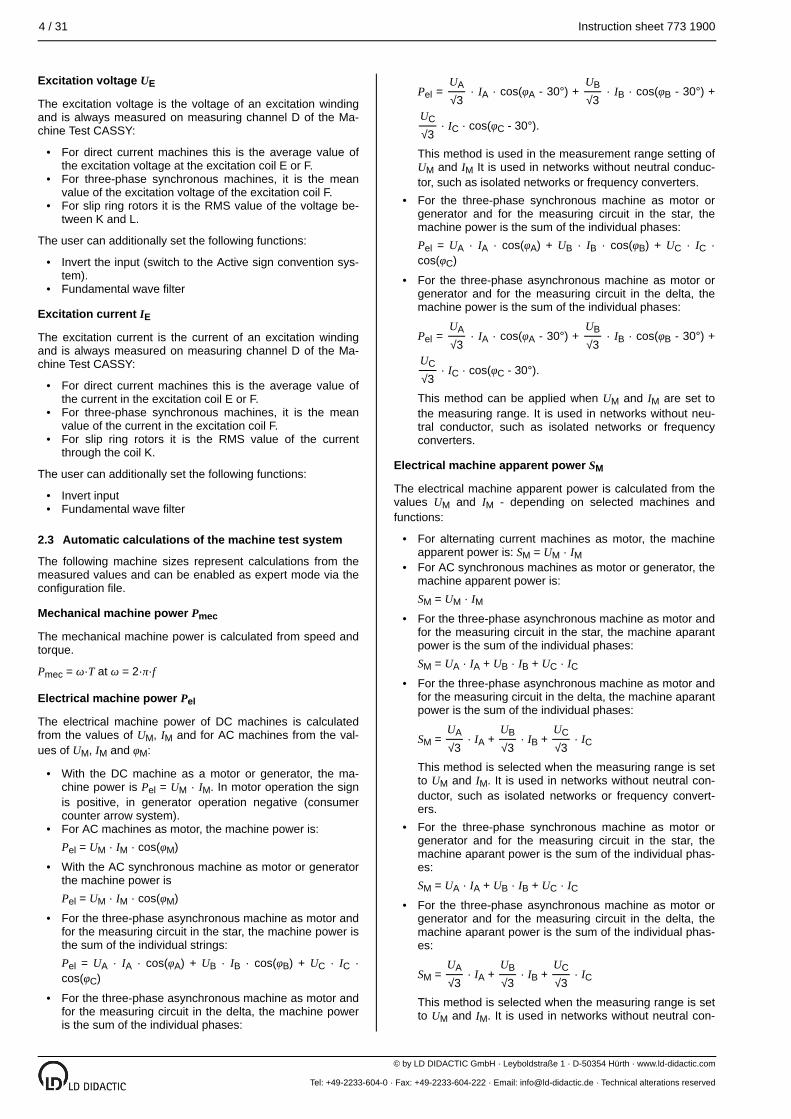
VV V V V V
Voltages and net forms for CAT
1 Machine Test CASSY
Machine Test CASSY is a measuring and control device for use in experiments in electrical engineering, in the fields of electrical machines, drive technology, power electronics and energy technology. It combines the measuring capabilities of the Power Analyser with those of a machine test system. For that reason the manual is divided into 2 sections.
Power AnalyserMachine test system
The electrical quantities are measured in 4 insulated channels, which are designed according to the measurement category CAT III 300.
The mechanical quantities speed, rotational frequency and torque have their own isolated measuring channels. The measuring channels of the electrical quantities are identified by the letters A, B, C and D. These can simultaneously measure the current and/or voltage.
Fig. 1:

Instruction sheet 773 1900 3 / 31
© by LD DIDACTIC GmbH · Leyboldstraße 1 · D-50354 Hürth · www.ld-didactic.com
Tel: +49-2233-604-0 · Fax: +49-2233-604-222 · Email: [email protected] · Technical alterations reserved
••••
••
•
•
•
•
•••
••
•
•
••
2 Description
2.1 Measurements of the Power Analyser
Voltage and current U, I
Instantaneous values U, IAverage values: UAV, IAVRMS values (AC+DC): UTRMS, ITRMSRMS values (AC): UTRMSAC, ITRMSAC
The measuring methods can be freely selected for all channels.
Phase shift 1
The phase shift φ (channel) shows the angle between active power and apparent power of the fundamental wave. This function is only active if voltage and current have been selected and the measuring method RMS values has been set.
Active power
Measures the active power. This function is only active when voltage and current are selected.
Frequency
The frequency of the voltage for waveforms that pass through the zero axis. This frequency measurement is suitable for measuring the grid frequency in energy networks.
Phase shift 2
The phase shift φ (channel A / channel X) measures the angle between channel A and the selected channel, for example φAA, φAB.
2.2 Measurements of the machine test system
All measuring procedures and measured variables refer to the specifications of IEC EN DIN 60034-2-1 "Methods for testing efficiency".
All formula symbols of the measured variables are identified by the index M for machine. The nominal values of a machine are marked with the index N for nominal value.
In the operating modes only the required measurements are accessible. These are visible in the menu bar of the display. For the diagram only the machine speed and the machine torque are preselected by default. The individual measuring channels and their settings are dependent on the machine selection.
The mechanical power is defined in the machine test CASSY as follows:
The motor gives off positive power.The generator takes up negative power.
The electrical power is stated positively for motors and negatively for generators as in the consumer counter arrow system.
Speed of the machines nM
Measures the speed of the coupled machines in revolutions per minute min--1 or in revolutions per second in Hz. Measuring the speed in revolutions per second is required by the standard IEC EN DIN 60034-2-1 "Methods for testing efficiency".
Torque of the machine TM
This measures the torque of the coupled machines in Nm.
Angular acceleration αM
The system calculates the angular acceleration in °/s2 - in mechanics the value is calculated in rad/s2.
Machine voltage UM
The machine voltage is calculated - based on the selected machine - from the measuring channels. The machine voltage is on:
DC machines the mean value of the voltage of the armature circuit including the excitations in the armature circuit.Alternating current machines the RMS value of the applied voltage.Alternating current machines with measuring circuit in the star:the mean value of the 3 RMS values of the outer conductor-neutral conductor voltages.Three-phase machines with measuring circuit in delta:the mean value of the 3 RMS values of the outer conductor voltage.
On three-phase machines, the measuring circuit must be set correctly, otherwise the calculation of the power PM and φMwill be wrong.
The user can additionally set the following functions:
Invert input,Measurement circuit in delta instead of star,Fundamental wave filter.
Machine current IM
The machine current is calculated using the measuring channels depending on the selected machine. The machine current is at:
DC machines the average value of the armature current.Alternating current machines the RMS value of the total current of the main and auxiliary winding.Three-phase machines the average value of the 3 RMS values of the phase currents.This is the same for star and delta connection, but the voltage in delta is higher by a factor of √3 and is 30° ahead of the phase neutral conductor voltage.
The user can additionally set the following functions:
Invert the input (switch to the Active sign convention system).Measurement circuit in delta instead of star.Fundamental wave filter
Phase shift angle of the machine φM
The phase shift between the fundamental waves of the current and voltage of the machines is specified in degrees of the angle. This quantity is only active for alternating current machines. For 3-phase machines, this is the average value of the three individual phase shift angles of the 3 phases.
Frequency of the machine voltage fM
The frequency of the machine is calculated from the first phase of the alternating voltage downstream of a harmonic filter. This is only active for machines with 1-phase and 3-phase alternating current.
4 / 31 Instruction sheet 773 1900
© by LD DIDACTIC GmbH · Leyboldstraße 1 · D-50354 Hürth · www.ld-didactic.com
Tel: +49-2233-604-0 · Fax: +49-2233-604-222 · Email: [email protected] · Technical alterations reserved
•
•
•
•
•
•
•
•
••
•
•
•
•
•
•
•
•
•
•
•
•
•
Excitation voltage UE
The excitation voltage is the voltage of an excitation winding and is always measured on measuring channel D of the Machine Test CASSY:
For direct current machines this is the average value of the excitation voltage at the excitation coil E or F.For three-phase synchronous machines, it is the mean value of the excitation voltage of the excitation coil F.For slip ring rotors it is the RMS value of the voltage between K and L.
The user can additionally set the following functions:
Invert the input (switch to the Active sign convention system).Fundamental wave filter
Excitation current IE
The excitation current is the current of an excitation winding and is always measured on measuring channel D of the Machine Test CASSY:
For direct current machines this is the average value of the current in the excitation coil E or F.For three-phase synchronous machines, it is the mean value of the current in the excitation coil F.For slip ring rotors it is the RMS value of the current through the coil K.
The user can additionally set the following functions:
Invert inputFundamental wave filter
2.3 Automatic calculations of the machine test system
The following machine sizes represent calculations from the measured values and can be enabled as expert mode via the configuration file.
Mechanical machine power Pmec
The mechanical machine power is calculated from speed and torque.
Pmec = ω·T at ω = 2·π·f
Electrical machine power Pel
The electrical machine power of DC machines is calculated from the values of UM, IM and for AC machines from the values of UM, IM and φM:
With the DC machine as a motor or generator, the machine power is Pel = UM · IM. In motor operation the sign is positive, in generator operation negative (consumer counter arrow system).For AC machines as motor, the machine power is:Pel = UM · IM · cos(φM)
With the AC synchronous machine as motor or generator the machine power isPel = UM · IM · cos(φM)
For the three-phase asynchronous machine as motor and for the measuring circuit in the star, the machine power is the sum of the individual strings:Pel = UA · IA · cos(φA) + UB · IB · cos(φB) + UC · IC · cos(φC)
For the three-phase asynchronous machine as motor and for the measuring circuit in the delta, the machine power is the sum of the individual phases:
Pel = · IA · cos(φA - 30°) + · IB · cos(φB - 30°) +
· IC · cos(φC - 30°).
This method is used in the measurement range setting of UM and IM It is used in networks without neutral conductor, such as isolated networks or frequency converters.For the three-phase synchronous machine as motor or generator and for the measuring circuit in the star, the machine power is the sum of the individual phases:Pel = UA · IA · cos(φA) + UB · IB · cos(φB) + UC · IC · cos(φC)
For the three-phase asynchronous machine as motor or generator and for the measuring circuit in the delta, the machine power is the sum of the individual phases:
Pel = · IA · cos(φA - 30°) + · IB · cos(φB - 30°) +
· IC · cos(φC - 30°).
This method can be applied when UM and IM are set to the measuring range. It is used in networks without neutral conductor, such as isolated networks or frequency converters.
Electrical machine apparent power SM
The electrical machine apparent power is calculated from the values UM and IM - depending on selected machines and functions:
For alternating current machines as motor, the machine apparent power is: SM = UM · IMFor AC synchronous machines as motor or generator, the machine apparent power is:SM = UM · IMFor the three-phase asynchronous machine as motor and for the measuring circuit in the star, the machine aparant power is the sum of the individual phases:SM = UA · IA + UB · IB + UC · ICFor the three-phase asynchronous machine as motor and for the measuring circuit in the delta, the machine aparant power is the sum of the individual phases:
SM = · IA + · IB + · IC
This method is selected when the measuring range is set to UM and IM. It is used in networks without neutral conductor, such as isolated networks or frequency converters.For the three-phase synchronous machine as motor or generator and for the measuring circuit in the star, the machine aparant power is the sum of the individual phases:SM = UA · IA + UB · IB + UC · ICFor the three-phase asynchronous machine as motor or generator and for the measuring circuit in the delta, the machine aparant power is the sum of the individual phases:
SM = · IA + · IB + · IC
This method is selected when the measuring range is set to UM and IM. It is used in networks without neutral con
UA
√3UB
√3UC
√3
UA
√3UB
√3UC
√3
UA
√3UB
√3UC
√3
UA
√3UB
√3UC
√3
Instruction sheet 773 1900 5 / 31
© by LD DIDACTIC GmbH · Leyboldstraße 1 · D-50354 Hürth · www.ld-didactic.com
Tel: +49-2233-604-0 · Fax: +49-2233-604-222 · Email: [email protected] · Technical alterations reserved
•
•
•
•
•
•
•
•
•
•
•
•
ductor, such as isolated networks or frequency converters.
Electrical machine reactive power QM
The electrical machine reactive power is calculated from the values UM, IM and φM - depending on selected machines and functions:
For alternating current machines as motor, the machine reactive power isQM = UM · IM · sin(φM)
For AC synchronous machines as motor or generator, the machine reactive power is:QM = UM · IM · sin(φM)
For the three-phase asynchronous machine as motor and for the measuring circuit in the star, the machine reactive power is the sum of the individual phases:QM = UA · IA · sin(φA) + UB · IB · sin(φB) + UC · IC · sin(φC)
For the three-phase asynchronous machine as motor and for the measuring circuit in the delta, the machine reactive power is the sum of the individual phases:
QM = · IA · sin(φA - 30°) + · IB · sin(φB - 30°) +
· IC · sin(φC - 30°)
For the three-phase synchronous machine as motor or generator and for the measuring circuit in the star, the machine reactive power is the sum of the individual phases:QM = UA · IA · sin(φA) + UB · IB · sin(φB) + UC · IC · sin(φC)
For the three-phase asynchronous machine as motor or generator and for the measuring circuit in the delta, the machine reactive power is the sum of the individual phases:
QM = · IA · sin(φA - 30°) + · IB · sin(φB - 30°) +
· IC · sin(φC - 30°)
Excitation power of the machine PE
The electrical excitation power is calculated from the values UE and IE - depending on selected machines and functions:
For direct current machines as motor or generator, the excitation power PE = UE · IE at the excitation winding E or FFor AC synchronous machines as motor or generator, the excitation power PE = UE · IE at the excitation winding FFor three-phase synchronous machines as motor or generator, the excitation power PE = UE · IE at the excitation winding F
Slip sM
The slip is calculated from the values nM, fM and the pole pair number pN. This measured variable is only available for the
squirrel cage machine. The slip is sM = 1 - .
Efficiency of a machine ηM
The efficiency is calculated from the mechanical line Pmec, the electrical active power Pel and, if available, the excitation active power PE:
The following applies to the operating modes Test motorsand Load simulation:
For motors with separate excitation ηM is calculated as follows
ηM = , whereby P2 = Pmec and P1 = Pel + PE.
For motors without excitation ηM is calculated as follows
ηM = , whereby P2 = Pmec and P1 = Pel.
For the operating modes Generator testings and Generator control the following applies:
For generators with separate excitation ηM is calculated as follows
ηM = , whereby P2 = Pel and P1 = Pmec + PE.
3 Technical data
Graphic display: 9 cm (3.5"), QVGA, coloured, bright (adjustable up to 400 cd/m2)
Operation: Push button and rotary selector with push button
Inputs: 4 isolated measuring channels each with U and I measurement (max. 8 simultaneously usable)
Input A-D : U and I connectionOutput Y: Voltage output as function generator
0.01 Hz to 20,000 Hz (only with 727 110)ConnectionU and I:4 mm safety socketsMeasuring range U:
25.0/70/250/700 VRMS±36/±100/±360/±1000 VAV
Measuring ranges I:
0.7/1.6/ 7/16 ARMS±1/±2,4/±10/±16 AAV
Scanning rate: max. 1,000,000 value/s per channel,at U and I max. 500,000 value/s
Resolution of the analogue inputs and outputs:
16 Bit
Loudspeaker: Error message when exceeding the measuring ranges
Data memory: max. 10,000 measured values for each measurement series, integrated micro SD card (4 GB) for more than 1000 measurement files and screenshots
WLAN 802.11 b/g/n as access point or client (WPA/WPA2) - client connection to an Internet-enabled router/hot spot also enables the Internet connection of the connected tablets or smartphones
HTTP server: integrated (view of the multimeter, table and diagram in a browser)
WebSocket Server:
integrated (distribution of the current measurement data to up to four clients)
UA
√3UB
√3UC
√3
UA
√3UB
√3UC
√3
(pN · (nM/60))fM
P2
P1
P2
P1
P2
P1
6 / 31 Instruction sheet 773 1900
© by LD DIDACTIC GmbH · Leyboldstraße 1 · D-50354 Hürth · www.ld-didactic.com
Tel: +49-2233-604-0 · Fax: +49-2233-604-222 · Email: [email protected] · Technical alterations reserved
•••
•••••
•
•
•
•
•
•
•
•
•
•
•
••
•••••
•••••••••
••••••
••••
VNC server integrated (remote operation by transmitting the display content to a client)
USB ports: Connection of a USB-CMains voltage: 230 V, 50 – 60 HzMaximum power consumption:
2300 W
Maximum electrical power dynamometer:
1800 W
Dimensions: 300 mm x 500 mm x 185 mmMass: 8400 g
3.1 Scope of delivery
Machine Test CASSY 0.3 (773 1900)
Machine Test CASSY 0.3Power cable DE and GB.USB-C cable 1.5 m.
Machine Test System 0.3 (773 2000)
Machine Test CASSY 0.3 (773 1900)Electrical Dynamometer 0.3 (773 1990)Coupling / shaft end guard 0.3 transparent (773 108)Machine Base Unit 90 cm (773 110)Weight with hook 1 kg (315 39)
4 Module description
4.1 Measuring channels (1)
Each channel can measure the voltage U and the current I.The isolation of each channel against each other channel and against the control unit is designed as CAT III.The measuring resistors are designed in the circuit as printed on the mask.The polarity of voltage U and current I is positioned in a way that the power P is positive (consumption) when the energy flow is from left to right.With activated voltage measurement of an AC voltage, its frequency f can also be measured.If voltage and current measurement is activated, the power P can also be measured. With alternating variables (RMS value), the load angle φ and the frequency f can also be measured.If more than one channel is activated, the displacement angle to the reference value of channel A can be measured for alternating quantities (RMS value).
4.2 Mask (2)
Each channel is protected by a 16 A gR, which can be replaced by removing the mask.The exchange can only be done when all test leads have been removed and the unit has been switched off (see safety instructions).The fuses can be lifted out with a screwdriver via the lateral slot.The device must not be operated with an open mask.
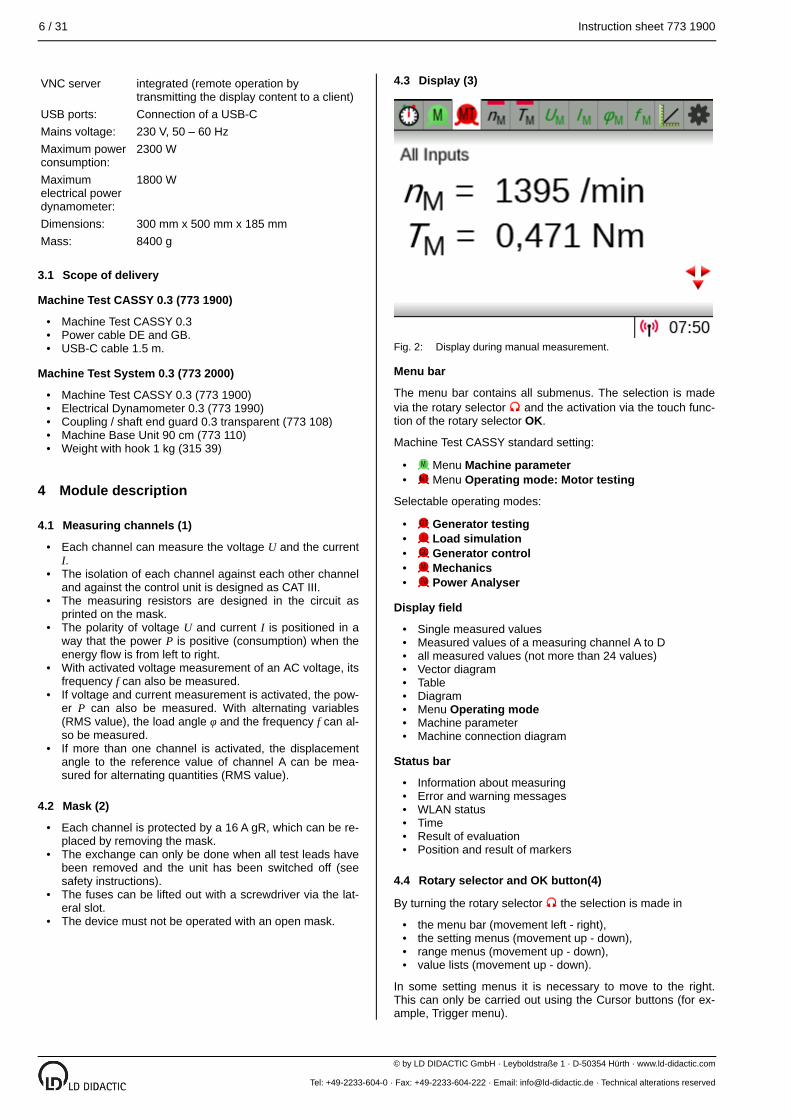
4.3 Display (3)
Display during manual measurement.
Menu bar
The menu bar contains all submenus. The selection is made via the rotary selector and the activation via the touch function of the rotary selector OK.
Machine Test CASSY standard setting:
Menu Machine parameter Menu Operating mode: Motor testing
Selectable operating modes:
Generator testing Load simulation Generator control Mechanics Power Analyser
Display field
Single measured valuesMeasured values of a measuring channel A to Dall measured values (not more than 24 values)Vector diagramTableDiagramMenu Operating modeMachine parameterMachine connection diagram
Status bar
Information about measuringError and warning messagesWLAN statusTimeResult of evaluationPosition and result of markers
4.4 Rotary selector and OK button(4)
By turning the rotary selector the selection is made in
the menu bar (movement left - right),the setting menus (movement up - down),range menus (movement up - down),value lists (movement up - down).
In some setting menus it is necessary to move to the right. This can only be carried out using the Cursor buttons (for example, Trigger menu).
Fig. 2:
Instruction sheet 773 1900 7 / 31
© by LD DIDACTIC GmbH · Leyboldstraße 1 · D-50354 Hürth · www.ld-didactic.com
Tel: +49-2233-604-0 · Fax: +49-2233-604-222 · Email: [email protected] · Technical alterations reserved
•
••
•
•
•
•
•
•
•
•
•◦
◦
▪
▪
•
•
Only the rotary selector can activate a selection by pressing OK. A setting is saved or opened in a submenu.
4.5 Cursor buttons (5)
Keys cannot be used in the menu bar, since they can only select the display field in normal view.Buttons are only active in a few setting menus.Buttons can jump from the menu bar to the settings menu and back.Buttons an select in the Settings menu, Range menu or in the Value list, but cannot activate them.
4.6 Start button (6)
Starts and stops the measurement. The start button simultaneously jumps up in the menu bar to . Automated tests are also started with this button when using the Machine Test CASSY.
4.7 Display selection (7)
A Value display
Jumps directly to the display of all values.
B Operating mode menu
Jumps directly to the operating mode menu.
C Table display
Jumps directly to the display of the table.
D Diagram display
Jumps directly to the display of the diagram.
4.8 USB C plug (8)
Connection for the included USB cable or a suitable USB stick.
4.9 Power switch (9)
Switches the unit on and lights up when the machine is switched on and mains voltage is applied.
4.10 LEDs and Buzzer(10)
The LEDs light up during switch-on, firmware update and saving. The buzzer indicates when measuring ranges are exceeded.
4.11 Relay (11)
Allows the measurement of switch-on and switch-off processes.
4.12 Potential equalisation connection (12)
Allows the measuring device to be included in the potential equalization. As required, for example, for frequency converters.The user is responsible for setting up a potential equalization, as this depends on the local conditions.
4.13 Mask field (13)
This is where masks for specific applications can be placed to illustrate the individual functions of the Machine Test CASSY.
4.14 Quadrant display (14)
Here the LEDs indicate in which quadrant the test sample is located.
1. Quadrant I - Motor operation. The DUT rotates clockwise at positive speed and is loaded with a positive torque.2. Quadrant II - Generator operation. The DUT rotates counter-clockwise at negative speed and is loaded with positive torque.3. Quadrant III - Motor operation. The DUT rotates counter-clockwise at negative speed and is loaded with negative torque.4. Quadrant IV - Generator operation. The DUT rotates clockwise and is loaded with negative torque.
4.15 Start / Stop (15)
The Stop button stops all controllers and switches the power section to inactive. The machine to be tested is not affected by this and can continue running depending on the setting.The Start button has 2 functions:
Enabling the machinesIs necessary from the point of view of machine safety! After switching off due to an error or due to the safety loop, the operator must deliberately release the machine again after the problem has been eliminated.Activate synchronisation of the machine or control.Depending on the operating mode, the DUT is prepared for the experiment, but there are great differences between the operating modes.
In Machine testing, for example, the test item is synchronised with the dynamometer.In Generator testing, the specified speed is set and controlled.
4.16 Analogue Input E (16)
The analogue Input E can be used to enter the reference value for speed or torque in the Motor testing and Generator testing .
For this purpose, there is the option of selecting Input E in the Manual set point input.
4.17 Analogue Output Y (17)
The analogue output is assigned 2 functions during the machine test CASSY.
Analogue control and regulating output for operating mode Generator testing and Generator control.Switching output in the operating mode Motor testing for a star-delta switch-over or, in the case of capacitor motors, for switching the starting capacitor.
4.18 Digital Input F (18)
This digital input is used in the operating mode Generator testing and Generator control.
When the generator is synchronised to the mains, a switch on the synchronisation unit switches the frequency controller to a power controller. On the voltage regulator, the switch is used to switch over to a reactive power regulator.
8 / 31 Instruction sheet 773 1900
© by LD DIDACTIC GmbH · Leyboldstraße 1 · D-50354 Hürth · www.ld-didactic.com
Tel: +49-2233-604-0 · Fax: +49-2233-604-222 · Email: [email protected] · Technical alterations reserved
••
•
•
•
•
•
•
•
4.19 Tachometer output (19)
The tachometer output provides speed signals that can be used in other teaching systems, for example, in a frequency converter, to control speed.
4.20 Connection for the control signal line from the dynamometer (20)
The signals of the speed and torque measurement and the protective loop are supplied to the control unit via this line. If this line is not connected during an operating mode of the machine analysis, then this is indicated like a missing wave cover.
4.21 Temperature monitoring of the test specimen (21)
The standard DUT (Device Under Test) of the LD-Didactic is equipped with a temperature monitor which switches off the load at a winding temperature >105 °C without stopping the cooling.
This error is indicated as over temperature DUT in the display. The tests can only be continued once the winding temperature has dropped significantly below 105 °C.
4.22 Connection of power supply and temperature monitoring of the dynamometer (22)
The 3 phases of the asynchronous motor, the temperature monitoring and the protective conductor are connected to the dynamometer via this 6-pole cable. If the line is not connected, this fault is indicated as an Overtemperature dynamometer. The temperature monitor behaves like the machines. Above 105 °C it switches the pendulum machine off and does not allow it to be switched on again until the temperature has fallen significantly below 105 °C. Until then the error Overtemperature dynamometer is displayed.
5 Machine Test CASSY operation
5.1 Operation as machine testing system
Basic structure of a machine test bench
No. Material Cat. number
Info
1 Machine Test CASSY 0,3
773 1900
1 Electrical Dynamometer 0,3
773 1990
1 Machine Base Unit 90 cm
773 110
1 Coupling and schaft end guard 0.3 transparent
773 108
1 Coupling 0.3 731 06
1 Squirrel Cage Motor 230/400 0.3
773 2104 Motor as example
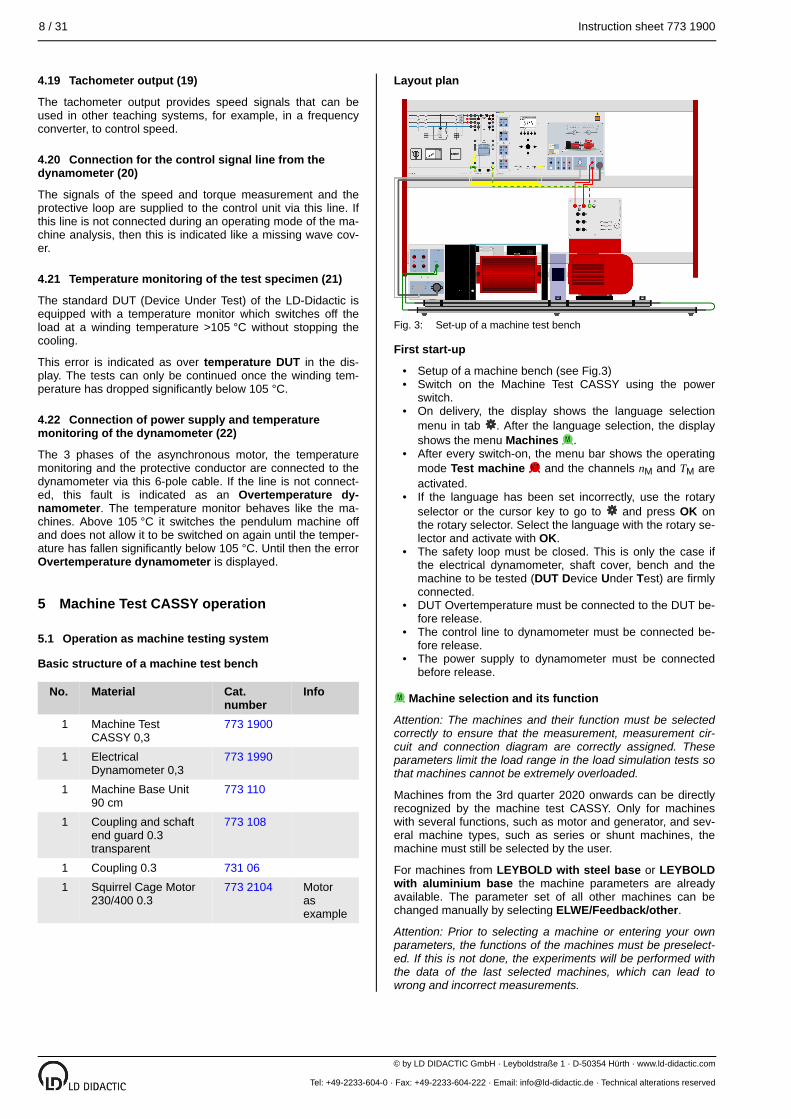
Layout plan
Set-up of a machine test bench
First start-up
Setup of a machine bench (see Fig.3)Switch on the Machine Test CASSY using the power switch.On delivery, the display shows the language selection menu in tab . After the language selection, the display shows the menu Machines .After every switch-on, the menu bar shows the operating mode Test machine and the channels nM and TM are activated.If the language has been set incorrectly, use the rotary selector or the cursor key to go to and press OK on the rotary selector. Select the language with the rotary selector and activate with OK.The safety loop must be closed. This is only the case if the electrical dynamometer, shaft cover, bench and the machine to be tested (DUT Device Under Test) are firmly connected.DUT Overtemperature must be connected to the DUT before release.The control line to dynamometer must be connected before release.The power supply to dynamometer must be connected before release.
Machine selection and its function
Attention: The machines and their function must be selected correctly to ensure that the measurement, measurement circuit and connection diagram are correctly assigned. These parameters limit the load range in the load simulation tests so that machines cannot be extremely overloaded.
Machines from the 3rd quarter 2020 onwards can be directly recognized by the machine test CASSY. Only for machines with several functions, such as motor and generator, and several machine types, such as series or shunt machines, the machine must still be selected by the user.
For machines from LEYBOLD with steel base or LEYBOLD with aluminium base the machine parameters are already available. The parameter set of all other machines can be changed manually by selecting ELWE/Feedback/other.
Attention: Prior to selecting a machine or entering your own parameters, the functions of the machines must be preselected. If this is not done, the experiments will be performed with the data of the last selected machines, which can lead to wrong and incorrect measurements.
Fig. 3:
Instruction sheet 773 1900 9 / 31
© by LD DIDACTIC GmbH · Leyboldstraße 1 · D-50354 Hürth · www.ld-didactic.com
Tel: +49-2233-604-0 · Fax: +49-2233-604-222 · Email: [email protected] · Technical alterations reserved
•
•
•
•
•
•
•
•
•
•
•
•
•
•Menu for machine selection
Machine type
The following options are available to the user:
LEYBOLD with steel baseMinimizes the selection list on LEYBOLD machines with steel pedestal after selecting the machine functions.LEYBOLD with aluminium baseMinimizes the selection list on LEYBOLD machines with aluminium base after selecting the machine functions.ELWE/FEEDBACK/OthersAllows free input of parameter values after machine functions have been selected.
Basic function
This is about the basic functions and whether they are operated as a motor or generator. Furthermore whether they are operated with or without excitation.
Excitations in this sense are only those which are outside the armature circuit, so that the losses of these excitations are determined separately, as specified in IEC EN DIN 60027-1.
Motor without excitation (for example series-wound motor, asynchronous motor).Motor with excitation (e.g. shunt motor, double shunt motor, slip ring rotor, synchronous motor).Generator with excitation (e.g. shunt generator, double shunt generator, synchronous generator).
On machines with excitation, the measuring channel D for excitation is activated and set to the required measured variable.
For LEYBOLD generators without excitation there are no parameters (e.g. series-wound machine, permanently excited synchronous machine). Permanently excited machines can only be used to generate energy with downstream power electronics.
Network type
Selection of the machine supply grid:
DCWhen a DC voltage network is selected, the required measuring channels are switched to average value.AC, 1-phaseWhen selecting a 1-phase alternating current network, the required measuring channels are switched to RMS value.AC, 3-phase
When selecting a 3-phase alternating current network, the required measuring channels are switched to RMS value.
Mains voltage
The options depend on the network type selected. For DC voltage it is as follows:
120 V = (for example North America, parts of South America, Korea, Japan).220 V = (for example Europe, parts of Africa, Australia).
When selecting AC power supply:
120 V~/ 60 Hz (for example North America, parts of South America, Korea, Japan).230 V~/ 50 Hz (for example Europe, parts of Africa, Australia).230 V~/ 60 Hz (for example parts from South America, Saudi Arabia).
Machine
For LEYBOLD machines with steel base and LEYBOLD with aluminium base a list of the selected machine type is displayed for selection
On ELWE/FEEDBACK/other, the parameter set can be freely edited. For input, Display parameter set must be opened. For better reference, these values are preset in the parameter set. Should no data be known, it is possible to try to determine these values with the preset values and then change them afterwards.
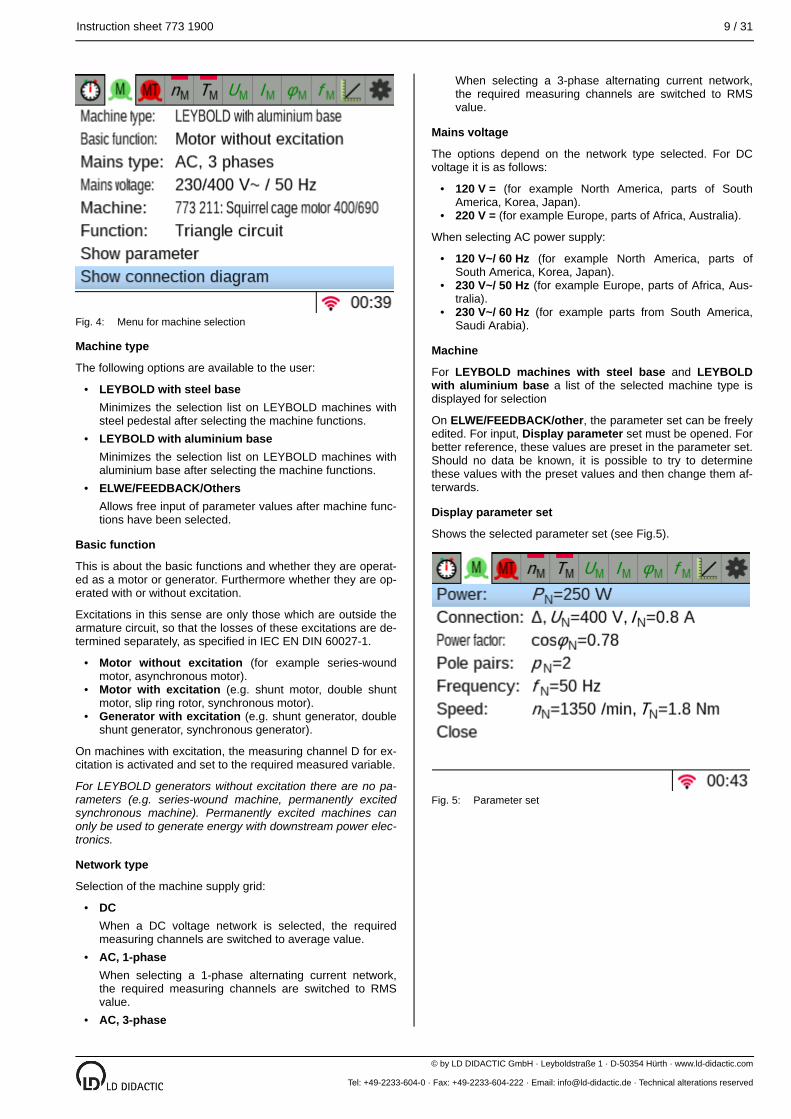
Display parameter set
Shows the selected parameter set (see Fig.5).
Parameter set
Fig. 4:
Fig. 5:
10 / 31 Instruction sheet 773 1900
© by LD DIDACTIC GmbH · Leyboldstraße 1 · D-50354 Hürth · www.ld-didactic.com
Tel: +49-2233-604-0 · Fax: +49-2233-604-222 · Email: [email protected] · Technical alterations reserved
•
•
••••••
•••••••
••
•
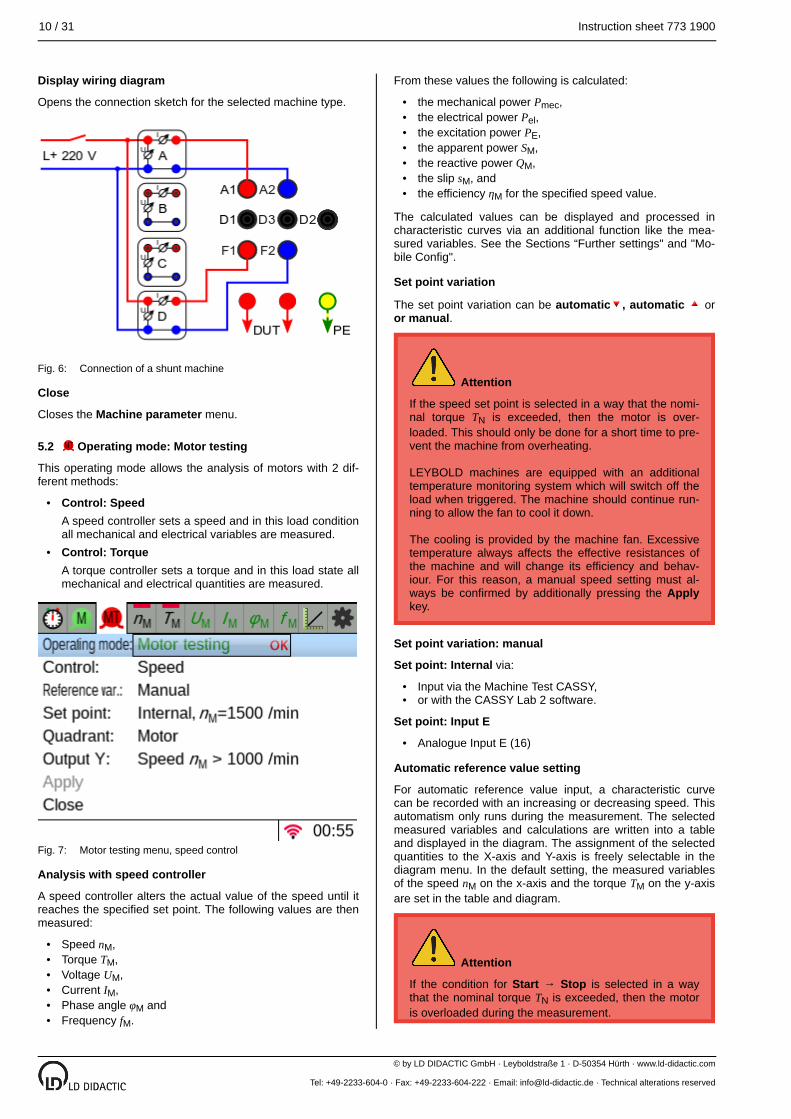
Display wiring diagram
Opens the connection sketch for the selected machine type.
Connection of a shunt machine
Close
Closes the Machine parameter menu.
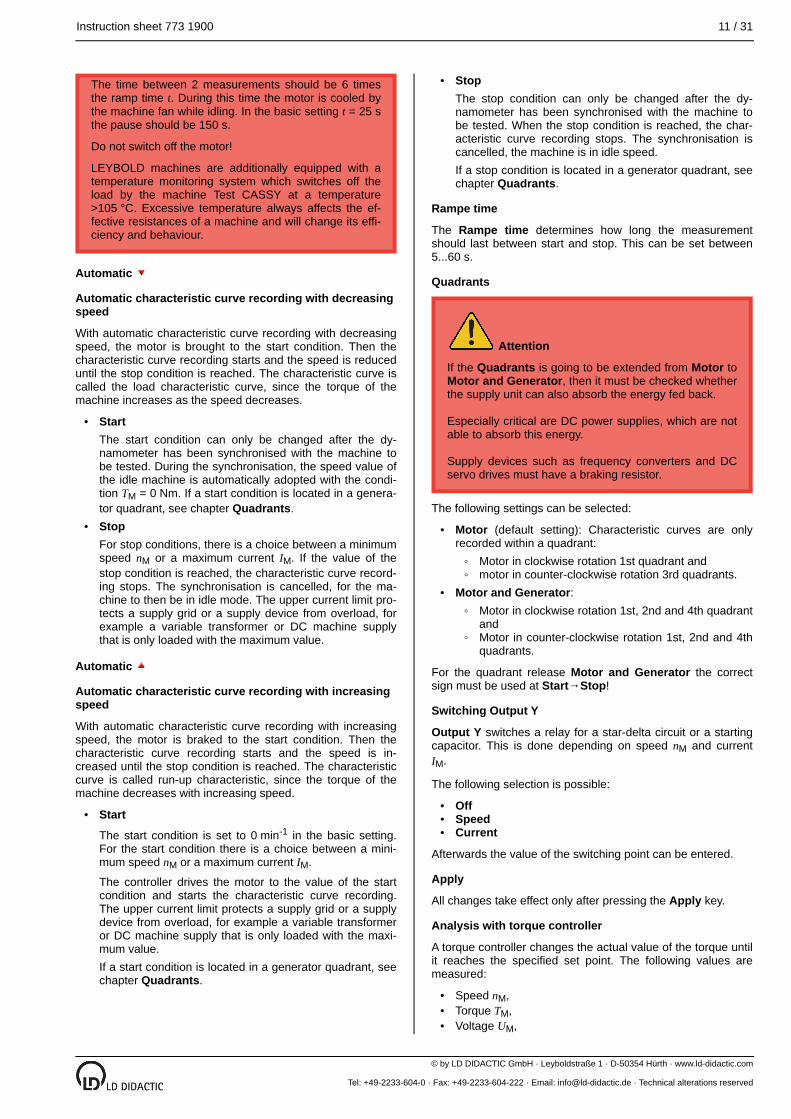
5.2 Operating mode: Motor testing
This operating mode allows the analysis of motors with 2 different methods:
Control: SpeedA speed controller sets a speed and in this load condition all mechanical and electrical variables are measured.Control: TorqueA torque controller sets a torque and in this load state all mechanical and electrical quantities are measured.
Motor testing menu, speed control
Analysis with speed controller
A speed controller alters the actual value of the speed until it reaches the specified set point. The following values are then measured:
Speed nM,Torque TM,Voltage UM,Current IM,Phase angle φM andFrequency fM.
From these values the following is calculated:
the mechanical power Pmec,the electrical power Pel,the excitation power PE,the apparent power SM,the reactive power QM,the slip sM, andthe efficiency ηM for the specified speed value.
The calculated values can be displayed and processed in characteristic curves via an additional function like the measured variables. See the Sections “Further settings" and "Mobile Config".
Set point variation
The set point variation can be automatic , automatic oror manual.
Attention
If the speed set point is selected in a way that the nominal torque TN is exceeded, then the motor is overloaded. This should only be done for a short time to prevent the machine from overheating.
LEYBOLD machines are equipped with an additional temperature monitoring system which will switch off the load when triggered. The machine should continue running to allow the fan to cool it down.
The cooling is provided by the machine fan. Excessive temperature always affects the effective resistances of the machine and will change its efficiency and behaviour. For this reason, a manual speed setting must always be confirmed by additionally pressing the Applykey.
Set point variation: manual
Set point: Internal via:
Input via the Machine Test CASSY,or with the CASSY Lab 2 software.
Set point: Input E
Analogue Input E (16)
Automatic reference value setting
For automatic reference value input, a characteristic curve can be recorded with an increasing or decreasing speed. This automatism only runs during the measurement. The selected measured variables and calculations are written into a table and displayed in the diagram. The assignment of the selected quantities to the X-axis and Y-axis is freely selectable in the diagram menu. In the default setting, the measured variables of the speed nM on the x-axis and the torque TM on the y-axis are set in the table and diagram.
Attention
If the condition for Start Stop→ is selected in a way that the nominal torque TN is exceeded, then the motor is overloaded during the measurement.
Fig. 6:
Fig. 7:
Instruction sheet 773 1900 11 / 31
© by LD DIDACTIC GmbH · Leyboldstraße 1 · D-50354 Hürth · www.ld-didactic.com
Tel: +49-2233-604-0 · Fax: +49-2233-604-222 · Email: [email protected] · Technical alterations reserved
•
•
•
•
•
◦◦
•◦
◦
•••
•••
The time between 2 measurements should be 6 times the ramp time t. During this time the motor is cooled by the machine fan while idling. In the basic setting t = 25 s the pause should be 150 s.
Do not switch off the motor!
LEYBOLD machines are additionally equipped with a temperature monitoring system which switches off the load by the machine Test CASSY at a temperature >105 °C. Excessive temperature always affects the effective resistances of a machine and will change its efficiency and behaviour.
Automatic
Automatic characteristic curve recording with decreasing speed
With automatic characteristic curve recording with decreasing speed, the motor is brought to the start condition. Then the characteristic curve recording starts and the speed is reduced until the stop condition is reached. The characteristic curve is called the load characteristic curve, since the torque of the machine increases as the speed decreases.
StartThe start condition can only be changed after the dynamometer has been synchronised with the machine to be tested. During the synchronisation, the speed value of the idle machine is automatically adopted with the condition TM = 0 Nm. If a start condition is located in a generator quadrant, see chapter Quadrants.StopFor stop conditions, there is a choice between a minimum speed nM or a maximum current IM. If the value of the stop condition is reached, the characteristic curve recording stops. The synchronisation is cancelled, for the machine to then be in idle mode. The upper current limit protects a supply grid or a supply device from overload, for example a variable transformer or DC machine supply that is only loaded with the maximum value.
Automatic
Automatic characteristic curve recording with increasing speed
With automatic characteristic curve recording with increasing speed, the motor is braked to the start condition. Then the characteristic curve recording starts and the speed is increased until the stop condition is reached. The characteristic curve is called run-up characteristic, since the torque of the machine decreases with increasing speed.
Start
The start condition is set to 0 min-1 in the basic setting. For the start condition there is a choice between a minimum speed nM or a maximum current IM.
The controller drives the motor to the value of the start condition and starts the characteristic curve recording. The upper current limit protects a supply grid or a supply device from overload, for example a variable transformer or DC machine supply that is only loaded with the maximum value.If a start condition is located in a generator quadrant, see chapter Quadrants.
StopThe stop condition can only be changed after the dynamometer has been synchronised with the machine to be tested. When the stop condition is reached, the characteristic curve recording stops. The synchronisation is cancelled, the machine is in idle speed.If a stop condition is located in a generator quadrant, see chapter Quadrants.
Rampe time
The Rampe time determines how long the measurement should last between start and stop. This can be set between 5...60 s.
Quadrants
Attention
If the Quadrants is going to be extended from Motor to Motor and Generator, then it must be checked whether the supply unit can also absorb the energy fed back.
Especially critical are DC power supplies, which are not able to absorb this energy.
Supply devices such as frequency converters and DC servo drives must have a braking resistor.
The following settings can be selected:
Motor (default setting): Characteristic curves are only recorded within a quadrant:
Motor in clockwise rotation 1st quadrant andmotor in counter-clockwise rotation 3rd quadrants.
Motor and Generator:Motor in clockwise rotation 1st, 2nd and 4th quadrant andMotor in counter-clockwise rotation 1st, 2nd and 4th quadrants.
For the quadrant release Motor and Generator the correct sign must be used at Start Stop→ !
Switching Output Y
Output Y switches a relay for a star-delta circuit or a starting capacitor. This is done depending on speed nM and current IM.
The following selection is possible:
OffSpeedCurrent
Afterwards the value of the switching point can be entered.
Apply
All changes take effect only after pressing the Apply key.
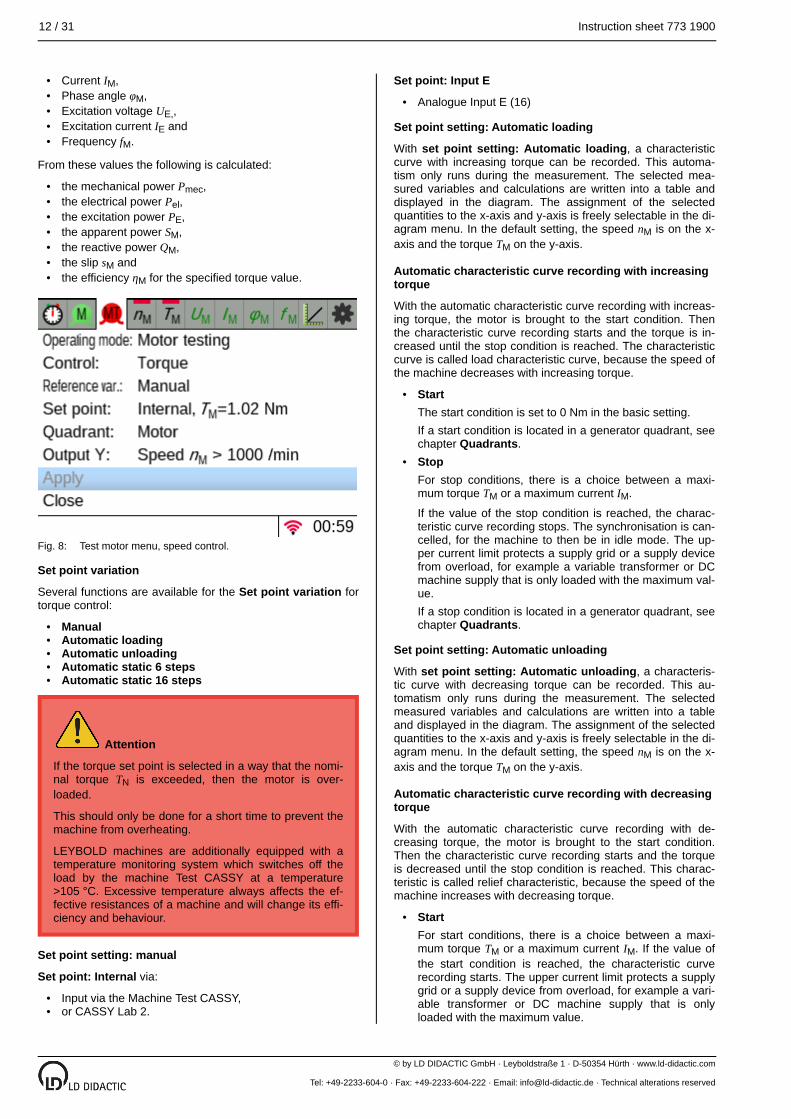
Analysis with torque controller
A torque controller changes the actual value of the torque until it reaches the specified set point. The following values are measured:
Speed nM,Torque TM,Voltage UM,
12 / 31 Instruction sheet 773 1900
© by LD DIDACTIC GmbH · Leyboldstraße 1 · D-50354 Hürth · www.ld-didactic.com
Tel: +49-2233-604-0 · Fax: +49-2233-604-222 · Email: [email protected] · Technical alterations reserved
•••••
•••••••
•••••
••
•
•
•
•
Current IM,Phase angle φM,Excitation voltage UE,,Excitation current IE andFrequency fM.
From these values the following is calculated:
the mechanical power Pmec,the electrical power Pel,the excitation power PE,the apparent power SM,the reactive power QM,the slip sM andthe efficiency ηM for the specified torque value.
Test motor menu, speed control.
Set point variation
Several functions are available for the Set point variation for torque control:
ManualAutomatic loadingAutomatic unloadingAutomatic static 6 stepsAutomatic static 16 steps
Attention
If the torque set point is selected in a way that the nominal torque TN is exceeded, then the motor is overloaded.
This should only be done for a short time to prevent the machine from overheating.
LEYBOLD machines are additionally equipped with a temperature monitoring system which switches off the load by the machine Test CASSY at a temperature >105 °C. Excessive temperature always affects the effective resistances of a machine and will change its efficiency and behaviour.
Set point setting: manual
Set point: Internal via:
Input via the Machine Test CASSY,or CASSY Lab 2.
Set point: Input E
Analogue Input E (16)
Set point setting: Automatic loading
With set point setting: Automatic loading, a characteristic curve with increasing torque can be recorded. This automatism only runs during the measurement. The selected measured variables and calculations are written into a table and displayed in the diagram. The assignment of the selected quantities to the x-axis and y-axis is freely selectable in the diagram menu. In the default setting, the speed nM is on the x-axis and the torque TM on the y-axis.
Automatic characteristic curve recording with increasing torque
With the automatic characteristic curve recording with increasing torque, the motor is brought to the start condition. Then the characteristic curve recording starts and the torque is increased until the stop condition is reached. The characteristic curve is called load characteristic curve, because the speed of the machine decreases with increasing torque.
StartThe start condition is set to 0 Nm in the basic setting.If a start condition is located in a generator quadrant, see chapter Quadrants.StopFor stop conditions, there is a choice between a maximum torque TM or a maximum current IM.
If the value of the stop condition is reached, the characteristic curve recording stops. The synchronisation is cancelled, for the machine to then be in idle mode. The upper current limit protects a supply grid or a supply device from overload, for example a variable transformer or DC machine supply that is only loaded with the maximum value.If a stop condition is located in a generator quadrant, see chapter Quadrants.
Set point setting: Automatic unloading
With set point setting: Automatic unloading, a characteristic curve with decreasing torque can be recorded. This automatism only runs during the measurement. The selected measured variables and calculations are written into a table and displayed in the diagram. The assignment of the selected quantities to the x-axis and y-axis is freely selectable in the diagram menu. In the default setting, the speed nM is on the x-axis and the torque TM on the y-axis.
Automatic characteristic curve recording with decreasing torque
With the automatic characteristic curve recording with decreasing torque, the motor is brought to the start condition. Then the characteristic curve recording starts and the torque is decreased until the stop condition is reached. This characteristic is called relief characteristic, because the speed of the machine increases with decreasing torque.
StartFor start conditions, there is a choice between a maximum torque TM or a maximum current IM. If the value of the start condition is reached, the characteristic curve recording starts. The upper current limit protects a supply grid or a supply device from overload, for example a variable transformer or DC machine supply that is only loaded with the maximum value.
Fig. 8:
Instruction sheet 773 1900 13 / 31
© by LD DIDACTIC GmbH · Leyboldstraße 1 · D-50354 Hürth · www.ld-didactic.com
Tel: +49-2233-604-0 · Fax: +49-2233-604-222 · Email: [email protected] · Technical alterations reserved
•
•
•
•••
•••••••
•••
If a start condition is located in a generator quadrant, see chapter Quadrants.StopThe stop condition is set to 0 Nm in the basic setting. If the value of the stop condition is reached, the characteristic curve recording stops. The synchronisation is cancelled, for the machine to then be in idle mode.If a stop condition is located in a generator quadrant, see chapter Quadrants.
Ramp time
The Ramp time determines how long the measurement should last between Start Stop→ . This can be set between 5...60 s.
Set point setting: Automatic static 6 steps
The standard method "Test with load curve" according to IEC EN DIN 60034-2-1 specifies 6 load values at 25 %, 50 %, 75 %, 100 %, 115 % and 125 %. When this method is selected, all data is recorded automatically. The moment of inertia of a motor has no influence on the measurement result for a static measurement.
Set point setting: Automatic static 16 steps
This measuring method automatically records all data for 16 static load values from 0 % to 150 % in 10 % steps. The moment of inertia of a motor has no influence on the measurement result for a static measurement.
Step time
Duration of averaging the measurement results to be achieved in each step.
Quadrants
Attention
If the quadrant is going to be extended from Motor to Motor and Generator, then it must be checked whether the supply unit can also absorb the energy fed back.
Especially critical are DC power supplies, which are not able to absorb this energy.
Supply devices such as frequency converters and DC servo drives must have a braking resistor.
The following settings can be selected:
Motor (default setting): Characteristic curves can only be recorded within a quadrant. For the motor in clockwise rotation the characteristic curve can be recorded in the 1st quadrant, for the motor in counter-clockwise rotation in the 3rd quadrants.Motor and Generator: The characteristic curve with one motor in clockwise rotation and one motor in counter-clockwise rotation can be extended to the 2nd and 4th quadrant.
Ensure that the correct signs are used in the quadrant release Motor and Generator at Start Stop→ !
Switching Output Y
Output Y switches a relay for a star-delta circuit or a starting capacitor. This is done depending on speed nM and current IM.
The following selection is possible:
OffSpeedCurrent
Afterwards the value of the switching point can be entered.
Apply
All changes take effect only after pressing the Apply key.
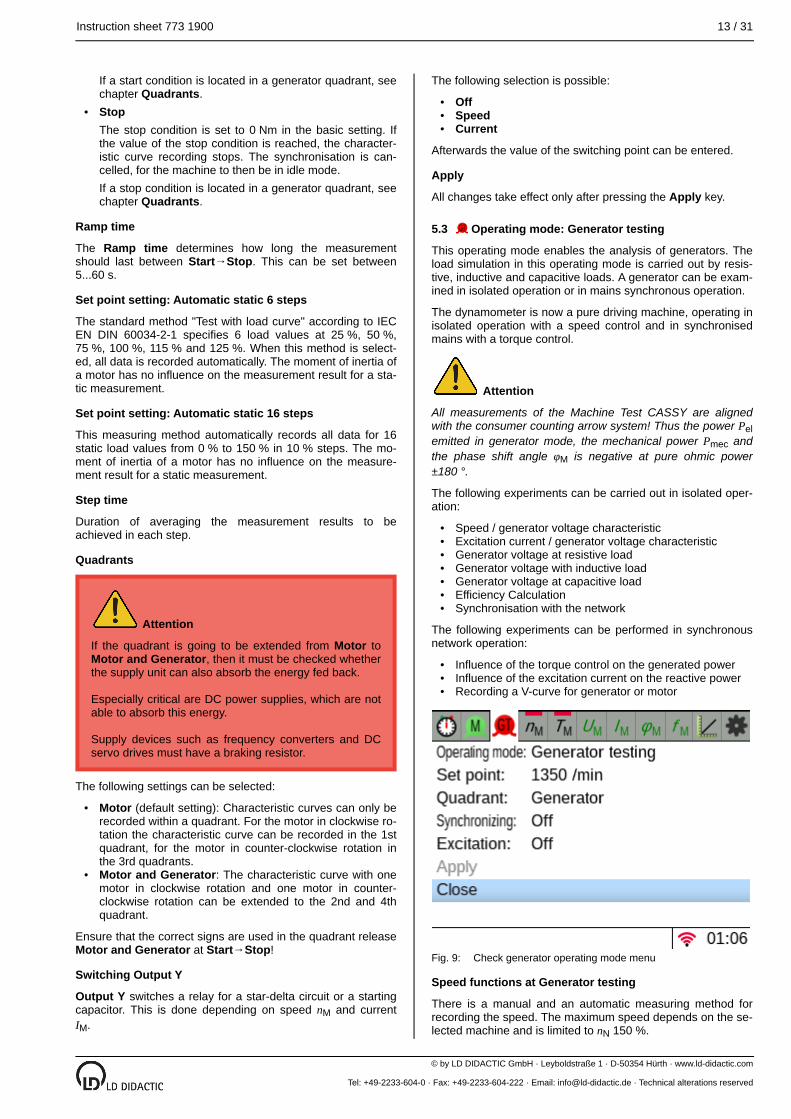
5.3 Operating mode: Generator testing
This operating mode enables the analysis of generators. The load simulation in this operating mode is carried out by resistive, inductive and capacitive loads. A generator can be examined in isolated operation or in mains synchronous operation.
The dynamometer is now a pure driving machine, operating in isolated operation with a speed control and in synchronised mains with a torque control.
Attention
All measurements of the Machine Test CASSY are aligned with the consumer counting arrow system! Thus the power Pelemitted in generator mode, the mechanical power Pmec and the phase shift angle φM is negative at pure ohmic power ±180 °.
The following experiments can be carried out in isolated operation:
Speed / generator voltage characteristicExcitation current / generator voltage characteristicGenerator voltage at resistive loadGenerator voltage with inductive loadGenerator voltage at capacitive loadEfficiency CalculationSynchronisation with the network
The following experiments can be performed in synchronous network operation:
Influence of the torque control on the generated powerInfluence of the excitation current on the reactive powerRecording a V-curve for generator or motor
Check generator operating mode menu
Speed functions at Generator testing
There is a manual and an automatic measuring method for recording the speed. The maximum speed depends on the selected machine and is limited to nN 150 %.
Fig. 9:
14 / 31 Instruction sheet 773 1900
© by LD DIDACTIC GmbH · Leyboldstraße 1 · D-50354 Hürth · www.ld-didactic.com
Tel: +49-2233-604-0 · Fax: +49-2233-604-222 · Email: [email protected] · Technical alterations reserved
••
•
••
••••
•
◦
•
◦
◦
◦
◦
◦
◦
•
•
•
Attention
The voltage at the stator windings that is measured for UM = 230 V may be briefly exceeded without load in the experiment. The voltage should not exceed 350 V.
Manual measuring method of the speed
Here, the speed is set manually in steps up to the maximum.
For this to be possible, the Record must be set to Manual in the Measurement menu (see Setting the measurement parameters). By pressing the , only single measurements are made. In the Check generator menu the set point can now be increased from 0 min-1 to the maximum value. The increment is freely selectable. Please note that an excitation current should flow for the effect of the speed.
Adjustment range set point: Speed
The value of the speed is limited to 1.5 times the nominal speed in both running directions.
Quadrants
Attention
Switching from Generator to Motor and Generator is only useful for synchronous generators that are synchronised with a grid. This is needed to record a V-curve of a synchronous generator or a synchronous motor.
DC generators are not suitable for this purpose, because most of the power supplies are not regenerative.
If a synchronous machine is to feed into a network fed by a frequency converter, the latter must be designed for this.
Synchronisation
For a synchronous generator to operate stably after synchronisation, the generator must be switched from speed control to torque control. The switching is done via a bridge or via a switching contact connected to the digital Input F. There are 2 possibilities:
Off: Island operation of the speed controller is activeTorque: After the synchronisation, digital Input F is bridged. The control switches from speed to torque control. Then the reference value for TM can be entered in the field for the reference value in TM =. After pressing the Apply button, it is accepted by the controller as the new reference value.
Output Y
The analogue Output Y can be used to control an external DC source, such as excitation voltage controllers (catalogue number: 745 021) or machine supply 300 W (catalogue number: 725 852DG). This only applies to generators with an excitation voltage of 220 V DC. The voltage Output Y delivers a voltage of 0...10.0 V. The voltage level varies between different generators and experimental applications and should be defined by testing:
Off
ManualRamp
Manual
Here, a fixed value of 0...10.0 V can statically be set. Ensure that the voltage UM for synchronous machines without load does NOT exceed the following values:
without load in delta connection 350 V AC,without load in star connection 600 V AC,with load in delta connection 270 V AC,with load in star connection 470 V AC.
For DC generators, the voltage UM should not exceed 330 V DC without load and 260 V DC with load.
Ramp
With the ramp function, several parameters are needed to control it sensibly.
Start: Start point of the voltage is the minimum voltage at which the ramp starts.
In island operation of a generator this voltage is a fixed value, but in mains operation it is used to control the reactive power. Here underexcitation also means instability of the generator. To prevent a generator from tearing off, this voltage should be selected in a way that there is no tearing off when a V-curve is recorded. This value can change depending on the load on the generator.
Stop: The end point of the ramp represents the maximum excitation voltage. For generators in island operation the following values of voltage UM should not be exceeded:
350 V AC for synchronous machines without load in delta connection600 V AC for synchronous machines without load in star connection270 V AC for synchronous machines with load in delta connection470 V AC for synchronous machines with load in star connectionFor DC generators, the voltage UM should not exceed 330 V DC without load and 260 V DC with load.During mains operation, too high of a voltage at the excitation winding is responsible for overexcitation. Here you have to look more at the nominal current INof the generator, to prevent thermal overload. For V-curves the measuring time should be equal to the ramp time.
Ramp time t = 5...60 s adjustable. The ramp time determines the number of measuring points to be recorded.
Apply
All changes are executed by pressing the Apply key in the controller.
5.4 Operating mode: Load simulation
The load simulation can be used in two areas of application:
Start-up of a speed-dependent load on a supply network (function: Starting).Operating behaviour of open-loop or closed-loop drives with speed-dependent loads (function: Duty)
Starting of a speed-dependent machine load on a supply network
The operating mode of load simulation Starting is intended for asynchronous motors that are started and operated direct
Instruction sheet 773 1900 15 / 31
© by LD DIDACTIC GmbH · Leyboldstraße 1 · D-50354 Hürth · www.ld-didactic.com
Tel: +49-2233-604-0 · Fax: +49-2233-604-222 · Email: [email protected] · Technical alterations reserved
•
•
•
•••••
••••••
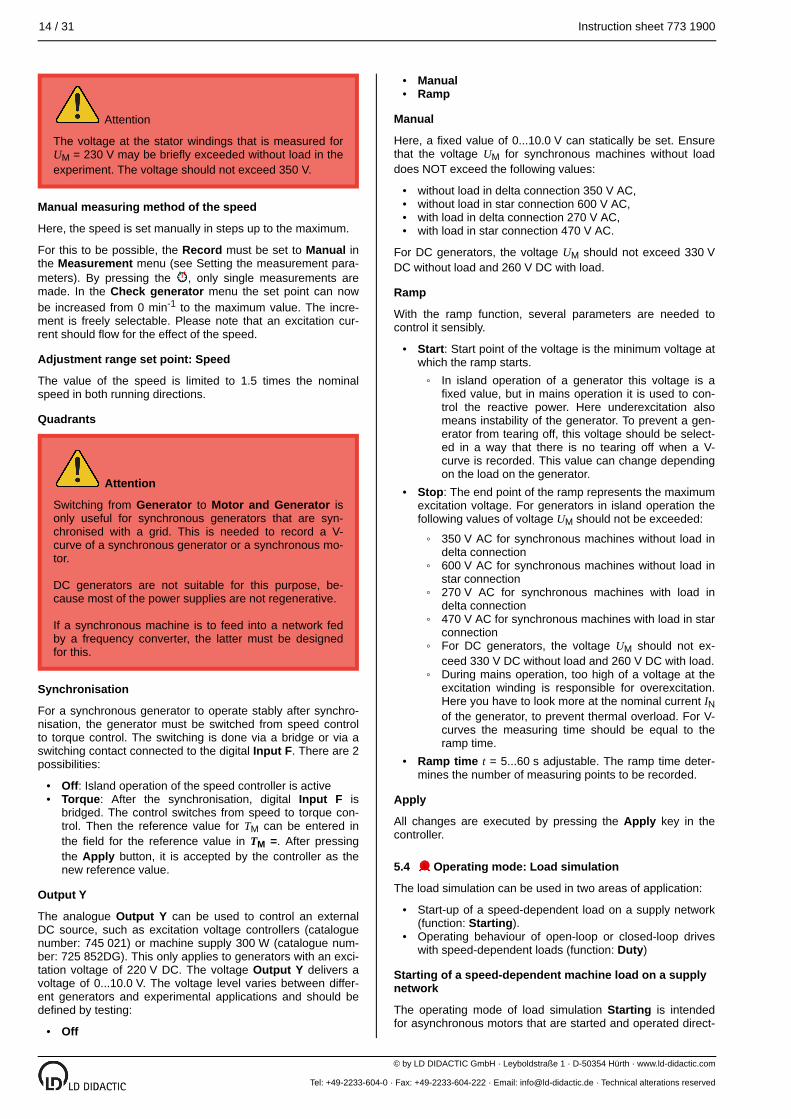
ly from the mains. The extreme switch-on behaviour, which is determined by the starting torque of the asynchronous motor and the moment of inertia, cannot be demonstrated with direct torque control. Switching on a motor is like a step response, to which the moment of inertia of the test set-up responds directly. The acceleration of the machine is determined by the motor characteristic, but is decelerated by the moment of inertia. After reaching the pull-out torque, the machine accelerates until it reaches the operating point.
Attention
The Starting function may only be executed if the Machine Test CASSY switches on the motor via the relay at the start of the measurement.
(1): Compensation of the moment of inertia via an e-function.(2): Acceleration of the machines through the torque of the motor.(3): After the pull-out torque, the torque and acceleration drop until the operating point is reached.
The analysis of the starting procedure with star-delta connection, soft start, slip ring rotor or starting with frequency converter is possible.
The following simulations for load characteristics are available:
Constant TL ~ 1Linear TL ~nM
Square TL ~nM2
Fly wheelWeighted sum
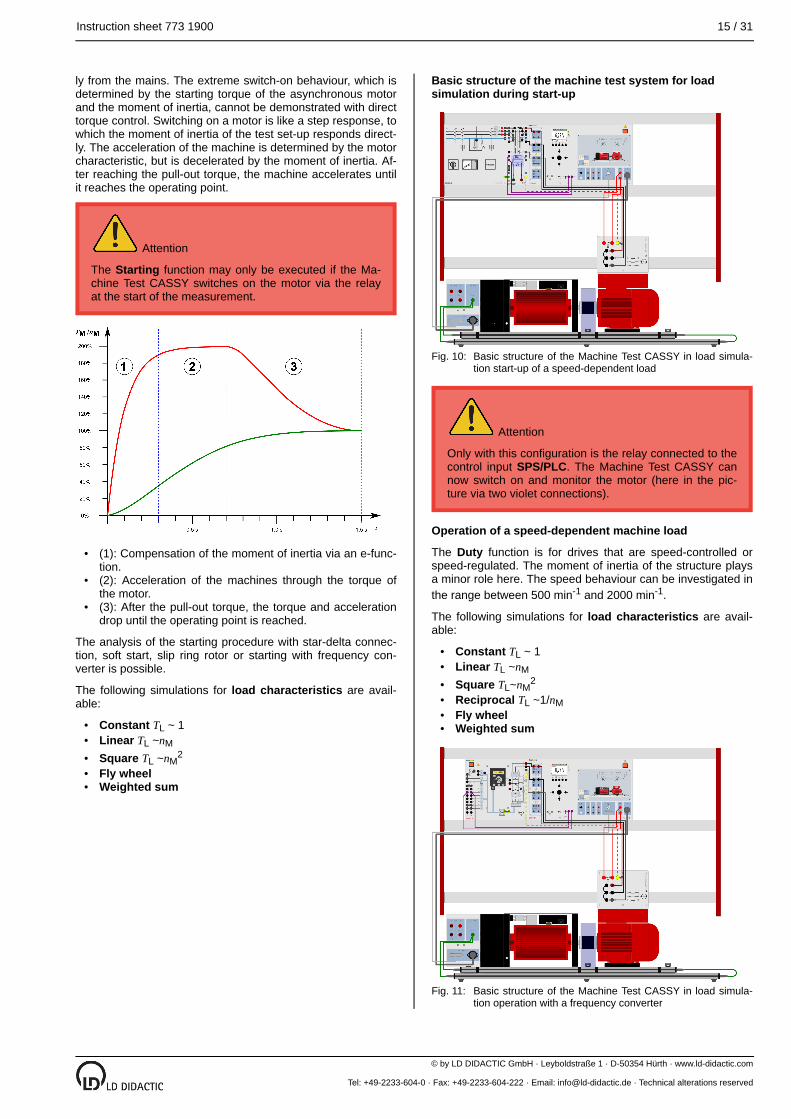
Basic structure of the machine test system for load simulation during start-up
Basic structure of the Machine Test CASSY in load simulation start-up of a speed-dependent load
Attention
Only with this configuration is the relay connected to the control input SPS/PLC. The Machine Test CASSY can now switch on and monitor the motor (here in the picture via two violet connections).
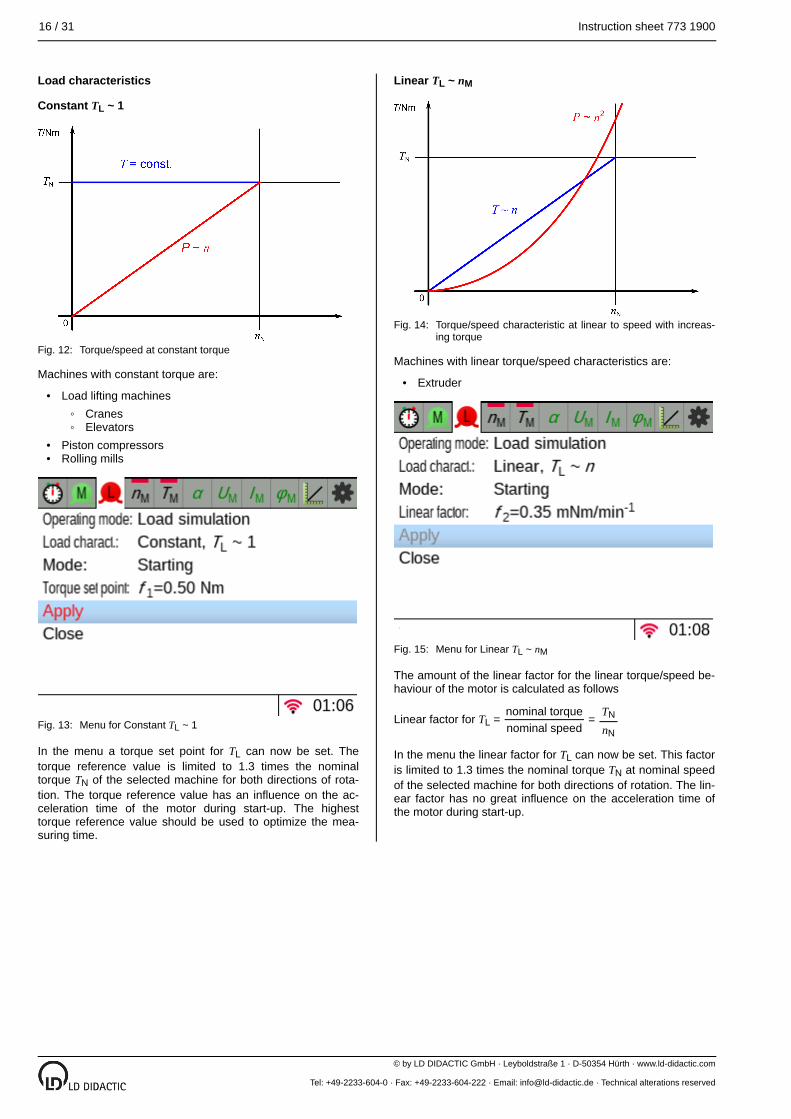
Operation of a speed-dependent machine load
The Duty function is for drives that are speed-controlled or speed-regulated. The moment of inertia of the structure plays a minor role here. The speed behaviour can be investigated in the range between 500 min-1 and 2000 min-1.
The following simulations for load characteristics are available:
Constant TL ~ 1Linear TL ~nM
Square TL~nM2
Reciprocal TL ~1/nMFly wheelWeighted sum
Basic structure of the Machine Test CASSY in load simulation operation with a frequency converter
Fig. 10:
Fig. 11:
16 / 31 Instruction sheet 773 1900
© by LD DIDACTIC GmbH · Leyboldstraße 1 · D-50354 Hürth · www.ld-didactic.com
Tel: +49-2233-604-0 · Fax: +49-2233-604-222 · Email: [email protected] · Technical alterations reserved
•◦◦
••
•
Load characteristics
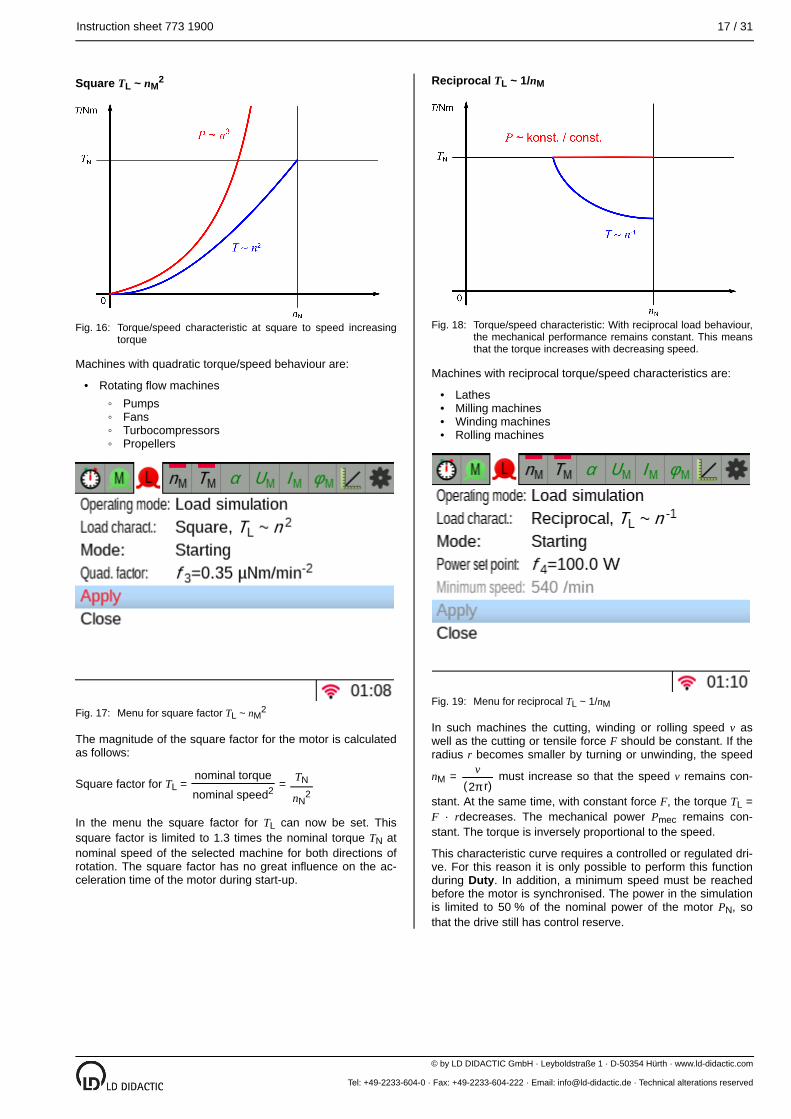
Constant TL ~ 1
Torque/speed at constant torque
Machines with constant torque are:
Load lifting machinesCranesElevators
Piston compressorsRolling mills
Menu for Constant TL ~ 1
In the menu a torque set point for TL can now be set. The torque reference value is limited to 1.3 times the nominal torque TN of the selected machine for both directions of rotation. The torque reference value has an influence on the acceleration time of the motor during start-up. The highest torque reference value should be used to optimize the measuring time.
Linear TL ~ nM
Torque/speed characteristic at linear to speed with increasing torque
Machines with linear torque/speed characteristics are:
Extruder
Menu for Linear TL ~ nM
The amount of the linear factor for the linear torque/speed behaviour of the motor is calculated as follows
Linear factor for TL = =
In the menu the linear factor for TL can now be set. This factor is limited to 1.3 times the nominal torque TN at nominal speed of the selected machine for both directions of rotation. The linear factor has no great influence on the acceleration time of the motor during start-up.
Fig. 12:
Fig. 13:
Fig. 14:
Fig. 15:
nominal torquenominal speed
TN
nN
Instruction sheet 773 1900 17 / 31
© by LD DIDACTIC GmbH · Leyboldstraße 1 · D-50354 Hürth · www.ld-didactic.com
Tel: +49-2233-604-0 · Fax: +49-2233-604-222 · Email: [email protected] · Technical alterations reserved
•◦◦◦◦
••••
Square TL ~ nM2
Torque/speed characteristic at square to speed increasing torque
Machines with quadratic torque/speed behaviour are:
Rotating flow machinesPumpsFansTurbocompressorsPropellers
Menu for square factor TL ~ nM2
The magnitude of the square factor for the motor is calculated as follows:
Square factor for TL = =
In the menu the square factor for TL can now be set. This square factor is limited to 1.3 times the nominal torque TN at nominal speed of the selected machine for both directions of rotation. The square factor has no great influence on the acceleration time of the motor during start-up.
Reciprocal TL ~ 1/nM
Torque/speed characteristic: With reciprocal load behaviour, the mechanical performance remains constant. This means that the torque increases with decreasing speed.
Machines with reciprocal torque/speed characteristics are:
LathesMilling machinesWinding machinesRolling machines
Menu for reciprocal TL ~ 1/nM
In such machines the cutting, winding or rolling speed v as well as the cutting or tensile force F should be constant. If the radius r becomes smaller by turning or unwinding, the speed
nM = must increase so that the speed v remains con
stant. At the same time, with constant force F, the torque TL = F · rdecreases. The mechanical power Pmec remains constant. The torque is inversely proportional to the speed.
This characteristic curve requires a controlled or regulated drive. For this reason it is only possible to perform this function during Duty. In addition, a minimum speed must be reached before the motor is synchronised. The power in the simulation is limited to 50 % of the nominal power of the motor PN, so that the drive still has control reserve.
Fig. 16:
Fig. 17:
nominal torque
nominal speed2TN
nN2
Fig. 18:
Fig. 19:
v( r)2π
18 / 31 Instruction sheet 773 1900
© by LD DIDACTIC GmbH · Leyboldstraße 1 · D-50354 Hürth · www.ld-didactic.com
Tel: +49-2233-604-0 · Fax: +49-2233-604-222 · Email: [email protected] · Technical alterations reserved
•••
◦◦
•
•◦
◦
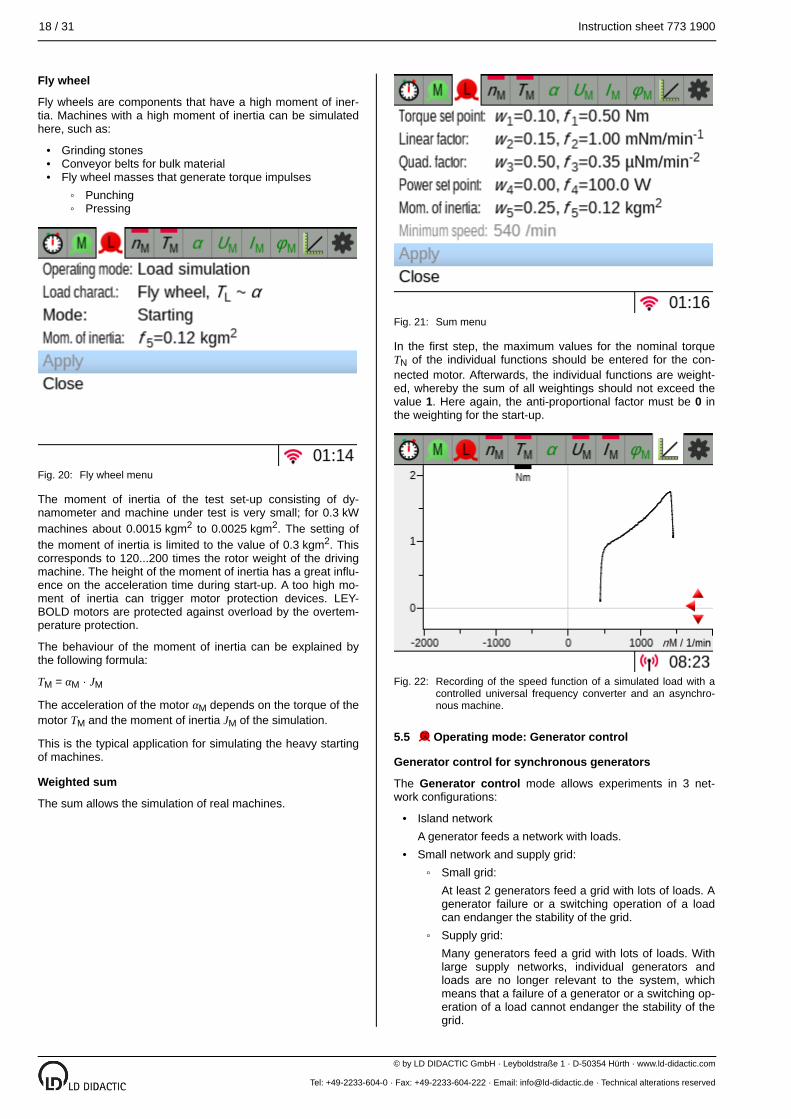
Fly wheel
Fly wheels are components that have a high moment of inertia. Machines with a high moment of inertia can be simulated here, such as:
Grinding stonesConveyor belts for bulk materialFly wheel masses that generate torque impulses
PunchingPressing
Fly wheel menu
The moment of inertia of the test set-up consisting of dynamometer and machine under test is very small; for 0.3 kW machines about 0.0015 kgm2 to 0.0025 kgm2. The setting of the moment of inertia is limited to the value of 0.3 kgm2. This corresponds to 120...200 times the rotor weight of the driving machine. The height of the moment of inertia has a great influence on the acceleration time during start-up. A too high moment of inertia can trigger motor protection devices. LEYBOLD motors are protected against overload by the overtemperature protection.
The behaviour of the moment of inertia can be explained by the following formula:
TM = αM · JM
The acceleration of the motor αM depends on the torque of the motor TM and the moment of inertia JM of the simulation.
This is the typical application for simulating the heavy starting of machines.
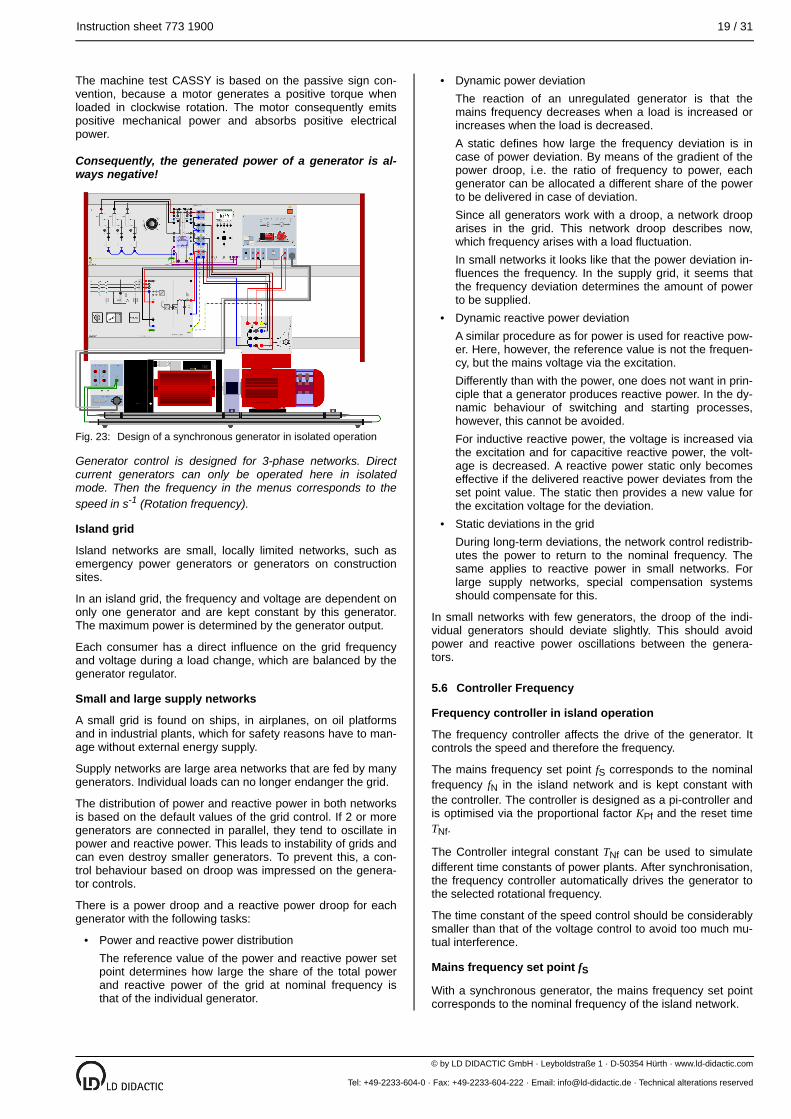
Weighted sum
The sum allows the simulation of real machines.
Sum menu
In the first step, the maximum values for the nominal torque TN of the individual functions should be entered for the connected motor. Afterwards, the individual functions are weighted, whereby the sum of all weightings should not exceed the value 1. Here again, the anti-proportional factor must be 0 in the weighting for the start-up.
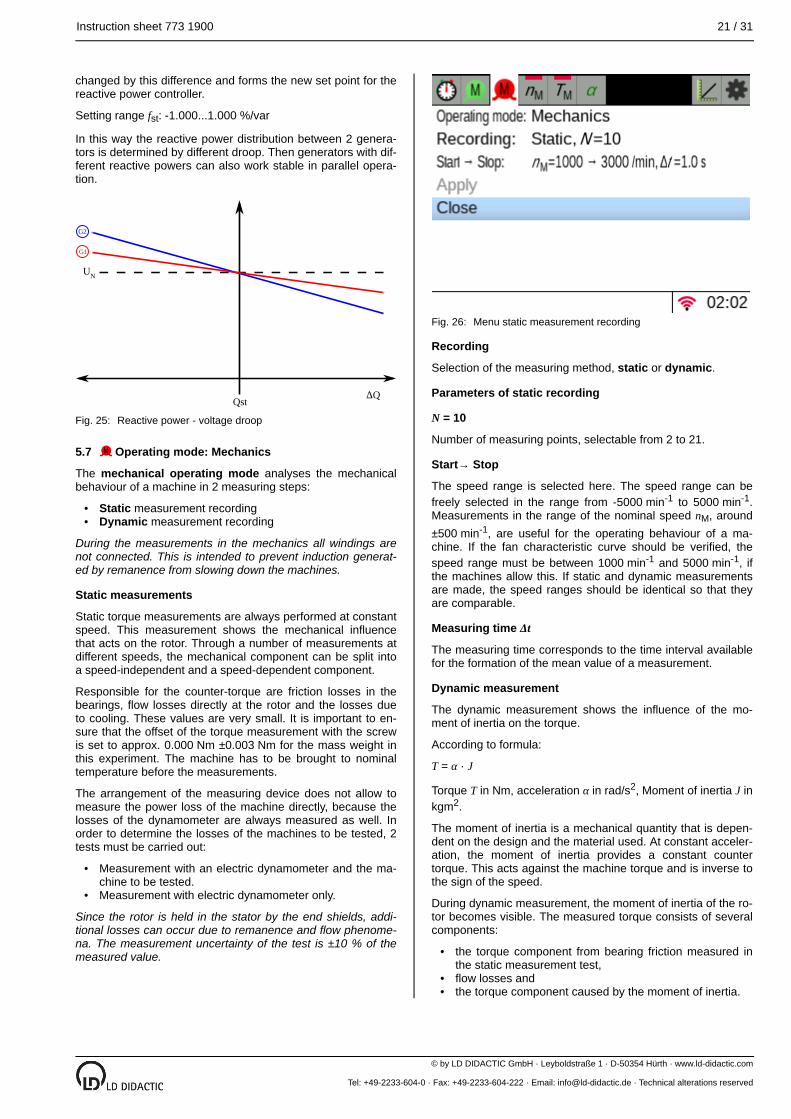
Recording of the speed function of a simulated load with a controlled universal frequency converter and an asynchronous machine.
5.5 Operating mode: Generator control
Generator control for synchronous generators
The Generator control mode allows experiments in 3 network configurations:
Island networkA generator feeds a network with loads.Small network and supply grid:
Small grid:At least 2 generators feed a grid with lots of loads. A generator failure or a switching operation of a load can endanger the stability of the grid.Supply grid:Many generators feed a grid with lots of loads. With large supply networks, individual generators and loads are no longer relevant to the system, which means that a failure of a generator or a switching operation of a load cannot endanger the stability of the grid.
Fig. 20:
Fig. 21:
Fig. 22:
Instruction sheet 773 1900 19 / 31
© by LD DIDACTIC GmbH · Leyboldstraße 1 · D-50354 Hürth · www.ld-didactic.com
Tel: +49-2233-604-0 · Fax: +49-2233-604-222 · Email: [email protected] · Technical alterations reserved
•
•
•
•
The machine test CASSY is based on the passive sign convention, because a motor generates a positive torque when loaded in clockwise rotation. The motor consequently emits positive mechanical power and absorbs positive electrical power.
Consequently, the generated power of a generator is always negative!
Design of a synchronous generator in isolated operation
Generator control is designed for 3-phase networks. Direct current generators can only be operated here in isolated mode. Then the frequency in the menus corresponds to the speed in s-1 (Rotation frequency).
Island grid
Island networks are small, locally limited networks, such as emergency power generators or generators on construction sites.
In an island grid, the frequency and voltage are dependent on only one generator and are kept constant by this generator. The maximum power is determined by the generator output.
Each consumer has a direct influence on the grid frequency and voltage during a load change, which are balanced by the generator regulator.
Small and large supply networks
A small grid is found on ships, in airplanes, on oil platforms and in industrial plants, which for safety reasons have to manage without external energy supply.
Supply networks are large area networks that are fed by many generators. Individual loads can no longer endanger the grid.
The distribution of power and reactive power in both networks is based on the default values of the grid control. If 2 or more generators are connected in parallel, they tend to oscillate in power and reactive power. This leads to instability of grids and can even destroy smaller generators. To prevent this, a control behaviour based on droop was impressed on the generator controls.
There is a power droop and a reactive power droop for each generator with the following tasks:
Power and reactive power distributionThe reference value of the power and reactive power set point determines how large the share of the total power and reactive power of the grid at nominal frequency is that of the individual generator.
Dynamic power deviationThe reaction of an unregulated generator is that the mains frequency decreases when a load is increased or increases when the load is decreased.A static defines how large the frequency deviation is in case of power deviation. By means of the gradient of the power droop, i.e. the ratio of frequency to power, each generator can be allocated a different share of the power to be delivered in case of deviation.Since all generators work with a droop, a network droop arises in the grid. This network droop describes now, which frequency arises with a load fluctuation.In small networks it looks like that the power deviation influences the frequency. In the supply grid, it seems that the frequency deviation determines the amount of power to be supplied.Dynamic reactive power deviationA similar procedure as for power is used for reactive power. Here, however, the reference value is not the frequency, but the mains voltage via the excitation.Differently than with the power, one does not want in principle that a generator produces reactive power. In the dynamic behaviour of switching and starting processes, however, this cannot be avoided.For inductive reactive power, the voltage is increased via the excitation and for capacitive reactive power, the voltage is decreased. A reactive power static only becomes effective if the delivered reactive power deviates from the set point value. The static then provides a new value for the excitation voltage for the deviation.Static deviations in the gridDuring long-term deviations, the network control redistributes the power to return to the nominal frequency. The same applies to reactive power in small networks. For large supply networks, special compensation systems should compensate for this.
In small networks with few generators, the droop of the individual generators should deviate slightly. This should avoid power and reactive power oscillations between the generators.
5.6 Controller Frequency
Frequency controller in island operation
The frequency controller affects the drive of the generator. It controls the speed and therefore the frequency.
The mains frequency set point fS corresponds to the nominal frequency fN in the island network and is kept constant with the controller. The controller is designed as a pi-controller and is optimised via the proportional factor KPf and the reset time TNf.
The Controller integral constant TNf can be used to simulate different time constants of power plants. After synchronisation, the frequency controller automatically drives the generator to the selected rotational frequency.
The time constant of the speed control should be considerably smaller than that of the voltage control to avoid too much mutual interference.
Mains frequency set point fS
With a synchronous generator, the mains frequency set point corresponds to the nominal frequency of the island network.
Fig. 23:

20 / 31 Instruction sheet 773 1900
© by LD DIDACTIC GmbH · Leyboldstraße 1 · D-50354 Hürth · www.ld-didactic.com
Tel: +49-2233-604-0 · Fax: +49-2233-604-222 · Email: [email protected] · Technical alterations reserved
In a grid with a DC generator, this corresponds to the nominal rotational frequency in revolutions per second s-1 fNn =
.
Adjustment range mains frequency set point: 100...+100 Hz
Controller proportional constant KPf
Setting range: 0.000...5
Controller integral constant TNf
Setting range: 0.01...1000 s
Frequency controller in small mains operation and mains operation
After synchronisation, a frequency controller becomes a power controller with frequency power droop. A power droop becomes effective only if the delivered power deviates from the set point value. The static then provides a new value for the deviation for the speed of the generator and thus for the frequency of the grid. The time constant of the power control should be significantly smaller than that of the reactive power controller to avoid too much mutual interference.
Frequency power droop fst
The frequency power droop define how large the power deviation ΔP is in case of a frequency deviation Δf or how large the frequency deviation Δf is in case of a power deviation ΔP.
Setting range fst: 1.000...1.000 %/W
Reference power PS
The reference power PS is the value that the generator should deliver to the grid at nominal frequency.
Setting range PS: 0...600 W
The reference power must not exceed the nominal power PN.
Power or frequency static
Voltage regulator
Voltage regulator in isolated operation
The voltage regulator acts on the excitation of the generator. The generator voltage depends on the speed and the excitation current. At a constant speed, the generator voltage is only dependent on the excitation current. The controller is designed as a pi-controller and is optimised via the proportional factor KPf and the reset time TNf. The reset time TNf can be used to simulate different time constants of power plants. After
synchronisation, the frequency controller automatically drives the generator to the selected rotational frequency.
In island operation the frequency is constantly controlled. The frequency deviation caused by load fluctuation is compensated by the proportional controller with the proportional constant KPfand the reset time TNf. This allows the user to optimize the generator for his application.
The voltage regulator in isolated operation has to compensate the internal voltage drop of DC generators.
With synchronous generators, the load-dependent voltage behaviour of the reactive power is added. After synchronisation, the frequency controller automatically drives the generator to the selected rotational frequency. Only then will the voltage regulator regulate the mains voltage.
A generator must produce the reactive power required for a grid. As already applied with the power of the generator, the consumer counting arrow system is used and the signs of the generated reactive power are inverted, for example generated inductive reactive power is negative.
In island operation, the voltage is constantly regulated. The voltage deviations caused by load fluctuations are compensated by the controller with the proportional constant KPU and the reset time TNU . This allows the user to optimize the generator for his application.
The time constant of the voltage control should be considerably larger than that of the frequency control to avoid too much mutual interference.
Mains voltage set point US
With a synchronous generator and DC generator, the mains voltage set point corresponds to the nominal voltage of the island network. This is specified in volts.
Adjustment range mains voltage set point: 0...+500 V
Controller proportional constant KPU
Setting range: 0.00...5
Controller integral constant TNU
Setting range: 0.01...1000 s
Reactive power controller in small mains operation and mains operation
After synchronisation, a voltage regulator becomes a reactive power control with voltage reactive power droop, which controls the reactive power to be supplied according to the reactive power set point and the reactive power droop. The time constant of the reactive power control has to be considerably smaller than that of the power controller to avoid too much mutual interference.
Reactive power set point QS
The reactive power set point QS is the value that the generator should deliver to the grid at nominal frequency.
Reactive power set point range QS: 0...±600 var
The current of the machines should not exceed 1.5 times the nominal current.
Reactive power static Qst
The reactive power statistic indicates the magnitude of the reactive power deviation ΔQ proportional to the deviation of the instantaneous value of the reactive power qM to the specified reference reactive power QS in %/var. The excitation is
nN
60 s/min-1
Fig. 24:
Instruction sheet 773 1900 21 / 31
© by LD DIDACTIC GmbH · Leyboldstraße 1 · D-50354 Hürth · www.ld-didactic.com
Tel: +49-2233-604-0 · Fax: +49-2233-604-222 · Email: [email protected] · Technical alterations reserved
••
•
•
•
••
changed by this difference and forms the new set point for the reactive power controller.
Setting range fst: 1.000...1.000 %/var
In this way the reactive power distribution between 2 generators is determined by different droop. Then generators with different reactive powers can also work stable in parallel operation.
Reactive power - voltage droop
5.7 Operating mode: Mechanics
The mechanical operating mode analyses the mechanical behaviour of a machine in 2 measuring steps:
Static measurement recordingDynamic measurement recording
During the measurements in the mechanics all windings are not connected. This is intended to prevent induction generated by remanence from slowing down the machines.
Static measurements
Static torque measurements are always performed at constant speed. This measurement shows the mechanical influence that acts on the rotor. Through a number of measurements at different speeds, the mechanical component can be split into a speed-independent and a speed-dependent component.
Responsible for the counter-torque are friction losses in the bearings, flow losses directly at the rotor and the losses due to cooling. These values are very small. It is important to ensure that the offset of the torque measurement with the screw is set to approx. 0.000 Nm ±0.003 Nm for the mass weight in this experiment. The machine has to be brought to nominal temperature before the measurements.
The arrangement of the measuring device does not allow to measure the power loss of the machine directly, because the losses of the dynamometer are always measured as well. In order to determine the losses of the machines to be tested, 2 tests must be carried out:
Measurement with an electric dynamometer and the machine to be tested.Measurement with electric dynamometer only.
Since the rotor is held in the stator by the end shields, additional losses can occur due to remanence and flow phenomena. The measurement uncertainty of the test is ±10 % of the measured value.
Menu static measurement recording
Recording
Selection of the measuring method, static or dynamic.
Parameters of static recording
N = 10
Number of measuring points, selectable from 2 to 21.
Start→ Stop
The speed range is selected here. The speed range can be freely selected in the range from 5000 min-1 to 5000 min-1. Measurements in the range of the nominal speed nM, around ±500 min-1, are useful for the operating behaviour of a machine. If the fan characteristic curve should be verified, the speed range must be between 1000 min-1 and 5000 min-1, if the machines allow this. If static and dynamic measurements are made, the speed ranges should be identical so that they are comparable.
Measuring time Δt
The measuring time corresponds to the time interval available for the formation of the mean value of a measurement.
Dynamic measurement
The dynamic measurement shows the influence of the moment of inertia on the torque.
According to formula:
T = α · J
Torque T in Nm, acceleration α in rad/s2, Moment of inertia J in kgm2.
The moment of inertia is a mechanical quantity that is dependent on the design and the material used. At constant acceleration, the moment of inertia provides a constant counter torque. This acts against the machine torque and is inverse to the sign of the speed.
During dynamic measurement, the moment of inertia of the rotor becomes visible. The measured torque consists of several components:
the torque component from bearing friction measured in the static measurement test,flow losses andthe torque component caused by the moment of inertia.
Fig. 25:
Fig. 26:
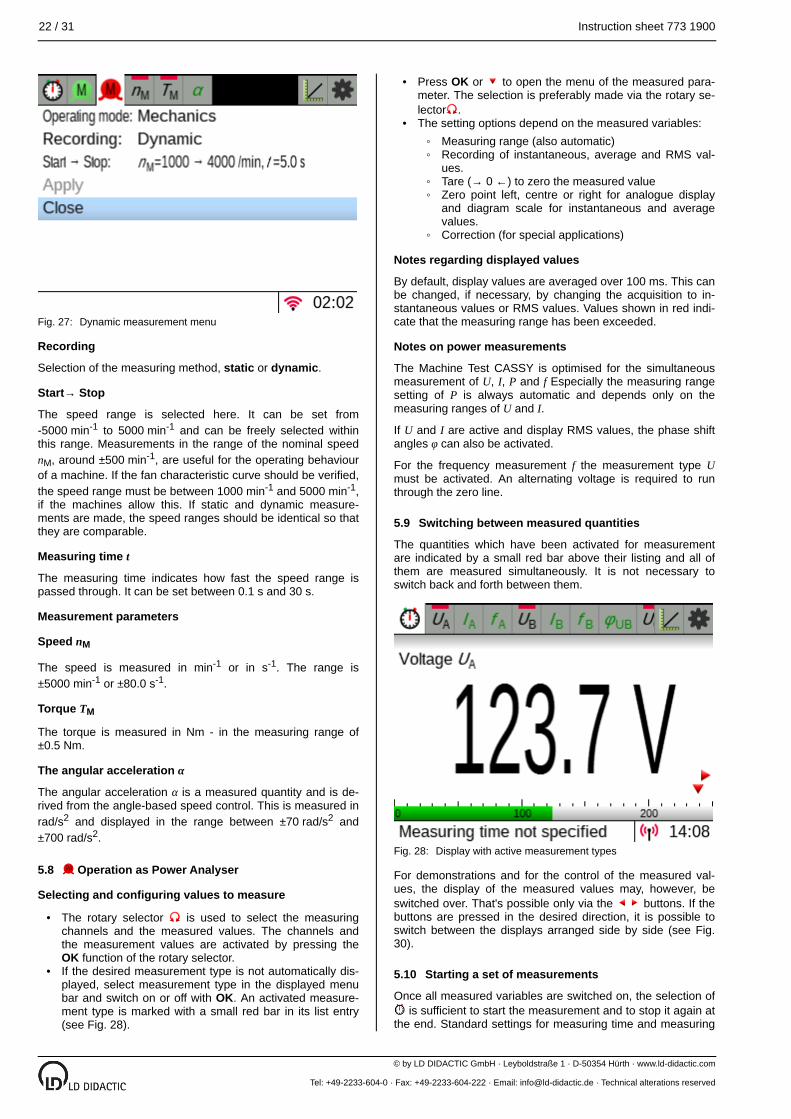
22 / 31 Instruction sheet 773 1900
© by LD DIDACTIC GmbH · Leyboldstraße 1 · D-50354 Hürth · www.ld-didactic.com
Tel: +49-2233-604-0 · Fax: +49-2233-604-222 · Email: [email protected] · Technical alterations reserved
•
•
•
•◦◦
◦◦
◦
Dynamic measurement menu
Recording
Selection of the measuring method, static or dynamic.
Start→ Stop
The speed range is selected here. It can be set from 5000 min-1 to 5000 min-1 and can be freely selected within this range. Measurements in the range of the nominal speed nM, around ±500 min-1, are useful for the operating behaviour of a machine. If the fan characteristic curve should be verified, the speed range must be between 1000 min-1 and 5000 min-1, if the machines allow this. If static and dynamic measurements are made, the speed ranges should be identical so that they are comparable.
Measuring time t
The measuring time indicates how fast the speed range is passed through. It can be set between 0.1 s and 30 s.
Measurement parameters
Speed nM
The speed is measured in min-1 or in s-1. The range is ±5000 min-1 or ±80.0 s-1.
Torque TM
The torque is measured in Nm - in the measuring range of ±0.5 Nm.
The angular acceleration α
The angular acceleration α is a measured quantity and is derived from the angle-based speed control. This is measured in rad/s2 and displayed in the range between ±70 rad/s2 and ±700 rad/s2.
5.8 Operation as Power Analyser
Selecting and configuring values to measure
The rotary selector is used to select the measuring channels and the measured values. The channels and the measurement values are activated by pressing the OK function of the rotary selector.If the desired measurement type is not automatically displayed, select measurement type in the displayed menu bar and switch on or off with OK. An activated measurement type is marked with a small red bar in its list entry (see Fig. 28).
Press OK or to open the menu of the measured parameter. The selection is preferably made via the rotary selector .The setting options depend on the measured variables:
Measuring range (also automatic)Recording of instantaneous, average and RMS values.Tare (→ 0 ←) to zero the measured valueZero point left, centre or right for analogue display and diagram scale for instantaneous and average values.Correction (for special applications)
Notes regarding displayed values
By default, display values are averaged over 100 ms. This can be changed, if necessary, by changing the acquisition to instantaneous values or RMS values. Values shown in red indicate that the measuring range has been exceeded.
Notes on power measurements
The Machine Test CASSY is optimised for the simultaneous measurement of U, I, P and f Especially the measuring range setting of P is always automatic and depends only on the measuring ranges of U and I.
If U and I are active and display RMS values, the phase shift angles φ can also be activated.
For the frequency measurement f the measurement type Umust be activated. An alternating voltage is required to run through the zero line.
5.9 Switching between measured quantities
The quantities which have been activated for measurement are indicated by a small red bar above their listing and all of them are measured simultaneously. It is not necessary to switch back and forth between them.
Display with active measurement types
For demonstrations and for the control of the measured values, the display of the measured values may, however, be switched over. That's possible only via the buttons. If the buttons are pressed in the desired direction, it is possible to switch between the displays arranged side by side (see Fig. 30).
5.10 Starting a set of measurements
Once all measured variables are switched on, the selection of is sufficient to start the measurement and to stop it again at
the end. Standard settings for measuring time and measuring
Fig. 27:
Fig. 28:
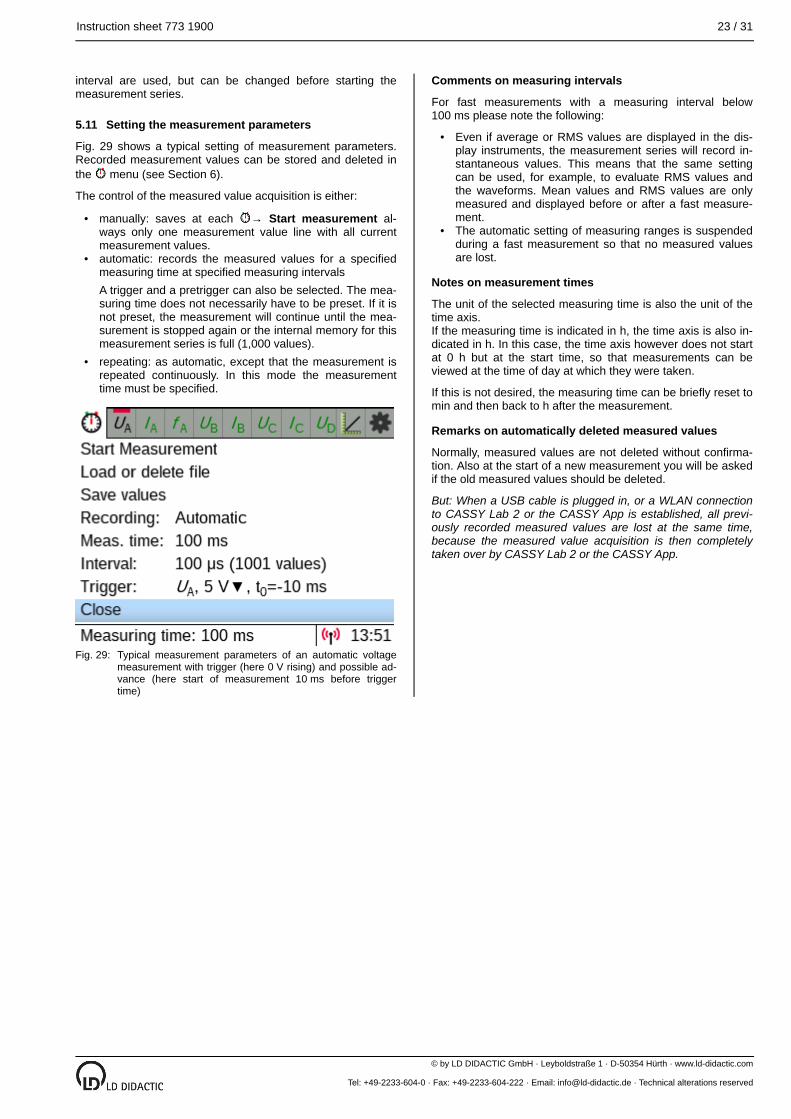
Instruction sheet 773 1900 23 / 31
© by LD DIDACTIC GmbH · Leyboldstraße 1 · D-50354 Hürth · www.ld-didactic.com
Tel: +49-2233-604-0 · Fax: +49-2233-604-222 · Email: [email protected] · Technical alterations reserved
•
•
•
•
•
interval are used, but can be changed before starting the measurement series.
5.11 Setting the measurement parameters
Fig. 29 shows a typical setting of measurement parameters. Recorded measurement values can be stored and deleted in the menu (see Section 6).
The control of the measured value acquisition is either:
manually: saves at each → Start measurement always only one measurement value line with all current measurement values.automatic: records the measured values for a specified measuring time at specified measuring intervalsA trigger and a pretrigger can also be selected. The measuring time does not necessarily have to be preset. If it is not preset, the measurement will continue until the measurement is stopped again or the internal memory for this measurement series is full (1,000 values).repeating: as automatic, except that the measurement is repeated continuously. In this mode the measurement time must be specified.
Typical measurement parameters of an automatic voltage measurement with trigger (here 0 V rising) and possible advance (here start of measurement 10 ms before trigger time)
Comments on measuring intervals
For fast measurements with a measuring interval below 100 ms please note the following:
Even if average or RMS values are displayed in the display instruments, the measurement series will record instantaneous values. This means that the same setting can be used, for example, to evaluate RMS values and the waveforms. Mean values and RMS values are only measured and displayed before or after a fast measurement.The automatic setting of measuring ranges is suspended during a fast measurement so that no measured values are lost.
Notes on measurement times
The unit of the selected measuring time is also the unit of the time axis. If the measuring time is indicated in h, the time axis is also indicated in h. In this case, the time axis however does not start at 0 h but at the start time, so that measurements can be viewed at the time of day at which they were taken.
If this is not desired, the measuring time can be briefly reset to min and then back to h after the measurement.
Remarks on automatically deleted measured values
Normally, measured values are not deleted without confirmation. Also at the start of a new measurement you will be asked if the old measured values should be deleted.
But: When a USB cable is plugged in, or a WLAN connection to CASSY Lab 2 or the CASSY App is established, all previously recorded measured values are lost at the same time, because the measured value acquisition is then completely taken over by CASSY Lab 2 or the CASSY App.
Fig. 29:

24 / 31 Instruction sheet 773 1900
© by LD DIDACTIC GmbH · Leyboldstraße 1 · D-50354 Hürth · www.ld-didactic.com
Tel: +49-2233-604-0 · Fax: +49-2233-604-222 · Email: [email protected] · Technical alterations reserved
••
•
To the right of a measured value display there are further displays of possibly active measured variables, the measured value table and on the far right the diagram. The and buttons allow you to switch between the displays.
5.12 Evaluation in the table
The table is located to the right of the measured value displays and can be accessed using the and arrow keys (see Fig. 30).
The table menu is always selectable via (View: Table) or accessible from the table view via .
All activated measured variables are stored internally. But only a maximum of 4 measured values and the time axis can be displayed. The columns can be freely selected via the table menu. If you want to scroll in large tables, you have to set Scroll manual via the table menu. The table will be displayed immediately and you can scroll in the table with . When scrolling automatic, the last measured row is always displayed as bottom row.
5.13 Evaluation in the diagram
The diagram is located to the right of the table and can be accessed via the arrow key (see Fig. 30).
Normally, all activated measured variables land in the diagram. This can be changed in the diagram menu.
The table menu is always selectable via (View: Diagram) or accessible from the diagram view via .
There you can select different evaluations (e.g. zoom, line fitting, integrals) which refer to the current range of the measurement curve.
By default this range is the complete first (black) curve. However, it can be changed by range and selection of the measurement curve.
After selection of the range function in the diagram menu, the rotary selector takes over the selection function of the range start and the range end with OK until either both limits are set or the selection is aborted with the Cursor buttons.
When more than one measurement curve is displayed at the same time, a second y-axis is automatically displayed if the display range of the second curve differs from the first curve. The colour of the scale values of the second y-axis corresponds to the colour of the curve to which that axis belongs.
Note on evaluations
As long as no area is marked, the zoom function zooms all y-axes but no x-axes. Only when a range has been marked, the x-axis is zoomed as well.
Several evaluations can be performed one after the other without deleting the previous one. The last evaluation result is displayed in the status line below the diagram.
5.14 Switch off
The Machine Test CASSY is switched on and off via the power switch.
When switched off, the current measurement series and the current settings are lost. Stored measurement series are of course retained.
6 Save
A recorded measurement series can be saved in the menu (see Fig. 29). The assigned file name is displayed.
The file is saved either on a connected FAT-formatted USB stick or on the internal SD card in the subdirectory Examples (*.labm) or Data (*.txt). Writing to the internal SD card is only possible if the Machine Test CASSY is not connected to a computer.
If the Machine Test CASSY is connected to a computer via USB, the internal SD card is available there as a drive for read and write accesses.
If the file was saved as *.labm, then it contains all settings in addition to the measurement data and can be read again by the Machine Test CASSY. If subdirectories exist for the Examples directory, they can be selected in the first level. Furthermore, a test manual can be integrated with Mobile Edit (see Section 10.2).
If the file was saved as *.txt, it can be read with many common programs. The easiest way is to drag and drop this file onto an open CASSY Lab 2 (see Section 10.7).
The demo version of CASSY Lab 2 is sufficient for this. No activation code is required.
7 Meaning of the light emitting diodes
The light emitting diodes next to the display indicate different operating states:
Green: Lights up briefly at the moment of switch-on.Flashing green: During a running measurement (see Section 5.10) or a firmware update (see Section 11).Yellow: Access to the internal SD card or an external USB stick.
Fig. 30:
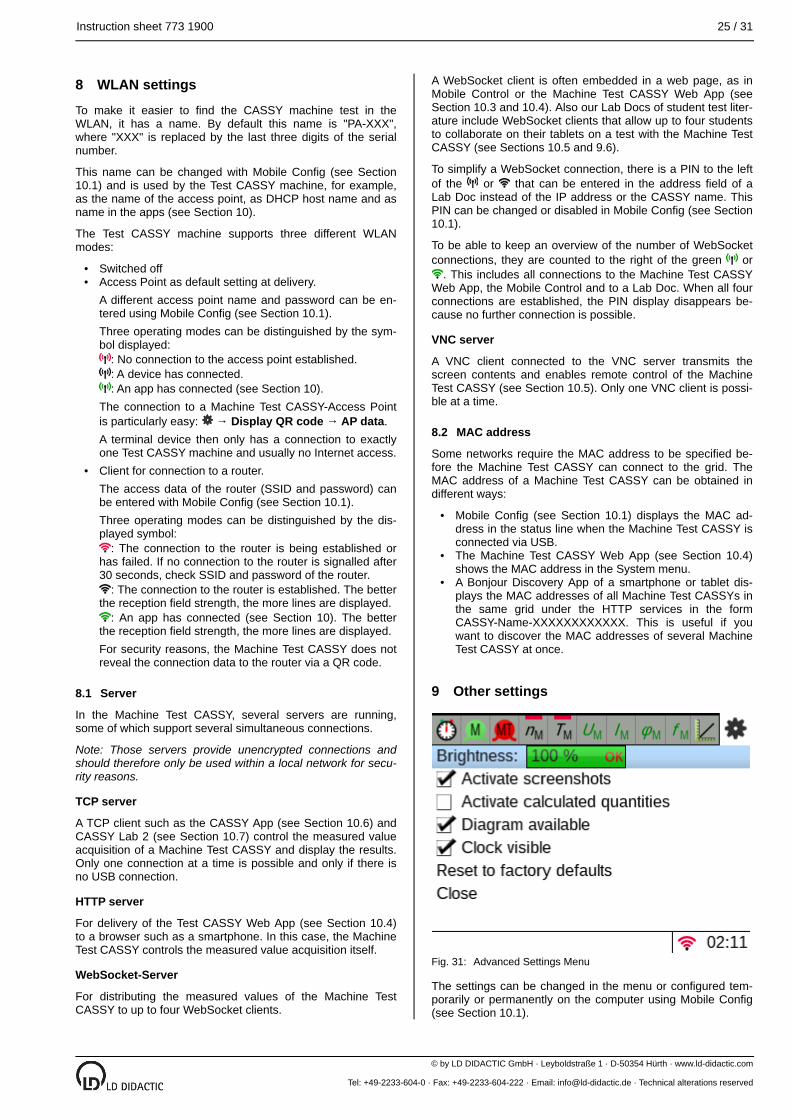
Instruction sheet 773 1900 25 / 31
© by LD DIDACTIC GmbH · Leyboldstraße 1 · D-50354 Hürth · www.ld-didactic.com
Tel: +49-2233-604-0 · Fax: +49-2233-604-222 · Email: [email protected] · Technical alterations reserved
••
•
•
•
•
8 WLAN settings
To make it easier to find the CASSY machine test in the WLAN, it has a name. By default this name is "PA-XXX", where "XXX" is replaced by the last three digits of the serial number.
This name can be changed with Mobile Config (see Section 10.1) and is used by the Test CASSY machine, for example, as the name of the access point, as DHCP host name and as name in the apps (see Section 10).
The Test CASSY machine supports three different WLAN modes:
Switched offAccess Point as default setting at delivery.A different access point name and password can be entered using Mobile Config (see Section 10.1).Three operating modes can be distinguished by the symbol displayed:: No connection to the access point established.: A device has connected.: An app has connected (see Section 10).
The connection to a Machine Test CASSY-Access Point is particularly easy: Display QR code AP data→ → .A terminal device then only has a connection to exactly one Test CASSY machine and usually no Internet access.Client for connection to a router.The access data of the router (SSID and password) can be entered with Mobile Config (see Section 10.1).Three operating modes can be distinguished by the displayed symbol:
: The connection to the router is being established or has failed. If no connection to the router is signalled after 30 seconds, check SSID and password of the router.
: The connection to the router is established. The better the reception field strength, the more lines are displayed.
: An app has connected (see Section 10). The better the reception field strength, the more lines are displayed.For security reasons, the Machine Test CASSY does not reveal the connection data to the router via a QR code.
8.1 Server
In the Machine Test CASSY, several servers are running, some of which support several simultaneous connections.
Note: Those servers provide unencrypted connections and should therefore only be used within a local network for security reasons.
TCP server
A TCP client such as the CASSY App (see Section 10.6) and CASSY Lab 2 (see Section 10.7) control the measured value acquisition of a Machine Test CASSY and display the results. Only one connection at a time is possible and only if there is no USB connection.
HTTP server
For delivery of the Test CASSY Web App (see Section 10.4) to a browser such as a smartphone. In this case, the Machine Test CASSY controls the measured value acquisition itself.
WebSocket-Server
For distributing the measured values of the Machine Test CASSY to up to four WebSocket clients.
A WebSocket client is often embedded in a web page, as in Mobile Control or the Machine Test CASSY Web App (see Section 10.3 and 10.4). Also our Lab Docs of student test literature include WebSocket clients that allow up to four students to collaborate on their tablets on a test with the Machine Test CASSY (see Sections 10.5 and 9.6).
To simplify a WebSocket connection, there is a PIN to the left of the or that can be entered in the address field of a Lab Doc instead of the IP address or the CASSY name. This PIN can be changed or disabled in Mobile Config (see Section 10.1).
To be able to keep an overview of the number of WebSocket connections, they are counted to the right of the green or
. This includes all connections to the Machine Test CASSY Web App, the Mobile Control and to a Lab Doc. When all four connections are established, the PIN display disappears because no further connection is possible.
VNC server
A VNC client connected to the VNC server transmits the screen contents and enables remote control of the Machine Test CASSY (see Section 10.5). Only one VNC client is possible at a time.
8.2 MAC address
Some networks require the MAC address to be specified before the Machine Test CASSY can connect to the grid. The MAC address of a Machine Test CASSY can be obtained in different ways:
Mobile Config (see Section 10.1) displays the MAC address in the status line when the Machine Test CASSY is connected via USB.The Machine Test CASSY Web App (see Section 10.4) shows the MAC address in the System menu.A Bonjour Discovery App of a smartphone or tablet displays the MAC addresses of all Machine Test CASSYs in the same grid under the HTTP services in the form CASSY-Name-XXXXXXXXXXXX. This is useful if you want to discover the MAC addresses of several Machine Test CASSY at once.
9 Other settings
Advanced Settings Menu
The settings can be changed in the menu or configured temporarily or permanently on the computer using Mobile Config (see Section 10.1).
Fig. 31:
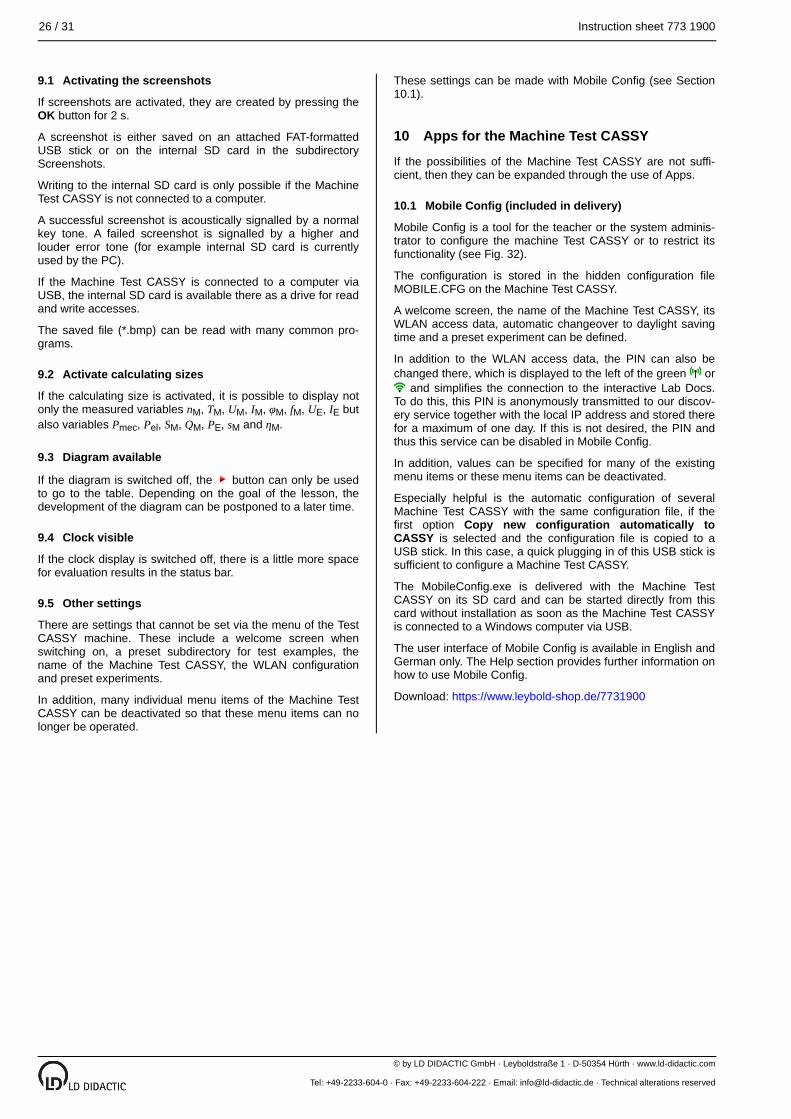
26 / 31 Instruction sheet 773 1900
© by LD DIDACTIC GmbH · Leyboldstraße 1 · D-50354 Hürth · www.ld-didactic.com
Tel: +49-2233-604-0 · Fax: +49-2233-604-222 · Email: [email protected] · Technical alterations reserved
9.1 Activating the screenshots
If screenshots are activated, they are created by pressing the OK button for 2 s.
A screenshot is either saved on an attached FAT-formatted USB stick or on the internal SD card in the subdirectory Screenshots.
Writing to the internal SD card is only possible if the Machine Test CASSY is not connected to a computer.
A successful screenshot is acoustically signalled by a normal key tone. A failed screenshot is signalled by a higher and louder error tone (for example internal SD card is currently used by the PC).
If the Machine Test CASSY is connected to a computer via USB, the internal SD card is available there as a drive for read and write accesses.
The saved file (*.bmp) can be read with many common programs.
9.2 Activate calculating sizes
If the calculating size is activated, it is possible to display not only the measured variables nM, TM, UM, IM, φM, fM, UE, IE but also variables Pmec, Pel, SM, QM, PE, sM and ηM.
9.3 Diagram available
If the diagram is switched off, the button can only be used to go to the table. Depending on the goal of the lesson, the development of the diagram can be postponed to a later time.
9.4 Clock visible
If the clock display is switched off, there is a little more space for evaluation results in the status bar.
9.5 Other settings
There are settings that cannot be set via the menu of the Test CASSY machine. These include a welcome screen when switching on, a preset subdirectory for test examples, the name of the Machine Test CASSY, the WLAN configuration and preset experiments.
In addition, many individual menu items of the Machine Test CASSY can be deactivated so that these menu items can no longer be operated.
These settings can be made with Mobile Config (see Section 10.1).
10 Apps for the Machine Test CASSY
If the possibilities of the Machine Test CASSY are not sufficient, then they can be expanded through the use of Apps.
10.1 Mobile Config (included in delivery)
Mobile Config is a tool for the teacher or the system administrator to configure the machine Test CASSY or to restrict its functionality (see Fig. 32).
The configuration is stored in the hidden configuration file MOBILE.CFG on the Machine Test CASSY.
A welcome screen, the name of the Machine Test CASSY, its WLAN access data, automatic changeover to daylight saving time and a preset experiment can be defined.
In addition to the WLAN access data, the PIN can also be changed there, which is displayed to the left of the green or
and simplifies the connection to the interactive Lab Docs. To do this, this PIN is anonymously transmitted to our discovery service together with the local IP address and stored there for a maximum of one day. If this is not desired, the PIN and thus this service can be disabled in Mobile Config.
In addition, values can be specified for many of the existing menu items or these menu items can be deactivated.
Especially helpful is the automatic configuration of several Machine Test CASSY with the same configuration file, if the first option Copy new configuration automatically to CASSY is selected and the configuration file is copied to a USB stick. In this case, a quick plugging in of this USB stick is sufficient to configure a Machine Test CASSY.
The MobileConfig.exe is delivered with the Machine Test CASSY on its SD card and can be started directly from this card without installation as soon as the Machine Test CASSY is connected to a Windows computer via USB.
The user interface of Mobile Config is available in English and German only. The Help section provides further information on how to use Mobile Config.
Download: https://www.leybold-shop.de/7731900
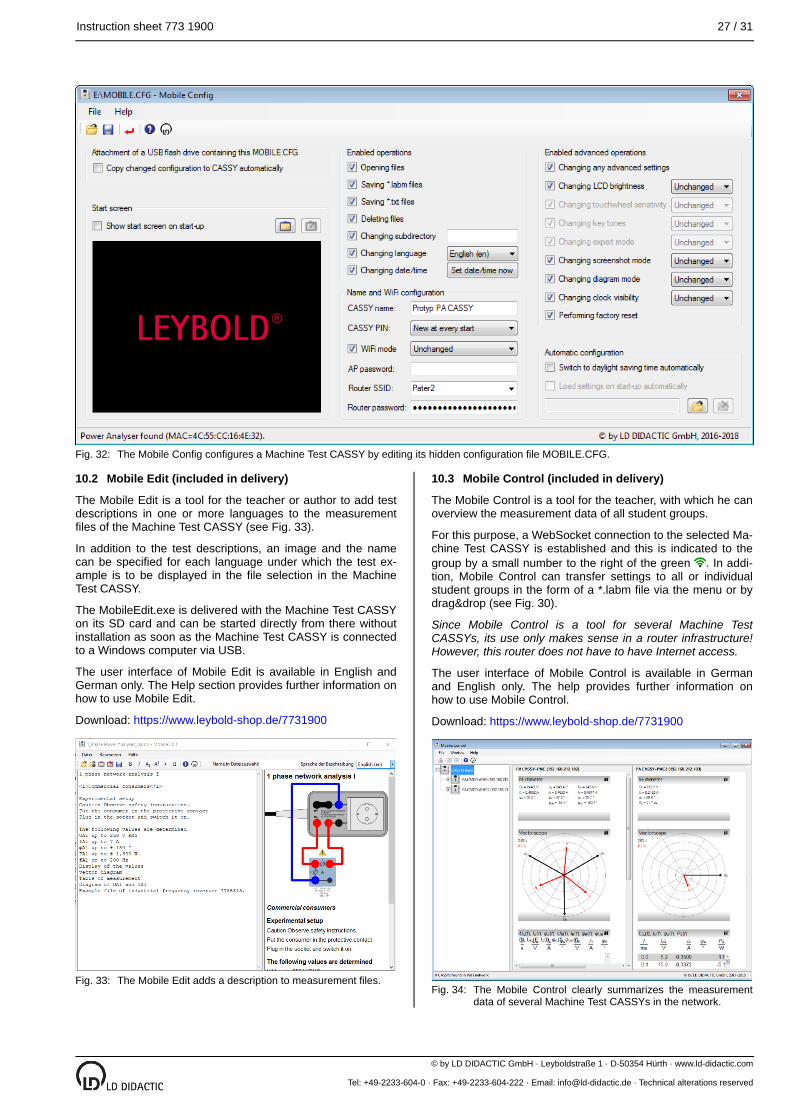
Instruction sheet 773 1900 27 / 31
© by LD DIDACTIC GmbH · Leyboldstraße 1 · D-50354 Hürth · www.ld-didactic.com
Tel: +49-2233-604-0 · Fax: +49-2233-604-222 · Email: [email protected] · Technical alterations reserved
The Mobile Config configures a Machine Test CASSY by editing its hidden configuration file MOBILE.CFG.
10.2 Mobile Edit (included in delivery)
The Mobile Edit is a tool for the teacher or author to add test descriptions in one or more languages to the measurement files of the Machine Test CASSY (see Fig. 33).
In addition to the test descriptions, an image and the name can be specified for each language under which the test example is to be displayed in the file selection in the Machine Test CASSY.
The MobileEdit.exe is delivered with the Machine Test CASSY on its SD card and can be started directly from there without installation as soon as the Machine Test CASSY is connected to a Windows computer via USB.
The user interface of Mobile Edit is available in English and German only. The Help section provides further information on how to use Mobile Edit.
Download: https://www.leybold-shop.de/7731900
The Mobile Edit adds a description to measurement files.
10.3 Mobile Control (included in delivery)
The Mobile Control is a tool for the teacher, with which he can overview the measurement data of all student groups.
For this purpose, a WebSocket connection to the selected Machine Test CASSY is established and this is indicated to the group by a small number to the right of the green . In addition, Mobile Control can transfer settings to all or individual student groups in the form of a *.labm file via the menu or by drag&drop (see Fig. 30).
Since Mobile Control is a tool for several Machine Test CASSYs, its use only makes sense in a router infrastructure! However, this router does not have to have Internet access.
The user interface of Mobile Control is available in German and English only. The help provides further information on how to use Mobile Control.
Download: https://www.leybold-shop.de/7731900
The Mobile Control clearly summarizes the measurement data of several Machine Test CASSYs in the network.
Fig. 32:
Fig. 33:Fig. 34:
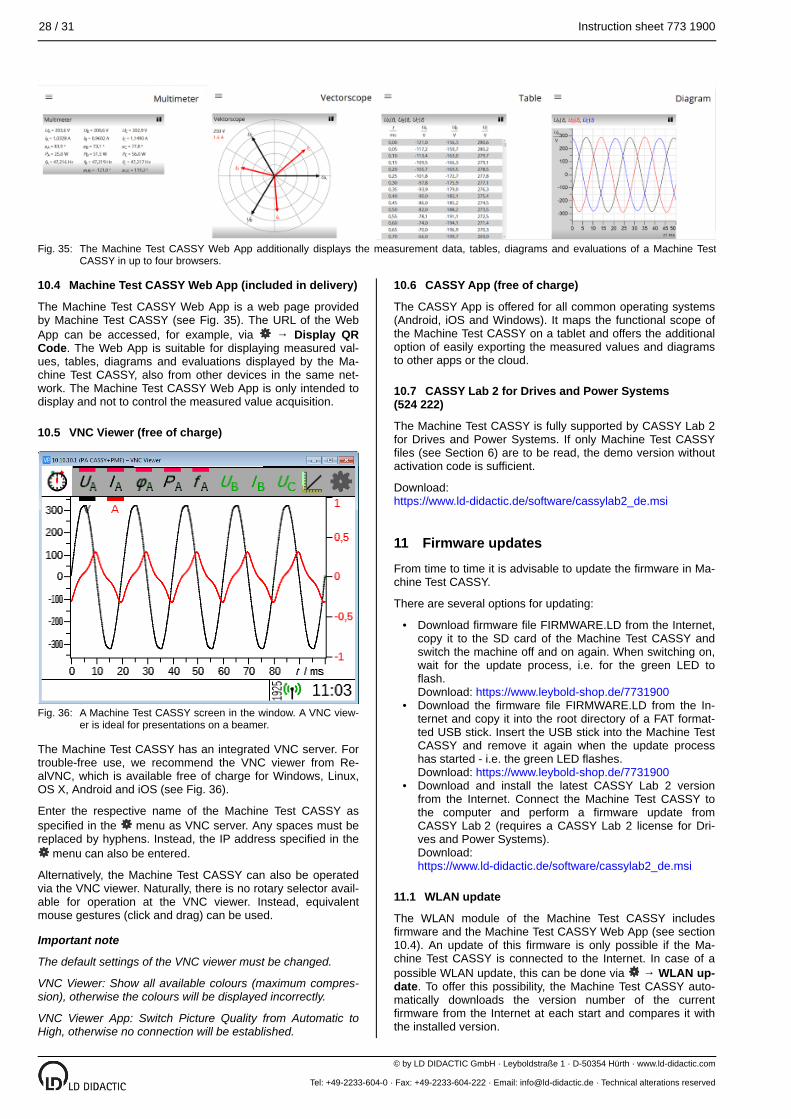
28 / 31 Instruction sheet 773 1900
© by LD DIDACTIC GmbH · Leyboldstraße 1 · D-50354 Hürth · www.ld-didactic.com
Tel: +49-2233-604-0 · Fax: +49-2233-604-222 · Email: [email protected] · Technical alterations reserved
•
•
•
The Machine Test CASSY Web App additionally displays the measurement data, tables, diagrams and evaluations of a Machine Test CASSY in up to four browsers.
10.4 Machine Test CASSY Web App (included in delivery)
The Machine Test CASSY Web App is a web page provided by Machine Test CASSY (see Fig. 35). The URL of the Web App can be accessed, for example, via Display QR Code
→. The Web App is suitable for displaying measured val
ues, tables, diagrams and evaluations displayed by the Machine Test CASSY, also from other devices in the same network. The Machine Test CASSY Web App is only intended to display and not to control the measured value acquisition.
10.5 VNC Viewer (free of charge)
A Machine Test CASSY screen in the window. A VNC viewer is ideal for presentations on a beamer.
The Machine Test CASSY has an integrated VNC server. For trouble-free use, we recommend the VNC viewer from RealVNC, which is available free of charge for Windows, Linux, OS X, Android and iOS (see Fig. 36).
Enter the respective name of the Machine Test CASSY as specified in the menu as VNC server. Any spaces must be replaced by hyphens. Instead, the IP address specified in the
menu can also be entered.
Alternatively, the Machine Test CASSY can also be operated via the VNC viewer. Naturally, there is no rotary selector available for operation at the VNC viewer. Instead, equivalent mouse gestures (click and drag) can be used.
Important note
The default settings of the VNC viewer must be changed.
VNC Viewer: Show all available colours (maximum compression), otherwise the colours will be displayed incorrectly.
VNC Viewer App: Switch Picture Quality from Automatic to High, otherwise no connection will be established.
10.6 CASSY App (free of charge)
The CASSY App is offered for all common operating systems (Android, iOS and Windows). It maps the functional scope of the Machine Test CASSY on a tablet and offers the additional option of easily exporting the measured values and diagrams to other apps or the cloud.
10.7 CASSY Lab 2 for Drives and Power Systems (524 222)
The Machine Test CASSY is fully supported by CASSY Lab 2 for Drives and Power Systems. If only Machine Test CASSY files (see Section 6) are to be read, the demo version without activation code is sufficient.
Download:https://www.ld-didactic.de/software/cassylab2_de.msi
11 Firmware updates
From time to time it is advisable to update the firmware in Machine Test CASSY.
There are several options for updating:
Download firmware file FIRMWARE.LD from the Internet, copy it to the SD card of the Machine Test CASSY and switch the machine off and on again. When switching on, wait for the update process, i.e. for the green LED to flash.Download: https://www.leybold-shop.de/7731900Download the firmware file FIRMWARE.LD from the Internet and copy it into the root directory of a FAT formatted USB stick. Insert the USB stick into the Machine Test CASSY and remove it again when the update process has started - i.e. the green LED flashes. Download: https://www.leybold-shop.de/7731900Download and install the latest CASSY Lab 2 version from the Internet. Connect the Machine Test CASSY to the computer and perform a firmware update from CASSY Lab 2 (requires a CASSY Lab 2 license for Drives and Power Systems).Download:https://www.ld-didactic.de/software/cassylab2_de.msi
11.1 WLAN update
The WLAN module of the Machine Test CASSY includes firmware and the Machine Test CASSY Web App (see section 10.4). An update of this firmware is only possible if the Machine Test CASSY is connected to the Internet. In case of a possible WLAN update, this can be done via WLAN update
→. To offer this possibility, the Machine Test CASSY auto
matically downloads the version number of the current firmware from the Internet at each start and compares it with the installed version.
Fig. 35:
Fig. 36:
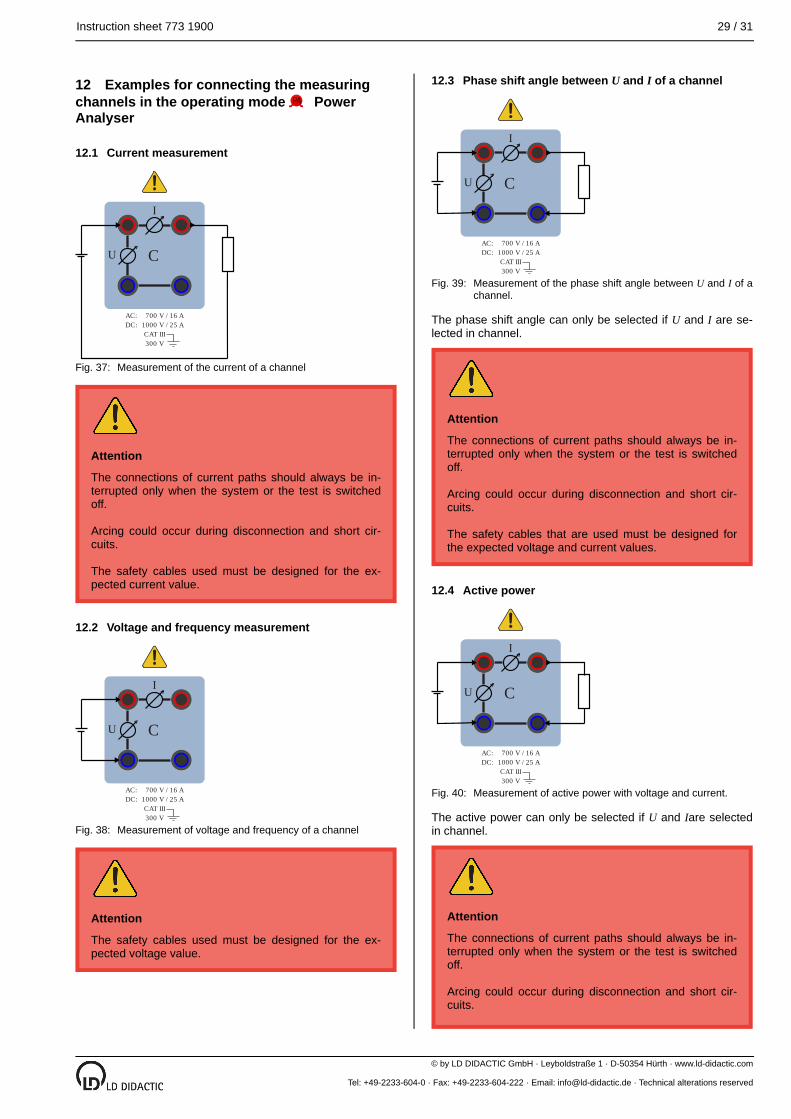
Instruction sheet 773 1900 29 / 31
© by LD DIDACTIC GmbH · Leyboldstraße 1 · D-50354 Hürth · www.ld-didactic.com
Tel: +49-2233-604-0 · Fax: +49-2233-604-222 · Email: [email protected] · Technical alterations reserved
12 Examples for connecting the measuring channels in the operating mode Power Analyser
12.1 Current measurement
C
Measurement of the current of a channel
Attention
The connections of current paths should always be interrupted only when the system or the test is switched off.
Arcing could occur during disconnection and short circuits.
The safety cables used must be designed for the expected current value.
12.2 Voltage and frequency measurement
C
Measurement of voltage and frequency of a channel
Attention
The safety cables used must be designed for the expected voltage value.
12.3 Phase shift angle between U and I of a channel
C
Measurement of the phase shift angle between U and I of a channel.
The phase shift angle can only be selected if U and I are selected in channel.
Attention
The connections of current paths should always be interrupted only when the system or the test is switched off.
Arcing could occur during disconnection and short circuits.
The safety cables that are used must be designed for the expected voltage and current values.
12.4 Active power
C
Measurement of active power with voltage and current.
The active power can only be selected if U and Iare selected in channel.
Attention
The connections of current paths should always be interrupted only when the system or the test is switched off.
Arcing could occur during disconnection and short circuits.
Fig. 37:
Fig. 38:
Fig. 39:
Fig. 40:
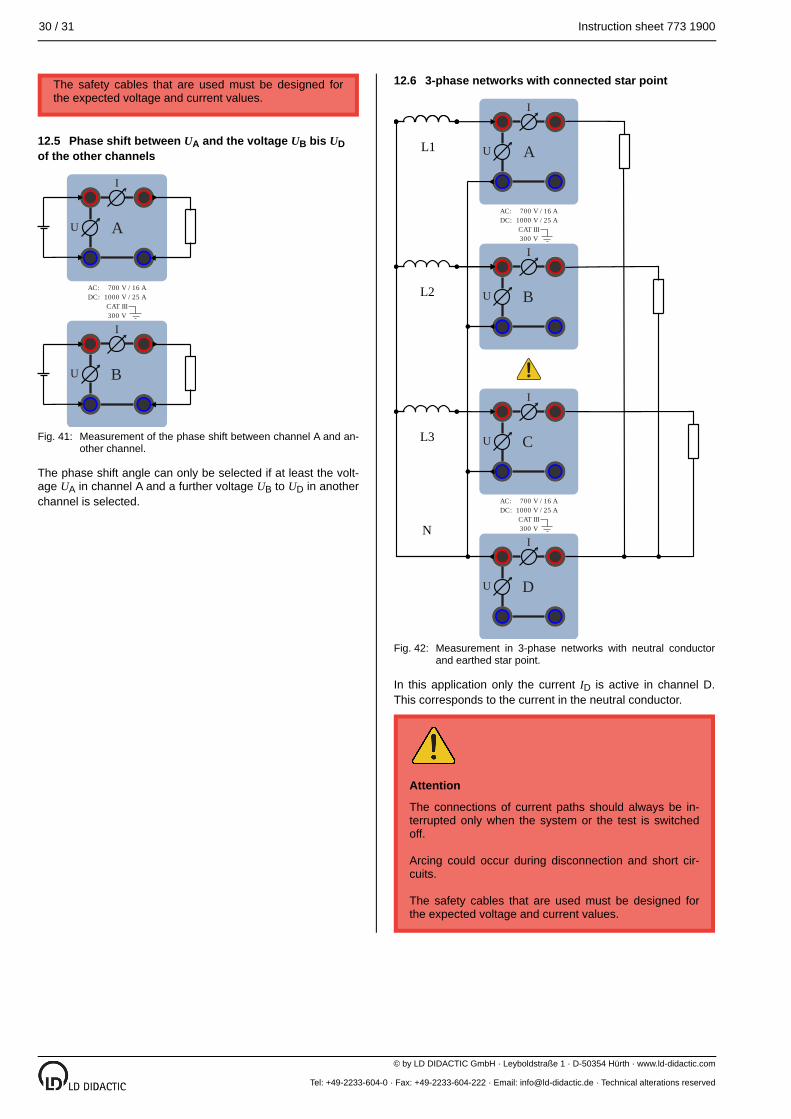
30 / 31 Instruction sheet 773 1900
© by LD DIDACTIC GmbH · Leyboldstraße 1 · D-50354 Hürth · www.ld-didactic.com
Tel: +49-2233-604-0 · Fax: +49-2233-604-222 · Email: [email protected] · Technical alterations reserved
The safety cables that are used must be designed for the expected voltage and current values.
12.5 Phase shift between UA and the voltage UB bis UDof the other channels
A
B
Measurement of the phase shift between channel A and another channel.
The phase shift angle can only be selected if at least the voltage UA in channel A and a further voltage UB to UD in another channel is selected.
12.6 3-phase networks with connected star point
A
B
C
D
N
Measurement in 3-phase networks with neutral conductor and earthed star point.
In this application only the current ID is active in channel D. This corresponds to the current in the neutral conductor.
Attention
The connections of current paths should always be interrupted only when the system or the test is switched off.
Arcing could occur during disconnection and short circuits.
The safety cables that are used must be designed for the expected voltage and current values.
Fig. 41:
Fig. 42:

Instruction sheet 773 1900 31 / 31
© by LD DIDACTIC GmbH · Leyboldstraße 1 · D-50354 Hürth · www.ld-didactic.com
Tel: +49-2233-604-0 · Fax: +49-2233-604-222 · Email: [email protected] · Technical alterations reserved
12.7 3-phase networks with open star point
A
B
C
D
N
Measurement in 3-phase networks with star point without neutral conductor.
In this application only the voltage UD is active in channel D. This corresponds to the voltage between the two unconnected star points.
Attention
The connections of current paths should always be interrupted only when the system or the test is switched
off.
Arcing could occur during disconnection and short circuits.
The safety cables that are used must be designed for the expected voltage and current values.
12.8 3-phase networks without star point
A
B
C
U
V
W
Measurement in 3-phase networks without star point.
Attention
The connections of current paths should always be interrupted only when the system or the test is switched off.
Arcing could occur during disconnection and short circuits.
The safety cables that are used must be designed for the expected voltage and current values.
Fig. 43:
Fig. 44: