a cost-benefit analysis of industrialization and youth
TRANSCRIPT

A Cost-Benefit Analysis of Industrialization and Youth Employment in Malawi - Technical Report
National Planning Commission Report with technical assistance from the Copenhagen Consensus Center and the African Institute for Development Policy
The authors would like to thank and acknowledge Maxwell Mkondiwa, Judie Msusa, Dsingiswayo Jere and participants at the 17 June 2021, Malawi Priorities webinar for useful comments that helped improve this paper. All responsibility for content remains with the authors.
Acknowledgements
Report Contributors
Lindsay Wallace, MA, Director of Strategic Operations, Limestone AnalyticsBahman Kashi, Ph.D., President, Limestone AnalyticsSarah Carello, MA, Project Coordinator, Limestone AnalyticsBrett Crowley, BASc, Project Coordinator, Limestone AnalyticsBen Kaluwa, Ph.D., Professor of Economics at University of MalawiBrad Wong, Ph.D., Chief Economist, Copenhagen Consensus CenterGrace Kumchulesi, Ph.D., Director of Development Planning, National Planning CommissionHope Chavula, Senior Development Planning Specialist, National Planning Commission
© 2021 National Planning Commission (Malawi), Copenhagen Consensus Center and the African Institute for Development Policy (AFIDEP)www.copenhagenconsensus.comwww.npc.mwwww.afidep.org
This work has been produced as a part of the Malawi Priorities project.
Some rights reserved
This work is available under the Creative Commons Attribution 4.0 International license (CC BY 4.0). Under the Creative Commons Attribution license, you are free to copy, distribute, transmit, and adapt this work, including for commercial purposes, under the following conditions:
AttributionPlease cite the work as follows: National Planning Commission, #PAPER TITLE#, Malawi Priorities, National Planning Commission (Malawi), Copenhagen Consensus Center (USA) and African Institute for Development Policy (Malawi), 2021.
Third-party-contentCopenhagen Consensus Center does not necessarily own each component of the content contained within the work. If you wish to re-use a component of the work, it is your responsibility to determine whether permission is needed for that re-use and to obtain permission from the copyright owner. Examples of components can include, but are not limited to, tables, figures, or images.
Cover Image: ©Victory Kamthunzi
Malawi Priorities: Background
Malawi Priorities is a research-based collaborative project implemented by the National Planning Commission (NPC) with technical assistance from the African Institute for Development Policy (AFIDEP), and the Copenhagen Consensus Center (CCC) to identify and promote the most effective interventions that address Malawi’s development challenges and support the attainment of its development aspirations. The project seeks to provide the government with a systematic process to help prioritize the most effective policy solutions so as to maximize social, environmental and economic benefits on every kwacha invested. Cost-benefit analysis is the primary analytical tool adopted by the project. Cost-benefit analysis will be applied to 20-30 research questions of national importance. Research will take place over the course of 2020 and 2021.
Research questions were drawn from the NPC’s existing research agenda, developed in September 2019 after extensive consultation with academics, think tanks, the private sector and government. This sub-set was then augmented, based on input from NPC, an Academic Advisory Group (AAG) of leading scholars within Malawi, and existing literature, particularly previous cost-benefit analyses conducted by the Copenhagen Consensus Center. The research agenda was validated and prioritized by a Reference Group of 25 prominent, senior stakeholders. The selection of interventions was informed by numerous consultations across the Malawian policy space, and one academic and two sector experts provide peer review on all analyses.
Cost-benefit analyses in Malawi Priorities consider the social, economic and environmental impacts that accrue to all of Malawian society. This represents a wider scope than financial cost-benefit analysis, which considers only the flow of money, or private cost-benefit analysis, which considers the perspective of only one party. All benefit-cost ratios (BCRs) reported within the Malawi Priorities project are comparable.
The cost-benefit analysis considered in the project is premised on an injection of new money available to decision makers, that can be spent on expanding existing programs (e.g. new beneficiaries, additional program features) or implementing new programs. Results should not be interpreted as reflections on past efforts or the benefits of reallocating existing funds.
Inquiries about the research should be directed to Salim Mapila at [email protected].
Limestone is a Canada-based consulting firm specializing in the evaluation of international development projects and social programs. The firm is recognized for combining academic rigor, state of the art methods, and international development experience to provide customized evaluation and economic analysis services and to help their clients incorporate evidence to improve the design, financing, and implementation of their projects. Information about our current and past projects can be found at: limestone-analytics.com.

3
A Cost-Benefit Analysis of Industrialization and Youth Employment in Malawi
ContentsACRONYMS 4
EXECUTIVE SUMMARY 5
1. INTRODUCTION AND CONTEXT 8
2. LITERATURE REVIEW AND INTERVENTION SELECTION 11
3. COST-BENEFIT ANALYSIS METHODOLOGY 21
4. CONCLUSION AND DISCUSSION 43
5. REFERENCES 49
Acronyms
AAGAFIDEP
AVCBCR
CAGRCASA
CBACCCCFACGS
DOCsFBS
IBCFISFM
ISVAPsMAIWD
MITCSMEsNEETNGONOSNPC
OECDSADC
SCDSEZSHF
SMEsSSA
TEVETTVP
Academic Advisory GroupAfrican Institute for Development PolicyAgricultural value chainBenefit Cost RatioCompound Annual Growth RateCommercial Agriculture for Smallholders and AgribusinessCost Benefit AnalysisCopenhagen Consensus CenterContract farming arrangementCredit Guarantee SchemeDay-old chicksFarmer business schoolIncentive-Based Contract FarmingIntegrated Soil Fertility ManagementImproved soybean varieties and agronomic practicesMinistry of Agriculture, Irrigation and Water DevelopmentMalawi Industry and Trade CentreSmall and medium-sized enterprisesNeither in education or in employmentNon-governmental organizationNucleus-outgrower schemeNational Planning CommissionOrganisation for Economic Co-operation and DevelopmentSouthern African Development CommunitySystematic Country DiagnosticSpecial Economic ZoneSmallholder farmerSmall and medium sized enterprisesSub-Saharan AfricaTechnical, Entrepreneurial and Vocational Education and TrainingTextured Vegetable Protein
5
A Cost-Benefit Analysis of Industrialization and Youth Employment in Malawi
Executive SummaryAs part of the Malawi Priorities project, the team was posed the following two questions:
1. Where should Malawi focus its resources to achieve industrialization?
2. Which policies can effectively address youth unemployment and underemployment?
This report summarizes the research into the key challenges and opportunities for facilitating industrialization and increased youth employment in Malawi. The research team conducted a desk review and consultations with local sectoral experts in order to understand the structural issues that have hindered Malawi’s ability to achieve its industrialization aspirations and provide employment opportunities for its growing youth workforce. The team then conducted cost benefit analysis (CBA) to quantify the impacts of a subset of interventions that could be pursued in Malawi to promote industrialization and create jobs for youth.
Based on the literature review and the policy recommendations for Malawi, the team identified possible interventions to address youth unemployment and promote structural change for sustainable growth and employment. The team prioritized interventions that aligned both with lessons from recent research on industrialization in Sub-Saharan Africa (Newfarmer, Page, and Tarp 2018; Mkwambisi et al. 2020) and the Government of Malawi’s strategic priorities.1 The team then used selection criteria to choose the final interventions to be further analyzed through cost-benefit analysis. The selection criteria included an expected high benefit-cost ratio, high expert priority, a significant gap in intervention coverage, and crucial data availability. The two interventions that were selected for the analysis are described below.
A poultry egg outgrower scheme: Malawi’s agro-processing value chains are characterized by weak linkages and inefficient marketing channels, largely driven by infrastructure gaps and information asymmetries between stakeholders. There is often a mismatch between supply and demand for agricultural products, and it can be challenging for agro-processors to achieve profitable margins. The animal feed to poultry sector value chain is one such example of a value chain that could benefit from greater integration.
The first intervention modelled in this study is a poultry farm outgrower scheme that aims to strengthen connections between small scale poultry farmers, commercial poultry firms, and soybean processors. The primary benefits of this intervention are the cost savings through increased efficiency of egg production, as well as the increased income to labour entering the soybean processing sector. Costs include start-up capital costs, recurring capital and operations and maintenance costs, and the social cost of carbon emissions.
A credit guarantee scheme (CGS) for small and medium enterprises (SMEs): Many SMEs in Malawi face barriers to accessing formal finance. These credit-constrained SMEs may be unable to invest in production-enhancing inputs, including hired labour. On the other hand, financiers are often unable or unwilling to lend to SMEs due to the relatively high risk of default compared to larger firms.
To help address these issues, the second intervention modelled using CBA is a credit guarantee scheme to provide SMEs with greater access to formal finance. The primary benefits of this intervention are the increased return on capital to SMEs who gain access to credit through the intervention, as well as the SME surplus that accumulates from a reduction in the cost of borrowing. The cost of the intervention is the opportunity cost of capital.
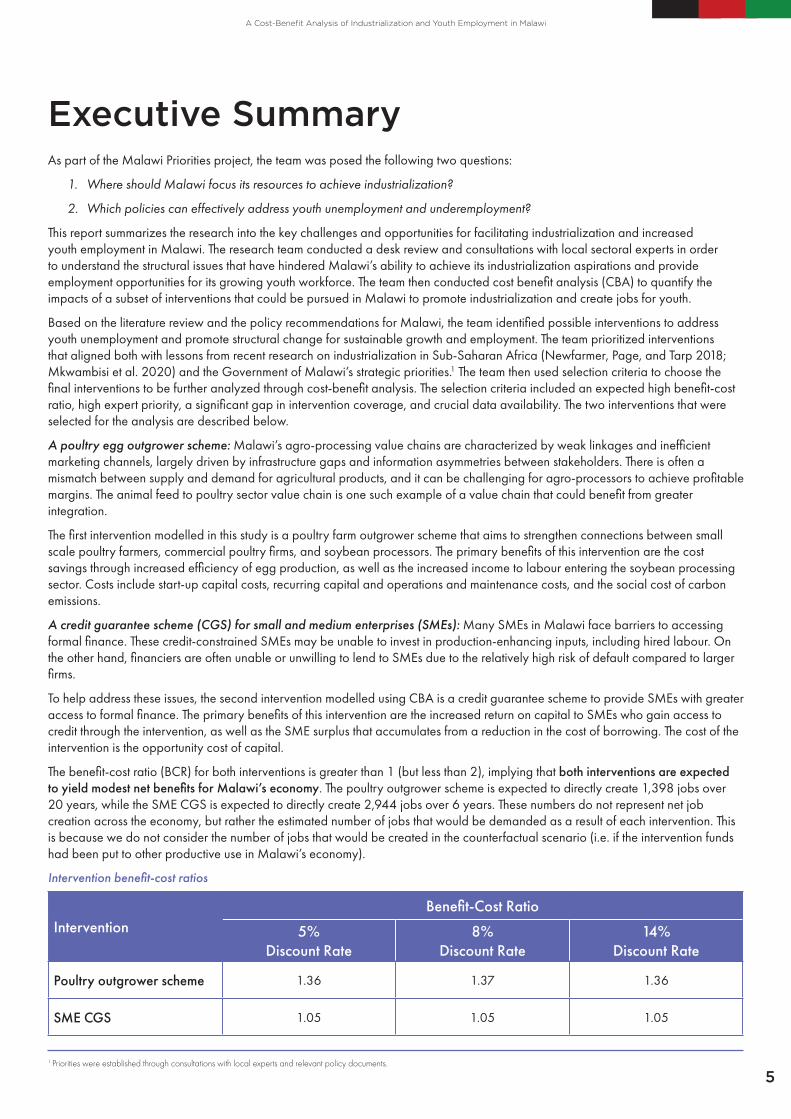
The benefit-cost ratio (BCR) for both interventions is greater than 1 (but less than 2), implying that both interventions are expected to yield modest net benefits for Malawi’s economy. The poultry outgrower scheme is expected to directly create 1,398 jobs over 20 years, while the SME CGS is expected to directly create 2,944 jobs over 6 years. These numbers do not represent net job creation across the economy, but rather the estimated number of jobs that would be demanded as a result of each intervention. This is because we do not consider the number of jobs that would be created in the counterfactual scenario (i.e. if the intervention funds had been put to other productive use in Malawi’s economy).
Intervention benefit-cost ratios
InterventionBenefit-Cost Ratio
5% Discount Rate
8% Discount Rate
14% Discount Rate
Poultry outgrower scheme 1.36 1.37 1.36
SME CGS 1.05 1.05 1.05
1 Priorities were established through consultations with local experts and relevant policy documents.

6
A Cost-Benefit Analysis of Industrialization and Youth Employment in Malawi
Jobs directly created by the poultry outgrower scheme over time
Jobs directly created by the SME CGS over time
Policy implicationsBased on our desk review and CBA modelling, we offer the following policy implications for consideration.
The root cause of the youth underemployment and unemployment challenge in Malawi is a lack of jobs which itself is caused by limited structural transformation of the economy. While many youth employment programs cite a lack of skills as a constraining issue, skills development alone will not address the challenge of youth employment in Malawi. For this reason, the team explored interventions that would drive job creation.
Demand-driven education and skills development programs are still needed. Due to the mismatch of demand and supply in the labour market in Malawi, it is likely that economic growth will need to be accompanied by investment in education and infrastructure to connect youth to employers. These programs should be designed and funded based on the skills demanded by the job market.
Industrialization is defined more broadly than simply the growth of manufacturing services but rather as a process of economic transformation that results in employment creation. To that end, a number of tradable services industries share many characteristics as manufacturing, particularly the capacity to create better jobs. They benefit from productivity growth, scale and agglomeration economies.
Any intervention that might be designed based on this study should undertake a thorough assessment of considerations related to land tenure. Land tenure is an exceedingly complex and often contentious matter which should be a central consideration of any intervention that is designed to advance industrialization and youth employment in Malawi. Poorly designed interventions can cause more harm than good by excluding marginalized citizens from accessing benefits or, worse yet, further marginalizing people by dispossessing them of their livelihoods.
Mass employment requires a portfolio of targeted interventions: While the interventions modelled in this study are expected to yield net benefits for Malawi’s economy, they fall well short of the 1 million jobs that the Government of Malawi hopes to create during its term. When selecting these interventions, we did not anticipate that they would come anywhere close to generating 1 million new jobs. This level of job creation will require a larger portfolio of interventions, of which the two we have modelled can serve as examples.
The benefits of agro-processing value chain integration can be expanded through exports: The results of the poultry egg outgrower

7
A Cost-Benefit Analysis of Industrialization and Youth Employment in Malawi
scheme modelled in this study are based on projected domestic demand for poultry eggs. The Government of Malawi could work with entities such as the Malawi Investment and Trade Commission to identify opportunities to expand exports of poultry eggs to regional neighbours to expand and diversify the benefits of value chain integration.
LimitationsThere are a number of limitations to this analysis. First, although the goal of industrialization is to achieve structural change, this analysis is based on production functions of Malawi’s current economic structure, as well as the current state of technology. As such, we don’t allow for any efficiency gains outside of those directly generated by the interventions. Moreover, the estimated impacts on labour income and employment are short-term, first-order impacts; longer-term impacts and spillover effects resulting from linkages between sectors (i.e. multipliers) are ignored in this study. Therefore, we expect that the intervention would also indirectly create a number of jobs which are not accounted for in the numbers reported here.
The results of the poultry outgrower scheme are explicitly linked to demand for poultry eggs, but the credit guarantee scheme assumes that domestic demand and exports would absorb incremental production facilitated by the increase in capital stock.
This study should not be interpreted as a detailed intervention design or plan. For example, it was beyond the scope of our analysis to determine the number of SMEs who should receive credit, and in what quantities. There may also be other, non-trivial costs associated with implementing these interventions (such as site selection for the poultry outgrower operations) which were beyond the scope of this analysis.

8
A Cost-Benefit Analysis of Industrialization and Youth Employment in Malawi
1. Introduction and ContextThe National Planning Commission (NPC), with technical support from AFIDEP, and the Copenhagen Consensus Center (CCC) are implementing the Malawi Priorities Project during 2020 and 2021.. The Project is a research and advocacy exercise which aims to identify the most effective ways to address the nation’s challenges using the framework of cost-benefit analysis. The goal is to inform both short and long term development priorities for the country, acknowledging that there are insufficient resources to address all of Malawi’s challenges and that maximizing outcomes requires careful, evidence-based consideration of the costs and benefits of all policies.
The starting point of all research questions is the NPC’s existing research agenda, structured around the six thematic areas of Sustainable Agriculture, Sustainable Economic Development, Human Capital and Social Development, Sustainable Environment, Demography, Governance, Peace, and Security, and Human Capital and Social Development.
The NPC’s research agenda was developed by the Commission in September 2019 after extensive consultation with academics, think tanks, the private sector and government. Consequently, the Commission’s research agenda contains questions of national importance. As a first step, Malawi Priorities drew questions from the NPC research agenda that could be answered using a cost-benefit methodology. Then, additional research questions were added based on input from NPC, an Academic Advisory Group (AAG) of leading scholars within Malawi, and existing literature, including previous cost-benefit analyses conducted by the Copenhagen Consensus Center. This process of identifying research questions for investigation generated a total of 38 potential research questions across all 6 thematic areas.
The research agenda was validated and prioritized by a Reference Group of 25 senior stakeholders from government, civil society and the private sector. The outcomes of the Reference Group exercise were used to inform which research questions to prioritize and which interventions to focus on within those 38 potential research questions. The validation process was completed in July 2020.
Research processIn October 2020, the research team at Limestone Analytics began investigation into two development questions:
1. Where should Malawi focus its resources to achieve industrialization?
2. Which policies can effectively address youth unemployment and underemployment?
The first question was ranked 4.8 out of 5 while the second was ranked 4.5 out of 5, according to national priority.
The research team conducted a literature review in order to understand the structural issues that have hindered Malawi’s ability to achieve its industrialization aspirations and provide employment opportunities for its growing youth workforce. The team then participated in a series of consultations with an academic advisor in Malawi, Professor Ben Kaluwa, in addition to conducting a more thorough review of secondary data to identify key barriers to Malawi’s industrialization and workforce development. Once these gaps were outlined, the research team explored interventions that have been implemented in Malawi or similar countries that address the most salient issues. The menu of barriers and interventions were reviewed by Professor Kaluwa, who provided feedback on additional considerations, as well as additional contacts from the sector who have been involved in market research, feasibility studies, and program design to foster industrialization and youth employment. The sector and academic experts were able to provide valuable insight into what interventions have had the greatest reach, impact, and data availability. The team used these insights to select a subset of interventions to include in the feasibility study.
Industrialization backgroundSince 1980, Malawi’s growth has fallen behind the Sub-Saharan Africa average, with weak and volatile growth persisting. Over the past decades, there has been a decrease in the percentage of the population working in agriculture with people moving to services, construction, or manufacturing. The portion of employment in manufacturing has been small and stagnant the past decades around 10%. The economy is also limited by a challenging business environment which has undermined efforts to develop the private sector (World Bank 2018). The government has focused its attention on improving maize yields which has undermined efforts to diversify the sector, distorted the agriculture market, and impacted price volatility (World Bank 2018).
In 2014, the National Industrial Policy identified key issues limiting Malawi’s industrialization. The issues included the high cost of doing business, inadequate infrastructure, limited access to export markets, low participation of SMEs, and low incentives for private sector investments. Since then, Malawi has attempted to overcome these challenges through improved policies including the National Export Strategy and National Trade Policy. These policies aim to enhance integration into regional and global markets, increase value addition to primary products, and increase exports. In the agricultural sector, issues identified included dependence on rainfed agriculture, soil erosion, inadequate infrastructure, and an unconducive policy environment. The agriculture sector is further burdened by increased population density and rapid population growth, as well as the increasing weather variability due to climate change (Mkwambisi et al. 2020).

9
A Cost-Benefit Analysis of Industrialization and Youth Employment in Malawi
Macroeconomic instability is a large barrier to Malawi’s economic growth. The World Bank’s Systematic Country Diagnostic (SCD) finds that instability is caused partly by climatic and exogenous shocks and partly by policies and limited fiscal space. Macroeconomic instability is identified as a cause for the low accumulation and even decrease of capital in Malawi since the 1980s. Agriculture remains the largest source of employment in Malawi, although this has gradually decreased in the past decades (World Bank 2018). Growing sectors of employment include retail, construction, and government, however, these sectors have low productivity that has been declining over time. The growth in employment in these areas is a result of people wishing to leave agriculture rather than from growth in opportunities.
Youth employment backgroundMalawi’s population is very young with 46% of the population under the age of 15. This large increase in working-age adults provides Malawi with an opportunity to take advantage of the demographic dividend but can also pose a threat to Malawi if there isn’t an increase in job opportunities. Many youth participate in the labour force in Malawi, however, quality of work and underemployment remain a challenge. The percentage of young men that are neither in education or in employment (NEET) is 7%, for women the percentage is 20% (OECD 2018). Despite a large portion of youth in the labour force, many work in the informal sector and/or face underemployment. 25% of youth in Malawi are underemployed.
Almost all youth are employed in the 2 lowest skill tiers of employment including youth who have finished secondary and tertiary education. 43% of the highest skilled youth in Malawi are employed in the lowest skilled tier of employment. This disparity between supply and demand in the labour market highlights the need for more decent work for youth and investment in youth gaining skills relevant for these higher skilled jobs. The Malawi Priorities paper on child marriage and secondary education had similar findings.
Due to the high rates of poverty in Malawi, most youth can’t afford to be unemployed and are therefore forced to take work wherever they can. This increases the risk of youth having to work in hazardous conditions and being underemployed. There is a need for more decent work in Malawi. Many youth in Malawi start their own business out of necessity due to their lack of options. These businesses are small, informal, mostly in agriculture, and have limited value added.
Another issue that exacerbates youth employment and economic growth is gender inequality. Gender inequality impacts agricultural productivity, opportunities in the non-farm sector, the demographic transition, and household resilience against shocks. Improving gender equality in Malawi will lead to quicker progress in growth, poverty reduction and sustainability (World Bank 2018).
Land tenureA cross-cutting issue that affects both the industrialization process and youth employment relates to Malawi’s land tenure system. Malawi’s land system consists of three types of land - public, private, and customary. Many rural citizens reside on customary land, which is “all land which is held, occupied or used under customary law, but does not include any public land.” As declared in clause 27 of the Land Act:
Wherever it appears to the Minister that any customary land is needed for a public purpose, that is to say a purpose which is for the benefit, direct or indirect, of the community as a whole, or a part of the community, he may declare, by notice under his hand and published in the Gazette, that such land is public land, and thereupon such land shall become public land.
For Malawians who do not possess a deed of title for the land on which they reside, it may be challenging or impossible to access the benefits of rural commercialization interventions. Land tenure is an exceedingly complex and often contentious matter which should be a central consideration of any intervention that is designed to advance industrialization and youth employment in Malawi. Poorly designed interventions can cause more harm than good by excluding marginalized citizens from accessing benefits or, worse yet, further marginalizing people by disposessing them of their livelihoods. It is beyond the scope of our analysis to consider the social, historical, and cultural dynamics of Malawi’s land tenure system, but we would expect that any intervention that might be designed based on this study should undertake a thorough assessment of considerations related to land tenure.
Overcoming the challengesIn order to analyze how best to improve market and employment outcomes, the team turned to the literature as there are multiple systematic reviews analyzing the impact of youth employment interventions.
Supply Side Interventions Supply-side interventions target the youth through activities such as training and loans. The systematic review done by Kluve et al. (2017) finds that active labour markets programs on average have a positive impact on youth employment outcomes. They found that entrepreneur promotion and skills training had an impact that was statistically different from zero impact while employment services and subsidies did not. The impact on income followed a similar pattern. The authors highlighted that targeting disadvantaged youth and women lead to larger impacts. A great source of heterogeneity in the literature was the country context. This highlights the need for interventions to be tailored to the circumstances of the region they are working in.
Datta et al. (2018) conducted a systematic review of youth employment programs and their impact on employment across various measures. Interventions targeted at the supply side of the labour market such as targeting youth through training, subsidies, and job-finding services had mixed results. Projects that worked with employers and provided on the job training had the best results of these initiatives. The small impact of many programs was attributed to not addressing the low demand for labour or lack of opportunities for entrepreneurship (Datta et al. 2018). Supply-side interventions have had successes, however, the authors emphasized the importance of addressing the barriers most pressing to the context of a country or region and addressing both demand and supply

10
A Cost-Benefit Analysis of Industrialization and Youth Employment in Malawi
side issues. It is also important to address multiple constraints, particularly in low-income countries.
The government of Malawi has invested in training and education through interventions such as investment in Technical, Entrepreneurial and Vocational Education and Training (TEVET), however, these opportunities are not always available to disadvantaged youth due to high academic requirements, financial constraints, and cultural issues (OECD 2018).2 Another issue with the current education system is the quality of the relevance to the private sector. Due to out-of-date teaching resources and lack of linking between training and the private sector there remain skill gaps in sectors such as mining, agro-processing, construction and tourism (OECD 2018).
Demand Side Interventions Demand-side interventions target employers and encourage hiring youth through activities that lead to market growth and job creation. Malawi’s youth face a lack of jobs and market opportunities for entrepreneurship.
In many other countries, increased growth of manufacturing has created many jobs for low-skilled workers, which has been beneficial to all ages, especially for youth. However, the Industries without Smokestacks research highlights that the benefits of industrialization such as economic growth, improved employment, and reduced poverty can be realized in Africa through growth in sectors other than manufacturing. By investing in sectors such as agriculture and services, countries can reap the benefits of industrialization by taking advantage of improved technologies. The paper highlights that the current global realities force policymakers in Sub-Saharan Africa to think of ways to promote structural transformation beyond manufacturing. In order to transform their economies, governments need to attract new firms able to compete in regional and global markets in services, tourism, and agro-industry, in addition to other manufacturers (Newfarmer, Page, and Tarp 2018).
The World Bank Systematic Country Diagnostic (2018) identified priorities for Malawi to improve economic growth and employment outcomes in Malawi. The first priority for growing Malawi’s economy is improving agricultural productivity. Secondly, the economy needs to diversify outside of agriculture. Third, investments need to be made to improve human capital through improvements in health and education. Finally, Malawi needs to build resilience against climate change and improve environmental sustainability. Investing in diversifying within and outside of agriculture and addressing barriers to growth will lead to economic growth and improved employment outcomes as has been seen in other countries that have experienced industrialization. For countries such as Malawi, it is not whether they should invest in agriculture or invest in industries, it is through increased productivity in agriculture that Malawi can expand into further industries.
Malawi’s National Youth Policy (2106) asserts that “The main contributing factor to the issues of unemployment and poverty among the youth is lack of employable skills resulting from very few skills training centres available in the country.” However, we see the skills gap and low demand for skilled workers as two sides of the same coin. This study focuses on interventions that are aligned with the objective of the ‘Youth Economic Empowerment Priority’ of the National Youth Policy: “To create more and decent employment for the youth both in the formal and informal sectors and in urban and rural areas.” This study differs from the National Youth Policy in that we focus on demand side interventions rather than supply side interventions.
2 Priorities were established through consultations with local experts and relevant policy documents.

11
A Cost-Benefit Analysis of Industrialization and Youth Employment in Malawi
2. Literature review and intervention selectionAs outlined in Section 1, Malawi’s economy faces a wide variety of barriers to achieving industrialization and widespread youth employment. Table 2.1 presents a summary of the primary barriers, along with possible interventions to address each barrier.
Table 2.1: Key barriers in Malawi
Barrier Possible interventions
Barriers to industrialization
Infrastructure gaps • Special Economic Zones (SEZs)
Access to finance
• Policies/programs that promote access to credit• Help firms produce better records• Help firms register/incorporate• Credit guarantees• Movable credit registries
Weak governance & regulations • Reducing “red tape” and corruption
Inefficient market linkages and low value addition along supply chains
• Value chain integration• Contract farming arrangements (CFAs)• Digital value chain integrators
Gender inequality • Gender equity is a cross-cutting consideration
Low agricultural productivity• Investment in agricultural value chains• Access to improved inputs• Extension services
Exposure to shocks • Resilience to shocks is a cross-cutting consideration
Barriers to youth employment
Skills mismatch and gaps• Skills training• Apprenticeships
Lack of opportunity for youth• Entrepreneur promotion and training• Employment services and subsidies
Low quality work and weak labour laws • The team did not consider any interventions to address this barrier.
Academic, financial and cultural barriers to participation in education
• The team did not consider any interventions to address this barrier.
Intervention optionsA number of different interventions have been attempted with the intent of advancing industrialization and increasing youth employment. In this section, we review the evidence and impact of various interventions that have been implemented in Malawi and similar countries by each barrier identified in the previous section.
Barriers to industrializationSpecial Economic Zones: A review of SEZs across Africa noted that zones across the continent were generally unable to replicate the successes of SEZs in Asia (Mösle, 2019). Inadequate planning and implementation, characterized by “(d)eficient infrastructure, suboptimal location with poor access to markets, high regulatory uncertainty, political instability, a top-down focus on noncompetitive industries, insufficient implementation capacity and coordination problems between actors”, are the main reasons for these failures.

12
A Cost-Benefit Analysis of Industrialization and Youth Employment in Malawi
Nevertheless, there have been some isolated examples of successful SEZ programs such as the Kigali Special Economic Zones in Rwanda. Steenbergen and Javorcik (2017) used firm-level data to analyze how Special Economic Zones impacted firm behaviour. They found that the impact on firms of being in the Special Economic Zones vs. not was a significant increase in value-added, permanent employees, and productivity overall.
Access to finance: Access to finance is a key barrier to business development in Malawi. The systematic review of the impacts of access to finance conducted by Kersten et al (2017) found significant impacts of access to finance on firm production and employment, but insignificant impact on firm productivity.
Studies by Bist (2018) and Inoue and Hamori (2016) reveal positive impacts of financial development on economic growth amongst African countries. Nizam et al (2020) find a threshold effect in the financial inclusiveness-growth nexus, where countries with higher levels of financial inclusion achieve higher economic growth than countries with lower levels of financial inclusion. On the other hand, Effiong (2015) and Bandura and Dzingirai (2019) suggest the quality of local institutions is a moderating factor in the impact of financial development on economic growth.
Reducing “red tape” and corruption: Amos and Doungahire (2019) find that “Red tape” as an institutionally induced policy distorts labour allocation due to increase in time spent dealing with authorities and significantly lowers labor productivity. A one percent reduction in time spent dealing with authorities would lead to a substantial reduction in bureaucracy and increase in MRPL by 1.9 percent.
Using three different measures of corruption, Bbaale and Okumu (2018) find evidence that corruption “sands the wheels of commerce” and hence dampens firm-level productivity even when the endogeneity of corruption is controlled for. On the other hand, using the same data Williams and Kedir (2016) find that corruption significantly enhances rather than harms annual sales, employment and productivity growth rates. In their systematic review, Ugur and Dasgupta (2011) find that a one-unit increase in a country’s perceived corruption index is associated with a 0.89 percent decrease in the per capita GDP growth rate.
Agricultural value chain integration: The systematic review of contract farming arrangements by Ton et al (2017) states: ‘Contract farming is a container concept that covers a wide range of contractual arrangements. This heterogeneity makes it difficult to draw general conclusions from the literature published on this topic. The studies have a marked publication bias. All studies report at least one case of contract farming that has a positive and statistical significant income effect. Moreover, due to limits inherent to the (cross‐sectional) study designs used in these investigations, the estimated effect size is upward biased. The lack of studies on ‘failed treatments’ leads to an overestimation of the effectiveness of contract farming.’ Meemken and Bellemare (2019) similarly find heterogeneous and upwardly biased impacts of contract farming in the literature.
Improved access to agricultural inputs: Tufa et al (2019) found that the use of improved soybean varieties and agronomic practices (ISVAPs) is associated with an average of 61% yield gain and 53% income gain for adopters. Van Vugt et al (2016) found that a combination of inoculation, inorganic fertiliser, and compost manure increased yields from 0.86 tons/ha under farmers’ traditional practice to 1.56 tons/ha and resulted in average profits of $222 USD/ha.
Agricultural extension services: In their case study of the impacts of Malawi’s farmer business schools (FBS), Chilemba and Ragasa (2019) report: ‘The study finds a positive yet very small impact of FBS participation on crop income... and no significant difference in crop income and production for farmers who graduated from FBS versus those who dropped out. While most participants reported gaining improved knowledge from the training, it did not seem to translate into new business ventures and improved incomes. Insights from the qualitative research component of this study suggest that this is primarily due to the limited financial resources that smallholder farmers have to implement the agricultural management practices and business skills taught in FBS.’ Maertens et al (2020) provide some evidence of increased Integrated Soil Fertility Management (ISFM) practice adoption among Malawian soybean farmers who participate in demonstration plot clubs, but no significant impacts on yields or farmers’ incomes.
Increased diversity of agriculture: Analysis conducted by Keyser et al. (2007) looked at countries impacted by the shrinking tobacco market and identified crops that could be grown in similar environments and provide farmers with increased profits. They found that alternatives to tobacco that would offer similar or greater profits per hectare include paprika, tomato, rice, cassava, groundnuts, and coffee as options.
Barriers to youth employmentSkills training: The systematic review done by Kluve et al. and Datta et al. found that skills training had a positive impact on incomes and employment outcomes.3 The systematic review also found that some of the most effective skills training interventions included on-the-job training.
Entrepreneur training: The systematic review done by Kluve et al. and Datta et al. found that entrepreneur training had a positive impact on incomes and employment outcomes. Further, the research by AfiDEP (2016) found that entrepreneurs’ business skills were a barrier to their management capacity.
The selection of interventions to include in the feasibility analysis does not necessarily deny the importance of the other options, or suggest that they do not have impact.
3 Although there is a skills mismatch in Malawi, skills training is unlikely to have a large impact on employment in Malawi without an improvement in the supply of decent work.

13
A Cost-Benefit Analysis of Industrialization and Youth Employment in Malawi
Table 2.2: Summary of evidence for interventions addressing each barrier
Key Barrier Evidence of Impact?
Barriers to industrialization
Special Economic Zones Mixed
Access to finance Yes
Reducing “red tape” and corruption Split
Agricultural value chain integration Yes, biased
Access to improved inputs Yes
Extension services Yes
Increased diversity of agriculture Yes
Barriers to youth employment
Skills Training Yes
Entrepreneur Training Yes
Selection CriteriaThe research team used a number of criteria to screen and select a subset of interventions to include in the feasibility analysis. These criteria have been applied to other CCC pre-feasibility research projects as well.
Sector expert priority: Sector experts identify the intervention as important and relevant to the local context. Experts can provide input through several channels: the Reference Group questionnaire, inferences from the NPC research agenda, the academic advisory group, and during individual interviews.
High benefit-cost ratio or cost-effectiveness in similar previous research: The purpose of the Malawi Priorities project is ultimately to identify interventions of outsized benefits relative to costs. Input into this factor is determined from the economics literature, particularly previous research conducted by the Copenhagen Consensus Center. In the Center’s experience, BCRs above 15 are among the highest across all interventions. Due consideration is given to contextual differences between previous research and the current situation in Malawi in determining the effect of this criterion.
Addresses a problem of sufficient size – some interventions could be considered highly effective but only address a small percentage of a given problem, limiting the overall net benefits of the approach. To avoid focusing on solutions that are too small, each intervention must have the potential to address a problem that is significant.
Significant gap in current levels of intervention coverage – all analysis conducted in Malawi Priorities focuses on marginal benefits and costs. Therefore if an intervention already has high coverage rates, then additional resources provided towards that intervention are unlikely to be effective or will suffer from the ‘small-size’ problem.
Availability of crucial data or credible knowledge of impact – due to time and resource constraints, all analyses conducted by Malawi Priorities are based on secondary data. No primary research is conducted, such as field experiments or trials. Therefore, each intervention is constrained by the availability of data. In many cases, one key constraint is knowledge concerning the impact of a given intervention. It is typical to formally deal with uncertainty via sensitivity analyses. However, in some cases, the uncertainty is so great that it precludes even researching the intervention at all.
Table 2.3 summarizes each of the interventions along these criteria, based on the existing evidence.
The interventions chosen to be further analyzed through Cost-Benefit Analysis include:
• Investment in agro-processing value chain integration
• Improving access to finance for SMEs

14
A Cost-Benefit Analysis of Industrialization and Youth Employment in Malawi
Table 2.3: Selection of final interventions for inclusion in CBA
Intervention Sector Expert Priority
High BCR or cost-
effectiveness
Sufficient size
Gap in current coverage
Availability of data Overall
Investment in agro-processing value chain integration
High High Yes Yes Yes Yes
Improving access to finance High High Yes Yes Yes Yes
Special Economic Zones High Low Yes Yes No No
Entrepreneur training High Low No No No No
Skills training Low Low No Yes Yes No
Apprenticeship programs High Low No Yes No No
Intervention logicWithin the selected high-level interventions, there are a multitude of intervention models and leverage points to target. In this section, we outline the evidence used to ‘narrow in’ on the specific interventions to be modeled with CBA.
Investment in agro-processing value chain integrationIt was decided that this intervention should support the enhancement of supply chains for the production of soybeans and soy-based products. Soybeans are one of the four oilseeds prioritized for export in Malawi’s National Export Strategy, along with sunflower, groundnut, and cotton. Soybeans were selected because they already constitute a significant portion of Malawi’s agricultural export basket,4 yet there is significant scope for increasing domestic capacity value-addition.5 There are a number of strategic opportunities that support the decision to strengthen the soybean value chain as shown in Table 2.4.
Figure 2.1: Potential of various agricultural products (Benfica and Thurlow 2017)
4 Although there is a skills mismatch in Malawi, skills training is unlikely to have a large impact on employment in Malawi without an improvement in the supply of decent work.5 Although there is a skills mismatch in Malawi, skills training is unlikely to have a large impact on employment in Malawi without an improvement in the supply of decent work.

15
A Cost-Benefit Analysis of Industrialization and Youth Employment in Malawi
Table 2.4: Strategic opportunities in the soybean value chain
Strategic opportunity Drivers Source
Strong and growing demand
Expansion of the poultry and fish industries in Malawi and the South African Development Community (SADC) region.
TechnoServe 2011
The SADC region as a whole faces a negative trade balance in soybeans, oilcake and edible oil, so there is ample opportunity for Malawi to expand its exports to regional trade partners.
Markowitz 2019
Rapid growth in demand for soya pieces. Dzanja et al 2016
Captive market
Because of its high protein content, soy cake has no competitive substitute from other crops.
TechnoServe 2011
NGOs use soy flour to enrich meals provided to captive audiences such as school lunch programs, hospitals, orphanages and refugee programs.6
Yohane et al 2013
CompetitivenessOn a pure cost basis, trade within the region has been competitive against Argentine beans.7
TechnoServe 2011
Institutional support
Recent formation of the Soybean Association of Malawi that is equipped to drive the soybean industry and establishment of Legumes Development Trust to support partnership and promote the market.
Yohane et al 2013
Political will and government initiatives in place to enhance soybean production. Yohane et al 2013
Agronomic suitabilityAvailability of suitable varieties adaptable to almost all agro-ecological zones in Malawi.
Yohane et al 2013
Socioeconomic benefits
Optimal combination of positive poverty reduction, nutrition enhancement, and economic growth effects (Figure 2.1 above).
Benfica and Thurlow 2017
Opportunities to empower women through value-add activities along the soybean value chain.
USAID 2014
6 Tinsley cautions: ‘It should be noted that relying on NGOs for long term marketing has to be done with caution. NGOs should be considered as only a temporary market associated with different development or relief projects and not as a permanent part of society. Thus, it should be anticipated that NGOs will have a life expectancy of 10 years or less. Thus, while they can be used as an initial market, diversification away from NGOs should be a reasonable priority to assure the continued sustainability of any value chain, soybeans or otherwise.’7 This is, however, partially attributable to the non-tariff protection offered by high inland transportation costs that raise the price of deep-sea imports.8 Marketing efficiency was measured as the ratio of net price received by the farmer to the total marketing cost plus total margins incurred by intermediary traders before the end product is sold to consumers.
That said, there are a number of barriers hindering the development of well-functioning soybean value chains in Malawi. Of the general barriers to industrialization listed in Table 2.1 above, those that are most relevant to Malawi’s soybean value chain are:
• Low agricultural production;
• Inefficient market linkages and low value addition along supply chains;
• Underutilized processing capacity.
Low agricultural productionSoybean is a relatively new crop in Sub-Saharan Africa (SSA), and there are relatively few high-yielding varieties available to smallholder farmers. As a result, yields are lower in SSA relative to the rest of the world (Santos 2019). Yohane et al (2013) found that average soybean yields in Malawi were just 800 kg/ha compared to theoretical maximum yields of 2,000 - 3,000 kg/ha. Goldsmith and Dall’Erba (2020) report yields in Malawi had increased to 980 kg/ha by 2018, but noted that extensification was the primary driver of increased soybean production in Malawi rather than intensification. Other salient causes of low productivity include (Government of Malawi 2013):
• Environmental factors such as diseases, pests, drought, and poor soil fertility;
• Limited access to improved inputs (inoculant, fertilizers);
• Low access to research and extension services and limited knowledge of best crop management practices;
• Trade distortions;
• Unclear land tenure;
• Cultural barriers.
Inefficient market linkages and low value addition along supply chainsFigure 2.2 shows the key stakeholders in the soybean agricultural value chain (AVC) in Malawi. The arrows represent representative pathways through which value might be added to soybeans, but there exist other pathways between stakeholders. For example, smallholder farmers might sell directly to large traders rather than first selling to small traders. Tinsley (2009) suggested that procurement of soybeans from farm communities appears to be mostly done by the large processors directly and not via contractors or other middle persons. Nzima and Dzanja (2015) examined the marketing efficiency8 of alternative soybean market channels. They identify five

16
A Cost-Benefit Analysis of Industrialization and Youth Employment in Malawi
profitable marketing channels (Figure 2.3) but find that Malawi’s soybean market is overall inefficient, with traders earning supernormal profits due to market power and minimal integration between regional markets. Various methods of cheating have been documented at various points along the supply chain9 (Tinsley 2009; Agar 2014). On the other hand, farmers and traders have been observed to employ highly sophisticated trading strategies, such as forms of stock futures management, to manage risk and increase profits.
9 Methods of cheating include sale of counterfeit, diluted and expired inputs; use of rigged scales to weigh and price crops; wetting of crops or addition of additional non-crop material by farmers to increase weight.
Figure 2.2: Stakeholders in the soybean value chain (Agar 2014)
Figure 2.3: Profitable soybean marketing channels (Nzima and Dzanja 2015)
17
A Cost-Benefit Analysis of Industrialization and Youth Employment in Malawi
The most significant ‘pull-factor’ in the soybean supply chain regionally is the demand from the poultry feed industry, but due to challenges associated with Malawi’s investment environment, Malawi’s poultry feed industry is smaller and less competitive than the poultry feed industries of neighbouring Zambia and South Africa (Markowitz, 2019). Another ‘pull-factor’ is the demand for soy products for human consumption, which is relatively larger in Malawi than in neighbouring markets (TechnoServe 2011).
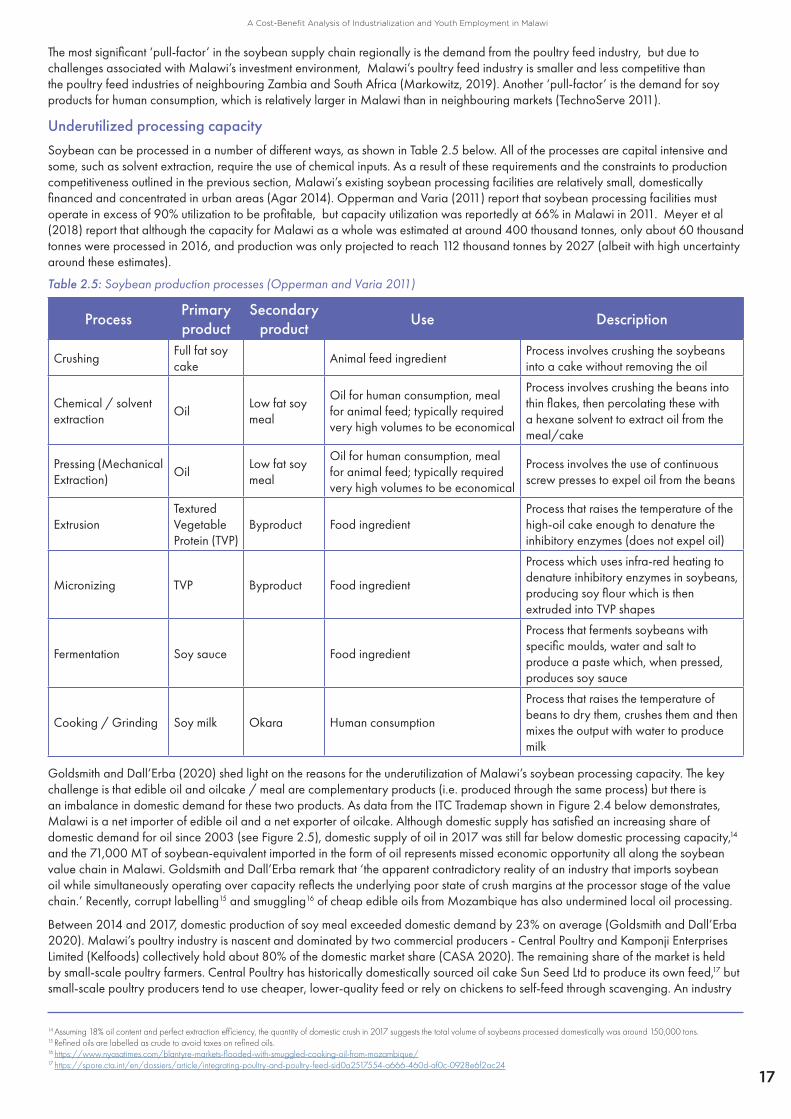
Underutilized processing capacitySoybean can be processed in a number of different ways, as shown in Table 2.5 below. All of the processes are capital intensive and some, such as solvent extraction, require the use of chemical inputs. As a result of these requirements and the constraints to production competitiveness outlined in the previous section, Malawi’s existing soybean processing facilities are relatively small, domestically financed and concentrated in urban areas (Agar 2014). Opperman and Varia (2011) report that soybean processing facilities must operate in excess of 90% utilization to be profitable, but capacity utilization was reportedly at 66% in Malawi in 2011. Meyer et al (2018) report that although the capacity for Malawi as a whole was estimated at around 400 thousand tonnes, only about 60 thousand tonnes were processed in 2016, and production was only projected to reach 112 thousand tonnes by 2027 (albeit with high uncertainty around these estimates).
Table 2.5: Soybean production processes (Opperman and Varia 2011)
Process Primary product
Secondary product Use Description
CrushingFull fat soy cake
Animal feed ingredientProcess involves crushing the soybeans into a cake without removing the oil
Chemical / solvent extraction
OilLow fat soy meal
Oil for human consumption, meal for animal feed; typically required very high volumes to be economical
Process involves crushing the beans into thin flakes, then percolating these with a hexane solvent to extract oil from the meal/cake
Pressing (Mechanical Extraction)
OilLow fat soy meal
Oil for human consumption, meal for animal feed; typically required very high volumes to be economical
Process involves the use of continuous screw presses to expel oil from the beans
ExtrusionTextured Vegetable Protein (TVP)
Byproduct Food ingredientProcess that raises the temperature of the high-oil cake enough to denature the inhibitory enzymes (does not expel oil)
Micronizing TVP Byproduct Food ingredient
Process which uses infra-red heating to denature inhibitory enzymes in soybeans, producing soy flour which is then extruded into TVP shapes
Fermentation Soy sauce Food ingredient
Process that ferments soybeans with specific moulds, water and salt to produce a paste which, when pressed, produces soy sauce
Cooking / Grinding Soy milk Okara Human consumption
Process that raises the temperature of beans to dry them, crushes them and then mixes the output with water to produce milk
Goldsmith and Dall’Erba (2020) shed light on the reasons for the underutilization of Malawi’s soybean processing capacity. The key challenge is that edible oil and oilcake / meal are complementary products (i.e. produced through the same process) but there is an imbalance in domestic demand for these two products. As data from the ITC Trademap shown in Figure 2.4 below demonstrates, Malawi is a net importer of edible oil and a net exporter of oilcake. Although domestic supply has satisfied an increasing share of domestic demand for oil since 2003 (see Figure 2.5), domestic supply of oil in 2017 was still far below domestic processing capacity,14 and the 71,000 MT of soybean-equivalent imported in the form of oil represents missed economic opportunity all along the soybean value chain in Malawi. Goldsmith and Dall’Erba remark that ‘the apparent contradictory reality of an industry that imports soybean oil while simultaneously operating over capacity reflects the underlying poor state of crush margins at the processor stage of the value chain.’ Recently, corrupt labelling15 and smuggling16 of cheap edible oils from Mozambique has also undermined local oil processing.
Between 2014 and 2017, domestic production of soy meal exceeded domestic demand by 23% on average (Goldsmith and Dall’Erba 2020). Malawi’s poultry industry is nascent and dominated by two commercial producers - Central Poultry and Kamponji Enterprises Limited (Kelfoods) collectively hold about 80% of the domestic market share (CASA 2020). The remaining share of the market is held by small-scale poultry farmers. Central Poultry has historically domestically sourced oil cake Sun Seed Ltd to produce its own feed,17 but small-scale poultry producers tend to use cheaper, lower-quality feed or rely on chickens to self-feed through scavenging. An industry
14 Assuming 18% oil content and perfect extraction efficiency, the quantity of domestic crush in 2017 suggests the total volume of soybeans processed domestically was around 150,000 tons.15 Refined oils are labelled as crude to avoid taxes on refined oils.16 https://www.nyasatimes.com/blantyre-markets-flooded-with-smuggled-cooking-oil-from-mozambique/17 https://spore.cta.int/en/dossiers/article/integrating-poultry-and-poultry-feed-sid0a2517554-a666-460d-af0c-0928e6f2ac24

18
A Cost-Benefit Analysis of Industrialization and Youth Employment in Malawi
Figure 2.4: Malawian trade balances of soy-based products 2018 (ITC Trademap)
Figure 2.5: Sources of edible soy oil in Malawi (Goldsmith and Dall’Erba 2020)
report published by CASA (2020) notes that ‘Despite contributing 42% of the total chicken population in Malawi and supplying nearly all the poultry meat and eggs consumed in rural areas, the potential of the indigenous poultry industry remains largely untapped,’ implying that ‘Scope exists for smallholder farmers (SHFs) to step up through the emerging commercialisation of indigenous and dual-purpose chickens.’ Demand for local chicken is rising and local chicken earns a significant price premium on the market due to its perceived superior taste.
Financially viable soybean processing requires demand from both oil and meal markets, but in Malawi the historically low demand for soybean meal has resulted in weak margins for processors as they must rely disproportionately on income from oil, which constitutes only 18% of soybean volume. An analysis conducted by the Malawi Industry and Trade Centre (MITC) in 2014 found limited opportunities for Malawi to compete in the soybean oilcake markets in Zambia, Zimbabwe and South Africa, but Dzanja et al (2016) report that there is a ‘lucrative’ opportunity to export soybean oilcake to Botswana,18 ‘which has a large livestock sector but poor conditions for crop production.’ However, soybeans have at times been subject to export restrictions imposed by the government.
The low productivity of small-scale, extensive poultry production and the excess supply of domestically produced soybean oilcake represents an opportunity to improve linkages between soybean farmers, soybean processors, poultry feed producers and small-scale poultry farmers. Figure 2.6 presents a simplified representation of the ‘animal feed to poultry sector’ value chain, with nodes of relevance to this study highlighted in teal. However, there is a gap in the literature related to the ‘uncommon approach’ of linking crop and livestock value chains. One recent study in Ghana explored ‘whether improvements in domestic maize productivity and production levels can drive growth in domestic poultry production and, in turn, whether boosting domestic poultry production can serve as a demand pull for domestically produced maize’ (Andam et al 2017). The study showed that dramatically expanding domestic production of feed would result in a substantial increase in demand for soybeans and exports of eggs.
18 Botswana imported $11M USD in soybean oilcake from Zambia and South Africa in 2019 (ITC Trademap 2020).
Figure 2.6: Animal feed to poultry sector value chain (Karnani and McKague 2016)
In its 2017 Agriculture Sector Performance Report, Malawi’s Ministry of Agriculture, Irrigation and Water Development (MAIWD) notes that domestic consumption of livestock products, including chicken and eggs, is low relative to other countries and dietary recommendations. However, the report highlights some positive recent and projected trends in Malawi’s poultry sector:
‘The largest production increase [for all the livestock products between 2015/16 and 2016/17] was recorded for eggs, which saw a 69.2 percent increase. This was closely followed by the increase in chicken meat production, which registered a 69.1 percent increase… The increased production of eggs and chicken meat can be partially attributed to the shorter production cycle and lower investment costs associated with these poultry products. At the same time, there are new investments in the poultry subsector, both formal and informal. For example, CP Feeds and Kamponji Investments are two private companies that have expanded their egg production operations... Likewise, in the informal subsector, communities and cooperatives are increasing their production of local chicken breeds, which are preferred over exotic breeds by local consumers. These investments are

19
A Cost-Benefit Analysis of Industrialization and Youth Employment in Malawi
projected to further increase production of eggs and chicken meat products in the next few years.’
The report also notes:
‘Real prices of eggs have been declining over time, making eggs more accessible to consumers. In part, this decline in egg prices is a result of increased supply on the domestic market. At the same time, volatility in egg prices has declined making the domestic egg market a relatively stable one.’
A sector report by Commercial Agriculture for Smallholders and Agribusiness (CASA 2020) provides some more context:
‘The growing market demand for poultry products in Malawi is being driven by rapid urbanisation and a growing middle class with increasing disposable income. This increase in demand has in turn given rise to commercial poultry production systems (and the supposed need for a dual-purpose bird production system). Poultry farming is still predominantly traditional, and inputs remain a challenge or non-existent for most smallholders… The transition from backyard production to more-commercial production is expected to increase rapidly over the coming years in response to demand and market forces. In addition to market forces, biosecurity and other public health issues are compelling regulators to enforce strict controls and standards for poultry keeping. External factors such as rules and regulations, the availability of (quality) inputs and knowledge and skills strongly influence the production potential of good quality poultry products.’
SME access to financeThere are several major barriers to SMEs accessing bank credit. Information asymmetry often exists because SMEs do not maintain the financial records that commercial lenders typically require to assess potential clients’ creditworthiness. SME owners may also demonstrate low financial literacy compared to more sophisticated borrowers. Similarly, SMEs are often unable to provide the level of collateral required by commercial lenders to secure the loan. Because SMEs are relatively small (by definition), the unit cost of administering a loan to SMEs tends to be higher than the unit cost of administering a loan to a larger firm. SMEs may also be perceived as being more vulnerable to shocks in the economy. As a result of these barriers, an SME may represent a much riskier customer to commercial lenders than a larger firm with detailed financial records and sufficient collateral. The elevated level of risk (whether real or perceived) associated with lending to an SME is managed by commercial lenders through the imposition of a risk premium on the interest rate charged to SME borrowers. However, risk premiums effectively increase the risk of lending to SMEs through adverse selection.19 This dynamic can fuel a reinforcing feedback loop of elevated defaults fueling lenders’ perception of elevated risk. These issues are often greater when lending to the Agriculture sector.
The IMF’s May 2018 Malawi Country Report notes that Malawi’s ratio of private sector credit to GDP is at least 6% below the expected level based on the structure of Malawi’s economy (IMF 2018). One of the supply-side drivers of this gap is the concentration of loans provided by commercial banks:
Banks tend to favor large enterprises and government assets to minimize risk. Their business model is not well-suited to SMEs and microagents. Lending to smaller businesses is costly due to the lack of information on creditors and perceived default risk. As a result, the financial system is fragmented with a large part of the population lacking access to formal financial institutions (IMF 2018).
The 2019 Finscope Malawi survey of SMEs found that two thirds of Malawi’s SMEs are credit constrained. As such, it is clear that providing these credit-constrained firms with access to finance has the potential to expand the level of investment and employment among SMEs. However, simply increasing the amount of capital available to SMEs in Malawi doesn’t guarantee optimal results. There are a number of factors that must be considered when designing an access to finance intervention. Bearing in mind this study’s focus on increased youth employment, Table 2.6 summarizes the key considerations for narrowing in on a suitable access to finance intervention model for Malawi.
Interventions that aim to facilitate increased SME access to finance typically target one or more of the aforementioned barriers. For example, financial technology companies have developed mobile applications designed to help SME owners maintain better financial records. Other institutions provide financial literacy training to SME borrowers as a means of improving record-keeping and reducing the risk of default. However, even with such interventions operating, the onus is ultimately on commercial lenders to design and originate loans to SMEs. Until lenders have experience lending to SMEs, lenders lack the detailed information needed to accurately assess and price the risk. The challenge, then, is to create the conditions in which commercial lenders can lend to SMEs at more affordable rates, without compromising the lenders’ bottom lines.
Credit guarantee schemes (CGS) are a widely adopted mechanism for reducing the risk commercial lenders face in lending to SMEs. In a CGS, a third party guarantor promises to compensate a lender for some portion of the defaulted value of a loan. In exchange, the lender agrees to lend to the target customer (SMEs) at a lower interest rate than would have been charged without the guarantee. The lower interest rate is feasible given the reduced risk afforded by the guarantee, which effectively serves as collateral for the borrower. The reduced cost of credit is a benefit to SMEs that would otherwise have been rationed out of the credit market.
The choice of guarantor and nature of the relationship between the guarantor and the lender are both critical to the success of a CGS. One approach that we would recommend would be for the Government of Malawi to approach a third party intermediary such as Guarantco or the African Guarantee Fund to manage the scheme as this would help to address a number of the challenges such as elite capture or capacity issues that can sometimes challenge the success of these schemes. The US-funded Development Finance Corporation (DFC) is another option. All of these approaches require the guarantor to work directly with the lending bank to understand
19 Higher interest rates can dissuade more responsible borrowers from applying for a loan, meaning that the lender’s portfolio of ‘risky’ SMEs may disproportionately include less responsible borrowers.

20
A Cost-Benefit Analysis of Industrialization and Youth Employment in Malawi
Table 2.6: SME CGS intervention design considerations
Intervention consideration Implications for this study
Credit conditions
Arulraj and Annamalai (2020) find that in India, despite lenders preferring highly efficient firms, external finance was detrimental to firm productivity. The interest of the formal lender is in the quick and safe repayment of the loan whereas the return on productivity improvements can only be realised in the long-term. This mismatch causes finance to hamper funded firm’s productivity.
Brixiová et al (2020) find that larger loans, smaller collateral sizes, and longer maturity periods are all associated with a stronger and more significant impact on employment. Primary research conducted for USAID found that it was possible for small enterprises to borrow up to MK 500k ($1,250 USD) from a business friend for one month at no interest (Agar 2014).
The selected intervention model should allow for, and ideally incentivize SMEs’ investment in expanded employment. One strategy to achieve this would be to target employment-intensive medium-sized firms. The lender may consider innovative forms of collateral, and may reduce collateral requirements by shifting some of the risk of lending to a third party.
Effective screening
Access to finance is most beneficial to firms that are credit-constrained (Amos and Doungahire 2019), so interventions that seek to expand access to credit should screen potential borrowers to assess whether they are credit-constrained. Lenders should also seek out firms that are already relatively efficient and have growth potential (Arulraj and Annamalai 2020).
It is assumed that the intervention will only provide finance to credit-constrained firms.
Context & sequence
Zhuang et al (2009) note that there are ‘disagreements over how financial sector development should be sequenced in developing countries’ and note that SME credit programs ‘need to be accompanied by other support services such as provision of training and capacity building, assistance in accessing markets and technologies, and addressing other market failures.’ Zidana (2015) argues: ’Increased access to financing without addressing the documented challenges of unreliable power supply, complicated business permit procedures, exorbitant tax rates, limited access to land, etc. is likely to negate... the expected benefits... to SMEs.’
The intervention should be designed in such a way as to mitigate barriers to doing business. For example, the intervention could be set up in a way that reallocates some of the risk of lending to SMEs away from the lender, allowing the lender to offer credit at a lower interest rate to SMEs.
Timescale for impact
Puatwoe and Piabuo (2017) find a negative relationship between bank deposits, private investment and economic growth in the short run, but a positive long run relationship.
Long-run impacts are ignored in this study.
the bank’s loan origination and risk assessment processes and help train staff in innovative methods of lending and risk mitigation. The increased use of technology to both deliver and monitor loans can also help to address some of the information asymmetries that arise in lending.
The risk sharing arrangement can be structured in a variety of ways, such as a pari passu (i.e. 50-50 split) arrangement between the lender and the guarantor. However, the risk need not be equally shared by the lender and the guarantor. It is important that the lender be required to maintain a high enough share of the default risk to avoid the potential for moral hazard to occur. For example, if the guarantor assumes too much of the risk the lender may feel free to invest in high-risk investments and cut costs associated with properly screening potential clients.
There are many other factors to take into consideration when undertaking the detailed design of a CGS. It is beyond the scope of this analysis to undertake such a detailed design exercise. However, there are many publicly available resources that outline the principles and best practices of CGS design. These resources include the World Bank Group’s Principles for Public Credit Guarantee Schemes (CGSs) for SMEs and GIZ’s guide SMEs’ Credit Guarantee Schemes in Developing and Emerging Economies. Additional resources are listed in the References section of this report.

21
A Cost-Benefit Analysis of Industrialization and Youth Employment in Malawi
3. Cost-benefit Analysis MethodologyCost-benefit analysis provides a way to assess which intervention options will result in the greatest impact at the most efficient cost, allowing policy makers and program managers to make informed decisions regarding their program models.
This section summarizes the methodology of the cost-benefit analysis (CBA) for the two selected interventions.
General summary of the modelsInvestment in agro-processing value chain integrationBased on the opportunities and challenges facing the soybean value chain described above, the first CBA will simulate a value chain integration intervention that aims to increase the ‘pull-factor’ for soybeans via increased production and use of poultry feed. One way to facilitate this would be to establish linkages between small-scale and commercial poultry producers through farming models such as contract farming arrangements (CFA) or nucleus-outgrower schemes (NOS). A condition of this intervention would be that commercial poultry producers are required to purchase poultry feed from local processors for the input packages provided to outgrowers. With this condition in place, Malawian soybean processors will be able to market greater quantities of soybean meal.
NOS have experienced anecdotal success in Mozambique and Kenya’s poultry sectors with positive upstream effects on soybean production via backward linkages (Dos Anjos 2014; Karnani and McKague 2016; Wainaina 2012). However, a study by Shaw et al (2019) warns:
There have been a number of investments that have attempted to utilise small farmers as outgrowers to supplement large-scale production. The idea is to give small farmers a reliable outlet for their produce and to give DOC producers a broader sales base for their chicks. Unfortunately, these types of investments tend to perform poorly because it is inefficient for companies to organise buy-back from small farmers due to logistics, biosecurity issues and side selling risks (of poultry and or the feed inputs provided). Similarly, the productivity at this scale is often lower than larger producer outgrowers (e.g. growing 5,000 or more) which is a standard model in Europe.
A study conducted by the CASA Malawi Country team notes that ‘ commercial producers see no value in developing contract farming mechanisms for the industry’ (CASA 2020). However, the same report notes that Kapani is currently piloting an outgrower scheme. LTS International also reported that commercial poultry producers in Malawi have expressed interest in and, in some cases, piloted such models (LTS International 2017). The ‘local chicken’ market niche represents a promising opportunity for the establishment of outgrower schemes. The local chicken niche demonstrates high growth potential, meaning that commercial producers might gain a strategic advantage from entering into contract arrangements with smallholders to gain access to a reliable supply of local chicken eggs.
Beesabathuni et al (2018) developed an ‘archetype’ business model for a poultry egg production outgrower business model based on empirical evidence from real-life businesses, showing that outgrower models can dramatically improve small-scale poultry farmers’ incomes. The poultry value chain also offers employment opportunities to workers of various skill levels (Table 3.1).
Table 3.1: Poultry value chain employment opportunities (CASA 2020)
Skill level Roles
Low Poultry farm attendants
Medium Industrial labourers in processing and packaging plants, administrators/managers, drivers, handy-people
High Extension and veterinary service providers
Systematic reviews have found heterogeneous and upwardly biased impacts of CFAs (Meemken and Bellemare 2019; Ton et al 2017). Poorly-designed CFAs are susceptible to elite capture, exploitation of farmers, contract breaches by both parties, and land tenure insecurity which can deepen rather than mitigate poverty and inequality. Indeed, MAIWD’s 2017 Agriculture Sector Performance Report notes:
‘Despite the existence of the various farming arrangements in the Malawi’s agricultural sector, the history of contract farming in Malawi shows that farmers have, for a long time, not benefited as much from contract farming. Buyers of agricultural commodities have often taken advantage of the lack of a clear regulatory framework on contract farming in Malawi, and exploited farmers and farm labourers (including women, children and other vulnerable groups), while not taking care of the environment in the process.’
Hall et al (2017) argue that any agricultural commercialization approach ‘must take into account local specificities of history, geography, agroecology and agrarian relations, and seek routes to more sustainable and inclusive pathways of commercialisation.’ With these considerations in mind, there is cautious agreement in the literature that well-designed CFAs and NOS can improve outcomes for various actors along the value chain. Recent case studies indicate positive results of Incentive-Based Contract Farming (IBCF) arrangements in Malawi (MOST 2017; Prosper Markets 2020), and the
22
A Cost-Benefit Analysis of Industrialization and Youth Employment in Malawi
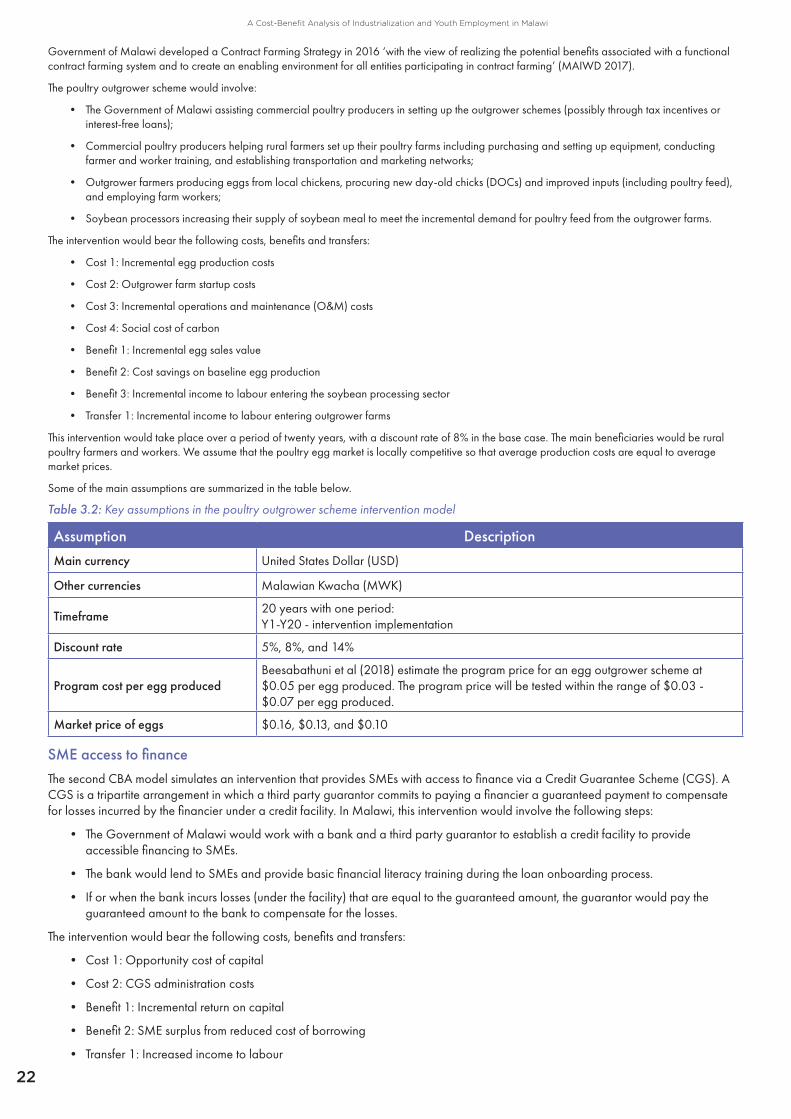
Government of Malawi developed a Contract Farming Strategy in 2016 ‘with the view of realizing the potential benefits associated with a functional contract farming system and to create an enabling environment for all entities participating in contract farming’ (MAIWD 2017).
The poultry outgrower scheme would involve:
• The Government of Malawi assisting commercial poultry producers in setting up the outgrower schemes (possibly through tax incentives or interest-free loans);
• Commercial poultry producers helping rural farmers set up their poultry farms including purchasing and setting up equipment, conducting farmer and worker training, and establishing transportation and marketing networks;
• Outgrower farmers producing eggs from local chickens, procuring new day-old chicks (DOCs) and improved inputs (including poultry feed), and employing farm workers;
• Soybean processors increasing their supply of soybean meal to meet the incremental demand for poultry feed from the outgrower farms.
The intervention would bear the following costs, benefits and transfers:
• Cost 1: Incremental egg production costs
• Cost 2: Outgrower farm startup costs
• Cost 3: Incremental operations and maintenance (O&M) costs
• Cost 4: Social cost of carbon
• Benefit 1: Incremental egg sales value
• Benefit 2: Cost savings on baseline egg production
• Benefit 3: Incremental income to labour entering the soybean processing sector
• Transfer 1: Incremental income to labour entering outgrower farms
This intervention would take place over a period of twenty years, with a discount rate of 8% in the base case. The main beneficiaries would be rural poultry farmers and workers. We assume that the poultry egg market is locally competitive so that average production costs are equal to average market prices.
Some of the main assumptions are summarized in the table below.
Table 3.2: Key assumptions in the poultry outgrower scheme intervention model
Assumption DescriptionMain currency United States Dollar (USD)
Other currencies Malawian Kwacha (MWK)
Timeframe 20 years with one period:Y1-Y20 - intervention implementation
Discount rate 5%, 8%, and 14%
Program cost per egg producedBeesabathuni et al (2018) estimate the program price for an egg outgrower scheme at $0.05 per egg produced. The program price will be tested within the range of $0.03 - $0.07 per egg produced.
Market price of eggs $0.16, $0.13, and $0.10
SME access to financeThe second CBA model simulates an intervention that provides SMEs with access to finance via a Credit Guarantee Scheme (CGS). A CGS is a tripartite arrangement in which a third party guarantor commits to paying a financier a guaranteed payment to compensate for losses incurred by the financier under a credit facility. In Malawi, this intervention would involve the following steps:
• The Government of Malawi would work with a bank and a third party guarantor to establish a credit facility to provide accessible financing to SMEs.
• The bank would lend to SMEs and provide basic financial literacy training during the loan onboarding process.
• If or when the bank incurs losses (under the facility) that are equal to the guaranteed amount, the guarantor would pay the guaranteed amount to the bank to compensate for the losses.
The intervention would bear the following costs, benefits and transfers:
• Cost 1: Opportunity cost of capital
• Cost 2: CGS administration costs
• Benefit 1: Incremental return on capital
• Benefit 2: SME surplus from reduced cost of borrowing
• Transfer 1: Increased income to labour
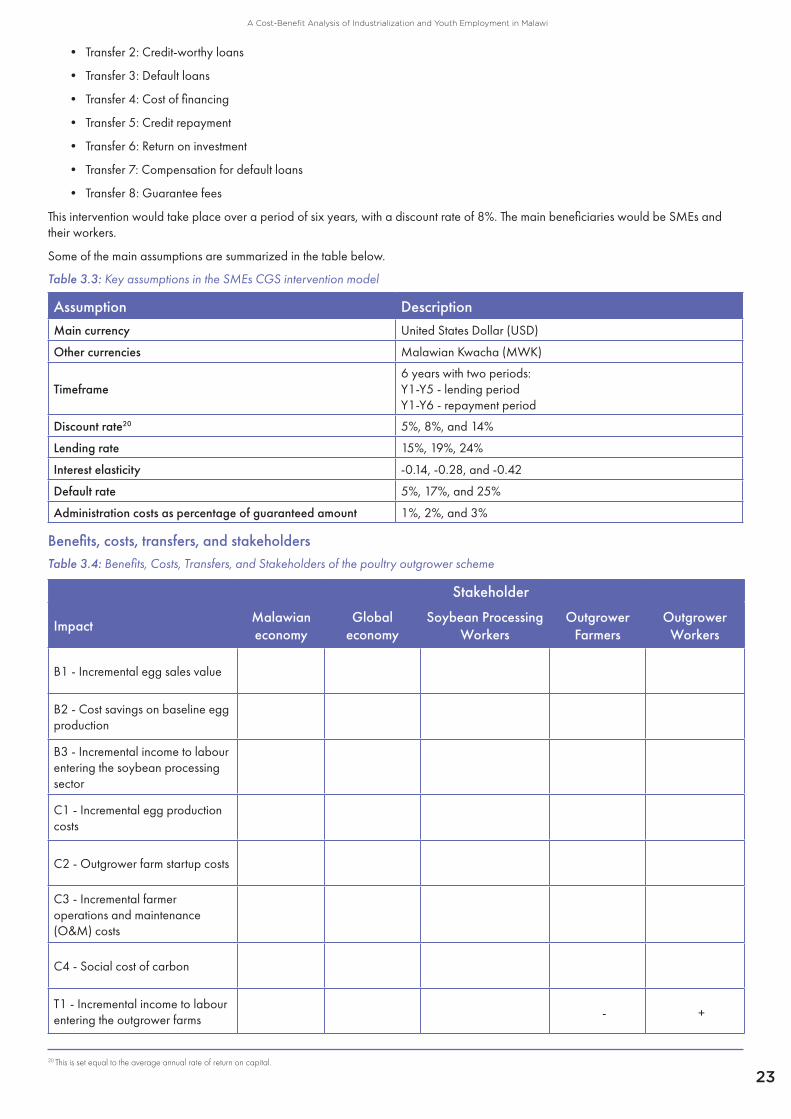
23
A Cost-Benefit Analysis of Industrialization and Youth Employment in Malawi
• Transfer 2: Credit-worthy loans
• Transfer 3: Default loans
• Transfer 4: Cost of financing
• Transfer 5: Credit repayment
• Transfer 6: Return on investment
• Transfer 7: Compensation for default loans
• Transfer 8: Guarantee fees
This intervention would take place over a period of six years, with a discount rate of 8%. The main beneficiaries would be SMEs and their workers.
Some of the main assumptions are summarized in the table below.
Table 3.3: Key assumptions in the SMEs CGS intervention model
Assumption DescriptionMain currency United States Dollar (USD)
Other currencies Malawian Kwacha (MWK)
Timeframe6 years with two periods:Y1-Y5 - lending periodY1-Y6 - repayment period
Discount rate20 5%, 8%, and 14%
Lending rate 15%, 19%, 24%
Interest elasticity -0.14, -0.28, and -0.42
Default rate 5%, 17%, and 25%
Administration costs as percentage of guaranteed amount 1%, 2%, and 3%
20 This is set equal to the average annual rate of return on capital.
Benefits, costs, transfers, and stakeholdersTable 3.4: Benefits, Costs, Transfers, and Stakeholders of the poultry outgrower scheme
Stakeholder
Impact Malawian economy
Global economy
Soybean Processing Workers
Outgrower Farmers
Outgrower Workers
B1 - Incremental egg sales value ✔
B2 - Cost savings on baseline egg production ✔
B3 - Incremental income to labour entering the soybean processing sector
✔
C1 - Incremental egg production costs ✔
C2 - Outgrower farm startup costs ✔
C3 - Incremental farmer operations and maintenance (O&M) costs
✔
C4 - Social cost of carbon ✔ ✔
T1 - Incremental income to labour entering the outgrower farms ✔- ✔+
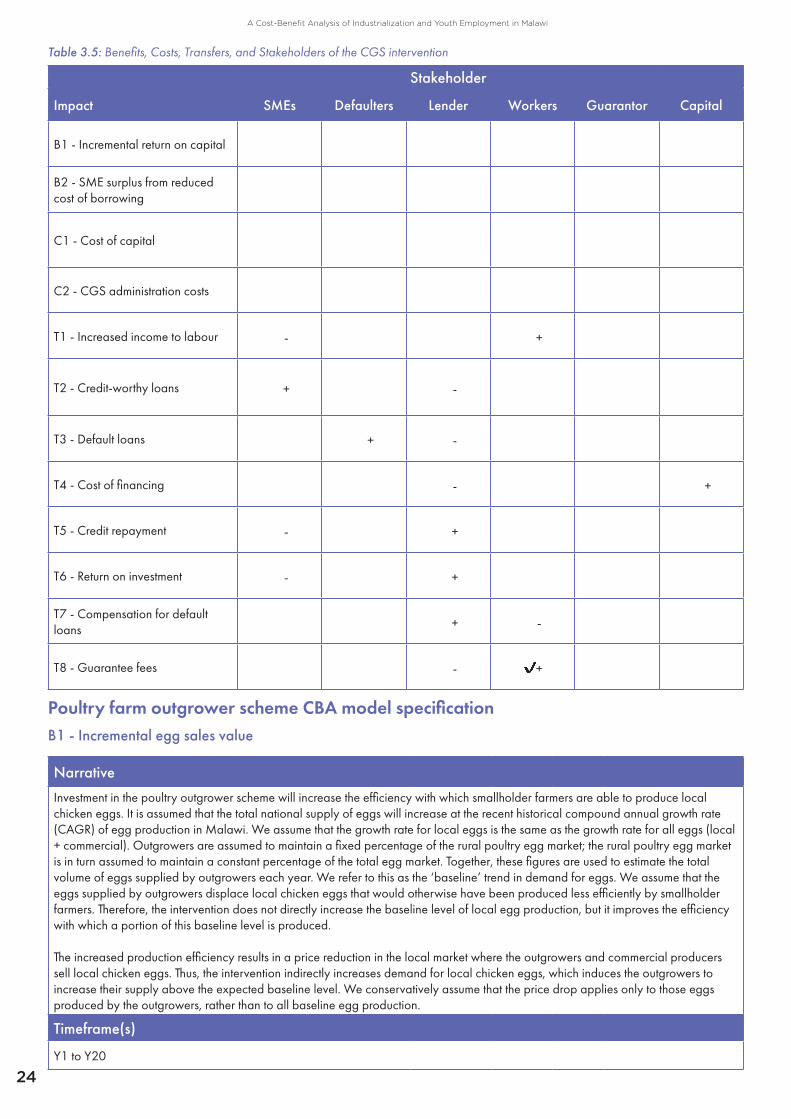
24
A Cost-Benefit Analysis of Industrialization and Youth Employment in Malawi
Table 3.5: Benefits, Costs, Transfers, and Stakeholders of the CGS intervention
Stakeholder
Impact SMEs Defaulters Lender Workers Guarantor Capital
B1 - Incremental return on capital ✔
B2 - SME surplus from reduced cost of borrowing ✔
C1 - Cost of capital ✔
C2 - CGS administration costs ✔
T1 - Increased income to labour ✔- ✔+
T2 - Credit-worthy loans ✔+ ✔-
T3 - Default loans ✔+ ✔-
T4 - Cost of financing ✔- ✔+
T5 - Credit repayment ✔- ✔+
T6 - Return on investment ✔- ✔+
T7 - Compensation for default loans ✔+ ✔-
T8 - Guarantee fees ✔- ✔+
Poultry farm outgrower scheme CBA model specificationB1 - Incremental egg sales value
Narrative
Investment in the poultry outgrower scheme will increase the efficiency with which smallholder farmers are able to produce local chicken eggs. It is assumed that the total national supply of eggs will increase at the recent historical compound annual growth rate (CAGR) of egg production in Malawi. We assume that the growth rate for local eggs is the same as the growth rate for all eggs (local + commercial). Outgrowers are assumed to maintain a fixed percentage of the rural poultry egg market; the rural poultry egg market is in turn assumed to maintain a constant percentage of the total egg market. Together, these figures are used to estimate the total volume of eggs supplied by outgrowers each year. We refer to this as the ‘baseline’ trend in demand for eggs. We assume that the eggs supplied by outgrowers displace local chicken eggs that would otherwise have been produced less efficiently by smallholder farmers. Therefore, the intervention does not directly increase the baseline level of local egg production, but it improves the efficiency with which a portion of this baseline level is produced.
The increased production efficiency results in a price reduction in the local market where the outgrowers and commercial producers sell local chicken eggs. Thus, the intervention indirectly increases demand for local chicken eggs, which induces the outgrowers to increase their supply above the expected baseline level. We conservatively assume that the price drop applies only to those eggs produced by the outgrowers, rather than to all baseline egg production.
Timeframe(s)
Y1 to Y20
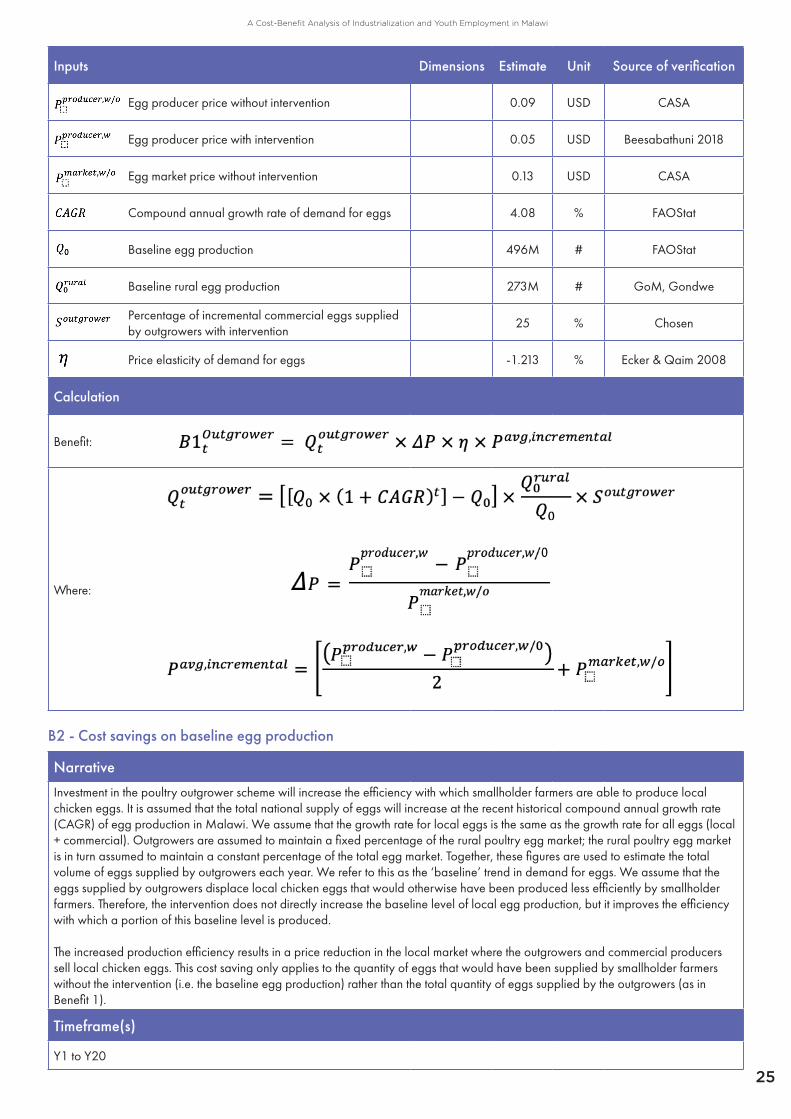
25
A Cost-Benefit Analysis of Industrialization and Youth Employment in Malawi
Inputs Dimensions Estimate Unit Source of verification
Egg producer price without intervention 0.09 USD CASA
Egg producer price with intervention 0.05 USD Beesabathuni 2018
Egg market price without intervention 0.13 USD CASA
Compound annual growth rate of demand for eggs 4.08 % FAOStat
Baseline egg production 496M # FAOStat
Baseline rural egg production 273M # GoM, Gondwe
Percentage of incremental commercial eggs supplied by outgrowers with intervention
25 % Chosen
Price elasticity of demand for eggs -1.213 % Ecker & Qaim 2008
Calculation
Benefit:
Where:
B2 - Cost savings on baseline egg production
Narrative
Investment in the poultry outgrower scheme will increase the efficiency with which smallholder farmers are able to produce local chicken eggs. It is assumed that the total national supply of eggs will increase at the recent historical compound annual growth rate (CAGR) of egg production in Malawi. We assume that the growth rate for local eggs is the same as the growth rate for all eggs (local + commercial). Outgrowers are assumed to maintain a fixed percentage of the rural poultry egg market; the rural poultry egg market is in turn assumed to maintain a constant percentage of the total egg market. Together, these figures are used to estimate the total volume of eggs supplied by outgrowers each year. We refer to this as the ‘baseline’ trend in demand for eggs. We assume that the eggs supplied by outgrowers displace local chicken eggs that would otherwise have been produced less efficiently by smallholder farmers. Therefore, the intervention does not directly increase the baseline level of local egg production, but it improves the efficiency with which a portion of this baseline level is produced.
The increased production efficiency results in a price reduction in the local market where the outgrowers and commercial producers sell local chicken eggs. This cost saving only applies to the quantity of eggs that would have been supplied by smallholder farmers without the intervention (i.e. the baseline egg production) rather than the total quantity of eggs supplied by the outgrowers (as in Benefit 1).
Timeframe(s)
Y1 to Y20

26
A Cost-Benefit Analysis of Industrialization and Youth Employment in Malawi
Inputs Dimensions Estimate Unit Source of verification
Egg producer price without intervention 0.09 USD CASA
Egg producer price with intervention 0.05 USD Beesabathuni 2018
Compound annual growth rate of demand for eggs 0.13 % FAOStat
Baseline egg production 4.08 # FAOStat
Baseline rural egg production 496M # GoM, Gondwe
Percentage of incremental commercial eggs supplied by outgrowers with intervention
273M % Assumed
Calculation
Benefit:
Where:
B3 - Incremental income to labour entering the soybean processing sector
NarrativeOne of the mechanisms through which this increased efficiency is achieved is through the use of improved chicken feed. Soybean meal constitutes a substantial fraction of the value of chicken feed. We assume that the outgrowers are required to source their feed from local producers. Since we assume that the eggs supplied by outgrowers displace local chicken eggs that would otherwise have been produced less efficiently by smallholder farmers, the incremental demand for chicken feed is driven by the total quantity of eggs supplied by outgrowers (baseline + incremental supply). The increase in value added by soybean processors in response to the increased demand for chicken feed necessitates an increase in the amount of labour inputs into their production processes, resulting in increased income to labour. The opportunity cost of labour is assumed to be equal to the average remuneration per employee in mixed farming activities.
Timeframe(s)
Y1 - Y20
Inputs Dimensions Estimate Unit Source of verification
Ratio of labour income to value added in fats and oils processing sector
0.24 # IFPRI, FRED
Remuneration per employee in fats and oils manufacturing
Time 1,645 USD NSO Malawi
Remuneration per employee in mixed farming Time 183 USD NSO Malawi
Soybean oil market price 999 USD ITC Trademap
Soybean oilcake market price 407 USD ITC Trademap
Ratio of oil : oilcake produced in soybean processing
0.23 # Goldsmith 2020
Compound annual growth rate of demand for eggs
4.08 % FAOStat
Baseline egg production 496M # FAOStat
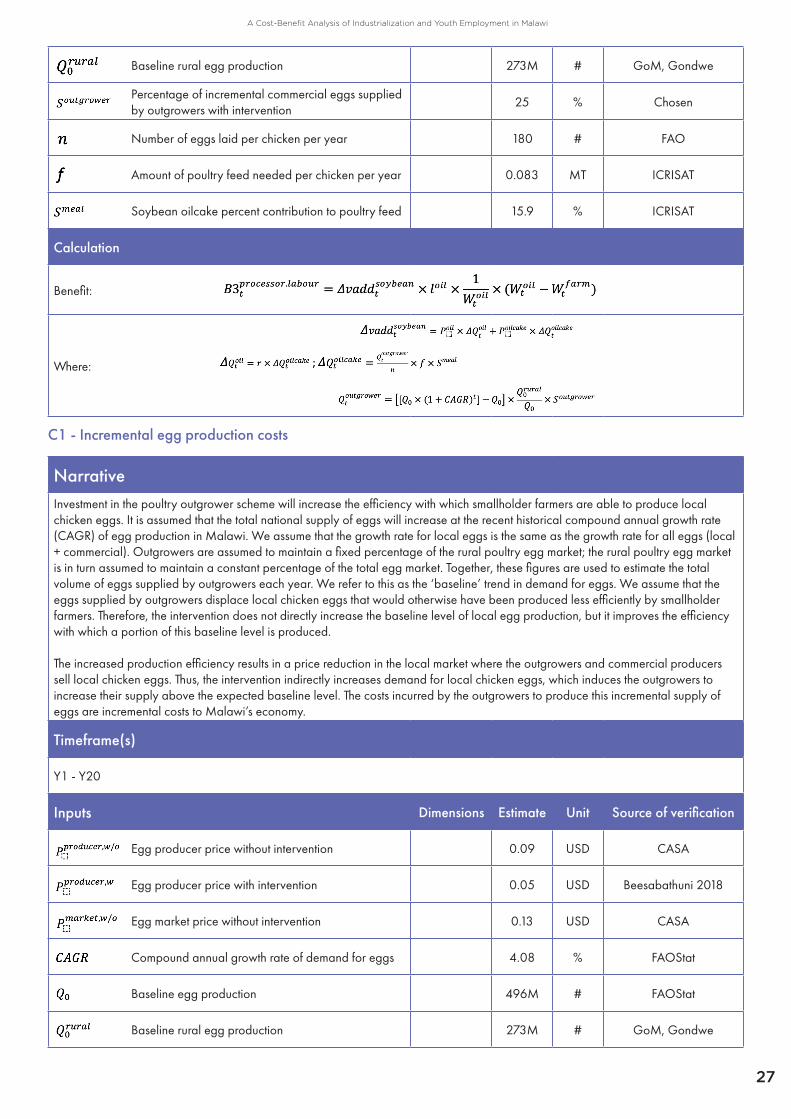
27
A Cost-Benefit Analysis of Industrialization and Youth Employment in Malawi
Baseline rural egg production 273M # GoM, Gondwe
Percentage of incremental commercial eggs supplied by outgrowers with intervention
25 % Chosen
Number of eggs laid per chicken per year 180 # FAO
Amount of poultry feed needed per chicken per year 0.083 MT ICRISAT
Soybean oilcake percent contribution to poultry feed 15.9 % ICRISAT
Calculation
Benefit:
Where:
C1 - Incremental egg production costs
NarrativeInvestment in the poultry outgrower scheme will increase the efficiency with which smallholder farmers are able to produce local chicken eggs. It is assumed that the total national supply of eggs will increase at the recent historical compound annual growth rate (CAGR) of egg production in Malawi. We assume that the growth rate for local eggs is the same as the growth rate for all eggs (local + commercial). Outgrowers are assumed to maintain a fixed percentage of the rural poultry egg market; the rural poultry egg market is in turn assumed to maintain a constant percentage of the total egg market. Together, these figures are used to estimate the total volume of eggs supplied by outgrowers each year. We refer to this as the ‘baseline’ trend in demand for eggs. We assume that the eggs supplied by outgrowers displace local chicken eggs that would otherwise have been produced less efficiently by smallholder farmers. Therefore, the intervention does not directly increase the baseline level of local egg production, but it improves the efficiency with which a portion of this baseline level is produced.
The increased production efficiency results in a price reduction in the local market where the outgrowers and commercial producers sell local chicken eggs. Thus, the intervention indirectly increases demand for local chicken eggs, which induces the outgrowers to increase their supply above the expected baseline level. The costs incurred by the outgrowers to produce this incremental supply of eggs are incremental costs to Malawi’s economy.
Timeframe(s)
Y1 - Y20
Inputs Dimensions Estimate Unit Source of verification
Egg producer price without intervention 0.09 USD CASA
Egg producer price with intervention 0.05 USD Beesabathuni 2018
Egg market price without intervention 0.13 USD CASA
Compound annual growth rate of demand for eggs 4.08 % FAOStat
Baseline egg production 496M # FAOStat
Baseline rural egg production 273M # GoM, Gondwe

28
A Cost-Benefit Analysis of Industrialization and Youth Employment in Malawi
Percentage of incremental commercial eggs supplied by outgrowers with intervention
25 % Assumed
Price elasticity of demand for eggs -1.213 % Ecker & Qaim 2008
Calculation
Benefit:
Where
C2 - Farm capital investments
C3 - Recurring capital costs
NarrativeMoney required to start a poultry farm: includes infrastructure (building and cages) and starter pack, as well as any costs associated with training farmers and farm workers.
Timeframe(s)
Y1 - Y20
Inputs Dimensions Estimate Unit Source of verification
Start-up capital required per outgrower farm Time 30,000 USD Beesabathuni et al 2018
Number of outgrower farms participating in the intervention
TimeSee
model# Chosen
Calculation
Cost:
Narrative
Recurring capital required during each laying cycle to re-populate hen population.
Timeframe(s)
Y1 - Y20
Inputs Dimensions Estimate Unit Source of verification
Recurring capital required per outgrower farm Time 9,000 USD Beesabathuni et al 2018
Number of outgrower farms participating in the intervention
TimeSee
model# Chosen
Calculation
Cost:

29
A Cost-Benefit Analysis of Industrialization and Youth Employment in Malawi
C4 - Social cost of carbon
NarrativeInvestment in the poultry outgrower scheme will increase the efficiency with which smallholder farmers are able to produce local chicken eggs. It is assumed that the total national supply of eggs will increase at the recent historical compound annual growth rate (CAGR) of egg production in Malawi. We assume that the growth rate for local eggs is the same as the growth rate for all eggs (local + commercial). Outgrowers are assumed to maintain a fixed percentage of the rural poultry egg market; the rural poultry egg market is in turn assumed to maintain a constant percentage of the total egg market. Together, these figures are used to estimate the total volume of eggs supplied by outgrowers each year. We refer to this as the ‘baseline’ trend in demand for eggs. We assume that the eggs supplied by outgrowers displace local chicken eggs that would otherwise have been produced less efficiently by smallholder farmers. Therefore, the intervention does not directly increase the baseline level of local egg production, but it improves the efficiency with which a portion of this baseline level is produced.
The increased production efficiency results in a price reduction in the local market where the outgrowers and commercial producers sell local chicken eggs. Thus, the intervention indirectly increases demand for local chicken eggs, which induces the outgrowers to increase their supply above the expected baseline level. This increased egg supply generates increased greenhouse gas emissions, which can be accounted for using the social cost of carbon.
Timeframe(s)
Y1 - Y20
Inputs Dimensions Estimate Unit Source of verification
Egg producer price without intervention Time 0.09 USD CASA
Egg producer price with intervention Time 0.05 USD Beesabathuni 2018
Egg market price without intervention 0.13 USD CASA
Compound annual growth rate of demand for eggs
4.08 % FAOStat
Baseline egg production 496M # FAOStat
Baseline rural egg production 273M # GoM, Gondwe
Percentage of incremental commercial eggs supplied by outgrowers with intervention
25 % Assumed
Price elasticity of demand for eggs -1.213 % Ecker & Qaim 2008
Mass of an egg 0.043 kg FAO
Carbon dioxide emissions per kg of egg produced 3.7 kg FAO
Global social cost of carbon per kg of CO2eq emissions
See model
USD Tol 2018
Calculation
Cost:
Where:

30
A Cost-Benefit Analysis of Industrialization and Youth Employment in Malawi
T1 - Incremental income to labour entering the outgrower farms
NarrativeA portion of the value added by outgrowers through incremental egg production is allocated to labour inputs into their production processes, resulting in increased income to labour. The opportunity cost of labour is assumed to be equal to the average remuneration per employee in mixed farming activities.
Timeframe(s)
Y1 - Y20
Inputs Dimensions Estimate Unit Source of verification
Ratio of labour income to value added in meat processing sector
0.21 # IFPRI, FRED
Remuneration per employee in poultry raising Time 548 USD NSO Malawi
Remuneration per employee in mixed farming Time 183 USD NSO Malawi
Egg producer price with intervention 0.05 USD CASA
Compound annual growth rate of demand for eggs 4.08 % FAOStat
Baseline egg production 496M # FAOStat
Baseline rural egg production 273M # GoM, Gondwe
Percentage of incremental commercial eggs supplied by outgrowers with intervention
25 % Assumed
Calculation
Transfer:
Where

31
A Cost-Benefit Analysis of Industrialization and Youth Employment in Malawi
CGS scheme CBA model specificationB1 - Incremental return on capital
NarrativeIncreasing access to credit will allow financially-constrained SMEs to invest in expanding their production base. The firms’ incremental return on capital represents the net benefits to Malawi of SMEs’ investments. The rate of default on the loans as well as the rate of depreciation of capital assets are not explicitly included in the formula, as these are already accounted for in the rate of return on capital.
Timeframe(s)
Repayment period (Y1 - Y6)
Inputs Dimensions Estimate Unit Source of verification
Total domestic credit to private sector by banks in Malawi
Time 1.2B USD World Bank
Loan price elasticity -0.28 # Karlan 2005
Risk-free lending rate 8.74 % World Bank
Commercial lending rate without the intervention 25.14 % World Bank
Expected cumulative default probability at loan maturity with intervention
17.1 % Calice 2016
Loan maturity 2 years Chosen
Return on capital employed 15.22 % IFPRI, FRED
Calculation
Transfer:
Where

32
A Cost-Benefit Analysis of Industrialization and Youth Employment in Malawi
B2 - SME surplus from reduced cost of borrowing
NarrativeThe credit guarantee scheme will allow lenders to reduce the risk premiums charged on loans to SMEs, reducing the cost of finance for SMEs. This reduction in the cost of borrowing is a benefit to SMEs who would otherwise have been rationed out of the credit market. In Year 1 and Year 6, only the first and fifth loan cohort pay interest respectively. In all other years, two loan cohorts each pay interest on the outstanding loans.
Timeframe(s)
Repayment period (Y1 - Y6)
Inputs Dimensions Estimate Unit Source of verification
Total domestic credit to private sector by banks in Malawi
Time 1.2B USD World Bank
Loan price elasticity -0.28 # Karlan 2005
Risk-free lending rate 8.74 % World Bank
Commercial lending rate without the intervention 25.14 % World Bank
Expected cumulative default probability at loan maturity with intervention
17.1 % Calice 2016
Loan maturity 2 years Chosen
Return on capital employed 15.22 % IFPRI, FRED
Calculation
Transfer:
Where

33
A Cost-Benefit Analysis of Industrialization and Youth Employment in Malawi
C1 - Cost of capital
NarrativeThis is the opportunity cost of funds that are channeled into the SMEs. The opportunity cost is calculated based on the average rate of return on capital in the economy.
Timeframe(s)
Repayment period (Y1 - Y6)
Inputs Dimensions Estimate Unit Source of verification
Total domestic credit to private sector by banks in Malawi
Time 1.2B USD World Bank
Loan price elasticity -0.28 # Karlan 2005
Risk-free lending rate 8.74 % World Bank
Commercial lending rate without the intervention 25.14 % World Bank
Expected cumulative default probability at loan maturity with intervention
17.1 % Calice 2016
Loan maturity 2 years Chosen
Opportunity cost of capital 15.22 % IFPRI, FRED
Calculation
Transfer:
Where

34
A Cost-Benefit Analysis of Industrialization and Youth Employment in Malawi
C2 - CGS administration costs
NarrativeThe cost of operating the CGS. These costs are covered through ‘guarantee fees’ which typically range from 0.5 - 3.65% of the guaranteed amount (ADB 2021). We assume that guarantee fees are exactly equal to the administration costs.
Timeframe(s)
Repayment period (Y1 - Y6)
Inputs Dimensions Estimate Unit Source of verification
Total domestic credit to private sector by banks in Malawi
Time 1.2B USD World Bank
Loan price elasticity -0.28 # Karlan 2005
Risk-free lending rate 8.74 % World Bank
Commercial lending rate without the intervention 25.14 % World Bank
Expected cumulative default probability at loan maturity with intervention
17.1 % Calice 2016
Loan maturity 2 years Chosen
Administration costs as percentage of guaranteed amount
2% % ADB 2021
Calculation
Transfer:
Where:
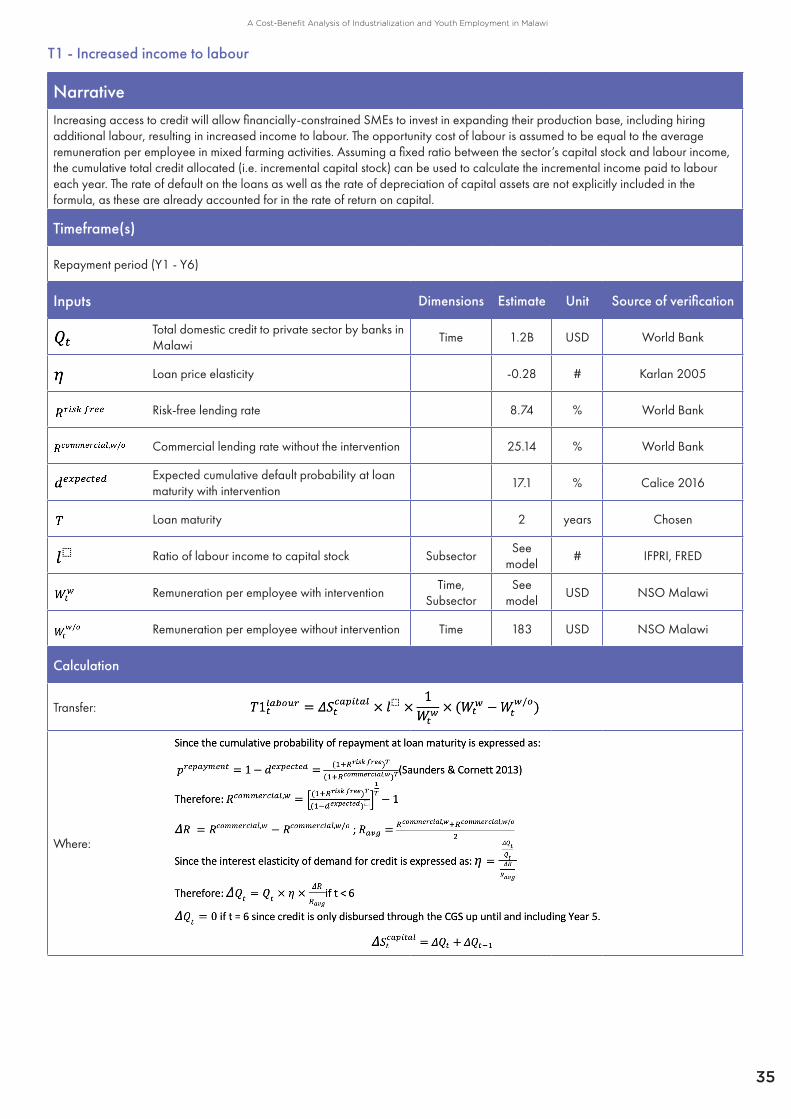
35
A Cost-Benefit Analysis of Industrialization and Youth Employment in Malawi
T1 - Increased income to labour
NarrativeIncreasing access to credit will allow financially-constrained SMEs to invest in expanding their production base, including hiring additional labour, resulting in increased income to labour. The opportunity cost of labour is assumed to be equal to the average remuneration per employee in mixed farming activities. Assuming a fixed ratio between the sector’s capital stock and labour income, the cumulative total credit allocated (i.e. incremental capital stock) can be used to calculate the incremental income paid to labour each year. The rate of default on the loans as well as the rate of depreciation of capital assets are not explicitly included in the formula, as these are already accounted for in the rate of return on capital.
Timeframe(s)
Repayment period (Y1 - Y6)
Inputs Dimensions Estimate Unit Source of verification
Total domestic credit to private sector by banks in Malawi
Time 1.2B USD World Bank
Loan price elasticity -0.28 # Karlan 2005
Risk-free lending rate 8.74 % World Bank
Commercial lending rate without the intervention 25.14 % World Bank
Expected cumulative default probability at loan maturity with intervention
17.1 % Calice 2016
Loan maturity 2 years Chosen
Ratio of labour income to capital stock SubsectorSee
model# IFPRI, FRED
Remuneration per employee with interventionTime,
SubsectorSee
modelUSD NSO Malawi
Remuneration per employee without intervention Time 183 USD NSO Malawi
Calculation
Transfer:
Where:

36
A Cost-Benefit Analysis of Industrialization and Youth Employment in Malawi
T2 - Credit-worthy loans
Narrative
Credit lent to credit-worthy SMEs.
Timeframe(s)
Lending period (Y1 - Y5)
Inputs Dimensions Estimate Unit Source of verification
Total domestic credit to private sector by banks in Malawi
Time 1.2B USD World Bank
Loan price elasticity -0.28 # Karlan 2005
Risk-free lending rate 8.74 % World Bank
Commercial lending rate without the intervention 25.14 % World Bank
Expected cumulative default probability at loan maturity with intervention
17.1 % Calice 2016
Loan maturity 2 years Chosen
Calculation
Transfer:
Where
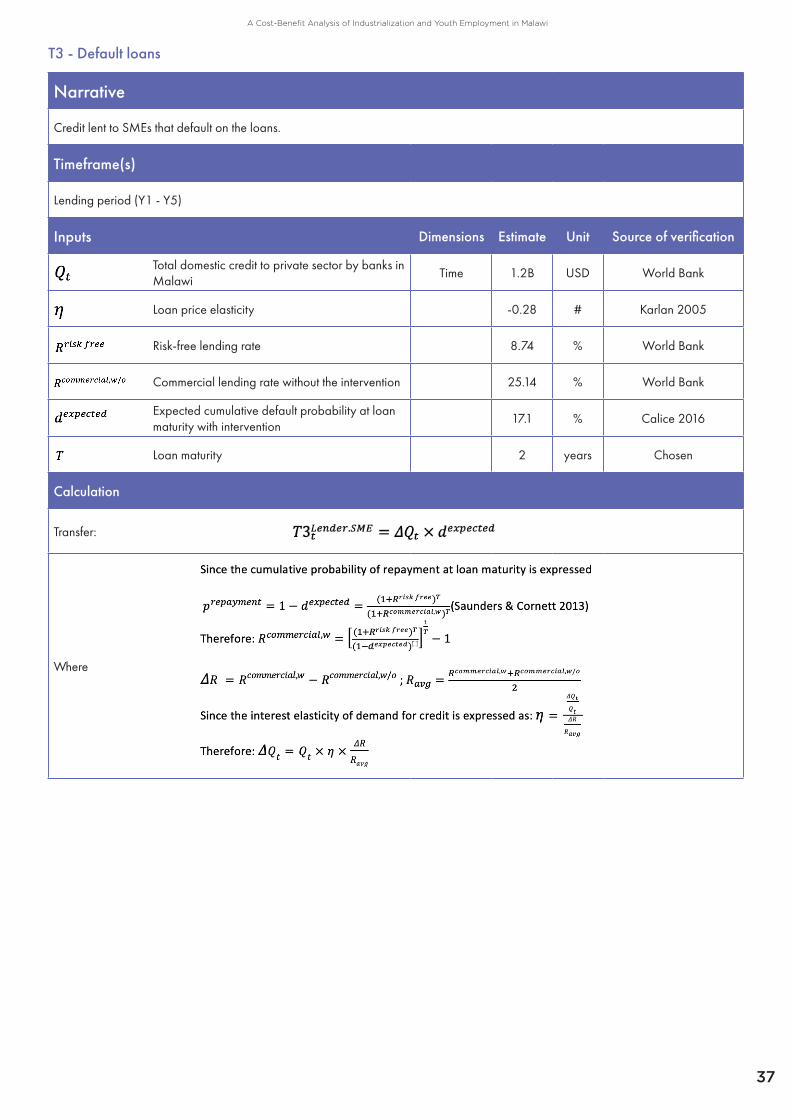
37
A Cost-Benefit Analysis of Industrialization and Youth Employment in Malawi
T3 - Default loans
Narrative
Credit lent to SMEs that default on the loans.
Timeframe(s)
Lending period (Y1 - Y5)
Inputs Dimensions Estimate Unit Source of verification
Total domestic credit to private sector by banks in Malawi
Time 1.2B USD World Bank
Loan price elasticity -0.28 # Karlan 2005
Risk-free lending rate 8.74 % World Bank
Commercial lending rate without the intervention 25.14 % World Bank
Expected cumulative default probability at loan maturity with intervention
17.1 % Calice 2016
Loan maturity 2 years Chosen
Calculation
Transfer:
Where

38
A Cost-Benefit Analysis of Industrialization and Youth Employment in Malawi
T4 - Cost of financing
Narrative
The cost of financing the loans incurred by the lender.
Timeframe(s)
Lending period (Y1 - Y5)
Inputs Dimensions Estimate Unit Source of verification
Financing costs 12 % Reserve Bank of Malawi
Total domestic credit to private sector by banks in Malawi Time 1.2B USD World Bank
Loan price elasticity -0.28 # Karlan 2005
Risk-free lending rate 8.74 % World Bank
Commercial lending rate without the intervention 25.14 % World Bank
Expected cumulative default probability at loan maturity with intervention
17.1 % Calice 2016
Loan maturity 2 years Chosen
Calculation
Transfer:
Where

39
A Cost-Benefit Analysis of Industrialization and Youth Employment in Malawi
T5 - Credit repayment
NarrativePrincipal repaid by SMEs to the lender. We assume half of the principal of the first loan cohort is paid in Year 1, and half of the principal of the fifth loan cohort is paid in Year 6. In all other years, two loan cohorts each pay half of the total principal on the outstanding loans.
Timeframe(s)
Repayment period (Y1 - Y6)
Inputs Dimensions Estimate Unit Source of verification
Total domestic credit to private sector by banks in Malawi
Time 1.2B USD World Bank
Loan price elasticity -0.28 # Karlan 2005
Risk-free lending rate 8.74 % World Bank
Commercial lending rate without the intervention 25.14 % World Bank
Expected cumulative default probability at loan maturity with intervention
17.1 % Calice 2016
Loan maturity 2 years Chosen
Calculation
Transfer:
Where

40
A Cost-Benefit Analysis of Industrialization and Youth Employment in Malawi
T6 - Return on investment
NarrativeEach year, the lender collects interest on the outstanding debt issued to SMEs through the intervention. In Year 1 and Year 6, only the first and fifth loan cohort pay interest respectively. In all other years, two loan cohorts each pay interest on the outstanding loans.
Timeframe(s)
Repayment period (Y1 - Y6)
Inputs Dimensions Estimate Unit Source of verification
Total domestic credit to private sector by banks in Malawi
Time 1.2B USD World Bank
Loan price elasticity -0.28 # Karlan 2005
Risk-free lending rate 8.74 % World Bank
Commercial lending rate without the intervention 25.14 % World Bank
Expected cumulative default probability at loan maturity with intervention
17.1 % Calice 2016
Loan maturity 2 years Chosen
Calculation
Transfer:
Where
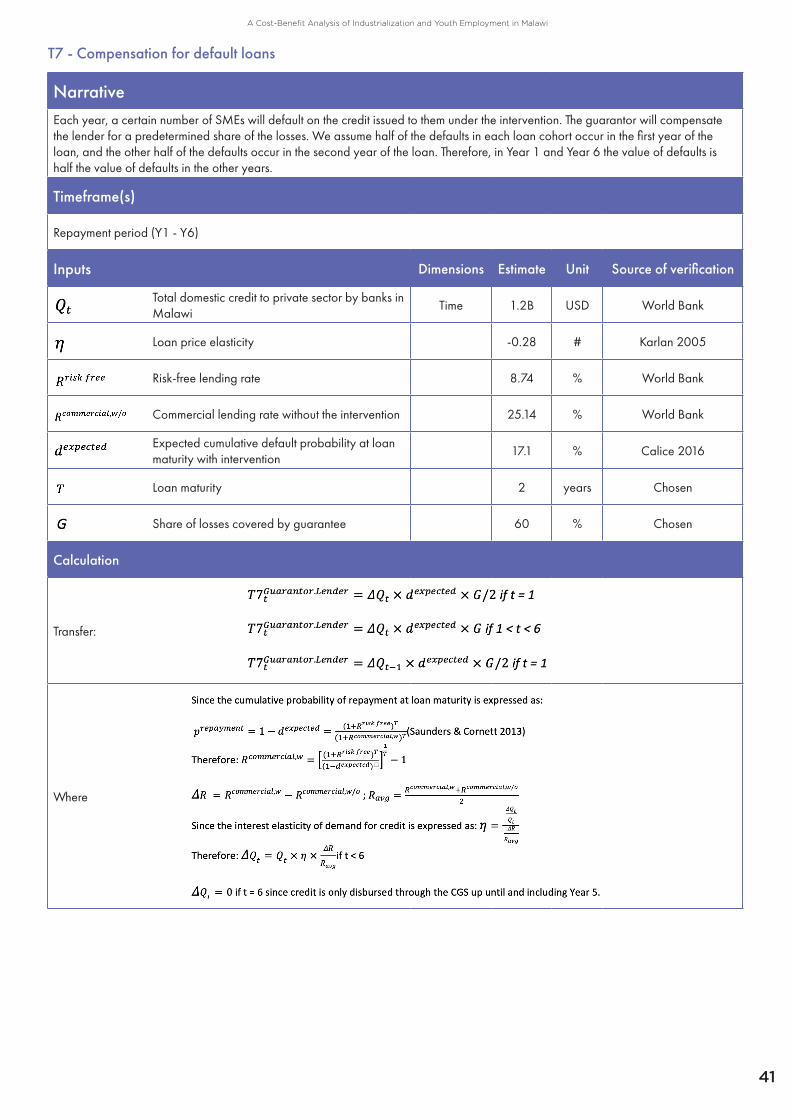
41
A Cost-Benefit Analysis of Industrialization and Youth Employment in Malawi
T7 - Compensation for default loans
NarrativeEach year, a certain number of SMEs will default on the credit issued to them under the intervention. The guarantor will compensate the lender for a predetermined share of the losses. We assume half of the defaults in each loan cohort occur in the first year of the loan, and the other half of the defaults occur in the second year of the loan. Therefore, in Year 1 and Year 6 the value of defaults is half the value of defaults in the other years.
Timeframe(s)
Repayment period (Y1 - Y6)
Inputs Dimensions Estimate Unit Source of verification
Total domestic credit to private sector by banks in Malawi
Time 1.2B USD World Bank
Loan price elasticity -0.28 # Karlan 2005
Risk-free lending rate 8.74 % World Bank
Commercial lending rate without the intervention 25.14 % World Bank
Expected cumulative default probability at loan maturity with intervention
17.1 % Calice 2016
Loan maturity 2 years Chosen
Share of losses covered by guarantee 60 % Chosen
Calculation
Transfer:
Where
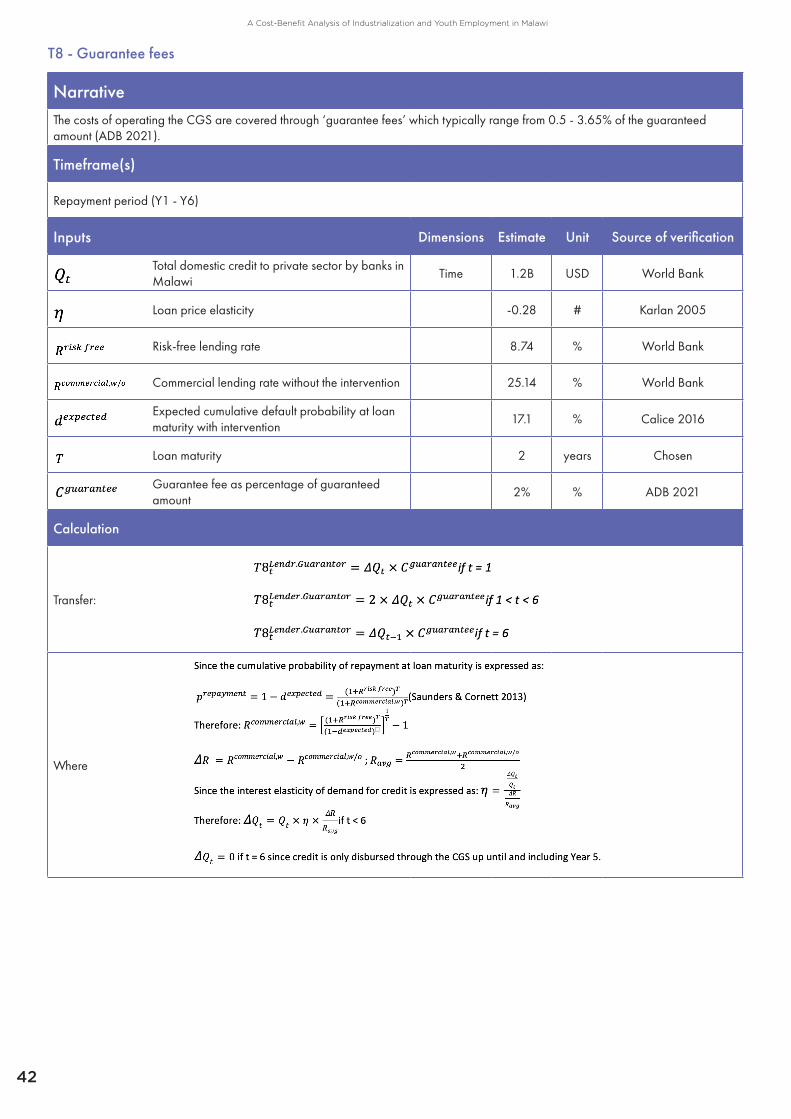
42
A Cost-Benefit Analysis of Industrialization and Youth Employment in Malawi
T8 - Guarantee fees
NarrativeThe costs of operating the CGS are covered through ‘guarantee fees’ which typically range from 0.5 - 3.65% of the guaranteed amount (ADB 2021).
Timeframe(s)
Repayment period (Y1 - Y6)
Inputs Dimensions Estimate Unit Source of verification
Total domestic credit to private sector by banks in Malawi
Time 1.2B USD World Bank
Loan price elasticity -0.28 # Karlan 2005
Risk-free lending rate 8.74 % World Bank
Commercial lending rate without the intervention 25.14 % World Bank
Expected cumulative default probability at loan maturity with intervention
17.1 % Calice 2016
Loan maturity 2 years Chosen
Guarantee fee as percentage of guaranteed amount
2% % ADB 2021
Calculation
Transfer:
Where
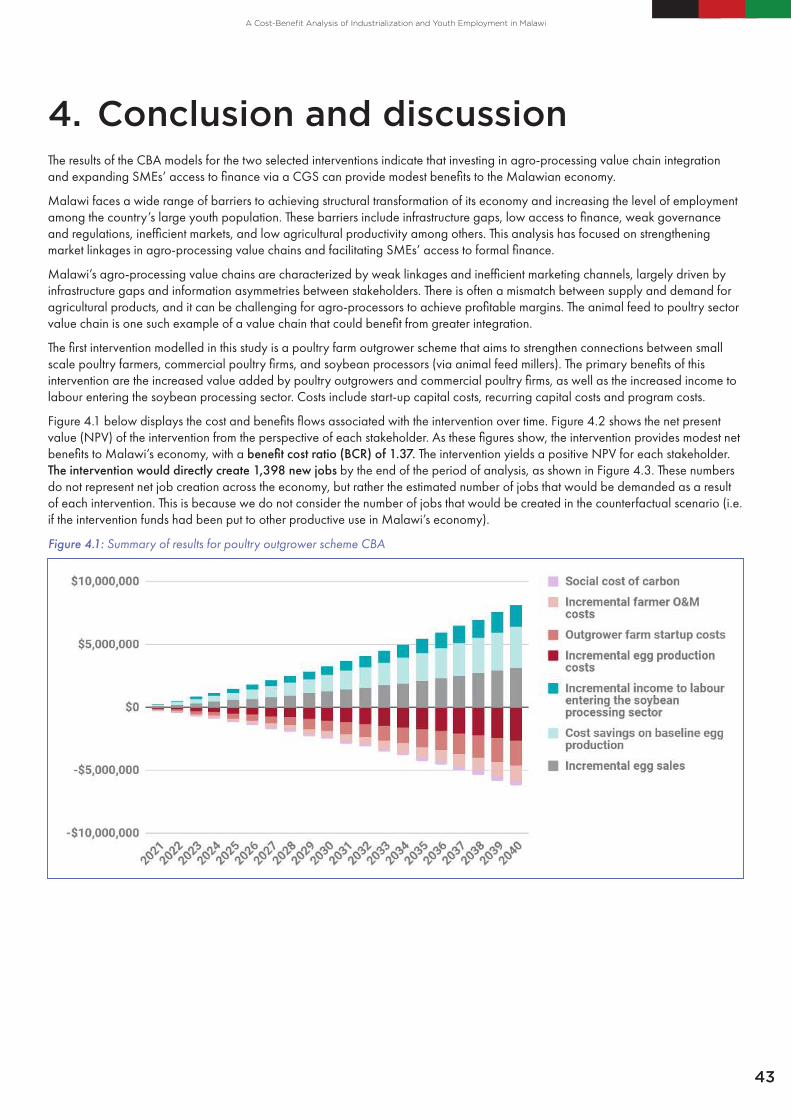
43
A Cost-Benefit Analysis of Industrialization and Youth Employment in Malawi
4. Conclusion and discussionThe results of the CBA models for the two selected interventions indicate that investing in agro-processing value chain integration and expanding SMEs’ access to finance via a CGS can provide modest benefits to the Malawian economy.
Malawi faces a wide range of barriers to achieving structural transformation of its economy and increasing the level of employment among the country’s large youth population. These barriers include infrastructure gaps, low access to finance, weak governance and regulations, inefficient markets, and low agricultural productivity among others. This analysis has focused on strengthening market linkages in agro-processing value chains and facilitating SMEs’ access to formal finance.
Malawi’s agro-processing value chains are characterized by weak linkages and inefficient marketing channels, largely driven by infrastructure gaps and information asymmetries between stakeholders. There is often a mismatch between supply and demand for agricultural products, and it can be challenging for agro-processors to achieve profitable margins. The animal feed to poultry sector value chain is one such example of a value chain that could benefit from greater integration.
The first intervention modelled in this study is a poultry farm outgrower scheme that aims to strengthen connections between small scale poultry farmers, commercial poultry firms, and soybean processors (via animal feed millers). The primary benefits of this intervention are the increased value added by poultry outgrowers and commercial poultry firms, as well as the increased income to labour entering the soybean processing sector. Costs include start-up capital costs, recurring capital costs and program costs.
Figure 4.1 below displays the cost and benefits flows associated with the intervention over time. Figure 4.2 shows the net present value (NPV) of the intervention from the perspective of each stakeholder. As these figures show, the intervention provides modest net benefits to Malawi’s economy, with a benefit cost ratio (BCR) of 1.37. The intervention yields a positive NPV for each stakeholder. The intervention would directly create 1,398 new jobs by the end of the period of analysis, as shown in Figure 4.3. These numbers do not represent net job creation across the economy, but rather the estimated number of jobs that would be demanded as a result of each intervention. This is because we do not consider the number of jobs that would be created in the counterfactual scenario (i.e. if the intervention funds had been put to other productive use in Malawi’s economy).
Figure 4.1: Summary of results for poultry outgrower scheme CBA
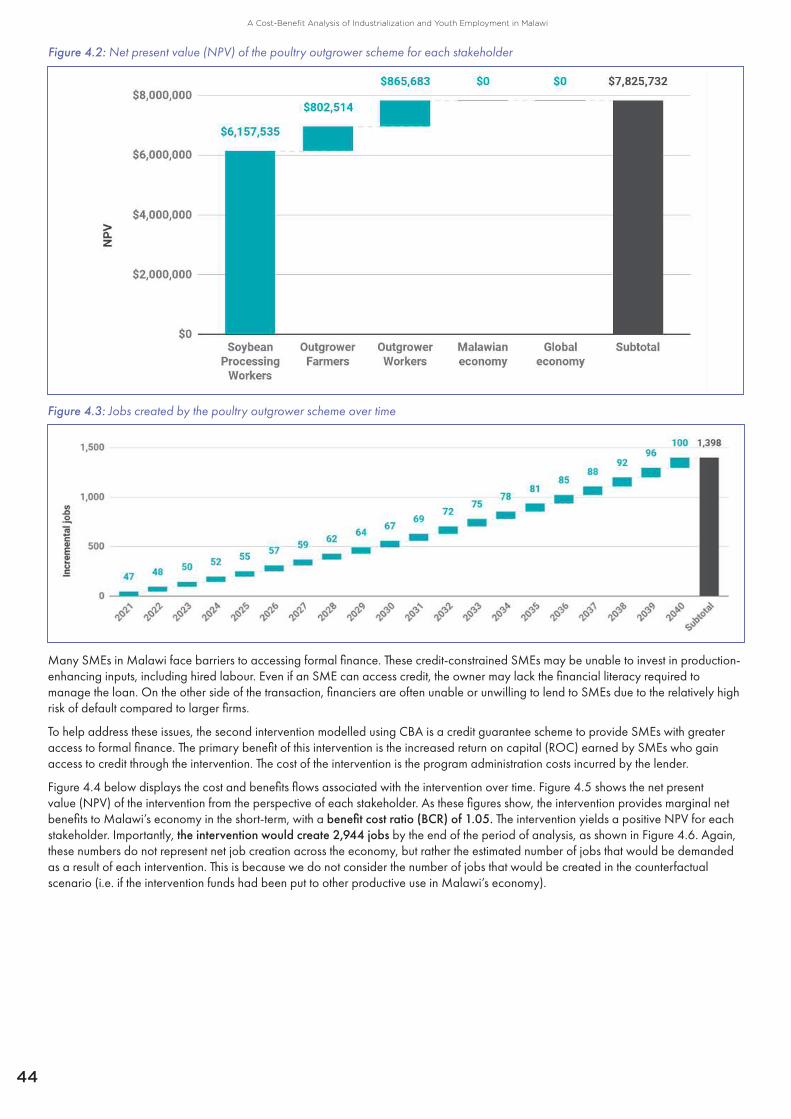
44
A Cost-Benefit Analysis of Industrialization and Youth Employment in Malawi
Figure 4.2: Net present value (NPV) of the poultry outgrower scheme for each stakeholder
Figure 4.3: Jobs created by the poultry outgrower scheme over time
Many SMEs in Malawi face barriers to accessing formal finance. These credit-constrained SMEs may be unable to invest in production-enhancing inputs, including hired labour. Even if an SME can access credit, the owner may lack the financial literacy required to manage the loan. On the other side of the transaction, financiers are often unable or unwilling to lend to SMEs due to the relatively high risk of default compared to larger firms.
To help address these issues, the second intervention modelled using CBA is a credit guarantee scheme to provide SMEs with greater access to formal finance. The primary benefit of this intervention is the increased return on capital (ROC) earned by SMEs who gain access to credit through the intervention. The cost of the intervention is the program administration costs incurred by the lender.
Figure 4.4 below displays the cost and benefits flows associated with the intervention over time. Figure 4.5 shows the net present value (NPV) of the intervention from the perspective of each stakeholder. As these figures show, the intervention provides marginal net benefits to Malawi’s economy in the short-term, with a benefit cost ratio (BCR) of 1.05. The intervention yields a positive NPV for each stakeholder. Importantly, the intervention would create 2,944 jobs by the end of the period of analysis, as shown in Figure 4.6. Again, these numbers do not represent net job creation across the economy, but rather the estimated number of jobs that would be demanded as a result of each intervention. This is because we do not consider the number of jobs that would be created in the counterfactual scenario (i.e. if the intervention funds had been put to other productive use in Malawi’s economy).

45
A Cost-Benefit Analysis of Industrialization and Youth Employment in Malawi
Figure 4.4: Jobs created by the poultry outgrower scheme over time
Figure 4.5: Jobs created by the poultry outgrower scheme over time
Figure 4.5: Jobs created by the poultry outgrower scheme over time

46
A Cost-Benefit Analysis of Industrialization and Youth Employment in Malawi
The baseline results assume that the credit is allocated proportionally to the sizes of each of Malawi’s industries. However, some industries might generate more labour income per incremental unit of capital than other sub sectors. The CGS may be designed to target SMEs in sectors with relatively high job creation potential. However, it is likely not feasible to target a single industry with the full amount of the credit guarantee, as it is unlikely that a single industry could absorb such a large influx of capital in a short period of time.
Sensitivity analysisIn order to identify which assumptions are the most critical to the success of each intervention, the team has conducted some basic sensitivity analyses. The following tables report the BCR when alternative input values are assumed for key parameters.
The first parameter we explore is the discount rate. As a default, both models use an 8% discount rate. We find that the BCR is not sensitive to changes in the discount rate.
Table 4.1: Sensitivity analysis for discount rate
Table 4.2: Sensitivity analysis for poultry outgrower scheme program cost
Table 4.3: Sensitivity analysis for poultry outgrower scheme program cost
Table 4.4: Sensitivity analysis for commercial lending rate
Discount Rate
Parameter value 5% 8% 14%
Poultry outgrower scheme 1.36 1.37 1.36
SME CGS 1.05 1.05 1.05
Beesabathuni et al (2018) estimate the program cost of a commercial poultry egg outgrower scheme at $0.03 per egg produced per year, assuming each hen lays 290 eggs per year. The FAO (2003) notes that egg production is more likely to be in the range of 180 eggs per year in dry hot climates such as Malawi, which implies a program cost of $0.05 per egg produced per year under the intervention. Table 4.2 shows that, if the program cost were to rise to $0.07 per egg produced, the intervention would yield only marginal benefits for Malawi with a BCR of 1.04. On the other hand, a lower program cost of $0.03 per egg produced would increase the benefits to Malawi with a BCR of 1.61.
Program cost per egg produced
Parameter value $0.03 $0.05 $0.07
BCR 1.61 1.37 1.04
Market price of eggs
Parameter value $0.10 $0.13 $0.16
BCR 1.38 1.37 1.36
Commercial lending rate
Parameter value 15% 19.43% 24%
BCR 1.14 1.05 0.96
The baseline results for the SME CGS intervention assumes a commercial lending rate of 19.43% with the intervention. Table 4.4 shows how the BCR would be affected if the lending rate was instead 15% or 24%. Lowering the lending rate would increase the BCR to 1.14, whereas raising the lending rate would decrease the BCR to 0.96.
There is scant evidence in the literature on the interest elasticity of demand for credit amongst SMEs in low-income countries. As such, there is considerable uncertainty associated with the value of the interest elasticity of demand for credit amongst SMEs. However, Table 4.5 shows that the BCR is not sensitive to variations in this parameter.
Table 4.6 shows how the BCR of the SME CGS would be affected by a change in the default rate of borrowing SMEs.21 If the CGS is able to reduce the default rate to 5%, the BCR of the intervention would increase to 1.34. However, if the default rate was 25%, the BCR would fall to 0.93.
21 The expected default rate used for the baseline analysis is based on findings reported in Calice 2016 for CGS implemented in Africa. However, the default rate reported for Africa (17.10%) is much higher than the global average (2.5%) and higher than the 5% upper limit recommended in the same report. The default rate of 17.1% is based on a relatively small number of borrowers (n=77). All this is to say that it would not be unreasonable for a well-designed and managed CGS to achieve a default rate considerably lower than 17.1%. In this sense, our estimates might be considered conservative.
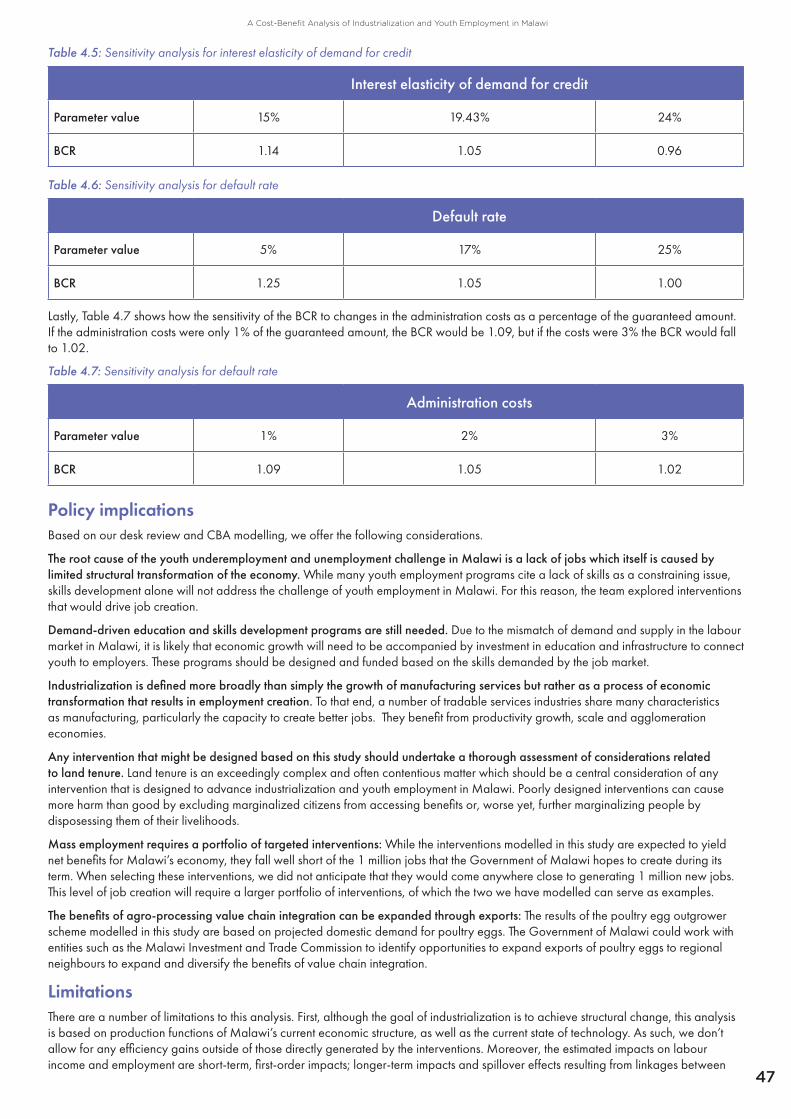
47
A Cost-Benefit Analysis of Industrialization and Youth Employment in Malawi
Table 4.5: Sensitivity analysis for interest elasticity of demand for credit
Table 4.6: Sensitivity analysis for default rate
Table 4.7: Sensitivity analysis for default rate
Interest elasticity of demand for credit
Parameter value 15% 19.43% 24%
BCR 1.14 1.05 0.96
Default rate
Parameter value 5% 17% 25%
BCR 1.25 1.05 1.00
Administration costs
Parameter value 1% 2% 3%
BCR 1.09 1.05 1.02
Lastly, Table 4.7 shows how the sensitivity of the BCR to changes in the administration costs as a percentage of the guaranteed amount. If the administration costs were only 1% of the guaranteed amount, the BCR would be 1.09, but if the costs were 3% the BCR would fall to 1.02.
Policy implicationsBased on our desk review and CBA modelling, we offer the following considerations.
The root cause of the youth underemployment and unemployment challenge in Malawi is a lack of jobs which itself is caused by limited structural transformation of the economy. While many youth employment programs cite a lack of skills as a constraining issue, skills development alone will not address the challenge of youth employment in Malawi. For this reason, the team explored interventions that would drive job creation.
Demand-driven education and skills development programs are still needed. Due to the mismatch of demand and supply in the labour market in Malawi, it is likely that economic growth will need to be accompanied by investment in education and infrastructure to connect youth to employers. These programs should be designed and funded based on the skills demanded by the job market.
Industrialization is defined more broadly than simply the growth of manufacturing services but rather as a process of economic transformation that results in employment creation. To that end, a number of tradable services industries share many characteristics as manufacturing, particularly the capacity to create better jobs. They benefit from productivity growth, scale and agglomeration economies.
Any intervention that might be designed based on this study should undertake a thorough assessment of considerations related to land tenure. Land tenure is an exceedingly complex and often contentious matter which should be a central consideration of any intervention that is designed to advance industrialization and youth employment in Malawi. Poorly designed interventions can cause more harm than good by excluding marginalized citizens from accessing benefits or, worse yet, further marginalizing people by disposessing them of their livelihoods.
Mass employment requires a portfolio of targeted interventions: While the interventions modelled in this study are expected to yield net benefits for Malawi’s economy, they fall well short of the 1 million jobs that the Government of Malawi hopes to create during its term. When selecting these interventions, we did not anticipate that they would come anywhere close to generating 1 million new jobs. This level of job creation will require a larger portfolio of interventions, of which the two we have modelled can serve as examples.
The benefits of agro-processing value chain integration can be expanded through exports: The results of the poultry egg outgrower scheme modelled in this study are based on projected domestic demand for poultry eggs. The Government of Malawi could work with entities such as the Malawi Investment and Trade Commission to identify opportunities to expand exports of poultry eggs to regional neighbours to expand and diversify the benefits of value chain integration.
LimitationsThere are a number of limitations to this analysis. First, although the goal of industrialization is to achieve structural change, this analysis is based on production functions of Malawi’s current economic structure, as well as the current state of technology. As such, we don’t allow for any efficiency gains outside of those directly generated by the interventions. Moreover, the estimated impacts on labour income and employment are short-term, first-order impacts; longer-term impacts and spillover effects resulting from linkages between

48
A Cost-Benefit Analysis of Industrialization and Youth Employment in Malawi
sectors (i.e. multipliers) are ignored in this study. Therefore, we expect that the intervention would also indirectly create a number of jobs which are not accounted for in the numbers reported here.
The results of the poultry outgrower scheme are explicitly linked to demand for poultry eggs, but the credit guarantee scheme assumes that domestic demand and exports would absorb incremental production facilitated by the increase in capital stock.
This study should not be interpreted as a detailed intervention design or plan. For example, it was beyond the scope of our analysis to determine the number of SMEs who should receive credit, and in what quantities. There may also be other, non-trivial costs associated with implementing these interventions (such as site selection for the poultry outgrower operations) which were beyond the scope of this analysis.
Table 4.8: Similar projects
Project Funder
Agricultural Commercialization Project World Bank
Contract Farming and Export Agriculture Facility (ConFarm) Export Development Fund
Malawi Oilseeds Sector Transformation (MOST) programme DFID (now FCDO)

49
A Cost-Benefit Analysis of Industrialization and Youth Employment in Malawi
5. References• Agar, J. (2014). Agribusiness SMEs in Malawi. Kadale Consultants of Malawi for USAID. http://www.value-chains.org/dyn/
bds/docs/918/Report_Agri-business_SMEs_in_Malawi_Final.pdf
• Akinola, S.A.F., Essien, A. (2011) Relevance of rural poultry production in developing countries with special reference to Africa. World's Poultry Science Journal, 67:4, 697-705. DOI: 10.1017/S0043933911000778
• Amos, S., Doungahire, A. (2019). Financial constraints, firm productivity and cross-country income differences: Evidence from sub-Saharan Africa. Borsa Istanbul Review. http://http//www.elsevier.com/journals/borsa-istanbul-review/2214-8450
• Andam, K., Johnson, M., Ragasa, C., Kufoalor, D., das Gupta, S. (2017). A Chicken and Maize Situation: The Poultry Feed Sector and Ghana. IFPRI. http://ebrary.ifpri.org/utils/getfile/collection/p15738coll2/id/131055/filename/131266.pdf
• Arulraj, D., Annamalai, T. (2020). Firms’ Financing Choices and Firm Productivity: Evidence from an Emerging Economy. International Journal of Global Business and Competitiveness. https://doi.org/10.1007/s42943-020-00008-2
• Bandura W.N., Dzingirai C. (2019). Financial development and economic growth in Sub Saharan Africa: The role of institutions. PSL Quarterly Review, 72 (291): 315-334 https://doi.org/10.13133/2037-3643_72.291_
• Bbaale, E., Okumu, I.M. (2018). Corruption and firm-level productivity: greasing or sanding effect? World Journal of Entrepreneurship, Management and Sustainable Development, Vol. 14 No. 3, pp. 222-241. https://doi.org/10.1108/WJEMSD-10-2017-0067
• Benfica, R., Thurlow, J. (2017). Identifying Investment Priorities for Malawian Agriculture. IFPRI and IFAD. https://pim.cgiar.org/files/2017/04/IFPRI-IFAD-PIM-Malawi-Presentation.pdf
• Benson, T., Baulch, B., Lifeyo, Y., and Mkweta, P. 2021. “Malawi’s slowly changing employment landscape and its implications for youth.” Development Southern Africa. https://doi.org/10.1080/0376835X.2021.1915750
• Beesabathuni, K., Lingala, S., Kraemer, K. (2018). Increasing egg availability through smallholder business models in East Africa and India. Maternal & Child Nutrition. https://doi.org/10.1111/mcn.12667
• Bist, J.P. (2018). Financial development and economic growth: Evidence from a panel of 16 African and non-African low-income countries. Cogent Economics & Finance, 6:1, 1449780, DOI: 10.1080/23322039.2018.1449780
• Brewin, S., Murphy, S. (2019). The Farmer and Her Husband: Legal innovations for women in contract farming. International Institute for Sustainable Development. https://www.iisd.org/system/files/publications/women-contract-farming-policy-brief-en.pdf
• Brixiová, Z., Kangoye, T., Yogo, T.U. (2020). Access to Finance among Small and Medium-Sized Enterprises and Job Creation in Africa. IZA Institute of Economics DP No. 13708. https://www.iza.org/publications/dp/13708/access-to-finance-among-small-and-medium-sized-enterprises-and-job-creation-in-africa
• Calice, P. (2016). Assessing Implementation of the Principles for Public Credit Guarantees for SMEs. World Bank Group. https://openknowledge.worldbank.org/bitstream/handle/10986/24834/Assessing0impl0Es000a0global0survey.pdf
• (2020). Case Study: How Incentive-Based Contract Farming increased the quality and quantity of Kilombero rice. Prosper Markets. https://www.resilience.mw/sites/default/files/2020-12/Case%20Study%20NASFAM_PROSPER%20Incentive%20Based%20Contract%20Farming%20Dec2020.pdf
• Chilemba, J., Ragasa, C. (2019). The Impact on Farmer Incomes of a Nationwide Scaling Up of the Farmer Business School Program: Lessons and Insights from Central Malawi. https://link.springer.com/article/10.1057/s41287-019-00246-y
• Dos Anjos, F. (2013). Livestock Country Reviews - Poultry Sector - Mozambique. FAO. http://www.fao.org/3/i3487e/i3487e.pdf
• Dzanja, J., Matita, M., Kankwamba, H., Dolislager, M., Tschirley, D. (2016). Mapping Market Prospects for Grain Legumes in Malawi. Global Centre for Food Systems Innovation & USAID. https://pdf.usaid.gov/pdf_docs/PA00WKJJ.pdf
• Government of Malawi. (2016). Contract Farming Strategy. Ministry of Agriculture, Irrigation and Water Development. https://www.canr.msu.edu/fsp/countries/malawi/Contract%20Farming%20Strategy%20final%20%20version.pdf
• Ecker, O., Qaim, M. (2008). Income and Price Elasticities of Food Demand and Nutrient Consumption in Malawi. Prepared for presentation at the American Agricultural Economics Association Annual Meeting, Orlando, FL, July 27-29, 2008.
• Effiong, E. (2015). Financial Development, Institutions and Economic Growth: Evidence from Sub-Saharan Africa. Department of Economics, University of Uyo, Nigeria. https://mpra.ub.uni-muenchen.de/66085/
50
A Cost-Benefit Analysis of Industrialization and Youth Employment in Malawi
• (2017). Facilitating Market System Change in Malawi’s Oilseeds Sector – A Case study on incentive-based contract farming and other scaled innovations. Malawi Oilseeds Sector Transformation. https://beamexchange.org/uploads/filer_public/5b/2a/5b2a74ac-ecee-40d9-b81a-b6429f3747ff/facilitating-market-system-change-in-malawi-oilseeds-sector_compressed.pdf
• FAO. (2003). Egg Marketing - A Guide for the Production and Sale of Eggs. http://www.fao.org/3/y4628e/y4628e00.htm#Contents
• (2014). Feed the Future Integrating Nutrition in Value Chains, Malawi: Gender and Value Chain Assessment. USAID. https://www.culturalpractice.com/wp-content/uploads/2015/09/FtF-INVC-Gender-and-VC-Report-Final-Submitted-2.pdf
• FEWS NET. (2016). Map of Livelihood Zones in Malawi. https://fews.net/sites/default/files/documents/reports/MW_Livelihood_Baseline_Profiles.pdf
• Goldsmith, P. D., Dall’Erba, S. (2020). The Economic Impact of Malawi’s Soybean Complex. Agricultural Economics. Under Review. https://www.researchgate.net/publication/346355577
• Goromela, E.H., Kwakkel, R.P., Verstegen, M.W.A., Katule, A.M., Sendalo, D.S.C. (2009). Feeding system and management of village poultry in Tanzania. Proceeding of the 3rd Nigeria International Poultry Summit. Abeokuta, Ogun State, Nigeria, pp. 193-198. https://edepot.wur.nl/199871
• Hall, H., Scoones, I., Tsikata, D. (2017). Plantations, outgrowers and commercial farming in Africa: agricultural commercialisation and implications for agrarian change. The Journal of Peasant Studies, 44:3, 515-537. DOI: 10.1080/03066150.2016.1263187
• Inoue, T., Hamori, S. (2016). Financial Access and Economic Growth: Evidence from Sub-Saharan Africa. Emerging Markets Finance and Trade, 52:3, 743-753. DOI: 10.1080/1540496X.2016.1116282
• Karlan, D., Zinman, J. (2005). Elasticities of Demand for Consumer Credit. Yale University Economic Growth Centre.
• Karnani, A., McKague, K. (2016). Job Creation in the Mozambican Poultry Industry. Financial Review. https://www.researchgate.net/publication/271443876_Job_Creation_in_the_Mozambican_Poultry_Industry
• Kersten, R., Harms, J., Liket, K., Maas, K. (2017). Small Firms, large Impact? A systematic review of the SME Finance Literature. World Development Vol. 97, pp. 330–348. https://doi.org/10.1016/j.worlddev.2017.04.012
• Kim, S., Kessler, T., Lee, H., Khan, M. (2021). Policies to Optimize the Performance of Credit Guarantee Schemes During Financial Crises. Asian Development Bank. https://www.adb.org/sites/default/files/publication/680196/adb-brief-167-credit-guarantee-schemes-financial-crises.pdf
• Maertens, A., Mhango, W., Michelson, H. (2020). The effect of demonstration plots and the warehouse receipt system on integrated soil fertility management adoption, yield and income of smallholder farmers: a study from Malawi’s Anchor Farms. International Initiative for Impact Evaluation. https://www.3ieimpact.org/evidence-hub/publications/impact-evaluations/effect-demonstration-plots-and-warehouse-receipt
• MAIWD. (2017). Agriculture Sector Performance Report: July 2016 - June 2017. https://www.resakss.org/sites/default/files/ASPR-16.17_0.pdf
• Malawi National Statistical Office (NSO). 2013. “Malawi Labor Force Survey 2013.” http://www.nsomalawi.mw/images/stories/data_on_line/demography/Labour%20Force/Labour%20Force%20Survey%202013/Malawi%20Labour%20Force%20Surver%202013%20Report.pdf
• Markowitz, C. (2018). Linking Soybean Producers to Markets: An Analysis of Interventions in Malawi and Zambia. South African Institute of International Affairs. https://media.africaportal.org/documents/saia_sop_291_Markowitz_20181210-2.pdf
• Masambo, A. (2017). A Supply Chain Analysis of Indigenous Chickens and Eggs in Dowa District. Lilongwe University of Agriculture and Natural Resources. http://www.ruralpoultrymalawi.org/resources/supply-chain-analysis-adija-masambo.pdf
• Meemken, E.M., Bellemare, M.F. (2019). Smallholder farmers and contract farming in developing countries. PNAS. https://www.pnas.org/cgi/doi/10.1073/pnas.1909501116
• Meyer, F., Traub, L.N., Davids, Chisanga, B., Kachule, R., Tostão, E., Vilanculos, O., Popat, M., Binfield, J., Boulanger, P. (2018). Modelling soybean markets in Eastern and Southern Africa. Regional Network of Agricultural Policy Research Institutes (ReNAPRI), EUR 28978 EN, Publications Office of the European Union, Luxembourg. doi:10.2760/20598
• Nankhuni, F., Paniagua, G. (2014). Meta-Evaluation of Private Sector Interventions in Agribusiness: Finding out What Worked in Access to Finance & Farmer Training. IFC. http://ida-globaldevelopment.dk/wordpress/wp-content/uploads/2015/01/14-12-02-nankhuni_diis_agribusiness_meta_for_diis.pdf
• Nizam, R., Karim, Z.A., Rahman, A.A., Sarmidi, T. (2020). Financial inclusiveness and economic growth: new evidence using a threshold regression analysis. Economic Research-Ekonomska Istraživanja, 33:1, 1465-1484, DOI: 10.1080/1331677X.2020.1748508
• National Youth Council of Malawi. (2016). National Youth Policy. https://www.youthpolicy.org/national/Malawi_2013_National_Youth_Policy.pdf
• Nzima, W., Dzanja, J. (2015). Efficiency of Soybean Markets in Malawi: Structure, Conduct and Performance Approach.

51
A Cost-Benefit Analysis of Industrialization and Youth Employment in Malawi
International Journal of Business and Social Science Vol. 6, No. 4. http://ijbssnet.com/journals/Vol_6_No_4_April_2015/16.pdf
• OECD. (2018). Youth Well-being Policy Review of Malawi. https://www.oecd.org/countries/malawi/Youth-well-being-policy-review-Malawi.pdf
• Opperman, C., Varia, N. (2011). Technical Report: Soybean Value Chain. AECOM International Development. https://www.satradehub.org/images/stories/downloads/pdf/technical_reports/Technical%20Report%20-%20Soy%20Value%20Chain%20Report.pdf
• (2014). Opportunities in Regional Oilcake Markets. Malawi Investment and Trade Centre. http://trade.mitc.mw/images/Regional_Oilcake_Demand_Executive_Summary_141202.pdf
• Pindyck, R. (2019). The social cost of carbon revisited. http://web.mit.edu/rpindyck/www/Papers/SCCRevisitedJEEM2019.pdf
• (2020). Poultry Sector Strategy – Malawi. Commercial Agriculture for Smallholders and Agribusiness. https://www.casaprogramme.com/wp-content/uploads/CASA-Malawi-PoultrySector-analysis-report.pdf
• Puatwoe, J., Piabuo, S.M. (2017). Financial sector development and economic growth: evidence from Cameroon. DOI 10.1186/s40854-017-0073-x
• Ricke, K., Drouet, L., Caldeira, K., Tavoni, M. (2018). Country-level Social Cost of Carbon, Nature Climate Change. DOI: 10.1038/ s41558-018-0282-y
• Samboko, P., Zulu-Mbata, O., Chapoto, A. (2018). Analysis of the animal feed to poultry value chain in Zambia. Development Southern Africa, 35:3, 351-368. DOI:10.1080/0376835X.2018.1480932
• Santos, M. (2019). The State of Soybean in Africa: Soybean Varieties in Sub-Saharan Africa. farmdoc daily (9): 155, Department of Agricultural and Consumer Economics, University of Illinois at Urbana-Champaign. https://farmdocdaily.illinois.edu/2019/08/the-state-of-soybean-in-africa-soybean-varieties-in-sub-saharan-africa.html
• (2017). Sector Analysis Studies for the Commercial Agriculture for Smallholders and Agribusiness Programme - Malawi - Country Value Chain and Market Analysis Report. LTS International. http://www.bdsknowledge.org/dyn/bds/docs/949/Component%20A%20and%20C%20-%20Annex%20A%20-%202%20%20Malawi%20Sector%20S.pdf
• Shaw, M., Nielsen, H., Rose, M. (2019). Poultry Sector Study. DFID. https://beamexchange.org/uploads/filer_public/69/82/698222cb-c7f8-45e3-a3b8-0e6cde5afc9c/dfid_poultry_sector_study_-_final_report_180419_public_compressed.pdf
• (2011). Southern Africa Regional Soybean Roadmap Final presentation. TechnoServe. https://www.technoserve.org/wp-content/uploads/2013/02/technoserve-bmgf-regional-presentation.pdf
• Steenbergen, V., Javorcik, B. (2017). Analysing the impact of the Kigali Special Economic Zone on firm behaviour. IGC. https://www.theigc.org/wp-content/uploads/2017/10/Steenbergen-and-Javorcik-working-paper-2017_1.pdf
• Tinsley, R.L. (2009). Value Chain Analysis for Soybeans in Malawi. https://webdoc.agsci.colostate.edu/smallholderagriculture/ValueChainAnalysisSoybeansMalawi.pdf
• (2014). The Soybean Agri-Processing Opportunity in Africa. African Center for Economic Transformation (ACET). http://acetforafrica.org/acet/wp-content/uploads/publications/2016/03/Soybean-Dalberg.pdf
• Ton, G., Desiere, S., Vellema, W., Weituschat, S, D’Haese, M. (2017). The effectiveness of contract farming for raising income of smallholder farmers in low‐ and middle‐income countries: a systematic review. Campbell Systematic Reviews. https://doi.org/10.4073/csr.2017.13
• Tufa, A.H., Alene, A.D., Manda, J., Akinwale, M.G., Chikoye, D., Feleke, S., Wossen, T., Manyong, V. (2019). The productivity and income effects of adoption of improved soybean varieties and agronomic practices in Malawi. World Development. https://doi.org/10.1016/j.worlddev.2019.104631
• Wong, I. (2018) Small Soybean Oil Mill Project Cost. ABC Machinery. https://www.slideshare.net/ssuser077b2d/small-soybean-oil-mill-project-cost
• Ugur, M., Dasgupta, N. (2011). Evidence on the economic growth impacts of corruption in low-income countries and beyond. London: EPPI-Centre, Social Science Research Unit, Institute of Education, University of London. https://assets.publishing.service.gov.uk/media/57a08ab3e5274a27b2000709/Corruption_impact_2011_Ugur_report.pdf
• Ussar, M. (2017). Rapid Gender Assessment of Soybean farmers under IBCF Rapid assessment of gender dynamics of soybean contract farming. Malawi Oilseeds Sector Transformation. https://www.researchgate.net/publication/342956187_Rapid_Gender_Assessment_of_Soybean_farmers_under_IBCF_Rapid_assessment_of_gender_dynamics_of_soybean_contract_farming
• Van Vugt, D., Franke, A.C., Giller, K.E. (2016). Participatory Research to Close the Soybean Yield Gap on Smallholder Farms in Malawi. Experimental Agriculture, 53(3), 396-415. doi:10.1017/S0014479716000430
• Wainaina, P., Okello, J., Nzuma, J. (2012). Impact of Contract Farming on Smallholder Poultry Farmers’ Income in Kenya. University of Nairobi Department of Agricultural Economics. https://ageconsearch.umn.edu/record/126196/
• Williams, C., Kedir, A. (2016). The Impacts of Corruption on Firm Performance: Some Lessons from 40 African Countries. Journal of

52
A Cost-Benefit Analysis of Industrialization and Youth Employment in Malawi
Developmental Entrepreneurship, 21 (4). 1650022. ISSN 1084-9467 https://doi.org/10.1142/S1084946716500229
• Yohane, E., Kachulu, L., Siyeni, D., Chisama, B.F. (2013). A guide to soybean production in Malawi. Department of Agricultural Research Services Malawi. DOI: 10.13140/2.1.4982.2723
• Zhuang, J., Gunatilake, H.M., Niimi, Y., Khan, M.E., Jiang, Y., Hasan, R., Khor, N., Martin, A.L., Bracey, P., Huang, B. (2009). Financial Sector Development, Economic Growth, and Poverty Reduction: A Literature Review. Asian Development Bank Economics Working Paper Series No. 173. http://dx.doi.org/10.2139/ssrn.1617022
• Zidana, H., Donda, S., Harrison, E. (2017). Commercialising the aquaculture sector in Malawi. Agricultural Technology Transfer. https://static1.squarespace.com/static/553f9958e4b06d466cd3ce1e/t/599d870dccc5c53c01d943ef/1503495950343/Commercialising+the+aquaculture+sector+in+Malawi.pdf
• Zidana, R. (2015). Small and Medium Enterprises (SMEs) Financing and Economic Growth in Malawi: Measuring the Impact between 1981 and 2014. Journal of Statistics Research and Reviews 2015, Volume 1, Issue 1, pp. 1-6. https://www.researchgate.net/publication/286926445_Small_and_Medium_Enterprises_SMEs_Financing_and_Economic_Growth_in_Malawi_Measuring_the_Impact_between_1981_and_2014


MALAWI PRIORITIES PROJECT
2021
Industrialization and Youth Employment in Malawi: A Cost-Benefit Analysis