a financial analysis of selected … doc/ijmt_august2012/ijmra-mt1571.pdf · ijmt volume 2, issue 8...
TRANSCRIPT

IJMT Volume 2, Issue 8 ISSN: 2249-1058 __________________________________________________________
A Monthly Double-Blind Peer Reviewed Refereed Open Access International e-Journal - Included in the International Serial Directories Indexed & Listed at: Ulrich's Periodicals Directory ©, U.S.A., Open J-Gage, India as well as in Cabell’s Directories of Publishing Opportunities, U.S.A.
International Journal of Marketing and Technology http://www.ijmra.us
366
August 2012
A FINANCIAL ANALYSIS OF SELECTED
TELECOMMUNICATION COMPANIES IN INDIA
Dr.A.Muthusamy*
__________________________________________________________
ABSTRACT
The telecommunication plays an important role in today‟s market dynamic. In the last decade
a dramatic change in the ownership structure of telecommunications companies has taken
place, from public (state-owned) monopolies to private companies. The rapid development of
mobile telephone networks and video and Internet technologies has created enormous
competitive pressure on the companies. As new competitors arise, companies need intelligent
tools to gain a competitive advantage. Also, stock market expectations are enormous, and
investors and financial analysts need tested tools to gain information about how companies
perform financially compared to their competitors, what they are good at, who the major
competitors are, etc. In other words, the telecom companies need to benchmark their
performances against competitors in order to remain important players in this market.
* Assitant Professor, Department of International Business and Commerce, Alagappa University,
Karaikudi-4. TAMILNADU.

IJMT Volume 2, Issue 8 ISSN: 2249-1058 __________________________________________________________
A Monthly Double-Blind Peer Reviewed Refereed Open Access International e-Journal - Included in the International Serial Directories Indexed & Listed at: Ulrich's Periodicals Directory ©, U.S.A., Open J-Gage, India as well as in Cabell’s Directories of Publishing Opportunities, U.S.A.
International Journal of Marketing and Technology http://www.ijmra.us
367
August 2012
INTRODUCTION
India operates one of the largest telecom networks in the world adding nearly 200million
connections every month. Telephones are an important means of telecommunication. The
telecommunication plays an important role in today‟s market dynamic. In the last decade a
dramatic change in the ownership structure of telecommunications companies has taken place,
from public (state-owned) monopolies to private companies. The rapid development of mobile
telephone networks and video and Internet technologies has created enormous competitive
pressure on the companies. As new competitors arise, companies need intelligent tools to gain a
competitive advantage. Also, stock market expectations are enormous, and investors and
financial analysts need tested tools to gain information about how companies perform financially
compared to their competitors, what they are good at, who the major competitors are, etc. In
other words, the telecom companies need to benchmark their performances against competitors
in order to remain important players in this market.
The telecommunication sector, especially the mobile phone sector, in India is one of
the fastest growing business segments of the country which provides a lot of value addition to the
society. At present there are fifteen mobile phone operators in the country - Bharti Airtel Limited
(Bharti), Reliance Communications Limited (Reliance), Vodafone Essar Limited (Vodafone),
Bharat Sanchar Ni-gam Limited (BSNL)- Government of India owned public sector company,
Tata Teleservices Limited (Tata), Idea Cellular Limited (IDEA), Aircel Limited (Aircel),
Unitech Wireless Limited (Unitech), Mahanagar Telephone Nigam Limited (MTNL), Sistema
Shyam TeleServices Limited (Sistema), Loop Mobile (India) Limited - Formerly BPL Mobile
(Loop Mobile), Videocon Telecommunications Limited (Videocon), S Tel Private Limited (S
Tel), Himachal Futuristic Communications Limited (HFCL) and Etisalat DB Telecom Private
Limited (Etisalat). All of them compete with each other to grab customers by providing wide
range of services. They not only offer basic services of cell phone but also produce other value
added services. Along with the normal services all of the operators are now offer internet
facilities which enable the subscribers to reach the whole world through internet easily and their
services include prepaid, postpaid, internet, value added services, roaming and devices.
IJMT Volume 2, Issue 8 ISSN: 2249-1058 __________________________________________________________
A Monthly Double-Blind Peer Reviewed Refereed Open Access International e-Journal - Included in the International Serial Directories Indexed & Listed at: Ulrich's Periodicals Directory ©, U.S.A., Open J-Gage, India as well as in Cabell’s Directories of Publishing Opportunities, U.S.A.
International Journal of Marketing and Technology http://www.ijmra.us
368
August 2012
The India telecom market ranks among the fastest growing industries in the country. The
improvement in the standard of living and the development of infrastructure and connectivity are
some of the main reasons for the significant growth of the telecom industry. The growth is
expected to be more over the years.
STATEMENT OF THE PROBLEM
Telephone, the new communication system has altered our patterns of communications
and has created economic and social impacts on the lives of the individuals. Now in the present
century, a new technological advancement has hit the telecommunications. The
telecommunication companies are facing a competition with the entry of many companies. All
the companies are constantly engaged in gaining the attention of the customers by introducing
new offers, new schemes like price offers, refund offers, etc. In this paper the researcher analyses
the financial performance of selected private sector telecommunication companies in India.
OBJECTIVES OF THE STUDY
The present study has been set out to accomplish the following objectives.
(i) To study the liquidity, profitability and turnover performance of selected private
telecommunication companies in India.
(ii) To study the comparative analysis of private telecommunication companies in India.
HYPOTHESIS OF THE STUDY
The following hypotheses are tested.
There is no significant difference in the values of current ratio of selected
companies and different years.
There is no significant different in the values of Quick ratio of selected companies
and different years.
There is no significant difference in the values of gross profit margin of selected
companies and different years.

IJMT Volume 2, Issue 8 ISSN: 2249-1058 __________________________________________________________
A Monthly Double-Blind Peer Reviewed Refereed Open Access International e-Journal - Included in the International Serial Directories Indexed & Listed at: Ulrich's Periodicals Directory ©, U.S.A., Open J-Gage, India as well as in Cabell’s Directories of Publishing Opportunities, U.S.A.
International Journal of Marketing and Technology http://www.ijmra.us
369
August 2012
There is no significant difference in the values of net profit margin of selected
companies and different years.
There is no significant difference in the values of operating profit margin of selected
companies and different years.
There is no significant difference in the values of return on equity of selected
companies and different years.
There is no significant difference in the values of earnings per share of selected
companies and different years.
There is no significant difference in the values of return on investment of selected
companies and different years.
METHODOLOGY
The study is empirical in nature and executed using the data published by the Indian
telecom sector. The research study is based on secondary data. The financial data related to the
selected telecom companies were collected from website and Annual report of selected
telecommunication companies.
PERIOD OF STUDY
The present study covers a period of five years from March 2005 to March 2010.
SAMPLING
The six selected telecom companies are following:
Bharti Airtel
Reliance Communication
Idea Cellular
Tata Communication
Tata Teleservices
Tata Teleservices Maharashtra Limited (TTML)
IJMT Volume 2, Issue 8 ISSN: 2249-1058 __________________________________________________________
A Monthly Double-Blind Peer Reviewed Refereed Open Access International e-Journal - Included in the International Serial Directories Indexed & Listed at: Ulrich's Periodicals Directory ©, U.S.A., Open J-Gage, India as well as in Cabell’s Directories of Publishing Opportunities, U.S.A.
International Journal of Marketing and Technology http://www.ijmra.us
370
August 2012
LIQUIDITY, PROFITABILITY AND TURNOVER PERFORMANCE
The telecommunication plays an important role in today‟s market dynamic. In the last
decade a dramatic change in the ownership structure of telecommunications companies have
taken place, from public (state-owned) monopolies to private companies. The rapid
developments of mobile telephone networks and video and Internet technologies have created
enormous competitive pressure on the companies. As new competitors arise, companies need
intelligent tools to gain a competitive advantage. Also, stock market expectations are enormous,
and investors and financial analysts need tested tools to gain information about how companies
perform financially compared to their competitors, what they are good at, who the major
competitors are, etc. In other words, the telecom companies need to benchmark their
performances against competitors in order to remain important players in this market. In this
paper the researcher analyze the liquidity, profitability and turnover performance of the selected
companies.
LIQUIDITY
Liquidity means a firm‟s ability to satisfy its short- term obligations as they come due.
Liquidity refers to the solvency of the firm‟s short-term financial position and the ease with
which it can pay its bills. Because a common precursor to financial distress and bankruptcy is
low or declining liquidity, these ratios are viewed as good leading indicators of cash flow
problems generally; the first concern of the financial analyst is liquidity. Liquidity analysis is
quick and easy to use measure of liquidity. In liquidity management concerned with how the
business manages its short-term funds. These are the funds which are continuously circulating
through the business process.
These are few liquidity ratios that help measure liquidity position,
(i) Current Ratio
(ii) Quick (Acid-Test) Ratio
QUICK (ACID-TEST) RATIO

IJMT Volume 2, Issue 8 ISSN: 2249-1058 __________________________________________________________
A Monthly Double-Blind Peer Reviewed Refereed Open Access International e-Journal - Included in the International Serial Directories Indexed & Listed at: Ulrich's Periodicals Directory ©, U.S.A., Open J-Gage, India as well as in Cabell’s Directories of Publishing Opportunities, U.S.A.
International Journal of Marketing and Technology http://www.ijmra.us
371
August 2012
The quick (acid-test) ratio is similar to the current ratio except that it excludes inventory,
which is generally the least liquid current assets. Low liquidity of inventory results from two
primary factors: many types of inventory cannot be easily sold because they are partially
completed items, special purpose items, and the like, and inventory is typically sold on credit,
which means that it becomes an account receivable before being converted into cash. Prepaid
expenses are also excluded.
PROFITABILITY
There are many measures of profitability as a group; these measures enable the analyst to
evaluate the firm‟s profits with respect to a given level of sales, a certain level of assets or the
owner‟s investment. Without profits, a firm could not attract outside capital owners. Creditors
and management pay close attention to boosting profits because of the great importance placed
on earnings in the market place. The following are the important profitability ratios.
(i) Gross Profit Margin
(ii) Net Profit Margin
(iii) Operating Profit Margin
(iv) Return On Equity
(v) Earnings Per Share
(vi) Return on Investment
CURRENT RATIO OF SELECTED TELECOMMUNICATION COMPANIES IN INDIA
The current ratio is the most commonly used for measures of short-term solvency. Since
it indicates the number of times the claims of short-term creditors are covered by assets that are
expected to be converted into cash in a period roughly corresponding to the maturity of the
claims. The higher the value of current ratio indicates the higher the liquidity of the firm.
Current Ratio = Current Assets/ Current Liabilities

IJMT Volume 2, Issue 8 ISSN: 2249-1058 __________________________________________________________
A Monthly Double-Blind Peer Reviewed Refereed Open Access International e-Journal - Included in the International Serial Directories Indexed & Listed at: Ulrich's Periodicals Directory ©, U.S.A., Open J-Gage, India as well as in Cabell’s Directories of Publishing Opportunities, U.S.A.
International Journal of Marketing and Technology http://www.ijmra.us
372
August 2012
Table -1
Current Ratio of Selected Telecommunication Companies for the year
2005-06 to 2009-10
COMPANY
NAME
As on
March
2006
As on
March
2007
As on
March
2008
As on
March
2009
As on
March
2010
Mean SD
Bharti Airtel 0.44 0.47 0.57 0.69 0.68 0.57 0.09
Reliance 2.81 1.77 0.95 1.45 1.37 1.67 0.63
Idea Cellular 0.74 0.87 0.43 0.98 0.96 0.80 0.41
Tata
Communicartions
1.19 1.08 1.44 1.31 2.01 1.41 0.32
Tata Teleservices 1.44 1.75 3.97 1.41 1.67 2.05 0.97
TTML 0.15 0.24 0.19 0.18 0.14 0.18 0.03
Source: www.moneycontrol.com
The data presented in the table.1 reveal that the current ratio of the Bharti Airtel was 0.44
in 2005-06. After that the current ratio figures year after year have increased continuously till the
year 2008-09. In the last year current ratio of the Bharti Airtel was 0.68.
During the year 2005-06 the current ratio of the Reliance Communications was 2.81.
Reliance Communications had fluctuating current ratio. Last year current ratio was 0.68.
In the case of Idea Cellular the current ratio in 2006 was 0.74.In the next year 2007 the
current ratio increased to 0.87. Idea Cellular had fluctuating current ratio.
In the initial year 2006 the Tata Communications had the current ratio of 1.19, much
lower than industry or general norm. Tata Communications had fluctuating current ratio.

IJMT Volume 2, Issue 8 ISSN: 2249-1058 __________________________________________________________
A Monthly Double-Blind Peer Reviewed Refereed Open Access International e-Journal - Included in the International Serial Directories Indexed & Listed at: Ulrich's Periodicals Directory ©, U.S.A., Open J-Gage, India as well as in Cabell’s Directories of Publishing Opportunities, U.S.A.
International Journal of Marketing and Technology http://www.ijmra.us
373
August 2012
The current ratio of Tata Teleservices in the year 2006 was 1.44. After that the current
ratio figures year after year have increased continuously till the year 2008. In the last year
current ratio of the Tata Teleservices was 1.6
In the case of Tata Teleservices Maharashtra Limited (TTML) the current ratio in 2006
was 0.15. In the next year 2007 the current ratio increased to 0.24. TTML had fluctuating current
ratio.
TEST FOR SIGNIFICANCE OF CURRENT RATIO
Table .2 give the relevant details whether the current ratio of the six companies different
significantly and whether the ratio differed across the five years, two way ANOVA was used.
Two sets of Null Hypothesis
Set – 1: HO: There is no significant difference in the values of current ratio of the selected
companies.
Set – 2: HO: There is no significant difference in the values of current ratio during the different
years.
Table -2
ANOVA – Current Ratio
Sum of Degrees of
Square
Degrees of Freedom Mean Square F-Ratio
Between Colum 0.25 4 0.063 0.176
Within Row 12.66 5 2.532 7.092
Residual 7.13 20 0.357
Total 20.04 29
Source: computed
RESULT
Set – 1: HO: The table value of „F‟ at 5% for V1 = 4, V2 = 20 is 2.87. Since the calculated value
is less than the table value the null hypothesis is accepted. There is no longitudinal difference is
the current ratios.

IJMT Volume 2, Issue 8 ISSN: 2249-1058 __________________________________________________________
A Monthly Double-Blind Peer Reviewed Refereed Open Access International e-Journal - Included in the International Serial Directories Indexed & Listed at: Ulrich's Periodicals Directory ©, U.S.A., Open J-Gage, India as well as in Cabell’s Directories of Publishing Opportunities, U.S.A.
International Journal of Marketing and Technology http://www.ijmra.us
374
August 2012
Set – 2: HO: The table value of „F‟ at 5% for V1 = 5, V2 = 20 is 2.71. Since the calculated value
is more than the table value the null hypothesis is rejected. Hence the value of current ratios of
the five companies differs significantly.
QUICK RATIO OF SELECTED TELECOMMUNICATION COMPANIES IN INDIA
This is a more stringent test of liquidity than the current ratio. It is (the acid test) of
liquidity and compares the firm‟s quick assets to its current liabilities. By stripping the stock
figures out of the equation, it is suggested that this ratio gives a more immediate indication of the
firm‟s ability to settle its current debts. It is difficult to gives a norm for what this ratio should be,
but a 1:1 ratio is commonly considered desirable. It depends on the characteristics can
circumstances of the individual firm. The quick ratio is calculated as follows.
Quick Ratio = Current Assets - Prepaid Expenses – Inventory / Current Liabilities
Table - 3
Quick Ratio of Selected Telecommunication Companies in the
Years 2005-06 to 2009-10
COMPANY NAME As on
Marc
h
2006
As on
March
2007
As on
March
2008
As on
March
2009
As on
March
2010
Mean SD
Bharti Airtel 0.45 0.47 0.55 0.65 0.72 0.57 0.10
Reliance Communication 2.81 1.86 1.63 2.70 2.14 2.23 0.21
Idea Cellular 2.11 1.10 0.55 1.31 0.86 1.19 0.52
Tata Communication 1.20 1.12 1.64 1.52 2.08 1.51 0.34
Tata Teleservices 1.22 2.85 4.45 1.33 1.35 2.24 1.26
TTML 0.29 0.37 0.45 0.56 0.40 0.41 0.10
Source: www.moneycontrol.com

IJMT Volume 2, Issue 8 ISSN: 2249-1058 __________________________________________________________
A Monthly Double-Blind Peer Reviewed Refereed Open Access International e-Journal - Included in the International Serial Directories Indexed & Listed at: Ulrich's Periodicals Directory ©, U.S.A., Open J-Gage, India as well as in Cabell’s Directories of Publishing Opportunities, U.S.A.
International Journal of Marketing and Technology http://www.ijmra.us
375
August 2012
The data presented in the table 3. reveal that the quick ratio of the Bharti Airtel was 0.45
in 2006. After that the quick ratio figures have increased continuously till the years 2010. In the
last year quick ratio of the Bharti Airtel was 0.72.
For the Reliance Communication Company quick ratio in the year 2005-06 was 2.81.
Reliance Communications had fluctuating quick ratio. Last year quick ratio was 2.14.
As on 31st December quick ratio of the Idea Cellular Company was 2.11. In the next 3
year quick ratio decreased 0.55. Next year the ratio increased and then decreased to the quick
ratio of the Idea Cellular last year was 0.86.
For the Tata Communications quick ratio in the year 2006 was 1.20. In the next year
2007 the quick ratio decreased to 1.12.Next year the quick ratio increased to the last year was
2.08.
The quick ratio of the Tata Teleservices Limited Company is continuously increased in 3
years was 4.45. In the next year the ratio increased and then decreased to the quick ratio of the
Tata Teleservices Limited last year was 1.35.
In the case of Tata Teleservices Maharashtra Limited (TTML) the quick ratio in 2006
was 0.29. In the 4 next years the quick ratio increased to 0.56. The last year quick ratio of the
Tata Teleservices Maharashtra Limited (TTML) was 0.40.
TEST FOR SIGNIFICANCE OF QUICK RATIO
Table. 4 gives the relevant details whether the quick ratio was the 6 companies different
significantly and whether the ratio differed across the five years, two way ANOVA was used.
Two sets of Null Hypothesis
Set – 1: HO: There is no significant difference in the values of quick ratio of the selected
companies.
Set – 2: HO: There is no significant difference in the values of quick ratio during the different
years.
Table - 4
ANOVA – Quick Ratio
IJMT Volume 2, Issue 8 ISSN: 2249-1058 __________________________________________________________
A Monthly Double-Blind Peer Reviewed Refereed Open Access International e-Journal - Included in the International Serial Directories Indexed & Listed at: Ulrich's Periodicals Directory ©, U.S.A., Open J-Gage, India as well as in Cabell’s Directories of Publishing Opportunities, U.S.A.
International Journal of Marketing and Technology http://www.ijmra.us
376
August 2012
Sum of Degrees of
Square
Degrees of
Freedom
Mean Square F-Ratio
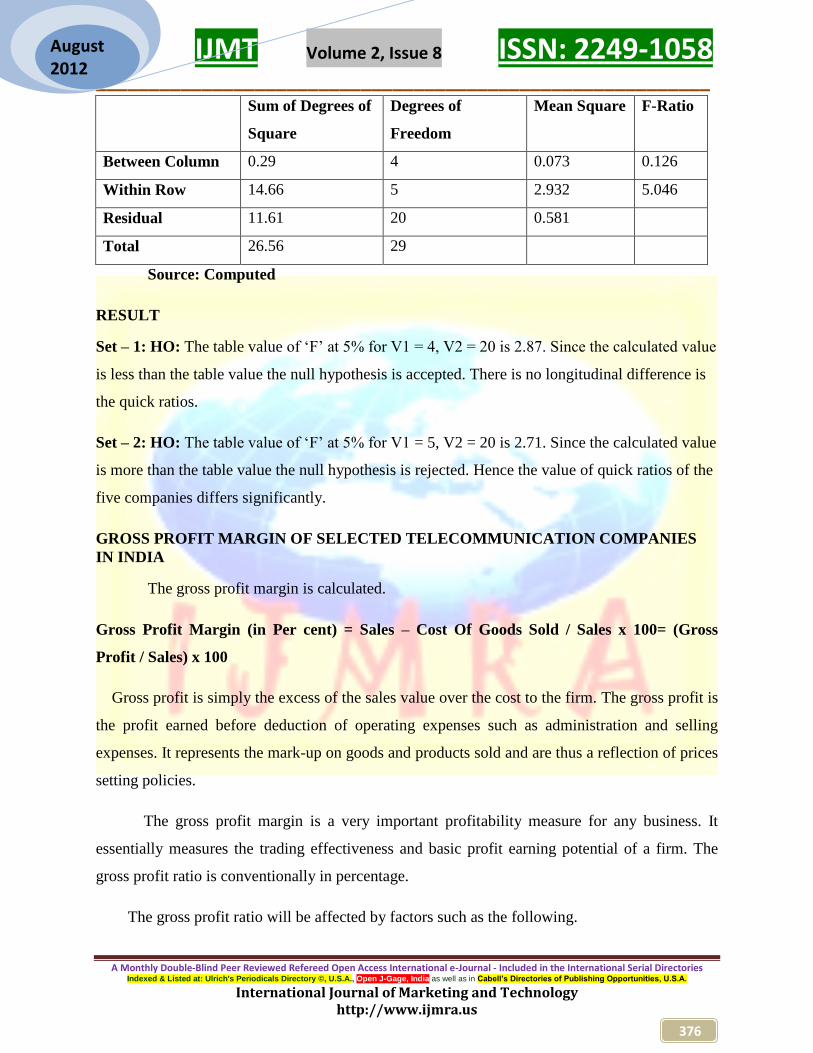
Between Column 0.29 4 0.073 0.126
Within Row 14.66 5 2.932 5.046
Residual 11.61 20 0.581
Total 26.56 29
Source: Computed
RESULT
Set – 1: HO: The table value of „F‟ at 5% for V1 = 4, V2 = 20 is 2.87. Since the calculated value
is less than the table value the null hypothesis is accepted. There is no longitudinal difference is
the quick ratios.
Set – 2: HO: The table value of „F‟ at 5% for V1 = 5, V2 = 20 is 2.71. Since the calculated value
is more than the table value the null hypothesis is rejected. Hence the value of quick ratios of the
five companies differs significantly.
GROSS PROFIT MARGIN OF SELECTED TELECOMMUNICATION COMPANIES
IN INDIA
The gross profit margin is calculated.
Gross Profit Margin (in Per cent) = Sales – Cost Of Goods Sold / Sales x 100= (Gross
Profit / Sales) x 100
Gross profit is simply the excess of the sales value over the cost to the firm. The gross profit is
the profit earned before deduction of operating expenses such as administration and selling
expenses. It represents the mark-up on goods and products sold and are thus a reflection of prices
setting policies.
The gross profit margin is a very important profitability measure for any business. It
essentially measures the trading effectiveness and basic profit earning potential of a firm. The
gross profit ratio is conventionally in percentage.
The gross profit ratio will be affected by factors such as the following.

IJMT Volume 2, Issue 8 ISSN: 2249-1058 __________________________________________________________
A Monthly Double-Blind Peer Reviewed Refereed Open Access International e-Journal - Included in the International Serial Directories Indexed & Listed at: Ulrich's Periodicals Directory ©, U.S.A., Open J-Gage, India as well as in Cabell’s Directories of Publishing Opportunities, U.S.A.
International Journal of Marketing and Technology http://www.ijmra.us
377
August 2012
Change in selling price
Change in buying policies and practices
Change in sales mix, that is, the respective proportion of the range of
products sold
Stock valuation methods
Table 5 gives the gross profit margin ratio for the Six companies for the five years period.
Table -5
Gross Profit Margin Ratio of Selected Telecommunication Companies in the
Years 2005-06 to 2009-10
COMPANY NAME As on
March
2006
As on
March
2007
As on
March
2008
As on
March
2009
As on
March
2010
Mean SD
Bharti Airtel 23.14 27.47 29.08 29.33 28.15 27.43 2.25
Reliance
Communication
- 40.43 29.26 21.84 5.03 24.13 11.69
Idea Cellular 26.64 29.91 25.81 20.51 15.84 23.74 4.97
Tata Communication 26.95 25.44 10.14 11.36 5.46 74.98 8.67
Tata Teleservices 4.44 1.74 2.67 2.11 2.51 2.69 0.93
TTML 0.58 10.61 -1.98 6.32 -1.28 2.85 5.22
Source: www.moneycontrol.com
The data presented in the table. 5 reveal that the gross profit margin ratio of the Bharti
Airtel Company was 23.14 in 2005-06. After that the gross profit margin ratio figures year after
year has increased continuously, till the year 2008-09. In the last year gross profit margin ratio of
the Bharti Airtel was 28.15.
During the year 2006-07 the gross profit margin ratio of Reliance Communications
Limited Company was 40.43. In the year 3 years the gross profit margin ratio decreased
continuously up to 2009-10.

IJMT Volume 2, Issue 8 ISSN: 2249-1058 __________________________________________________________
A Monthly Double-Blind Peer Reviewed Refereed Open Access International e-Journal - Included in the International Serial Directories Indexed & Listed at: Ulrich's Periodicals Directory ©, U.S.A., Open J-Gage, India as well as in Cabell’s Directories of Publishing Opportunities, U.S.A.
International Journal of Marketing and Technology http://www.ijmra.us
378
August 2012
In the case of Idea Cellular the gross profit margin in 2005-06 was 26.64. In the next year
increased 29.91. After that the gross profit margin figures year after year has decreased
continuously, till the year 2009-10.
During the year 2005-06 the gross profit margin ratio of Tata Communication Limited
Company was 26.95. In the year 2 years the gross profit margin ratio decreased continuously up
to 2007-08.In the next year will be increased it was in 11.36. In the last year gross profit margin
ratio of the Tata Communication was 5.46.
In the case of Tata Teleservices the gross profit margin ratioin2005-06 was 4.44. In the
next year 2006-07 the gross profit margin decreased to 1.74. Tata Teleservices had fluctuating
gross profit margin.
The gross profit margin ratio of Tata Teleservices Maharashtra Limited (TTML) in the
year 2005-06 was 0.58. In the next year 2006-07 the gross profit margin increased to 10.61.
TTML had fluctuating gross profit margin.
TEST FOR SIGNIFICANCE OF GROSS PROFIT MARGIN
Table 6 gives the relevant details whether the gross profit margin ratio of the 6
companies differed significantly and whether the ratio differed across the 5 years. Two way
ANOVA was used.
Two sets of Null Hypothesis
Set – 1: HO: There is no significant difference in the values of gross profit margin ratio of the
selected companies.
Set – 2: HO: There is no significant difference in the values of gross profit margin ratio during
the different years.
Table - 6
ANOVA – Gross Profit Margin Ratio
Sum of Square Degrees of Freedom Mean Square F- Ratio
Between Column 2501.47 4 625.37 8.125

IJMT Volume 2, Issue 8 ISSN: 2249-1058 __________________________________________________________
A Monthly Double-Blind Peer Reviewed Refereed Open Access International e-Journal - Included in the International Serial Directories Indexed & Listed at: Ulrich's Periodicals Directory ©, U.S.A., Open J-Gage, India as well as in Cabell’s Directories of Publishing Opportunities, U.S.A.
International Journal of Marketing and Technology http://www.ijmra.us
379
August 2012
Within Row 312.65 5 62.53 0.812
Residual 1462.46 19 76.97
Total 4276.58 28
Source: Computed
RESULT
Set – 1: HO: The table value of „F‟ at 5% for V1 = 4, V2 = 19 is 2.90. Since the
calculated value is more than the table the null hypothesis is rejected. Hence the value of gross
profit margin ratio of the six companies differs significantly.
Set – 2: HO: The calculated value of „F‟ is less than the table value. Hence the HO is
accepted. There is no longitudinal difference in the gross profit margin ratio.
NET PROFIT MARGIN RATIO OF SELECTED TELECOMMUNICATION
COMPANIES IN INDIA
Net profit is gross profit minus operating costs. It is the profit remaining after all the
firm‟s administration, marketing, distribution and other operating costs have been deducted from
gross profit. It should be noted that „net profit‟ in financial management is also frequently
referred to as earnings. There are several ways of calculating this ratio, depending on how we
wish to define net profit or earnings depending on whether, “Operating Profit before interest and
tax”, or profit after interest and tax or profit after interest but before tax is considered. Several
possibility of net profit margin emerges. Here are a few net profit or earnings measures which
are commonly applied. They are conventionally calculated as
Profit before interest and tax / sales x 100 = %
Profit after interest and tax / sales x 100 = %
Table gives the net profit margin ratio of the selected companies for five years.
Table - 7
Net Profit Margin Ratio of Selected Telecommunication Companies
For the year 2005-06 to 2009-10

IJMT Volume 2, Issue 8 ISSN: 2249-1058 __________________________________________________________
A Monthly Double-Blind Peer Reviewed Refereed Open Access International e-Journal - Included in the International Serial Directories Indexed & Listed at: Ulrich's Periodicals Directory ©, U.S.A., Open J-Gage, India as well as in Cabell’s Directories of Publishing Opportunities, U.S.A.
International Journal of Marketing and Technology http://www.ijmra.us
380
August 2012
COMPANY NAME As on
March
2006
As on
March
2007
As on
March
2008
As on
March
2009
As on
March
2010
Mean SD
Bharti Airtel 17.80 22.46 23.99 22.58 26.36 22.64 2.80
Reliance Communication 42.64 18.63 17.45 30.47 3.33 22.50 13.24
Idea Cellular 6.24 11.44 15.33 9.91 8.71 10.33 3.17
Tata Communication 12.10 11.25 8.87 13.25 14.47 11.99 1.90
Tata Teleservices 21.57 0.37 0.96 1.14 1.36 5.08 8.21
TTML -49.31 -21.81 -7.07 -7.80 -13.44 -19.89 15.63
Source: moneycontrol.com
The data presented in the table 7 reveal that the net profit margin ratio of the Bharti Airtel
Company was 17.80 in 2005-06. After that the net profit margin ratio figures have increased
continuously till the year 2007-08. Next year the ratio decreased the year 2008-09 was 22.58. In
the last year net gross profit ratio of Bharti Airtel was 26.36.
During the year 2005-06 the net profit margin ratio of Reliance Communication was
42.64. In the next year 2 years the net profit margin ratio decreased continuously up to 2007-08.
In the next year net profit margin was 30.47. In the last year net profit margin ratio of the
Reliance Communication was 3.33.
During the year 2005-06 the net profit margin ratio of Idea Cellular was 6.24. In the next
year 2 years the net profit margin ratio increased continuously up to 2007-08. In the next year net
profit margin was 9.91. In the last year net profit margin ratio of the Idea Cellular was 8.71.
In the case of Tata Communication the net profit margin in 2005-06 was 12.10.In the
next 2 years the net profit margin ratio decreased to 2007-08. After that the next year net profit
margin ratio was substantially increased up to 2009-10.
In the initial year 2005-06 the Tata Teleservices Limited had the net profit margin ratio of
21.57. In the next year the net profit margin ratio decreased to 0.37. Next 3 years increased up to
2009-10.
The net profit margin ratio of Tata Teleservices Maharashtra Limited (TTML) in the year
2005-06 was -49.31. But the negative net profit margin is shown by the TTML.
TEST FOR SIGNIFICANCE OF NET PROFIT MARGIN

IJMT Volume 2, Issue 8 ISSN: 2249-1058 __________________________________________________________
A Monthly Double-Blind Peer Reviewed Refereed Open Access International e-Journal - Included in the International Serial Directories Indexed & Listed at: Ulrich's Periodicals Directory ©, U.S.A., Open J-Gage, India as well as in Cabell’s Directories of Publishing Opportunities, U.S.A.
International Journal of Marketing and Technology http://www.ijmra.us
381
August 2012
Table 8 gives the relevant details whether the net profit margin ratio of the 6 companies
differed significantly and whether the ratio differed across the 5 years. Two ways ANOVA was
used.
Two sets of Null Hypothesis
Set – 1: HO: There is no significant difference in the values of net profit margin ratio of the
selected companies.
Set – 2: HO: There is no significant difference in the values of net profit margin ratio during the
different years.
Table - 8
ANOVA – Net Profit Margin Ratio
Sum of Square Degrees of Freedom Mean Square F – Ratio
Between Column 6142 4 1535.5 6.458
Within Row 97 5 19.4 0.082
Residual 4755 20 237.75
Total 109994 29
Source: Computed
RESULT
Set – 1: HO: The table value of „F‟ at 5% for V1 = 4, V2 = 20 is 2.87. Since the calculated value
is more than the table the null hypothesis is rejected. Hence the value of gross profit margin ratio
of the six companies differs significantly.
Set – 2: HO: The table value of „F‟ at 5% for V1 = 5, V2 = 20 is 2.71. Since the calculated value
is less than the table the null hypothesis is accepted. Hence the value of net profit margin ratio of
the six companies differs significantly.
OPERATING PROFIT MARGIN RATIO OF SELECTED TELECOMMUNICATION
COMPANIES IN INDIA

IJMT Volume 2, Issue 8 ISSN: 2249-1058 __________________________________________________________
A Monthly Double-Blind Peer Reviewed Refereed Open Access International e-Journal - Included in the International Serial Directories Indexed & Listed at: Ulrich's Periodicals Directory ©, U.S.A., Open J-Gage, India as well as in Cabell’s Directories of Publishing Opportunities, U.S.A.
International Journal of Marketing and Technology http://www.ijmra.us
382
August 2012
The operating profit margin measures the percentage of each sales dollar remaining after
all costs and expenses other than interest, taxes and preferred stock dividends are deducted. It
represents the “pure profits” earned on each sales dollar, operating profits are “pure” because
they measure only the profits earned on operations and ignore interest taxes and preferred stock
dividends. A high operating profit margin is preferred, the operating profit margin is calculated
as
Operating Profit Margin – Operating Profit / Sales x 100
This ratio is a complementary of net profit ratio. In case the n/p ratio is 20% operating ratio will
be 80% operating cost includes direct materials, direct labour and other overheads.
Table -9
Operating Profit Margin Ratio of Selected Telecommunication Companies in the
Years 2005-06 to 2009-10
COMPANY NAME As on
March
2006
As on
March
2007
As on
March
2008
As on
March
2009
As on
March
2010
Mean SD
Bharti Airtel 35.86 40.65 41.37 38.74 30.98 37.52 3.785
Reliance
Communication
- 43.21 41.73 34.66 16.18 33.95 10.11
Idea Cellular 38.38 36.96 37.07 31.63 27.37 162.80 4.160
Tata Communication 23.53 23.39 19.32 22.70 23.32 22.452 1.592
Tata Teleservices 5.08 3.61 3.83 2.86 2.99 3.674 0.792
TTML 11.23 20.54 23.75 28.27 22.27 21.212 5.612
Source: www. Moneycontrol.com
The data presented in the table 9 reveals that the operating profit margin ratio of the
Bharti Airtel Company was 35.86 in 2005-06. After that the operating profit margin ratio figures
year after year has increased continuously till the year 2007-08. The last year operating profit
margin ratio of the Bharti Airtel was 30.98.

IJMT Volume 2, Issue 8 ISSN: 2249-1058 __________________________________________________________
A Monthly Double-Blind Peer Reviewed Refereed Open Access International e-Journal - Included in the International Serial Directories Indexed & Listed at: Ulrich's Periodicals Directory ©, U.S.A., Open J-Gage, India as well as in Cabell’s Directories of Publishing Opportunities, U.S.A.
International Journal of Marketing and Technology http://www.ijmra.us
383
August 2012
During the year 2006-07 the operating profit margin ratio Reliance Communication
Limited Company was 43.21. After that in the last 3 years operating profit margin ratio
decreased continuously up to 2009-10, the amount was 16.18.
In the case of Idea Cellular Company the operating profit margin ratio in 2005-06 was
38.38. In the next year 2006-07 the operating profit margin ratio decreased to36.96. Idea Cellular
Company had fluctuating operating profit margin ratio.
In the initial year 2005-06 the Tata Communication Limited had the operating profit
margin ratio of 23.53. In the next 2 years 2007-08 the operating profit margin ratio decreased to
19.32. Last 2 years the operating profit margin ratio increased to 23.32.
The Tata Teleservices Limited in the year 2005-06 was 5.08. In the next year 2006-07 the
operating profit margin ratio decreased to 3.61. Tata Teleservices Limited had fluctuating
operating profit margin ratio.
In the case of Tata Teleservices Maharashtra Limited (TTML) the operating profit margin
ratio in 2005-06 was 11.23. In next 3 years 2008-09 the operating profit margin ratio increased to
28.27. In the last year operating profit margin ratio was 22.27.
TEST FOR SIGNIFICANCE OF OPERATING PROFIT MARGIN
Table 10 gives the relevant details whether the operating profit margin ratio of the six
companies differed significantly and whether the ratio differed across the five years. Two way
ANOVA was used.
Two sets of Null Hypothesis
Set – 1: HO: There is no significant difference in the values of operating profit margin ratio of
the selected companies.
Set – 2: HO: There is no significant difference in the values of operating profit margin ratio
during the different years.
Table 10
ANOVA – Operating Profit Margin Ratio

IJMT Volume 2, Issue 8 ISSN: 2249-1058 __________________________________________________________
A Monthly Double-Blind Peer Reviewed Refereed Open Access International e-Journal - Included in the International Serial Directories Indexed & Listed at: Ulrich's Periodicals Directory ©, U.S.A., Open J-Gage, India as well as in Cabell’s Directories of Publishing Opportunities, U.S.A.
International Journal of Marketing and Technology http://www.ijmra.us
384
August 2012
Sum of Square Degrees of Freedom Mean Square F-Ratio
Between Column 173.08 4 43.27 0.540
Within Row 3012.48 5 602.50 7.532
Residual 1519.74 19 79.99
Total 3012.48 28
Source: computed
RESULT
Set - 1: HO: The table value of „F‟ at 5% for V1 = 4, V2 = 19 is 2.90. Since the calculated value
is less than the table the null hypothesis is accepted. Hence the value of operating profit margin
ratio of the six companies differs significantly.
Set – 2: HO: The table value of „F‟ at 5% for V1 = 5, V2 = 19 is 2.74. Since the calculated value
is more than the table the null hypothesis is rejected. Hence the value of operating profit margin
ratio of the six companies differs significantly.
RETURN ON EQUITY OF SELECTED TELECOMMUNICATION COMPANIES
The return on equity measures the return earned on the stock holder‟s investment in the
firm. Generally the higher this return, the better for the owner‟s.
Formula for calculations
Profit after Interest and Taxes / Ordinary Share holders funds x 100%
The profitability from the point of view of the equity share holders will be judged after
taking into account the amount of dividend payable to the preference share holders.
Return on Investment = Net Income / Share holders equity
Table -11
Return on Equity of Selected Telecommunication Companies in the Year 2005-06 to
2009-10
COMPANY NAME AS on As on As on As on As on Mean SD

IJMT Volume 2, Issue 8 ISSN: 2249-1058 __________________________________________________________
A Monthly Double-Blind Peer Reviewed Refereed Open Access International e-Journal - Included in the International Serial Directories Indexed & Listed at: Ulrich's Periodicals Directory ©, U.S.A., Open J-Gage, India as well as in Cabell’s Directories of Publishing Opportunities, U.S.A.
International Journal of Marketing and Technology http://www.ijmra.us
385
August 2012
March
2006
March
2007
March
2008
March
2009
March
2010
Bharti Airtel 20.74 29.06 27.95 28.40 23.86 26.00 3.20
Reliance Communication - 10.96 9.65 4.80 1.97 6.85 3.44
Idea Cellular 10.44 14.96 16.92 11.20 10.73 12.85 2.61
Tata Communication 11.52 10.28 6.53 6.23 2.98 7.51 3.04
Tata Teleservices 2.87 2.04 0.89 6.28 5.74 3.56 2.10
TTML -21.48 -8.21 1.44 5.09 -0.73 -4.8 9.61
Source: www.moneycontrol.com
The data presented in the table 11 reveal that the return on equity of the Bharti Airtel
Company was 20.74. After that the return on equity was increased 29.06. Bharti Airtel had
fluctuating return on equity.
During the year 2006-07 the return on equity Reliance Communication Limited was
10.96. In the next 2 years return on equity decreased to 4.80. In the last years was increased to
1.97.
In the case of Idea Cellular Company the return on equity in 2005-06 was 10.44. In the
next 2 years the return on equity increased continuously up to 2007-08. In next 2 years the return
on equity decreased continuously up to 2009-10.
In the initial year 2005-06 the Tata Communication Company had the return on equity
was 11.52. In the next 4 years the return on equity decreased continuously up to 2009-10.
During the year 2005-06 the return on equity Tata Teleservices Limited was 2.87. In the
next 2 years the return on equity to decrease was 0.89. Tata Teleservices Limited had fluctuating
return on equity.
The return on equity of Tata Teleservices Maharashtra Limited (TTML) in the year 2005-
06 was -21.48. In the next year the return on equity negative value -8.21. Tata Teleservices
Maharashtra Limited (TTML) had fluctuating return on equity.
TEST FOR SIGNIFICANCE OF RETURN ON EQUITY

IJMT Volume 2, Issue 8 ISSN: 2249-1058 __________________________________________________________
A Monthly Double-Blind Peer Reviewed Refereed Open Access International e-Journal - Included in the International Serial Directories Indexed & Listed at: Ulrich's Periodicals Directory ©, U.S.A., Open J-Gage, India as well as in Cabell’s Directories of Publishing Opportunities, U.S.A.
International Journal of Marketing and Technology http://www.ijmra.us
386
August 2012
Table 12 given the relevant details whether the return on equity ratio of the six companies
differed significantly and whether the ratio differed across the five years, two way ANOVA was
used.
Two sets of Null Hypothesis
Set – 1: HO: There is no significant difference in the values of return on equity of the selected
companies.
Set – 2: HO: There is no significant difference in the values of return on equity during the
different years.
Table -12
ANOVA – Return on Equity
Sum of Square Degrees of Freedom Mean Square F – Ratio
Between Column 129.83 4 32.46 0.198
Within Row 50.78 5 10.16 0.062
Residual 3113.36 19 163.86
Total 3293.97 28
Source: computed
RESULT
Set – 1: HO: The table value of „F‟ at 5% for V1 = 4, V2 = 19 is 2.90. Since the calculated value
is less than the table the null hypothesis is accepted. Hence the value of return on equity of the
six companies differs significantly.
Set – 2: HO: The table value of „F‟ at 5% for V1 = 5, V2 = 19 is 2.74. Since the calculated value
is less than the table the null hypothesis is accepted. Hence the value of return on equity of the
six companies differs significantly.
EARNINGS PER SHARE OF SELECTED TELECOMMUNICATION COMPANIES IN
INDIA

IJMT Volume 2, Issue 8 ISSN: 2249-1058 __________________________________________________________
A Monthly Double-Blind Peer Reviewed Refereed Open Access International e-Journal - Included in the International Serial Directories Indexed & Listed at: Ulrich's Periodicals Directory ©, U.S.A., Open J-Gage, India as well as in Cabell’s Directories of Publishing Opportunities, U.S.A.
International Journal of Marketing and Technology http://www.ijmra.us
387
August 2012
Earnings per share (EPS) are based on approaches to valuation from a financial analysis
view point. The EPS is widely used by investment analysts, managers and share holders (both
present and potential) to evaluate how profitably the company is using investor‟s money. It
specifically reveals how much money the company is earning for every share invested.
Earnings per share(EPS) should be reported in the annual accounts of all stock market
listed companies in accordance with Financial Reporting Standard (FRS) 14 earnings per share
issued by the Account Standard Board(ASB).
A company‟s basic earnings per share (EPS) is, according to Financial Reporting
Standard (FRS) 14, calculated by dividing the net profit or loss attributable to ordinary
shareholders by weighted average number of ordinary shares outstanding during the period, net
profit (or loss) is essentially the net profit (or loss) for the period after deduction of tax,
exceptional and extraordinary items, minority interests and any preference dividends. The
weighted average number of ordinary shares reflects the fact that a number of shares in issue
may have varied during the relevant period, for example, as a result of new shares issues or buy
backs. However, for our practical purposes, we will largely ignore this (weighted average)
complication.
Essentially EPS is calculated as follows:
Net Income – Dividends on Preferred Stock / Average out Standing Shares
Table 13 gives the earnings per share of selected companies for the five years period.
Table -13
Earnings per Share of Selected Telecommunication Companies in the
Years 2005-06 to 2009-10
COMPANY
NAME
As on
March
2006
As on
March
2007
As on
March
2008
As on
March
2009
As on
March
2010
Mean SD

IJMT Volume 2, Issue 8 ISSN: 2249-1058 __________________________________________________________
A Monthly Double-Blind Peer Reviewed Refereed Open Access International e-Journal - Included in the International Serial Directories Indexed & Listed at: Ulrich's Periodicals Directory ©, U.S.A., Open J-Gage, India as well as in Cabell’s Directories of Publishing Opportunities, U.S.A.
International Journal of Marketing and Technology http://www.ijmra.us
388
August 2012
Bharti Airtel 10.62 21.27 32.90 40.79 24.82 26.08 10.263
Reliance
Communication
3.56 11.78 12.53 23.27 2.32 10.69 7.533
Idea Cellular 0.56 1.94 3.96 3.23 3.19 2.58 1.199
Tata
Communication
16.83 16.44 10.68 18.10 16.95 15.80 2.619
Tata
Teleservices
4.10 0.10 0.26 0.03 0.06 0.91 1.597
TTML -3.56 -1.72 -0.66 -0.84 -1.57 -1.67 1.029
Source: www moneycontrol.com
The data presented in the table 13.reveal that the earnings per share of the Bharti Airtel
were 10.62 in 2005-06. After that the earnings per share figures year after have increased
continuously, till the year 2008-09. In the last year earnings per share of the Bharti Airtel were
24.82.
During the year 2005-06 the earnings per share of Reliance Communication Limited
Company were 3.56. In the next 3 years the earnings per share increased continuously up to
2008-09. In the last year earnings per share of the Reliance Communication were 2.32.
In case of Idea Cellular Company to earnings per share in 2005-06 was 0.56. In the next
2 years the earnings per share increased continuously up to 2007-08. In the next 2 years earnings
per share decreased continuously up to 2009-10 were 3.19.
In the initial year 2005-06 the Tata Communication Company to earnings per share in
2005-06 was 16.83. In the next year 2006-07 the earnings per share decreased to 16.44. Tata
Communication had fluctuating earnings per share.
The earnings per share of Tata Teleservices Company in the year 2005-06 were 4.10. In
the next year 2006-07 the earnings per share decreased to 0.10. Tata Communication had
fluctuating earnings per share.
In the initial year 2005-06 the Tata Teleservices Maharashtra Limited (TTML) had the
earnings per share of -3.56. After that the Tata Teleservices Maharashtra Limited (TTML)
earnings per share was totally negative.
IJMT Volume 2, Issue 8 ISSN: 2249-1058 __________________________________________________________
A Monthly Double-Blind Peer Reviewed Refereed Open Access International e-Journal - Included in the International Serial Directories Indexed & Listed at: Ulrich's Periodicals Directory ©, U.S.A., Open J-Gage, India as well as in Cabell’s Directories of Publishing Opportunities, U.S.A.
International Journal of Marketing and Technology http://www.ijmra.us
389
August 2012
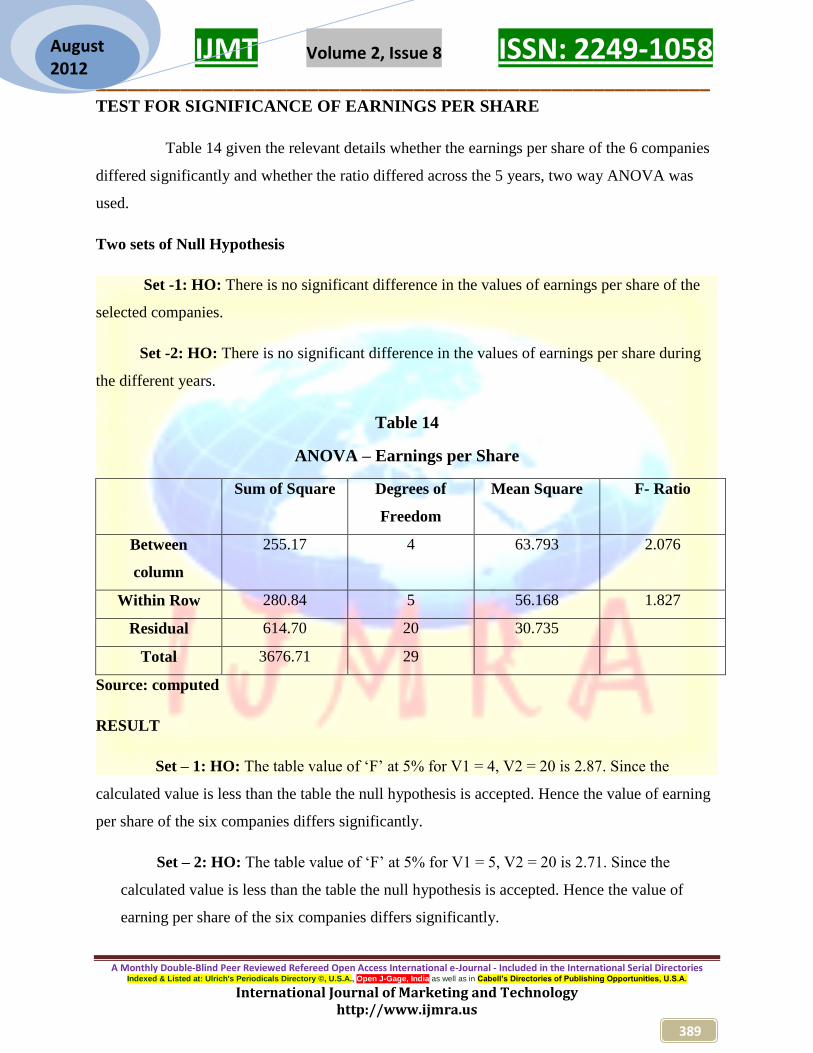
TEST FOR SIGNIFICANCE OF EARNINGS PER SHARE
Table 14 given the relevant details whether the earnings per share of the 6 companies
differed significantly and whether the ratio differed across the 5 years, two way ANOVA was
used.
Two sets of Null Hypothesis
Set -1: HO: There is no significant difference in the values of earnings per share of the
selected companies.
Set -2: HO: There is no significant difference in the values of earnings per share during
the different years.
Table 14
ANOVA – Earnings per Share
Sum of Square Degrees of
Freedom
Mean Square F- Ratio
Between
column
255.17 4 63.793 2.076
Within Row 280.84 5 56.168 1.827
Residual 614.70 20 30.735
Total 3676.71 29
Source: computed
RESULT
Set – 1: HO: The table value of „F‟ at 5% for V1 = 4, V2 = 20 is 2.87. Since the
calculated value is less than the table the null hypothesis is accepted. Hence the value of earning
per share of the six companies differs significantly.
Set – 2: HO: The table value of „F‟ at 5% for V1 = 5, V2 = 20 is 2.71. Since the
calculated value is less than the table the null hypothesis is accepted. Hence the value of
earning per share of the six companies differs significantly.
IJMT Volume 2, Issue 8 ISSN: 2249-1058 __________________________________________________________
A Monthly Double-Blind Peer Reviewed Refereed Open Access International e-Journal - Included in the International Serial Directories Indexed & Listed at: Ulrich's Periodicals Directory ©, U.S.A., Open J-Gage, India as well as in Cabell’s Directories of Publishing Opportunities, U.S.A.
International Journal of Marketing and Technology http://www.ijmra.us
390
August 2012
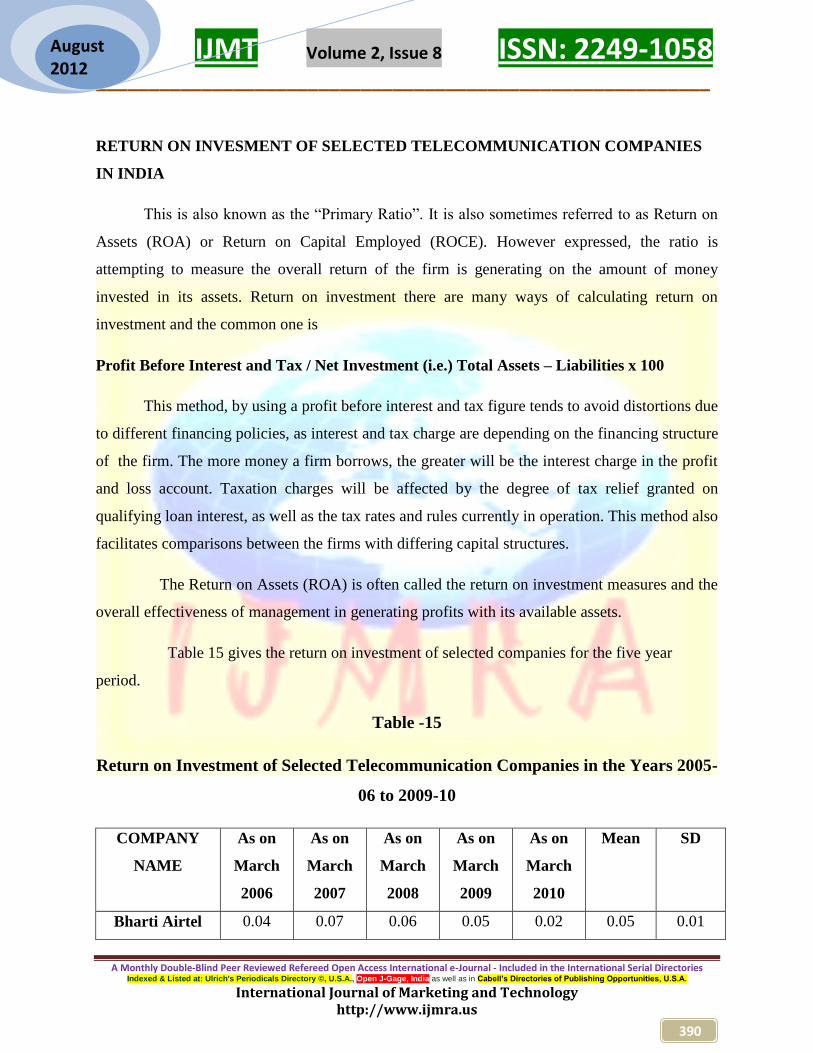
RETURN ON INVESMENT OF SELECTED TELECOMMUNICATION COMPANIES
IN INDIA
This is also known as the “Primary Ratio”. It is also sometimes referred to as Return on
Assets (ROA) or Return on Capital Employed (ROCE). However expressed, the ratio is
attempting to measure the overall return of the firm is generating on the amount of money
invested in its assets. Return on investment there are many ways of calculating return on
investment and the common one is
Profit Before Interest and Tax / Net Investment (i.e.) Total Assets – Liabilities x 100
This method, by using a profit before interest and tax figure tends to avoid distortions due
to different financing policies, as interest and tax charge are depending on the financing structure
of the firm. The more money a firm borrows, the greater will be the interest charge in the profit
and loss account. Taxation charges will be affected by the degree of tax relief granted on
qualifying loan interest, as well as the tax rates and rules currently in operation. This method also
facilitates comparisons between the firms with differing capital structures.
The Return on Assets (ROA) is often called the return on investment measures and the
overall effectiveness of management in generating profits with its available assets.
Table 15 gives the return on investment of selected companies for the five year
period.
Table -15
Return on Investment of Selected Telecommunication Companies in the Years 2005-
06 to 2009-10
COMPANY
NAME
As on
March
2006
As on
March
2007
As on
March
2008
As on
March
2009
As on
March
2010
Mean SD
Bharti Airtel 0.04 0.07 0.06 0.05 0.02 0.05 0.01

IJMT Volume 2, Issue 8 ISSN: 2249-1058 __________________________________________________________
A Monthly Double-Blind Peer Reviewed Refereed Open Access International e-Journal - Included in the International Serial Directories Indexed & Listed at: Ulrich's Periodicals Directory ©, U.S.A., Open J-Gage, India as well as in Cabell’s Directories of Publishing Opportunities, U.S.A.
International Journal of Marketing and Technology http://www.ijmra.us
391
August 2012
Reliance
Communication
- 25.41 29.21 20.91 0.12 15.13 10.09
Idea Cellular 0.11 0.10 0.11 0.09 0.06 0.09 0.02
Tata
Communication
0.01 0.01 0.02 10.94 0.02 2.20 4.37
Tata
Teleservices
0.47 0.22 0.44 0.40 0.39 0.38 12.70
TTML -31.79 -0.02 -0.02 0.01 0.01 6.36 12.71
Source: www.moneycontrol.com
The data presented in the table 15 reveal that the return on investment of the Bharti
Airtel Company was 0.04 in 2005-06. In the next year return on investment increased 0.07.
Bharti Airtel had fluctuating return on investment.
During the year 2006-07 the return on investment of Reliance Communication Limited
was 25.41. In the next year return on investment increased was 29.21. Last 2 years return on
investment was decreased 0.12.
In the case of Idea Cellular Company the return on investment in 2005-06 was 0.11. In
the next year 2006-07 return on investment was 0.10. Idea Cellular had fluctuating return on
investment.
In the initial year 2005-06 the Tata Communication Company had the return on
investment was 0.01. In the next year same value of return on investment. Tata Communication
had fluctuating return on investment.
The return on investment of Tata Teleservices Limited in the year 2005-06 was 0.47. In
the next year return on investment decreased was 0.22. Tata Teleservices had fluctuating return
on investment.
In case of Tata Teleservices Limited the return on investment in 2005-06 was 0.47. In
the next year 2006-07 decreased was 0.22. Next year return on investment increased was 0.44.
Last 2 years return on investment decreased 0.39.

IJMT Volume 2, Issue 8 ISSN: 2249-1058 __________________________________________________________
A Monthly Double-Blind Peer Reviewed Refereed Open Access International e-Journal - Included in the International Serial Directories Indexed & Listed at: Ulrich's Periodicals Directory ©, U.S.A., Open J-Gage, India as well as in Cabell’s Directories of Publishing Opportunities, U.S.A.
International Journal of Marketing and Technology http://www.ijmra.us
392
August 2012
In the case of Tata Teleservices Maharashtra Limited (TTML) the return on investment in
2005-06 was -31.79. Next 2 years continuously negative value. Next 2 years continuously same
value up to 2009-10 was 0.01.
TEST FOR SIGNIFICANCE OF RETURN ON INVESMENT
Table 16 gives the relevant details whether the return on investment of the six
companies differed significantly and whether the ratio differed across the 5 years. Two way
ANOVA was used.
Two sets of Null Hypothesis
Set – 1: HO: There is no significant difference in the values of return on investment of the
selected companies.
Set – 2: HO: There is no significant difference in the values of return on investment
during the different years.
Table -16
ANOVA – Return on Investment
Sum of Square Degrees of
Freedom
Mean Square F – Ratio
Between
Column
514.38 4 128.60 2.731
Within Row 1544.25 5 308.85 6.559
Residual 894.75 19 47.09
Total 2953.15 28
Source: computed
RESULT
Set – 1: HO: The table value of „F‟ at 5% for V1 = 4, V2 = 19 is 2.90. Since the
calculated value is less than the table the null hypothesis is accepted. Hence the value of return
on investment of the six companies differs significantly.

IJMT Volume 2, Issue 8 ISSN: 2249-1058 __________________________________________________________
A Monthly Double-Blind Peer Reviewed Refereed Open Access International e-Journal - Included in the International Serial Directories Indexed & Listed at: Ulrich's Periodicals Directory ©, U.S.A., Open J-Gage, India as well as in Cabell’s Directories of Publishing Opportunities, U.S.A.
International Journal of Marketing and Technology http://www.ijmra.us
393
August 2012
Set – 2: HO: The table value of „F‟ at 5% for V1 = 5, V2 = 19 is 2.74. Since the
calculated value is more than the table the null hypothesis is rejected. Hence the value of return
on investment of the six companies differs significantly.
OPERATING PROFIT OF THE TELECOMMUNICATION COMPANIES
The following table17 gives the particulars of private telecommunication operating
profit during the period of 2005-2006 to 2009-2010.
Table- 17
Operating Profit of the Telecommunication Companies(Rs. Crores)
Year Bharti
Airtel
Reliance
Communication
Idea
Cellular
Tata
Communication
Tata
Teleservices
TTML
2005-
2006
4038.57 4058.57 770.47 950.95 121.14 123.05
2006-
2007
7260.54 5513.01 1613.97 953.73 291.08 289.07
2007-
2008
10662.41 6173.29 2491.32 645.55 321.23 405.48
2008-
2009
13215.68 5229.93 3118.59 851.28 450.97 576.58
2009-
2010
13966.34 2193.43 3244.09 750.61 571.66 493.00
Mean 9228.71 4633.64 2247.69 830.42 351.22 377.44
SD 3725.80 1398.91 2964.60 118.92 152.31 158.95
CV 40.37 30.19 131.90 14.32 43.37 42.11
Source: www.moneycontrol.com
Among the six telecommunication companies, the operating profit of Tata
Communication is more consistent as the Co-efficient of variance is less. Bharti Airtel is having
better operation profit as the average is higher.

IJMT Volume 2, Issue 8 ISSN: 2249-1058 __________________________________________________________
A Monthly Double-Blind Peer Reviewed Refereed Open Access International e-Journal - Included in the International Serial Directories Indexed & Listed at: Ulrich's Periodicals Directory ©, U.S.A., Open J-Gage, India as well as in Cabell’s Directories of Publishing Opportunities, U.S.A.
International Journal of Marketing and Technology http://www.ijmra.us
394
August 2012
INCOME EARNED BY THE TELECOMMUNICATION COMPANIES
The following table 18 gives the particulars of telecommunication companies income
earned during the period of 2005-2006 to 2009-2010.
Table- 18
Income Earned by the Telecommunication Companies(Rs.Crores)
Year Bharti
Airtel
Reliance
Communication
Idea
Cellular
Tata
Communication
Tata
Teleservices
TTML
2005-
2006
11272.22 133.26 2012.26 3905.57 227.38 1045.79
2006-
2007
17987.30 231.89 4392.84 4147.66 430.26 1431.28
2007-
2008
25874.20 520.53 6904.16 3456.55 133.78 1785.59
2008-
2009
32791.86 4148.13 10258.83 4223.01 336.73 2007.90
2009-
2010
36693.09 2455.17 12234.07 3577.99 257.85 2252.06
Mean 24923.73 1497.80 7160.43 3862.16 277.20 1704.52
SD 6650.08 1518.91 3730.17 1590.86 100.40 425.91
CV 26.68 101.41 52.09 39.09 36.22 24.99
Source: www.moneycontrol.com
Among the six telecommunication companies, the Income of Tata Teleservices
Maharashtra Limited is more consistent as the Co-efficient of variation is less. Bharti Airtel
having better other income as the average is higher.
CONCLUSION
Indian telecom market is one of the fastest growing markets in the world as a result of
its high population and development potential. Some of the telecommunication companies in

IJMT Volume 2, Issue 8 ISSN: 2249-1058 __________________________________________________________
A Monthly Double-Blind Peer Reviewed Refereed Open Access International e-Journal - Included in the International Serial Directories Indexed & Listed at: Ulrich's Periodicals Directory ©, U.S.A., Open J-Gage, India as well as in Cabell’s Directories of Publishing Opportunities, U.S.A.
International Journal of Marketing and Technology http://www.ijmra.us
395
August 2012
India are Bharti Airtel, Reliance Communication, Idea Cellular Tata Communication Tata
Teleservices Tata Teleservices Maharashtra limited (TTML) and other major operators in India.
In is the backbone of industrial and economic development. The industry has been aiding
delivery of voice and data services at rapidly increasing speeds, and thus has been
revolutionizing human communication.
Financial Performance of six companies for five years periods is analyzed for the study by
using the techniques as follows: liquidity, profitability, turnover, and comparative analysis
calculating Equity share capital, Reserve, co-efficient of variation in operating profit, interest
earned, and income earned, employee expenses, expenditure and market performance of selected
telecommunication sector in India.
Telecommunication is played a vital role in our economy. The booming telecom industry
has been attracting large amount of investments in the country. Private telecommunication is
more telecom operator sector in India. Bharti Airtel emerges as India's top mobile phone operator
in 2009-10. Other operator is important place of telecommunication in India. In the present ear
people cannot ignore telecommunication services in communicating each other.
REFERENCES
1. Modern Investment and Security Analysis. Russell .J fuller and James 1, Farrell, Mc.
Craw Hill International edition ,New York
2. Jack Clark Francis “ Investment Analysis and Management” Mcgraw hill, New York
3. Management Accounting – S.Kr. Paul
4. Fisher D.F and Jorden: 1995 “Security analysis and Portfolio Management” Indian
reprint Prentice Hall of India (p) Ltd, New Delhi.
5. Prassanna Chandra ,Financial Management. Tata Mcgraw Hill publishing company
Limited ,New Delhi.

IJMT Volume 2, Issue 8 ISSN: 2249-1058 __________________________________________________________
A Monthly Double-Blind Peer Reviewed Refereed Open Access International e-Journal - Included in the International Serial Directories Indexed & Listed at: Ulrich's Periodicals Directory ©, U.S.A., Open J-Gage, India as well as in Cabell’s Directories of Publishing Opportunities, U.S.A.
International Journal of Marketing and Technology http://www.ijmra.us
396
August 2012
6. Bhalla .V (1982) “Investment Management”, Sulthan Chand and Company Ltd ,New
Delhi.
7. Annual Reports of Selected Telecommunication Companies
8. Financial Management – S.N. Maheswari, Sultan Chand and sons, New Delhi.
9. Pandey I.M., Financial Management, Vikash publishing House, New Delhi.
10. Telecommunication Statistics in India
Websites:
1. www.Moneycontrol.com
2. www.Business Maps of India.com
3. www.religare.com
4. www.nsc.com
5. www.telecommunication.com
6. www.wikipedia.com
7. www.bharti airtel.com
8. www.reliance communication.com
9. www.idea cellular.com
10. www.tata communication.com