a mediterranean low-glycemic-load diet alone or in
TRANSCRIPT

Fairfield University Fairfield University
DigitalCommons@Fairfield DigitalCommons@Fairfield
Biology Faculty Publications Biology Department
2011
A Mediterranean Low-Glycemic-Load Diet alone or in Combination A Mediterranean Low-Glycemic-Load Diet alone or in Combination
with a Medical Food Improves Insulin Sensitivity and Reduces with a Medical Food Improves Insulin Sensitivity and Reduces
Inflammation in Women with Metabolic Syndrome Inflammation in Women with Metabolic Syndrome
Jennifer L. Jones
Daniela Ackerman
Jacqueline Barona
Mariana Calle
Catherine J. Andersen Fairfield University, [email protected]
See next page for additional authors
Follow this and additional works at: https://digitalcommons.fairfield.edu/biology-facultypubs
Copyright 2011 SCIENCEDOMAIN International
Copyright 2011 The copyrights of all papers published in this journal are retained by the
respective authors as per the 'Creative Commons Attribution License'
(http://creativecommons.org/licenses/by/3.0/).
Peer Reviewed Peer Reviewed
Repository Citation Repository Citation Jones, Jennifer L.; Ackerman, Daniela; Barona, Jacqueline; Calle, Mariana; Andersen, Catherine J.; Kim, Jung Eun; Volek, Jeff S.; McIntosh, Mark; Najm, Wadie; Lerman, Robert H.; and Fernandez, Maria Luz, "A Mediterranean Low-Glycemic-Load Diet alone or in Combination with a Medical Food Improves Insulin Sensitivity and Reduces Inflammation in Women with Metabolic Syndrome" (2011). Biology Faculty Publications. 37. https://digitalcommons.fairfield.edu/biology-facultypubs/37
Published Citation Jones, Jennifer L., Daniela Ackermann, Jacqueline Barona, Mariana Calle, Catherine Andersen, Jung Eun Kim, Jeff S. Volek, Mark McIntosh, Wadie Najm, Robert H. Lerman, and Maria Luz Fernandez. "A Mediterranean Low-Glycemic-Load Diet alone or in Combination with a Medical Food Improves Insulin Sensitivity and Reduces Inflammation in Women with Metabolic Syndrome." British Journal of Medicine & Medical Research 1, no.4 (2011): 356-370.
This item has been accepted for inclusion in DigitalCommons@Fairfield by an authorized administrator of DigitalCommons@Fairfield. It is brought to you by DigitalCommons@Fairfield with permission from the rights-holder(s) and is protected by copyright and/or related rights. You are free to use this item in any way that is You are free to use this item in any way that is permitted by the copyright and related rights legislation that applies to your use. For other uses, you need to obtain permitted by the copyright and related rights legislation that applies to your use. For other uses, you need to obtain permission from the rights-holder(s) directly, unless additional rights are indicated by a Creative Commons license permission from the rights-holder(s) directly, unless additional rights are indicated by a Creative Commons license in the record and/or on the work itself.in the record and/or on the work itself. For more information, please contact [email protected].

Authors Authors Jennifer L. Jones, Daniela Ackerman, Jacqueline Barona, Mariana Calle, Catherine J. Andersen, Jung Eun Kim, Jeff S. Volek, Mark McIntosh, Wadie Najm, Robert H. Lerman, and Maria Luz Fernandez
This article is available at DigitalCommons@Fairfield: https://digitalcommons.fairfield.edu/biology-facultypubs/37
___________________________________________________________________________________________ *Corresponding author: Email: [email protected];
British Journal of Medicine & Medical Research 1(4): 356-370, 2011
SCIENCEDOMAIN international
www.sciencedomain.org
A Mediterranean Low-Glycemic-Load Diet alone or in Combination with a Medical Food
Improves Insulin Sensitivity and Reduces Inflammation in Women with Metabolic
Syndrome
Jennifer L. Jones1, Daniela Ackermann1, Jacqueline Barona1, Mariana Calle1, Catherine Andersen1, Jung Eun Kim1, Jeff S. Volek1,
Mark McIntosh2, Wadie Najm3, Robert H. Lerman4 and Maria Luz Fernandez1*
1Department of Nutritional Sciences, University of Connecticut, Storrs, Connecticut, USA.
2Departmemt of Emergency Medicine, University of Florida, Jacksonville, Florida, USA.
3Department of Medicine, University of California, Irvine, California, USA.
4Metagenics Inc., Gig Harbor, WA.
Received 15th
July 2011 Accepted 13
th August 2011
Online Ready 24th
August 2011
ABSTRACT
Aim: To determine the effects of a Mediterranean-style low-glycemic load diet alone or in combination with a medical food (MF) on insulin resistance and inflammation in women with metabolic syndrome (MetS). Study design: Two groups, Parallel study with control. Place and Duration of Study: Department of Nutritional Sciences, University of Connecticut, Storrs, CT; Department of Emergency Medicine, University of Florida, Jacksonville, FL; Department of Medicine, University of California, Irvine, CA. The study was carried out from September of 2009 to May 2010. Methodology: Eighty three women (20-75 y) with MetS. Participants were randomly allocated to consume diet alone (control group) or the diet plus the MF (MF group) for 12 wk. Body composition was measured at baseline, week 8 and week 12 by use of bioelectrical impedance in all participants while Dual-emission X-ray absorptiometry was
Research Article
British Journal of Medicine & Medical Research, 1(4): 356-370, 2011
357
used for 37 of the subjects. Insulin resistance, plasma insulin, leptin, adiponectin and the inflammatory cytokines, tumor necrosis factor (TNF)-α, interleukin-6 (IL-6), adhesion molecules, sICAM-1 and sVCAM-1, were measured at the same time points. Results: Independent of group allocation, women had decreases in body mass index (p < 0.0001) and body and trunk fat (p < 0.0001). Plasma insulin, insulin resistance, and leptin were also significantly decreased over time (p < 0.0001), while plasma adiponectin levels did not change. Regarding inflammatory markers, significant reductions were found in TNF-α (p < 0.0001) and sICAM-1 levels (p < 0.001), but not in IL-6 or sVCAM-1. At 12 wk, sICAM was reduced only in the MF group (p<0.05 vs control). Conclusion: A Mediterranean-style diet, in combination with a MF, are a viable option to decrease factors associated with increased risk for type 2 diabetes and coronary heart disease.
Keywords: Metabolic syndrome; mediterranean diet; glycemic load; insulin; inflammation;
body composition; This trial was registered at clinicaltrials.gov as NCT01010841.
ABBREVIATIONS BMI: body mass index; BP: blood pressure; CVD: cardiovascular disease; DEXA: dual-energy X-ray absorptiometry; HDL-C: HDL cholesterol; ICAM: Intracellular adhesion molecule; IL-6: interleukin-6; LDL-C: LDL cholesterol; MetS: Metabolic syndrome; NHANES: National Health and Nutrition Examination Survey; T2D: type 2 diabetes; TNF-α: tumor necrosis alpha; VCAM: vascular cell adhesion molecule-1 WC: waist circumference; WC: waist circumference.
1. INTRODUCTION Insulin resistance, the diminished capacity of a cell to respond to insulin action, has been established as a primary underlying cause of metabolic syndrome (MetS) development (Lann, Gallagher et al. 2008; Gallagher, Leroith et al., 2010; Maheshwari and Thuluvath, 2011). An individual is classified as having MetS if 3 of the following criterion are met: hyperglycemia, high waist circumference (WC), elevated blood pressure (BP), elevated triglycerides (TG), and low high-density lipoprotein cholesterol (HDL-C) (Alberti, Eckel et al. 2009). According to the National Health and Nutrition Examination Survey (NHANES) 2003-2006, approximately one-third of the US adult population is affected by MetS, and this significantly increases the risk for developing cardiovascular disease (CVD) and type 2 diabetes (T2D) (Ervin 2009). While insulin resistance is often considered the causal feature for development of MetS, abdominal obesity is also a major contributor and the two components are clearly related (Després, 2006; Després, Lemieux et al., 2008; Westphal, 2008; Reddy, Singh et al., 2010). Adipose tissue is considered an active endocrine organ (Wozniak, Gee et al., 2009; Han and Lean, 2011), responsible for secreting biologically active molecules, collectively termed ‘adipokines’ (Caruso, Balistreri et al., 2010). When adipose tissue is excessive, secretion of
British Journal of Medicine & Medical Research, 1(4): 356-370, 2011
358
adipokines such as adiponectin, leptin, interleukin 6 (IL-6) and tumor necrosis factor alpha (TNF-α) can be negatively altered (Lago, Dieguez et al., 2007; Lago, Gómez et al., 2009), which can in turn influence energy regulation and inflammation (Han and Lean, 2011). Adiponectin, an insulin sensitizer with anti-inflammatory properties, tends to be decreased in obesity and MetS (Ryo, Nakamura et al. 2004; Huang 2009). Leptin is important for regulation of appetite and energy balance. In obese individuals, despite elevated leptin concentrations, sensitivity to this molecule has been shown to decrease (Gnacińska, Małgorzewicz et al., 2009). Proinflammatory adipokines, IL-6 and TNF-α, also tend to be upregulated in obesity, and these molecules have a role in insulin resistance and endothelial dysfunction (Ryo, Nakamura et al. 2004; Maury and Brichard 2010; Van Linthout, Foryst-Ludwig et al. 2010). These inflammatory mediators alter insulin sensitivity via action on nuclear factor kappa B (NFкB) and jun N-terminal kinase (JNK) pathways, and they facilitate expression of intercellular adhesion molecule-1 (ICAM-1) and vascular cell adhesion molecule-1 (VCAM-1), which both play a role in atherogenesis (Lyon, Law et al., 2003; Shoelson, Herrero et al., 2007). Obesity has also been associated with macrophage accumulation in adipose tissue, and this could further contribute to the production of proinflammatory cytokines (Weisberg, McCann et al., 2003). The central focus to treat inflammation, excess abdominal fat stores, and insulin resistance that compose MetS, remains lifestyle modification. Various researchers have highlighted the potential efficacy of adherence to a Mediterranean-style diet for treatment of MetS characteristics (Babio, Bulló et al., 2009; Sofi, 2009; Kastorini, Milionis et al., 2011). Epidemiological data suggest that prevalence of MetS tends to be associated with dietary patterns that contain excessive amounts of high glycemic index foods (Baxter, Coyne et al. 2006). Therefore, our aim was to examine the impact of a low-glycemic-load Mediterranean-style diet on specific MetS variables, namely inflammation, insulin resistance, and obesity. Additionally, our objective was to assess whether a medical food (MF), containing rho iso-alpha acids from hops (Humulus lupulus L.) and proanthocyanidins from acacia (Acacia nilotica), which may modulate insulin-signaling and inflammatory pathways (Lerman, Minich et al., 2008), provided further benefits. We hypothesized that following this dietary intervention would result in similar weight loss for all participants, but the group consuming the MF would have greater improvements in insulin sensitivity and present a better inflammatory profile.
2. METHODS 2.1 Materials The medical food (UltraMeal
® Plus 360
O) was provided by Metagenics, Inc (Gig Harbor,
WA), in powdered form. Kits to measure adiponenctin, sICAM, sVCAM, TNF-α and IL-6 were obtained from Millipore (Billerica, MA).
2.2 Study Population Women were recruited at three sites (University of Connecticut, Storrs, CT; University of Florida, Jacksonville, FL and University of California, Irvine, CA). To be eligible for participation, women had to be between the ages of 20 and 75 years with a BMI between 25 and 45 kg/m
2. In addition, they had to have LDL-C ≥ 100 mg/dL (2.59 mmol/L), TG ≥ 150
mg/dL (1.70 mmol/L), and meet two of the four remaining criteria for MetS according to NCEP-ATP-III criteria [HDL-C < 50 mg/dL (1.30 mmol/L), fasting plasma glucose > 100

British Journal of Medicine & Medical Research, 1(4): 356-370, 2011
359
mg/dL (5.55 mmol/L), blood pressure (BP) > 130/85 mm Hg, and WC > 88 cm) (ATP, (2002). Main exclusion criteria included heart, liver, or kidney disease and use of hypoglycemic or cholesterol-lowering agents. Potential participants provided informed consent during screening and before the study began. The women also provided a medical history prior to participation. Study protocols and the procedures to obtain consent forms were approved by the Institutional Review Board at each respective site.
2.3 Study Design After entrance criteria were met and consent was obtained, women were randomly allocated to the control group or the medical food (MF) group. Both groups were given detailed instructions to consume a modified Mediterranean-style, low-glycemic-load diet for the duration of the 12-week intervention. Women in the MF group consumed the same diet plus a powdered beverage form of a medical food containing soy protein, plant sterols, rho iso-alpha acids, and Acacia proanthocyanidins, mixed into water, twice each day for 12 weeks. Participants came on-site for a baseline visit and returned at weeks 2, 4, 6, 8, 10, and 12 for follow-up visits. Compliance with MF intake guideline was assessed by weighing the unused powder every 2 weeks.
2.4 Diet and Exercise Description Participants were invited to an on-site meeting 1 week prior to the start of the study, at which time an instructional DVD was viewed and detailed dietary booklets were distributed summarizing dietary guidelines, lists of suitable foods, suggested serving sizes, and recipes. Subjects were also instructed on how to complete a detailed food record that included 2 weekdays and one weekend day. The dietary approach was parallel to that designed by Schiltz et al. (Schiltz, Minich et al., 2009). Subjects were advised to follow a Mediterranean-style diet with emphasis on intake of legumes, fish and lean meats. In addition, specific limitations were placed on intake of grains (1 serving per day) and alcohol (an optional 1 serving per day). Lastly, natural and artificial sweeteners were excluded from the diet. The women were not instructed to restrict caloric intake. A 3-day food record was obtained at baseline (to assess habitual dietary intake) and every 2 weeks (to assess dietary compliance and nutrient intake). The participants met with a Registered Dietitian at each visit for diet counseling. Subjects were asked to maintain their normal level of physical activity for the entirety of the intervention and 7-day exercise logs were collected to measure compliance with this instruction.
2.5 Data Collection Following a 12-hour overnight fast, 60 mL of blood were collected into EDTA tubes at baseline, week 8, and week 12. Plasma was separated by centrifugation at 2000 x g: 20 min at 4°C. The plasma was aliquoted to cryotubes and stored at -80 °C and later sent to a certified laboratory (Northwest Lipid Research Laboratories, Seattle, WA) for analysis of insulin, or used at the University of Connecticut for analysis of adipokines and inflammatory markers.
2.6 BMI and Body Composition At each visit, body weight was measured to the nearest 0.1 kg on a calibrated digital scale, and BMI was calculated (kg/m
2). At baseline, week 8 and week 12, bioelectrical impedance

British Journal of Medicine & Medical Research, 1(4): 356-370, 2011
360
analysis (BIA) was used to assess body composition, utilizing an Impedimed DF 50 (Xitron Technologies, San Diego, CA) at all sites. In addition to the BIA, the University of Connecticut and the University of California, Irvine, determined whole body and regional
body composition using fan-beam dual-energy X-ray absorptiometry (DEXA) (Prodigy, Lunar Advance Corporation, Madison, WI). Analyses were performed by a technician at the respective sites (MF: n = 18, control: n = 17).
2.7 Plasma Insulin and Insulin Resistance Plasma insulin was measured by a chemiluminescent, immunoassay using the DPC Immulite 2000 (Diagnostics Products Corporation, Nutley, NJ) at Northwest Lipid Research Laboratories (Seattle, WA). Insulin resistance was calculated using the homeostasis model assessment (HOMA) equation ([fasting
insulin (µU/ml) x fasting glucose (mmol/l)]/22.5)
(Muniyappa, Lee et al., 2008).
2.8 Fasting Adiponectin, sVCAM-1, and sICAM-1 Fasting plasma was used to measure concentrations of adiponectin, sVCAM-1, and sICAM-1 in duplicate using the Milliplex Human CVD Panel 1 (City, State). The samples were diluted 1:100 and antibody-immobilized beads specific for each analyte were used for simultaneous quantification with xMAP
® technology on the Luminex
® IS 200 system (Austin,
TX).
2.9 Fasting IL-6, TNF-α, and Leptin Fasting plasma was used to measure concentrations of IL-6, TNF-α, and leptin in duplicate using the Milliplex Human Cytokine kit and xMAP
® technology on the Luminex
® IS 200
system (Austin, TX). Specific antibody-immobilized beads were used to simultaneously quantify IL-6, TNF-α, and leptin.
2.10 Statistical Analysis Repeated measures analysis of variance (ANOVA) was used to compare the control and MF groups over time. The repeated measure was the individual’s response to the intervention over time and the control vs. the MF served as the between subject factors. SPSS 12.0 for Windows (SPSS, Inc., Evanston, IL) was used and results were considered significant with a p < 0.05.
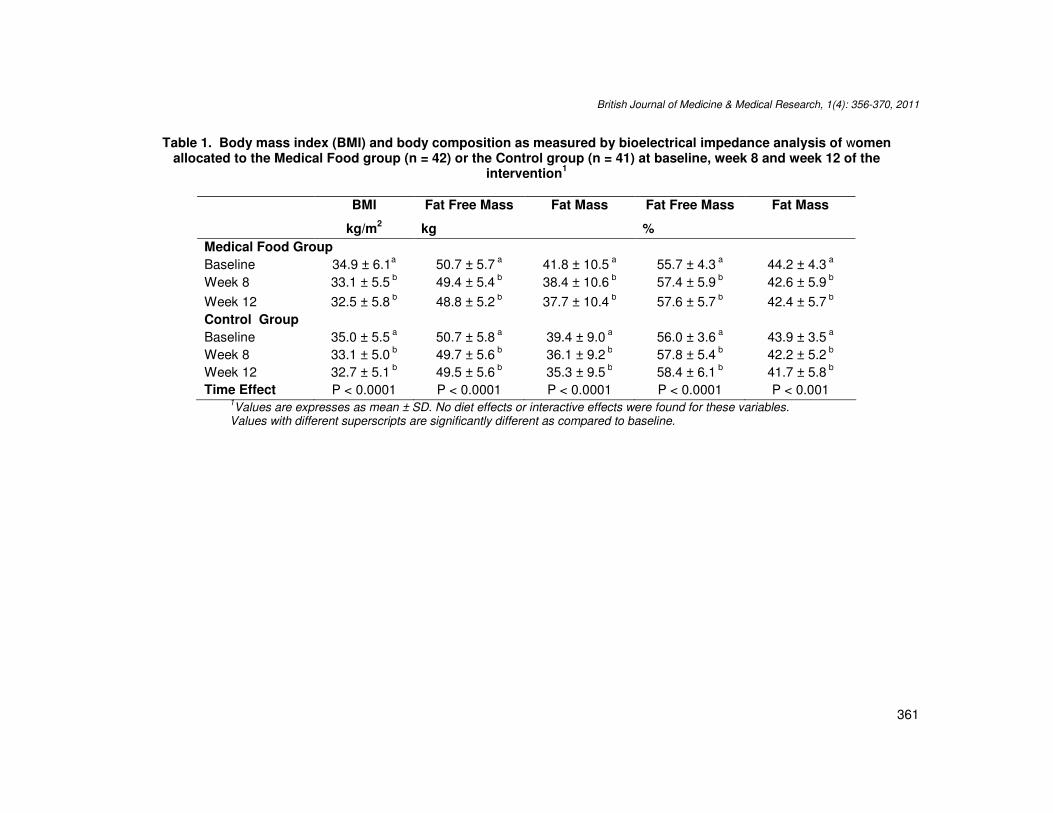
3. RESULTS 3.1 BMI and Body Composition Participants in both groups had significant decreases in BMI from baseline to the end of the 12-week intervention (p < 0.0001, Table 1), but no differences were observed between the groups. Examination of BIA measurements revealed that fat mass, in kg and as a percentage of total body weight, decreased significantly over time (p < 0.0001 Table 1), regardless of group categorization. Likewise, fat free mass in kg decreased in both groups (p < 0.0001) while percent of fat free mass increased also for both groups (p < 0.001, Table 1), with no differences noted between groups.
British Journal of Medicine & Medical Research, 1(4): 356-370, 2011
361
Table 1. Body mass index (BMI) and body composition as measured by bioelectrical impedance analysis of women allocated to the Medical Food group (n = 42) or the Control group (n = 41) at baseline, week 8 and week 12 of the
intervention1
BMI Fat Free Mass Fat Mass Fat Free Mass Fat Mass
kg/m2 kg %
Medical Food Group
Baseline 34.9 ± 6.1a 50.7 ± 5.7
a 41.8 ± 10.5
a 55.7 ± 4.3
a 44.2 ± 4.3
a
Week 8 33.1 ± 5.5 b 49.4 ± 5.4
b 38.4 ± 10.6
b 57.4 ± 5.9
b 42.6 ± 5.9
b
Week 12 32.5 ± 5.8 b 48.8 ± 5.2
b 37.7 ± 10.4
b 57.6 ± 5.7
b 42.4 ± 5.7
b
Control Group
Baseline 35.0 ± 5.5 a 50.7 ± 5.8
a 39.4 ± 9.0
a 56.0 ± 3.6
a 43.9 ± 3.5
a
Week 8 33.1 ± 5.0 b 49.7 ± 5.6
b 36.1 ± 9.2
b 57.8 ± 5.4
b 42.2 ± 5.2
b
Week 12 32.7 ± 5.1 b 49.5 ± 5.6
b 35.3 ± 9.5
b 58.4 ± 6.1
b 41.7 ± 5.8
b
Time Effect P < 0.0001 P < 0.0001 P < 0.0001 P < 0.0001 P < 0.001 1Values are expresses as mean ± SD. No diet effects or interactive effects were found for these variables.
Values with different superscripts are significantly different as compared to baseline.

Fig. 1. Percent Body Fat (A) and Percent Trunk Fat (B) calculated by DEXA at baseline week 8 and week 12 for women
allocated to Medical
British Journal of Medicine & Medical Research
Percent Body Fat (A) and Percent Trunk Fat (B) calculated by DEXA at baseline week 8 and week 12 for women allocated to Medical Food (n = 18) or Control (n = 17). ** p < 0.0001.
British Journal of Medicine & Medical Research, 1(4): 356-370, 2011
362
Percent Body Fat (A) and Percent Trunk Fat (B) calculated by DEXA at baseline week 8 and week 12 for women
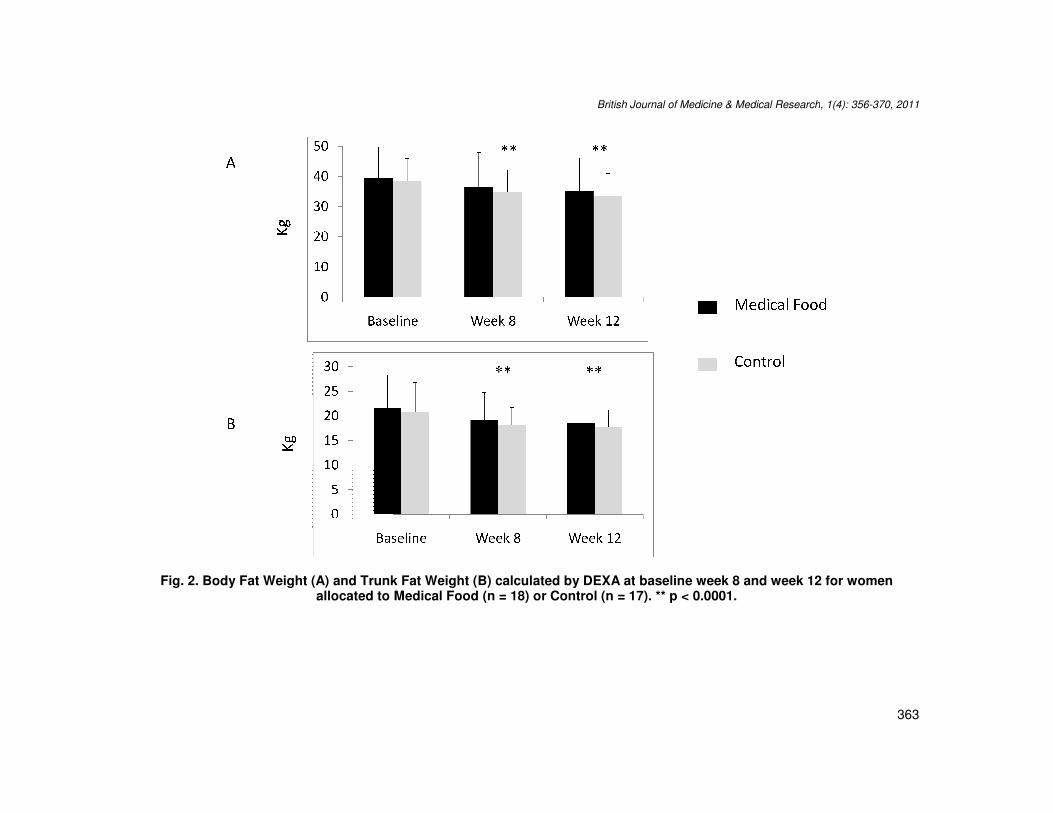
Fig. 2. Body Fat Weight (A) and Trunk Fat Weight (B) calculated by DEXA at baseline week 8 and week 12 for women allocated to Medical Food (n = 18) or Control (n = 17). ** p <
British Journal of Medicine & Medical Research
Body Fat Weight (A) and Trunk Fat Weight (B) calculated by DEXA at baseline week 8 and week 12 for women
allocated to Medical Food (n = 18) or Control (n = 17). ** p < 0.0001.
British Journal of Medicine & Medical Research, 1(4): 356-370, 2011
363
Body Fat Weight (A) and Trunk Fat Weight (B) calculated by DEXA at baseline week 8 and week 12 for women

British Journal of Medicine & Medical Research, 1(4): 356-370, 2011
364
The University of Connecticut and the University of California, Irvine, had access to DEXA, which allowed measurements of body fat and trunk fat for a subset of subjects (MF: n = 18, control: n = 17). Percent body fat and percent trunk fat decreased in both groups, with no differences between groups (p < 0.0001; A and B, respectively, Figure 1). Similarly, there were no differences between groups in relation to the significant reductions observed in kg of body fat and trunk fat (p < 0.0001, A and B, respectively, Figure 2).
3.2 Insulin and Insulin Resistance Plasma insulin levels decreased in both groups over the course of the 12-week intervention, independent of group allocation (p < 0.0001, Table 2). HOMA scores were utilized to assess insulin resistance, and both groups displayed reductions in this variable (p < 0.0001, Table 2), with no between-group differences noted.
Table 2. Changes in insulin and insulin resistance as measured by HOMA ofwomen allocated to the Medical Food group (n = 42) or the Control group (n = 41) at baseline,
week 8 and week 12 of the Intervention1
Insulin HOMA*
µIU/mL
Medical Food Group
Baseline 16.9 ± 9.4a 4.25 ± 2.93
a
Week 8 12.3 ± 6.0 b 3.01 ± 1.57
b
Week 12 12.6 ± 7.6 b 2.99 ± 1.91
b
Control Group
Baseline 16.6 ± 9.4 a 4.12 ± 2.40
a
Week 8 11.8 ± 5.4 b 2.84 ± 1.30
b
Week 12 12.2 ± 5.7 b 3.01 ± 1.58
b
Time Effect P < 0.0001 P < 0.0001 1Values are expresses as mean ± SD. No diet effects were found for these variables.
Values with different superscripts are significantly different as compared to baseline.
3.3 Adipokines and Inflammatory Markers Plasma adiponectin levels did not change significantly in either group over time (Table 3). However, changes were observed in plasma levels of leptin (p < 0.0001, Table 3), although the changes were not significantly different between groups. While plasma levels of IL-6 did not change significantly in either group (Table 3), there were differences observed over time for plasma TNF-α (p < 0.0001, Table 3); however, these were not different between groups at the end of the intervention. sICAM-1 decreased in the MF group over time (p < 0.001, Table 3), while levels in the control group were not different from baseline in either week 8 or 12 (Table 3). No significant changes in sVCAM-1 were measured for either group (Table 3).

British Journal of Medicine & Medical Research, 1(4): 356-370, 2011
365
Table 3. Changes in adiponectin, tumor necrosis factor (TNF)-α, interleukin-6 (IL-6), soluble intercelluar adhesion molecule-1 (ICAM)-1 and soluble vascular cell adhesion molecule (VCAM)-1 of women allocated to the Medical Food group (n = 42) or
the Control group (n = 41) at baseline, week 8 and week 12 of the intervention1
Adiponectin Leptin TNF-α IL-6 sICAM-1 sVCAM-1
mg/L
Medical Food Group
Baseline 15.2 ± 7.9a 51.0 ± 30.1
a 4.6 ± 2.0
a 5.1 ± 3.4
a 112 ± 55
a 1.3 ± 3.4
a
Week 8 15.7 ± 6.8 a 36.5 ± 21.8
b 4.3 ± 1.6
b 4.8 ± 3.2
a 96 ± 40
b 1.2 ± 2.9
a
Week 12 15.0 ± 10.7 a 34.2 ± 23.0
b 4.2 ± 1.8
b 4.7 ± 3.7
a 96 ± 37
b 1.2 ± 2.7
a
Control Group
Baseline 14.2 ± 6.8 a 55.5 ± 27.5
a 5.4 ± 2.4
a 4.3 ± 2.5
a 105 ± 29
a 1.2 ± 2.6
a
Week 8 13.8 ± 6.0 a 41.7 ± 25.8
b 5.1 ± 2.1
ab 4.0 ± 2.1
a 99 ± 32
ab 1.2 ± 3.0
a
Week 12 14.8 ± 6.3 a 40.4 ± 25.7
b 4.3 ± 1.7
b 3.9 ± 2.4
a 103 ± 49
a 1.2 ± 3.3
a
Time Effect NS P < 0.0001 P < 0.0001 NS P < 0.001 NS
Diet Effect NS NS NS NS P < 0.05 NS 1Values are expresses as mean ± SD. Values with different superscripts are significantly different as compared to baseline.

British Journal of Medicine & Medical Research, 1(4): 356-370, 2011
366
4. DISCUSSION A consensus has not been reached regarding the best dietary pattern to alleviate characteristics of MetS, but the Mediterranean-style pattern has received ample attention and is considered an effective option (Djoussé, Padilla et al., 2010). The aim of the current study was to evaluate the impact of a Mediterranean-style, low-glycemic-load diet on body composition, insulin resistance and inflammation, in a population of women with MetS and elevated LDL-C. Another objective was to determine if a phytosterol-rich MF provided any additional benefits to these parameters. Following the 12- week intervention, both groups showed improvements in body composition, insulin resistance and inflammatory profiles. Generally, a positive correlation exists between BMI, adiposity and risk for T2D and CVD; therefore, BMI is typically considered a suitable tool to define adult obesity (BMI > 30 kg/m
2)
and pinpoint individuals that may be at risk of obesity-related morbidity and mortality (2003; Westphal 2008). BMI is often used as a surrogate marker of overall obesity, while WC is used to assess central obesity. Both of these measurements are easily obtainable indirect measurements of obesity (Koopman, Swofford et al., 2009). WC and BMI are strongly correlated, and elevated WC alone is a strong predictor of mortality and risk for chronic disease development (Phillips and Prins, 2008; Achike, To et al., 2011). Measurements of WC are better indicators of body fat distribution, and it is not total body fat, or subcutaneous fat, but rather, excess intra-abdominal fat that is highly associated with metabolic abnormalities in overweight and obese individuals (Bjorntorp, 1991; Nielsen and Jensen, 1997; Després, 2006). We previously reported significant reductions in weight and WC for the participants of this study ( Jones, Fernandez et al., 2011), and here we show that BMI was significantly reduced in both groups post-intervention. While BMI is a standard indirect measure of overweight and obesity, it does not distinguish between fat mass and fat free mass, nor does it describe body fat distribution (Boardley and Pobocik, 2009). In order to provide a more comprehensive account of changes in body composition over the course of the intervention, BIA and DEXA measurements were utilized. Results from the BIA showed that all participants had significant reductions in absolute (kg) and relative (%) amounts of fat mass while percent free fat mass increased after the intervention. Results from DEXA assessment revealed significant decreases in body fat and trunk fat, on a percentage and weight basis. While the decreases in fat mass are desirable, those observed in fat free mass (specifically lean mass) are less so, but it is acknowledged that body weight decreased and percent lean increased over time. Abdominal obesity has been considered a dominant cause of MetS (Després, 2006); therefore, the specific losses in trunk fat may decrease cardiometabolic risk (Katsoulis, Blaudeau et al., 2009). Weight loss, and especially abdominal fat loss, has been associated with improvements in insulin resistance (Weiss, 2007; Bellar, Jarosz, et al., 2008; Aasen, Fagertun et al., 2010). In a previous study of similar design to the current one, supplementation with a MF and identical phytochemical-combination increased insulin sensitivity (Lerman, Minich et al., 2008), it was the expectation that the same observation would be made following this intervention. While we did measure significant reductions in insulin, and improvements in HOMA-IR scores, the changes were not statistically different between groups. Insulin resistance is associated with CVD (Ferrannini, Balkau et al., 2007), and if ignored, can progress to T2D (Phillips and Prins, 2008). In conjunction with improvements in insulin resistance, we expected to observe increases in plasma adiponectin, which has insulin-sensitizing and anti-inflammatory properties (Matsuzawa, 2010). However, we did not obtain any significant changes in adiponectin levels for either group. Polak and Shin also reported
British Journal of Medicine & Medical Research, 1(4): 356-370, 2011
367
no changes in adiponectin levels, despite weight loss in women (Shin, Yoen Kim, et al., 2006; Polak, Kovacova et al., 2008). This suggests that other weight loss-associated factors, in organs other than adipose, may account for the improved insulin variables. Despite the lack of weight-loss induced change on adiponectin, leptin levels did decrease significantly in both groups over time. Leptin, an adipokine responsible for increasing energy expenditure and suppressing food intake (Matsuzawa, 2005), tends to be elevated in obese individuals, indicative of leptin resistance (Gade, Schmit et al., 2010; Münzberg, 2010). Therefore, the decreases observed may suggest improved sensitivity to leptin. The significant decreases observed in trunk fat may also contribute to the reductions in plasma levels of TNF-α. In an obese state, adipocyptes can overproduce cytokines such as TNF-α and IL-6 (Jensen, 2006). These molecules in turn recruit monocytes to the adipose tissue and facilitate their differentiation to active macrophages, which can produce more pro-inflammatory molecules, intensifying the systemic metabolic dysfunction associated with obesity (Ouchi, Parker et al., 2011; Vykoukal and Davies, 2011). We did not observe substantial changes in IL-6, but the reductions in TNF-α are indicative of a less inflammatory profile. Another marker of inflammation, and more specifically of endothelial function, sICAM-1 was also reduced, but only in the MF group. ICAM-1 responds to inflammatory conditions and mediates the migration of leukocytes into tissues (Hubbard and Rothlein, 2000). There is a tendency for ICAM-1 to be elevated in obesity, and it has been positively correlated with central adiposity and insulin resistance (Straczkowski, Lewczuk et al., 2002; Leinonen, Hurt-Camejo et al., 2003). In agreement with the similar reductions we recorded in abdominal fat and insulin resistance for both groups, the decreases in sICAM-1 were expected regardless of group distribution. However, we only observed changes in the MF for this variable. VCAM-1, another marker of endothelial function was not significantly modified in either group following the intervention. We acknowledge the limitation of only utilizing DEXA, the gold-standard to assess body composition, for a subset of study participants. It may also have been beneficial to assess adiponectin levels using a more sensitive assay, such as an ELISA, but sample availability made this unfeasible.
5. CONCLUSIONS Overall, following the 12-week intervention, BMI decreased significantly in both groups, but not enough on average to remove participants from the obese category (BMI > 30 kg/m
2).
However, direct analysis of body composition, with BIA and DEXA, revealed significant decreases in abdominal fat mass. These data, in combination with the previously reported WC information (Jones, Fernandez et al., 2011), substantiate the possible benefits of a Mediterranean-style dietary pattern for obesity treatment, and more specifically for visceral adipose reduction. Furthermore, insulin resistance and leptin sensitivity were improved in all participants. The MF appeared to improve endothelial function, as evidenced by the reductions in sICAM-1, which were not observed in the control group. In total, adherence to a low-glycemic-load, Mediterranean-style diet appears to positively influence body composition and insulin resistance in women with MetS and elevated LDL-C.
ACKNOWLEDGEMENT
This study was supported by Metagenics, Inc, Gig Harbor, WA.
British Journal of Medicine & Medical Research, 1(4): 356-370, 2011
368
REFERENCES (2002). Evaluation, and Treatment of High Blood Cholesterol In Adults (Adult Treatment
Panel III) Nal Report Circulation, 106, 3143-3421. (2003). Screening for Obesity in Adults: Recommendations and Rationale. Annals Int. Med.,
139, 930-932. Aasen, G., et al. (2010). Effect of regional fat loss assessed by DXA on insulin resistance
and dyslipidaemia in obese women. Scand. J. Clin. Lab Invest., 70, 229-236. Achike, F.I., et al. (2011). Obesity, metabolic syndrome, adipocytes and vascular function: A
holistic viewpoint. Clin. Exp. Pharmacol. Physiol., 38, 1-10. Alberti, K.G., et al. (2009). Harmonizing the metabolic syndrome: a joint interim statement of
the International Diabetes Federation Task Force on Epidemiology and Prevention; National Heart, Lung, and Blood Institute; American Heart Association; World Heart Federation; International Atherosclerosis Society; and International Association for the Study of Obesity. Circulation, 120, 1640-1645.
Babio, N., et al. (2009). Mediterranean diet and metabolic syndrome: The evidence. Public Health Nutrition, 12, 1607-1617.
Balisteri, C.R. (2010). The role of adipose tissue and adipokines in obesity-related inflammatory diseases. Mediators of Inflamm., 2010, 2010:802078.
Baxter, A.J., et al. (2006). Dietary patterns and metabolic syndrome--a review of epidemiologic evidence. Asia Pac J Clin. Nutr., 15,134-142.
Bellar, A., et al. (2008). Implications of the biology of weight regulation and obesity on the treatment of obesity. J. Am Acad Nurse Pract., 20, 128-135.
Bjorntorp, P. (1991). Metabolic implications of body fat distribution. Diabetes Care, 14, 1132-1143.
Boardley, D., Pobocik, R.S. (2009). Obesity on the Rise. Primary Care - Clinics Off Pract., 36, 243-255.
Després, J.P. (2006). Abdominal obesity: The most prevalent cause of the metabolic syndrome and related cardiometabolic risk. European Heart J., Supplement 8(B), B4-B12.
Després, J.P. (2006). Is visceral obesity the cause of the metabolic syndrome? Annals Med., 38, 52-63.
Després, J.P. (2008). Abdominal Obesity and the Metabolic Syndrome: Contribution to global cardiometabolic risk. Arterioscler. Thromb. Vasc. Biol., 28, 1039-1049.
Djoussé, L., et al. (2010). Diet and metabolic syndrome. Endocrine, Metabolic and Immune Disorders - Drug Targets, 10, 124-137.
Ervin, R.B. (2009). Prevalence of metabolic syndrome among adults 20 years of age and over, by sex, age, race and ethnicity, and body mass index: United States, 2003-2006. National health statistics reports, 5, 1-7.
Ferrannini, E., et al. (2007). Insulin resistance, insulin response, and obesity as indicators of metabolic risk. Journal of Clinical Endocrinology and Metabolism, 92, 2885-2892.
Gade, W., et al. (2010). Beyond obesity: the diagnosis and pathophysiology of metabolic syndrome." Clinical laboratory science : journal of the American Society for Medical Technology, 23, 51-61; quiz 62-65.
Gallagher, E.J., et al. (2010). Insulin resistance in obesity as the underlying cause for the metabolic syndrome. Mount Sinai Journal of Medicine, 77, 511-523.
Gnacińska, M., et al. (2009). Role of adipokines in complications related to obesity. A review. Advances in Medical Sciences, 54, 150-157.
Han, T. S., Lean, M.E. J. (2011). Metabolic syndrome. Medicine, 39, 24-31. Huang, P.L. (2009). A comprehensive definition for metabolic syndrome. DMM Disease
Models and Mechanisms, 2, 231-237.

British Journal of Medicine & Medical Research, 1(4): 356-370, 2011
369
Hubbard, A.K., Rothlein R. (2000). Intercellular adhesion molecule-1 (ICAM-1) expression and cell signaling cascades. Free Radical Biology and Medicine, 28, 1379-1386.
Jensen, M.D. (2006). Adipose tissue as an endocrine organ: Implications of its distribution on free fatty acid metabolism. European Heart J. Supplement, 8, B13-B19.
Jones J.L., et al. (2011). A Mediterranean-style low-glycemic-load diet improves variables of metabolic syndrome in women, and addition of a phytochemical-rich medical food enhances benefits on lipoprotein metabolism. J Clin Lipidol., 5, 188-196.
Kastorini, C.M., et al. (2011). The effect of mediterranean diet on metabolic syndrome and its components: A meta-analysis of 50 studies and 534,906 individuals. Journal of the American College of Cardiology, 57, 1299-1313.
Katsoulis, K., et al. (2009). Diet-induced changes in intra-abdominal adipose tissue and CVD risk in american women. Obesity, 17, 2169-2175.
Kewalramani, G., et al. (2010). Muscle insulin resistance: Assault by lipids, cytokines and local macrophages. Current Opinion Clin Nutr. Metab. Care, 13, 382-390.
Koopman, R.J., et al. (2009). "Obesity and Metabolic Disease. Primary Care - Clini Off Pract., 36, 257-270.
Lago, F., et al. (2007). Adipokines as emerging mediators of immune response and inflammation. Nature Clin Pract Rheumatol., 3, 716-724.
Lago, F., et al. (2009). Adipokines as novel modulators of lipid metabolism. Trends Biochem Sci., 34, 500-510.
Lann, D. et al. (2008). "Insulin resistance and the metabolic syndrome. Minerva Med., 99, 253-262.
Leinonen, E. et al. (2003). Insulin resistance and adiposity correlate with acute-phase reaction and soluble cell adhesion molecules in type 2 diabetes. Atherosclerosis, 166, 387-394.
Lerman, R.H., et al. (2008). Enhancement of a modified Mediterranean-style, low glycemic load diet with specific phytochemicals improves cardiometabolic risk factors in subjects with metabolic syndrome and hypercholesterolemia in a randomized trial. Nutr Metab (Lond), 5, 29.
Lyon, C.J., et al. (2003). Minireview: adiposity, inflammation, and atherogenesis. Endocrinol., 144, 2195-2200.
Maheshwari, A., Thuluvath, P.J. (2011). Endocrine diseases and the liver. Clini. Liver Dis., 15, 55-67.
Matsuzawa, Y. (2005). White adipose tissue and cardiovascular disease. Best Pract Res Clinical Endocrinolo Metabol., 19, 637-647.
Matsuzawa, Y. (2010). Adiponectin: A key player in obesity related disorders. Curr Pharmaceut Des., 16, 1896-1901.
Maury, E., Brichard, S.M. (2010). Adipokine dysregulation, adipose tissue inflammation and metabolic syndrome. Molec Cell Endocrinol., 314, 1-16.
Muniyappa, R., et al. (2008). Current approaches for assessing insulin sensitivity and resistance in vivo: Advantages, limitations, and appropriate usage. Am J Physiol- Endocrinol Metabol., 294, E15-E26.
Münzberg, H. (2010). Leptin-signaling pathways and leptin resistance. Forum of Nutrition, 63, 123-132.
Nielsen, S., Jensen, M.D. (1997). Obesity and cardiovascular disease: Is body structure a factor? Current Opinion Lipidol., 8, 200-204.
Ouchi, N., et al. (2011). Adipokines in inflammation and metabolic disease. Nature Rev Immunol., 11, 85-97.
Phillips, L.K., Prins, J.B. (2008). The link between abdominal obesity and the metabolic syndrome. Current Hypertension Rep., 10, 156-164.

British Journal of Medicine & Medical Research, 1(4): 356-370, 2011
370
Polak, J., et al. (2008). Total adiponectin and adiponectin multimeric complexes in relation to weight loss-induced improvements in insulin sensitivity in obese women: The NUGENOB study. Eur J Endocrinol., 158, 533-541.
Reddy, K.J., et al. (2010). The role of insulin resistance in the pathogenesis of atherosclerotic cardiovascular disease: An updated review. J. Cardiovasc. Med., 11, 633-647.
Ryo, M., et al. (2004). Adiponectin as a biomarker of the metabolic syndrome. Circulation J., 68, 975-981.
Schiltz, B., et al. (2009). A Science-Based, Clinically Tested Dietary Approach for the Metabolic Syndrome. Metabol Synd Rel Dis., 7, 187-192.
Shin, M.J., et al. (2006). Modest weight loss does not increase plasma adiponectin levels: effects of weight loss on C-reactive protein and DNA damage. Nutr Res 26, 391-396.
Shoelson, S.E., et al. (2007). Obesity, Inflammation, and Insulin Resistance. Gastroenterology, 132, 2169-2180.
Sofi, F. (2009). The Mediterranean diet revisited: Evidence of its effectiveness grows. Current Opinion Cardiol., 24, 442-446.
Straczkowski, M., et al. (2002). Elevated soluble intercellular adhesion molecule-1 levels in obesity: Relationship to insulin resistance and tumor necrosis factor-α system activity. Metabolism Clin Exp., 51, 75-78.
Van Linthout, S., et al. (2010). Impact of HDL on adipose tissue metabolism and adiponectin expression. Atherosclerosis, 210, 438-444.
Vykoukal, D., Davies, M.G. (2011). Vascular biology of metabolic syndrome. J. Vasc. Surg.Epub ahead of print.
Weisberg, S.P., et al. (2003). Obesity is associated with macrophage accumulation in adipose tissue. J. Clin. Invest., 112, 1796-1808.
Weiss, R. (2007). Fat distribution and storage: How much, where, and how?" European J. Endocrinol., 157(SUPPL. 1), S39-S45.
Westphal, S.A. (2008). Obesity, Abdominal Obesity, and Insulin Resistance. Clinical Cornerstone 9, 23-31.
Wozniak, S.E., et al. (2009). Adipose tissue: The new endocrine organ? a review article. Digestive Dis. Sci., 54, 1847-1856..
_________________________________________________________________________ © 2011 Jones et al.; This is an Open Access article distributed under the terms of the Creative Commons Attribution License (http://creativecommons.org/licenses/by/3.0), which permits unrestricted use, distribution, and reproduction in any medium, provided the original work is properly cited.