pasta, glycemic index and health - world pasta day …€¦ · pasta, glycemic index and health ......
TRANSCRIPT
Pasta, Glycemic Index and Health
Dr. Cyril W.C. Kendall
Department of Nutritional Sciences, Faculty of Medicine,
University of Toronto;
Clinical Nutrition & Risk Factor Modification Center,
St. Michael’s Hospital;
Toronto, Ontario
Canada.
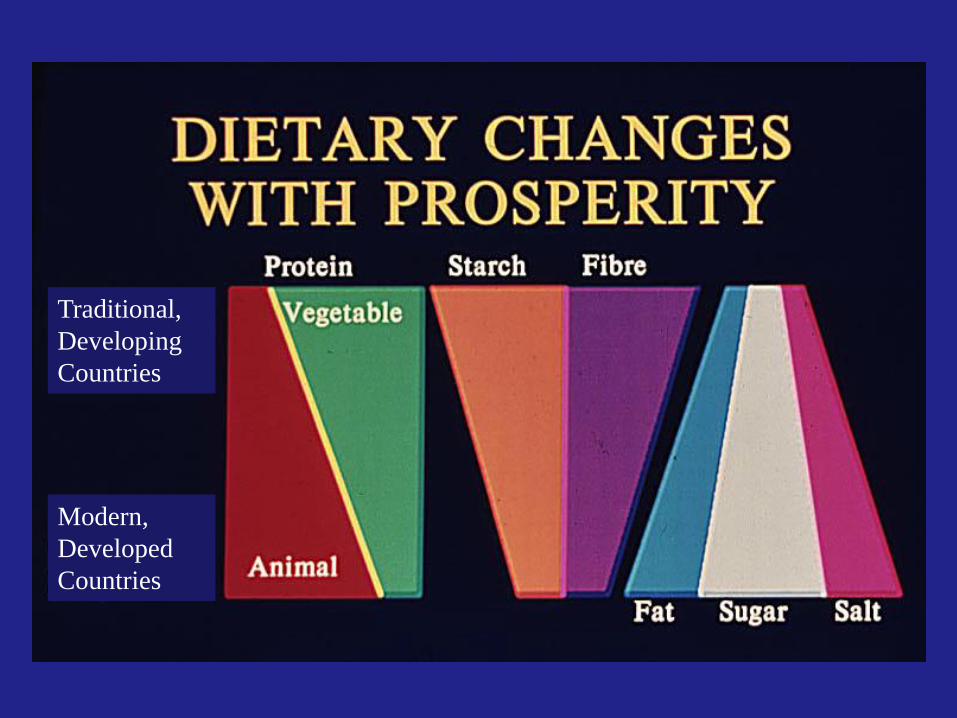
Traditional,
Developing
Countries
Modern,
Developed
Countries
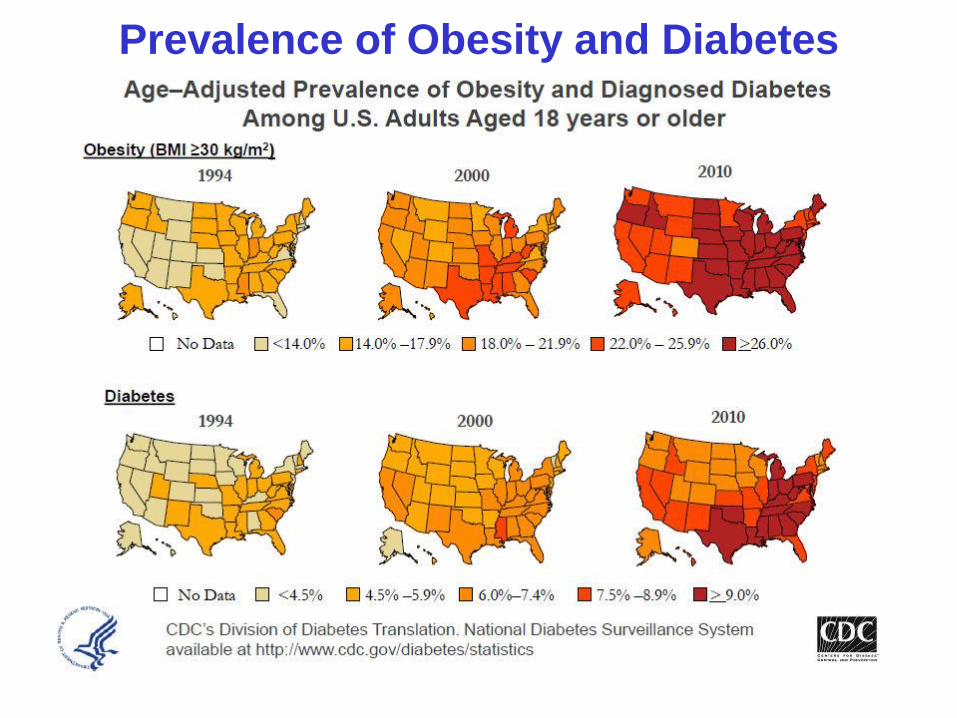
Prevalence of Obesity and Diabetes
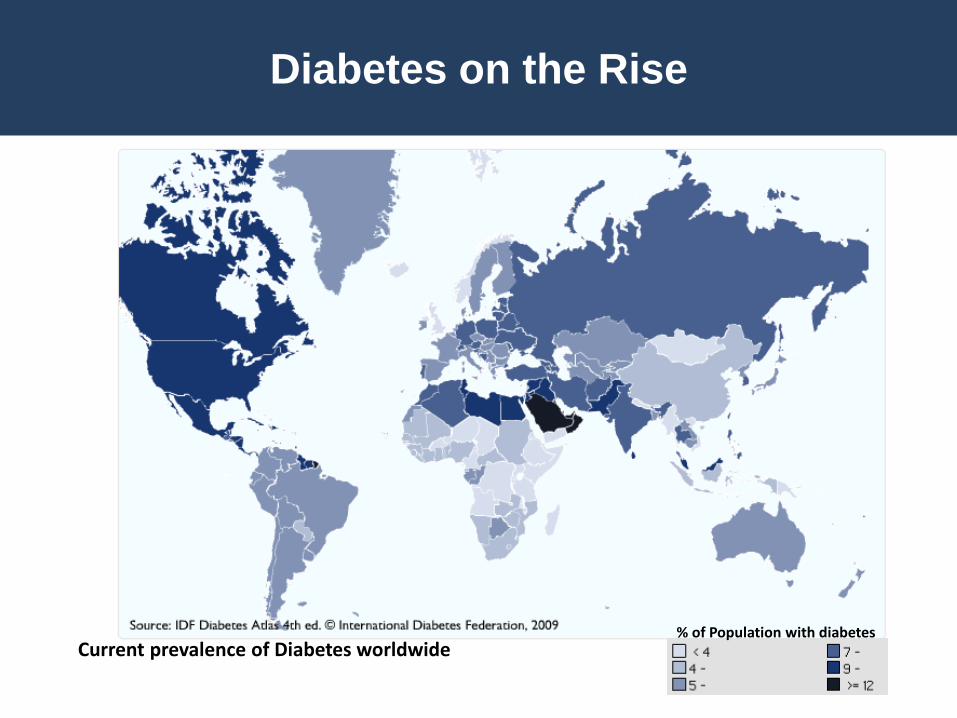
Diabetes on the Rise
Current prevalence of Diabetes worldwide% of Population with diabetes
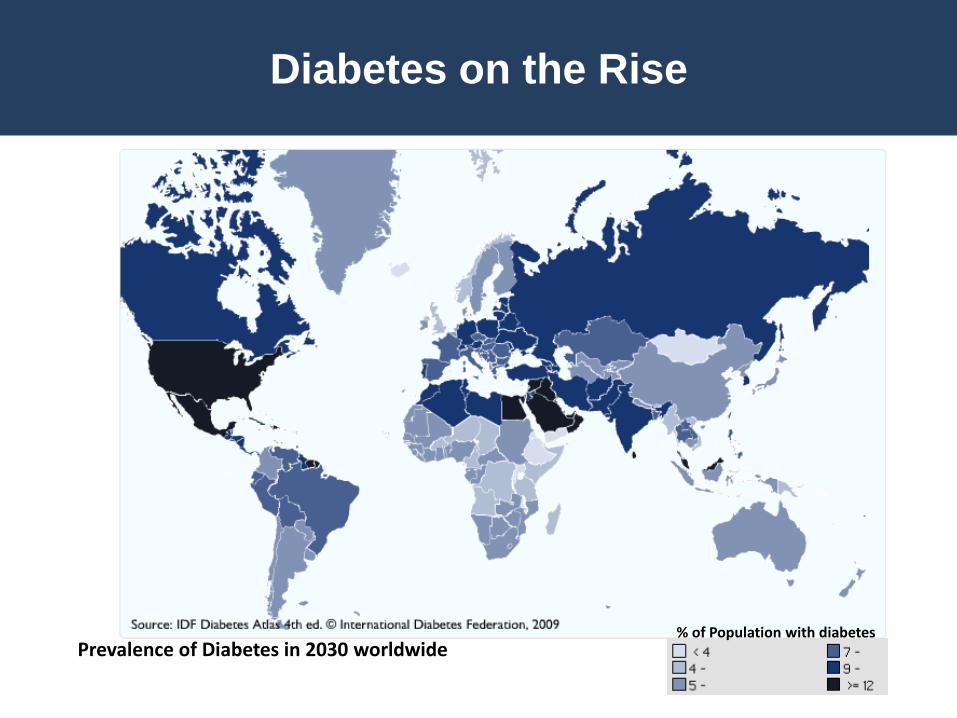
Diabetes on the Rise
% of Population with diabetesPrevalence of Diabetes in 2030 worldwide
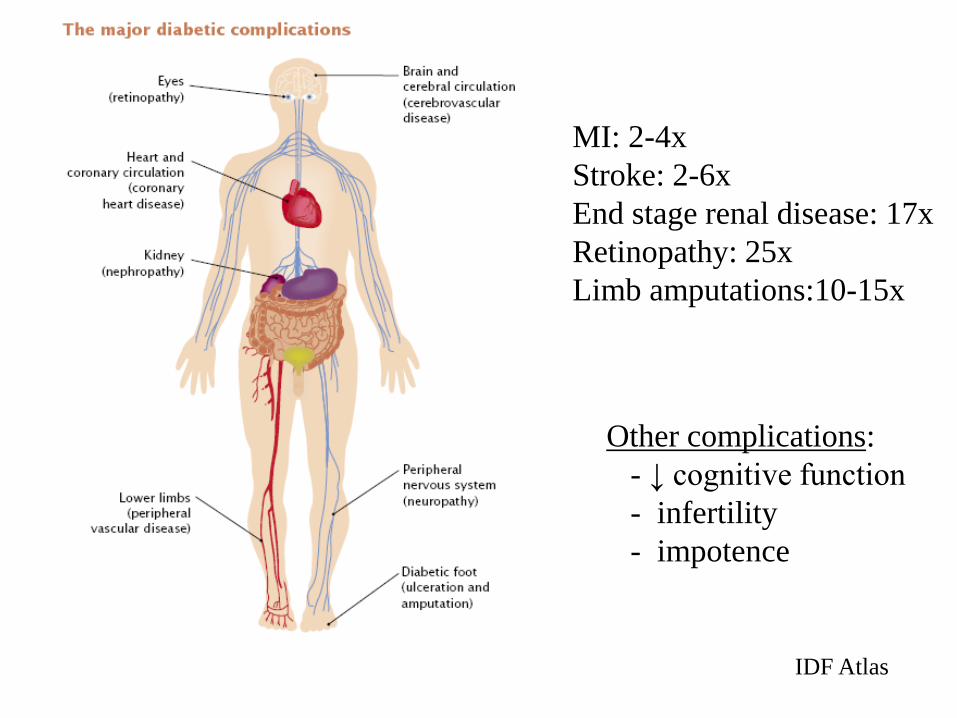
IDF Atlas
MI: 2-4x
Stroke: 2-6x
End stage renal disease: 17x
Retinopathy: 25x
Limb amputations:10-15x
Other complications:
- ↓ cognitive function
- infertility
- impotence
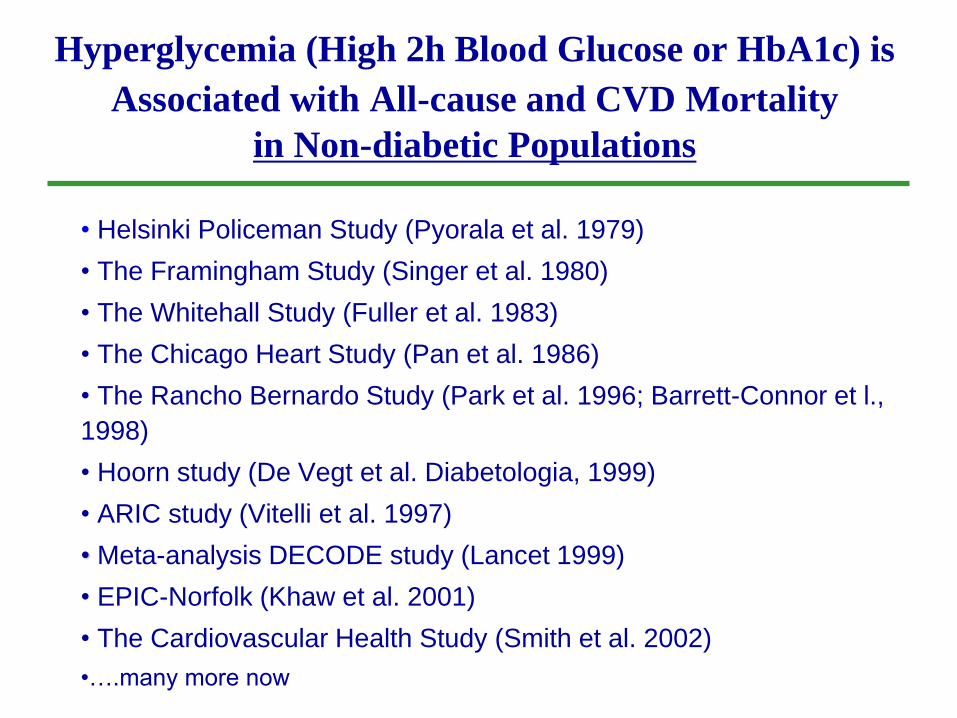
Hyperglycemia (High 2h Blood Glucose or HbA1c) is
Associated with All-cause and CVD Mortality
in Non-diabetic Populations
• Helsinki Policeman Study (Pyorala et al. 1979)
• The Framingham Study (Singer et al. 1980)
• The Whitehall Study (Fuller et al. 1983)
• The Chicago Heart Study (Pan et al. 1986)
• The Rancho Bernardo Study (Park et al. 1996; Barrett-Connor et l.,
1998)
• Hoorn study (De Vegt et al. Diabetologia, 1999)
• ARIC study (Vitelli et al. 1997)
• Meta-analysis DECODE study (Lancet 1999)
• EPIC-Norfolk (Khaw et al. 2001)
• The Cardiovascular Health Study (Smith et al. 2002)
•….many more now
↑Glucose/Insulin ↑Chronic Diseases
Dietary carbohydrates
are the main drivers
of blood glucose and
insulin responses
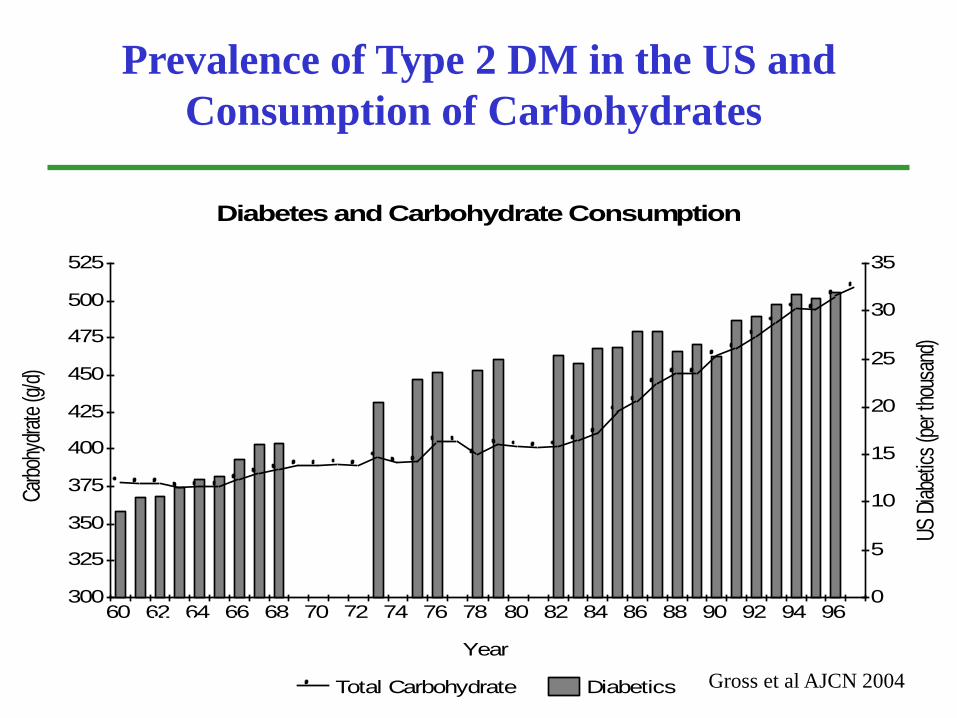
Increasing prevalence of Type 2 DM in the US with increasing
Consumption of Carbohydrates
Diabetes and Carbohydrate Consumption
300
325
350
375
400
425
450
475
500
525
0
5
10
15
20
25
30
35
60 62 64 66 68 70 72 74 76 78 80 82 84 86 88 90 92 94 96
Carb
ohyd
rate
(g/d
)
US D
iabe
tics
(per
thou
sand
)
Year
Total Carbohydrate Diabetics
Prevalence of Type 2 DM in the US and
Consumption of Carbohydrates
National Nutrient Databank Centers for Disease Control and Prevention
Gross et al AJCN 2004
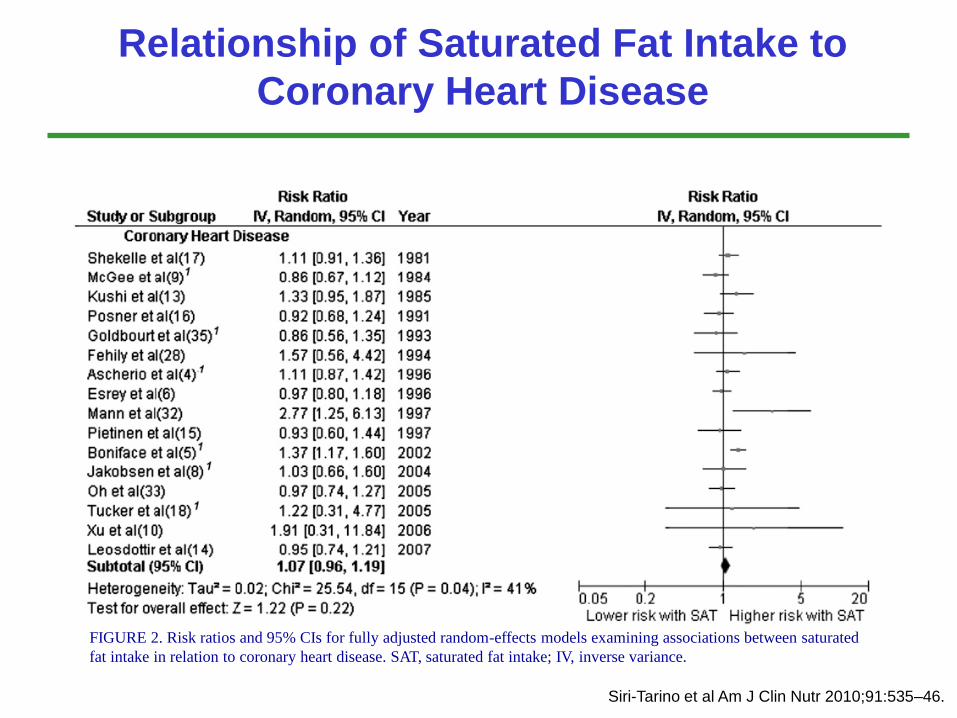
Relationship of Saturated Fat Intake to
Coronary Heart Disease
Siri-Tarino et al Am J Clin Nutr 2010;91:535–46.
FIGURE 2. Risk ratios and 95% CIs for fully adjusted random-effects models examining associations between saturated
fat intake in relation to coronary heart disease. SAT, saturated fat intake; IV, inverse variance.
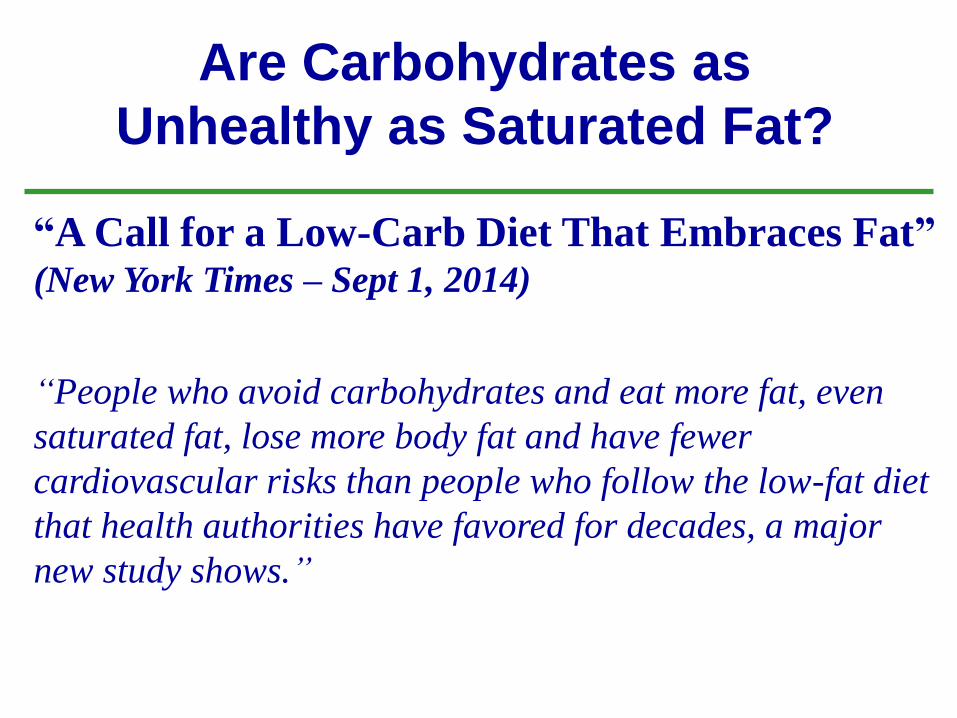
“A Call for a Low-Carb Diet That Embraces Fat”(New York Times – Sept 1, 2014)
“People who avoid carbohydrates and eat more fat, even
saturated fat, lose more body fat and have fewer
cardiovascular risks than people who follow the low-fat diet
that health authorities have favored for decades, a major
new study shows.”
Are Carbohydrates as
Unhealthy as Saturated Fat?
Carbohydrate Quality
Glycemic Index/ Load
Dietary Fiber
Whole Grains
Glycemic Index Background
• Classification of carbohydrate rich foods
based on their effect on blood glucose.
• Certain carbohydrates, by virtue of their
slow rate of digestibility and absorption,
may provide a strategy to prevent and
manage chronic diseases such as
diabetes and CHD.
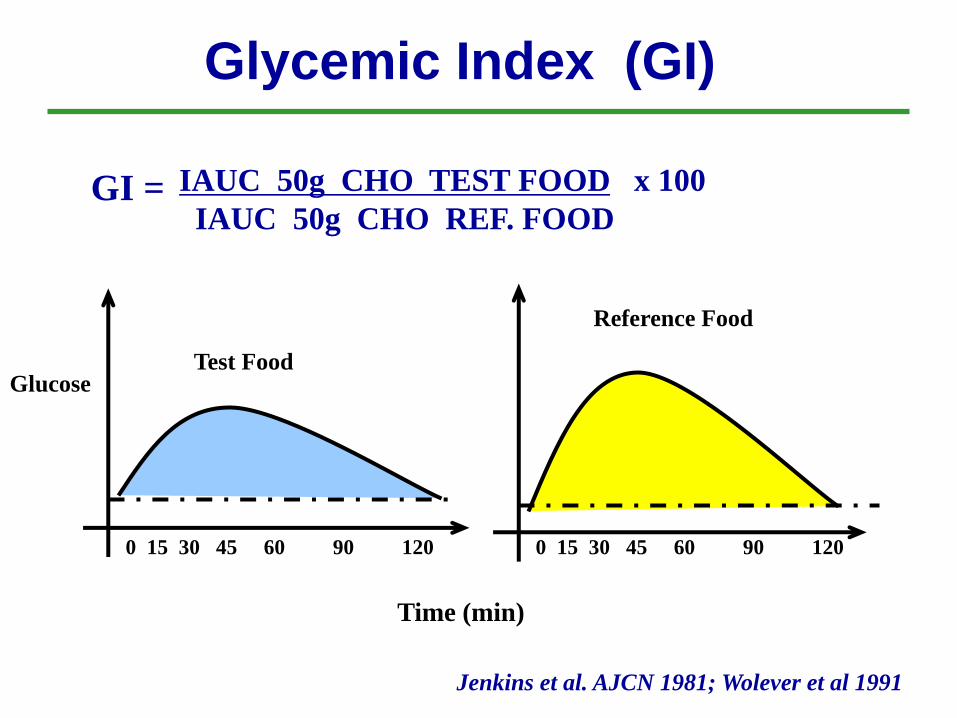
Test Food
Reference Food
IAUC 50g CHO TEST FOOD x 100
IAUC 50g CHO REF. FOOD
Glycemic Index (GI)
GI =
Time (min)
Glucose
0 15 30 45 60 90 120 0 15 30 45 60 90 120
Jenkins et al. AJCN 1981; Wolever et al 1991
Glycemic Load (GL)
GL(food) = GI(food) X amount CHO(serving)
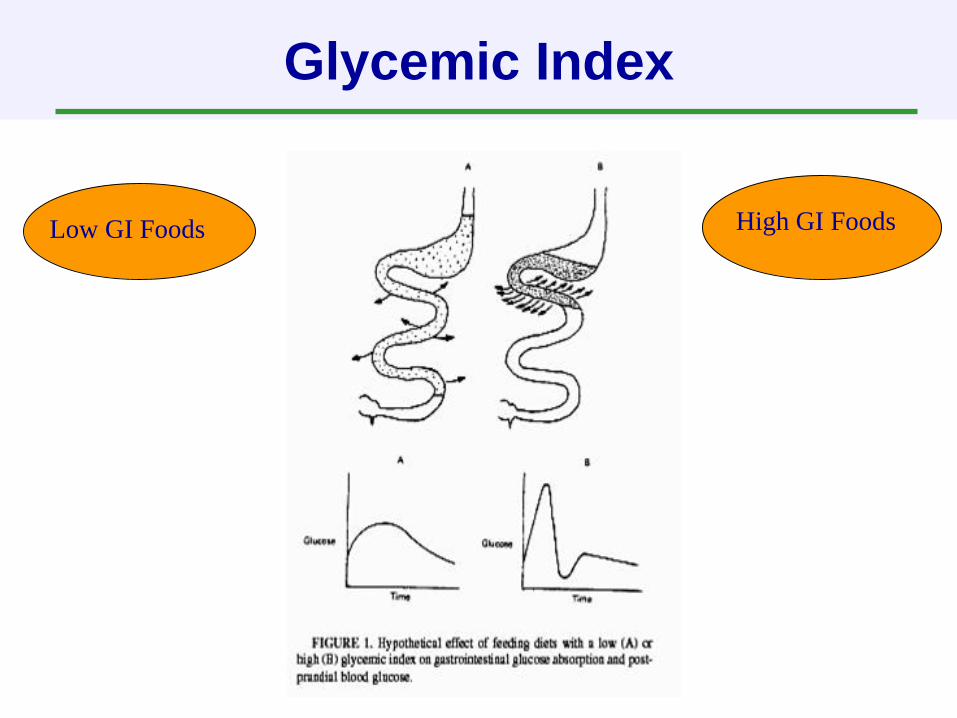
Glycemic Index
High GI FoodsLow GI Foods
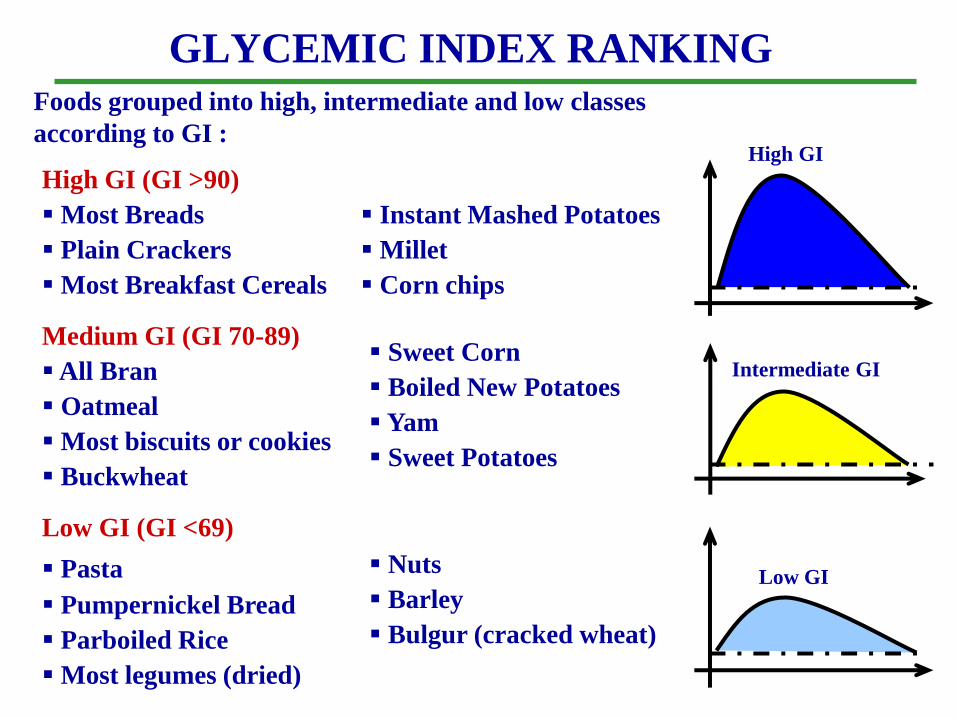
GLYCEMIC INDEX RANKING
Foods grouped into high, intermediate and low classes
according to GI :
High GI (GI >90)
Most Breads
Plain Crackers
Most Breakfast Cereals
Instant Mashed Potatoes
Millet
Corn chips
Medium GI (GI 70-89)
All Bran
Oatmeal
Most biscuits or cookies
Buckwheat
Sweet Corn
Boiled New Potatoes
Yam
Sweet Potatoes
Low GI (GI <69)
Pasta
Pumpernickel Bread
Parboiled Rice
Most legumes (dried)
Nuts
Barley
Bulgur (cracked wheat)
High GI
Intermediate GI
Low GI
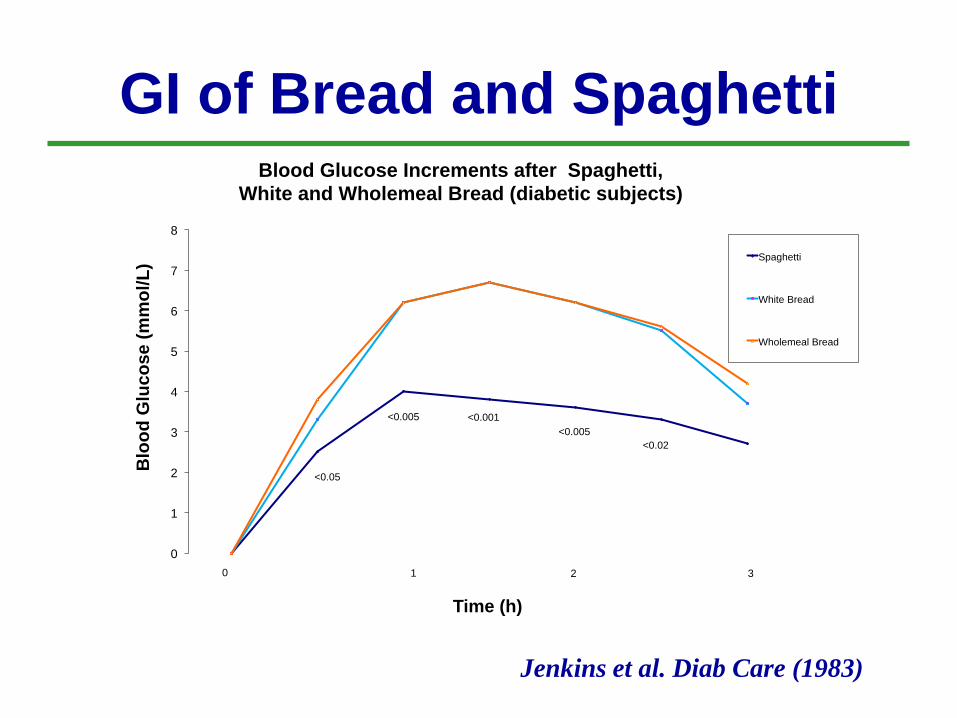
GI of Bread and Spaghetti
0
1
2
3
4
5
6
7
8
Blo
od
Glu
co
se
(m
mo
l/L
)
Time (h)
Blood Glucose Increments after Spaghetti,
White and Wholemeal Bread (diabetic subjects)
Spaghetti
White Bread
Wholemeal Bread
0 1 2 3
<0.05
<0.005 <0.001
<0.005
<0.02
Jenkins et al. Diab Care (1983)
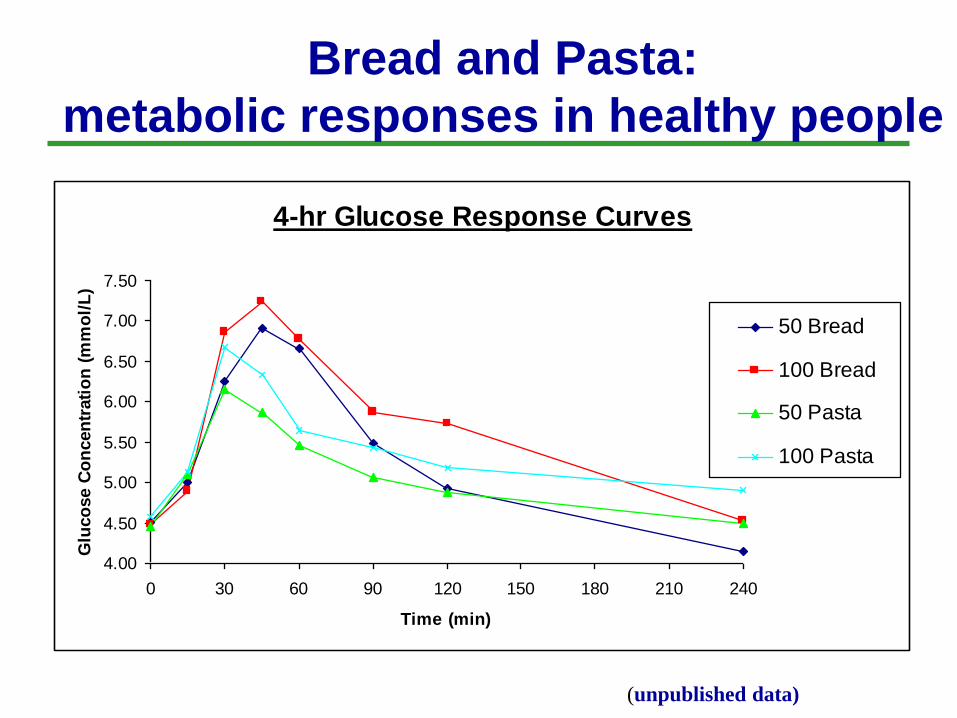
4-hr Glucose Response Curves
4.00
4.50
5.00
5.50
6.00
6.50
7.00
7.50
0 30 60 90 120 150 180 210 240
Time (min)
Glu
co
se C
on
cen
trati
on
(m
mo
l/L
)
50 Bread
100 Bread
50 Pasta
100 Pasta
Bread and Pasta:
metabolic responses in healthy people
(unpublished data)
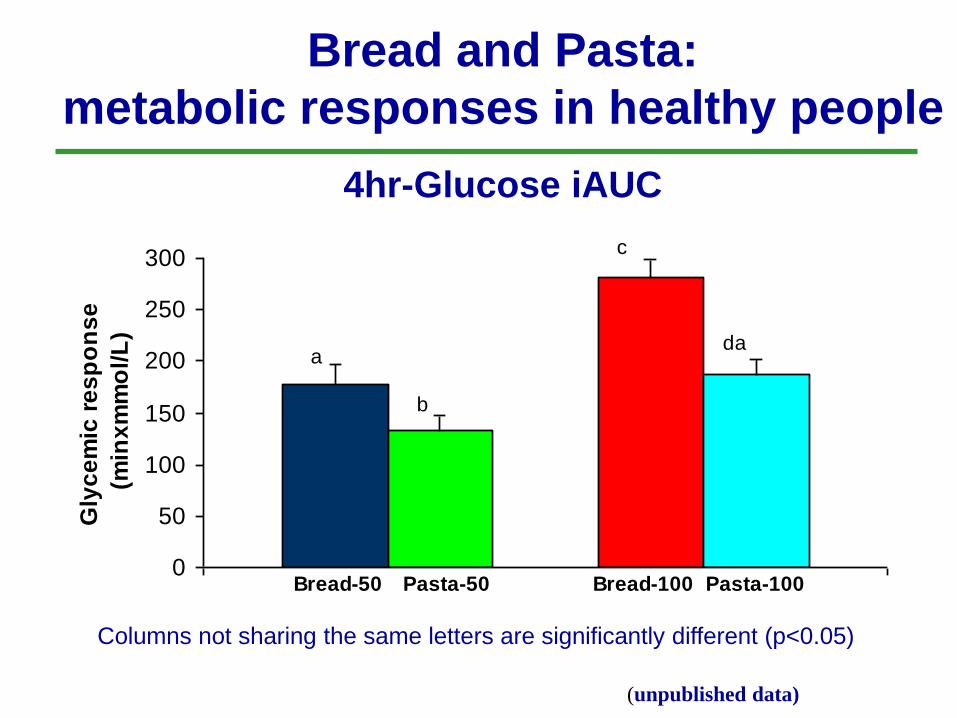
4hr-Glucose iAUC
0
50
100
150
200
250
300
Gly
ce
mic
re
sp
on
se
(min
xm
mo
l/L
)
a
b
c
da
Bread-50 Bread-100Pasta-50 Pasta-100
Columns not sharing the same letters are significantly different (p<0.05)
Bread and Pasta:
metabolic responses in healthy people
(unpublished data)
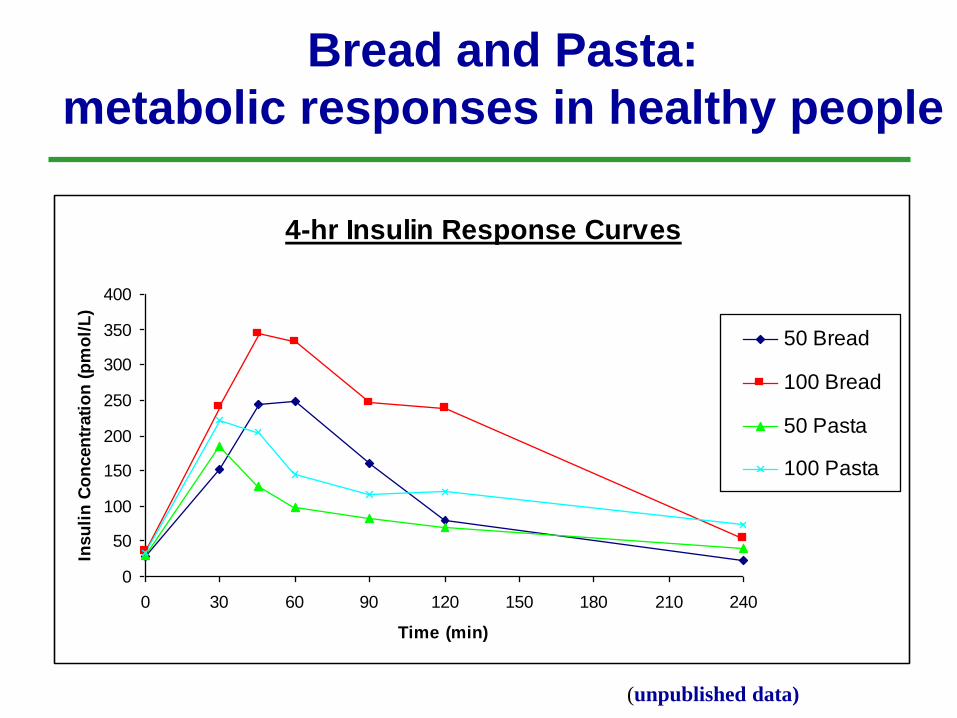
4-hr Insulin Response Curves
0
50
100
150
200
250
300
350
400
0 30 60 90 120 150 180 210 240
Time (min)
Insu
lin
Co
ncen
trati
on
(p
mo
l/L
)
50 Bread
100 Bread
50 Pasta
100 Pasta
Bread and Pasta:
metabolic responses in healthy people
(unpublished data)
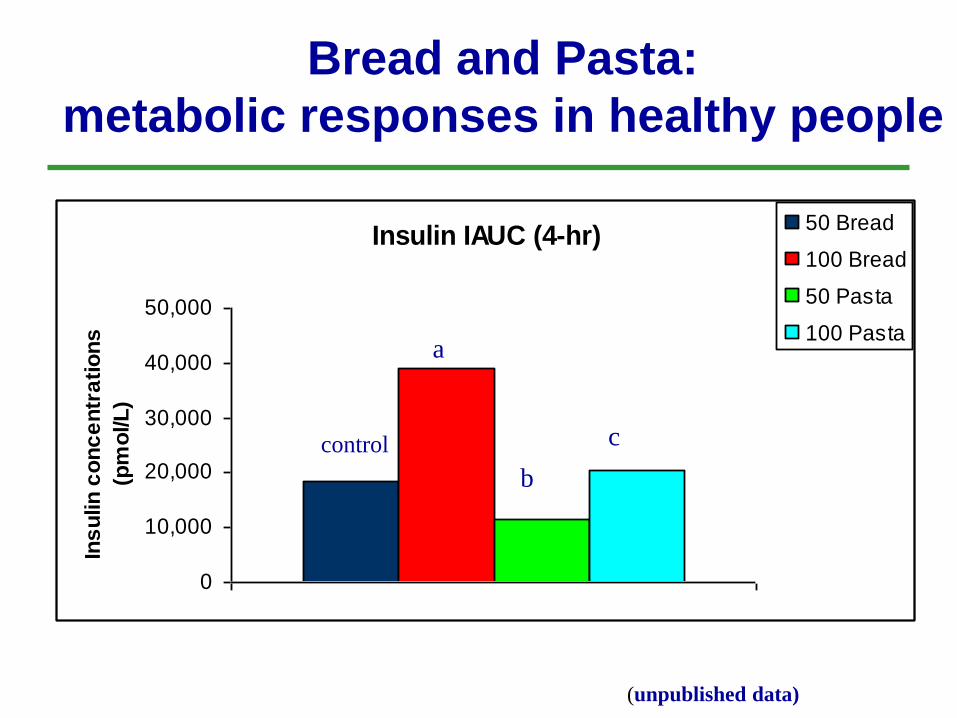
Insulin IAUC (4-hr)
0
10,000
20,000
30,000
40,000
50,000
Ins
ulin
co
nc
en
tra
tio
ns
(pm
ol/L
)
50 Bread
100 Bread
50 Pasta
100 Pastaa
b
ccontrol
Bread and Pasta:
metabolic responses in healthy people
(unpublished data)
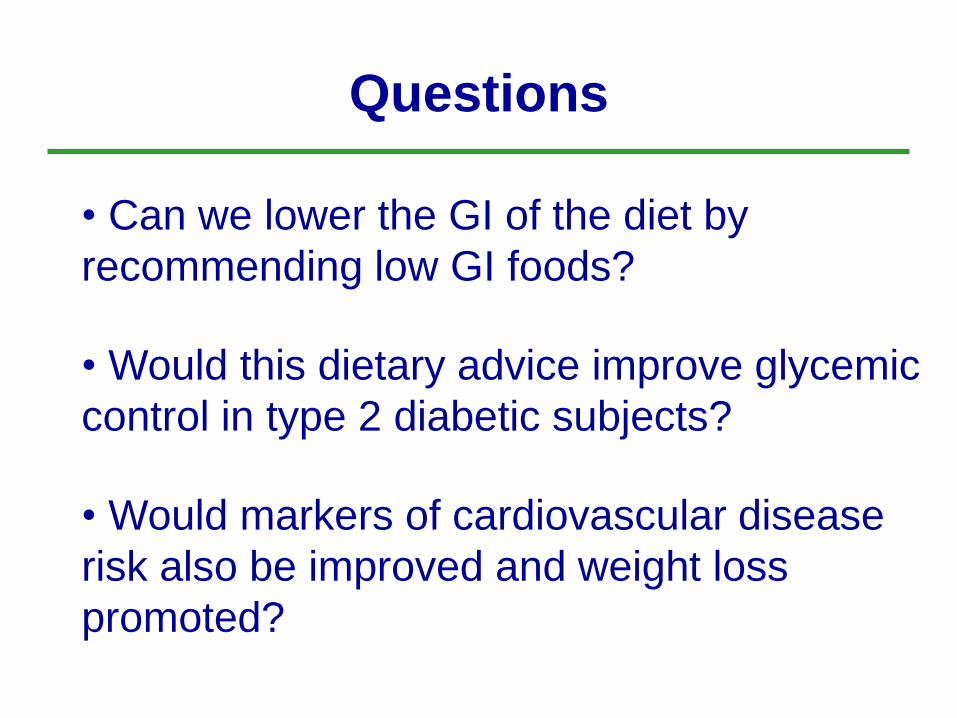
Questions
• Can we lower the GI of the diet by
recommending low GI foods?
• Would this dietary advice improve glycemic
control in type 2 diabetic subjects?
• Would markers of cardiovascular disease
risk also be improved and weight loss
promoted?
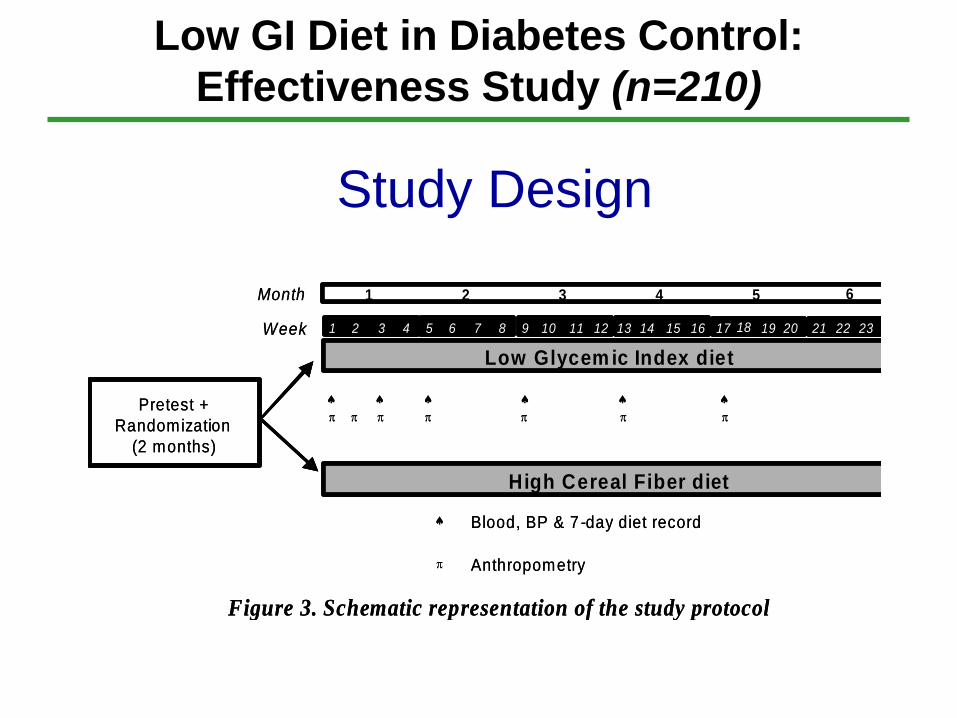
Low GI Diet in Diabetes Control:
Effectiveness Study (n=210)
Study Design
Low Glycem ic Index diet
Month
Week
1 2 3 4
1 2 3 4 5 6 7 8 9 10 12 13 14 15 16
11
High Cereal Fiber diet
Blood, BP & 7 -day diet record
Anthropometry
Figure 3. Schematic representation of the study protocol
Pretest +
Randomization
(2 months)
17 18 19 20 21 22 23 24
5 6
Low Glycem ic Index diet
Month
Week
1 2 3 4
1 2 3 4 5 6 7 8 9 10 12 13 14 15 16
11
High Cereal Fiber diet
Blood, BP & 7 -day diet record
Anthropometry
Figure 3. Schematic representation of the study protocol
Pretest +
Randomization
(2 months)
17 18 19 20 21 22 23 24
5 6
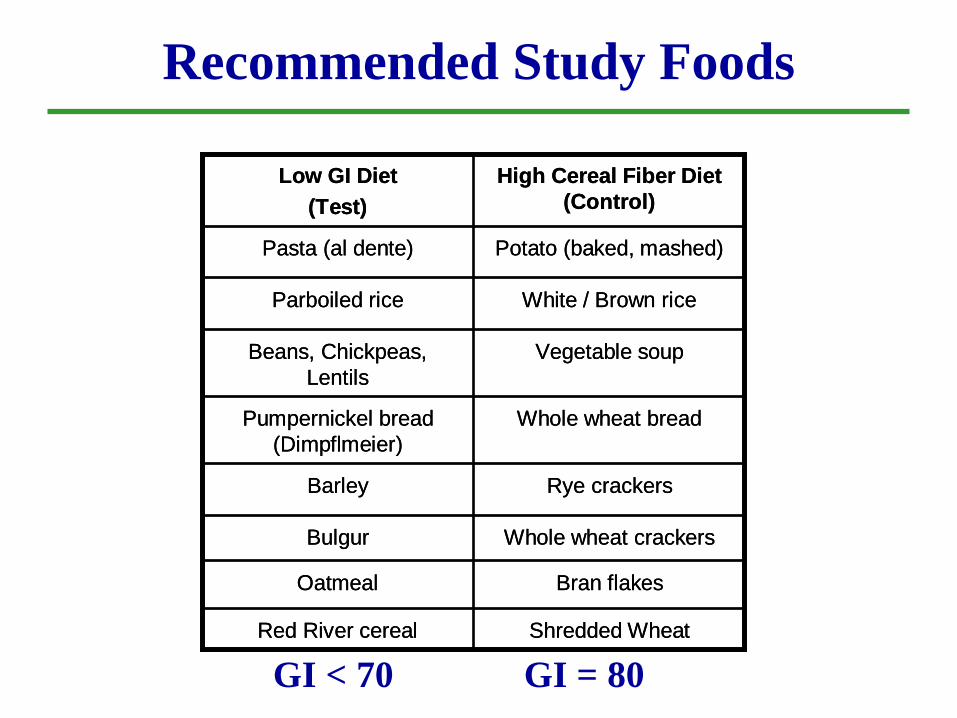
Bran flakesOatmeal
Whole wheat crackersBulgur
Vegetable soupBeans, Chickpeas,
Lentils
Whole wheat breadPumpernickel bread
(Dimpflmeier)
Rye crackersBarley
Shredded WheatRed River cereal
White / Brown riceParboiled rice
Potato (baked, mashed)Pasta (al dente)
High Cereal Fiber Diet
(Control)
Low GI Diet
(Test)
GI < 70 GI = 80
Recommended Study Foods
2
6
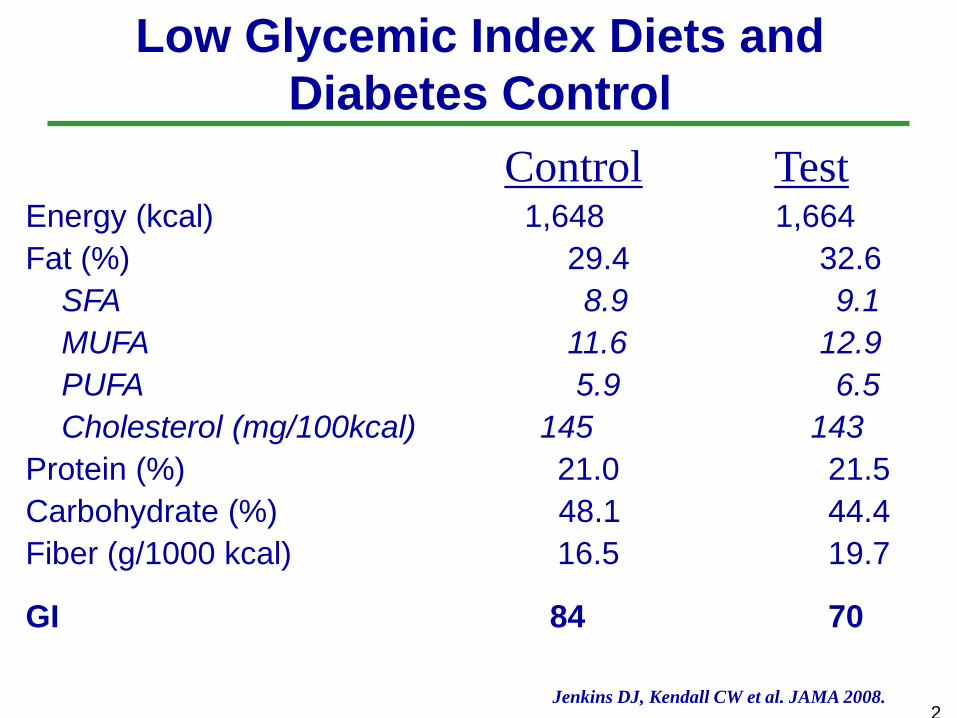
Low Glycemic Index Diets and
Diabetes Control
Jenkins DJ, Kendall CW et al. JAMA 2008.
Control TestEnergy (kcal) 1,648 1,664
Fat (%) 29.4 32.6
SFA 8.9 9.1
MUFA 11.6 12.9
PUFA 5.9 6.5
Cholesterol (mg/100kcal) 145 143
Protein (%) 21.0 21.5
Carbohydrate (%) 48.1 44.4
Fiber (g/1000 kcal) 16.5 19.7
GI 84 70
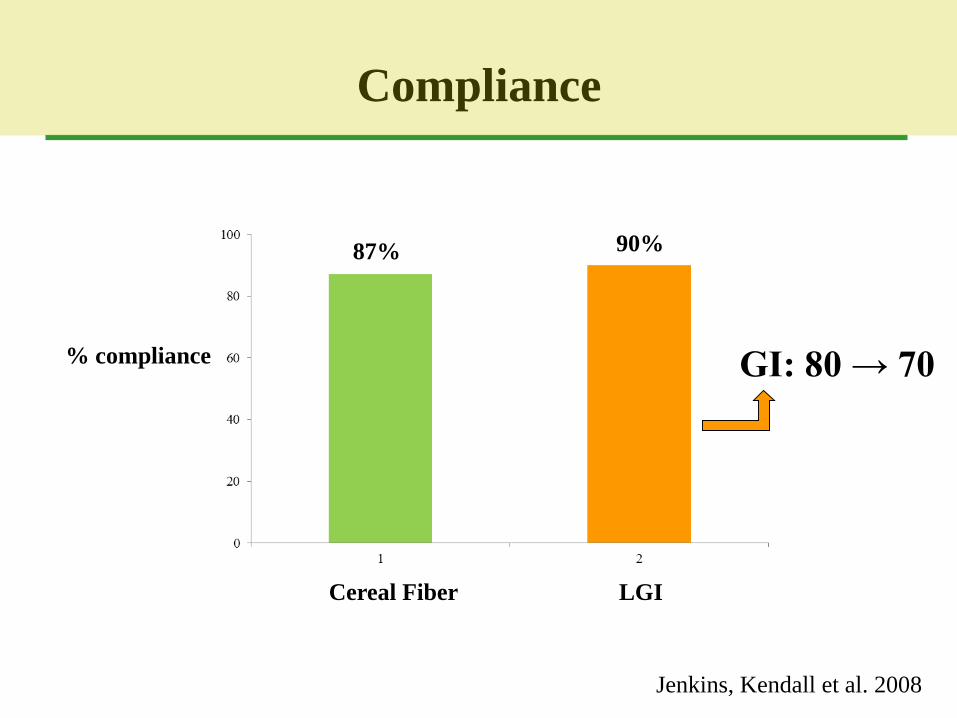
Compliance
Jenkins, Kendall et al. 2008
% compliance
Cereal Fiber LGI
87% 90%
GI: 80 → 70
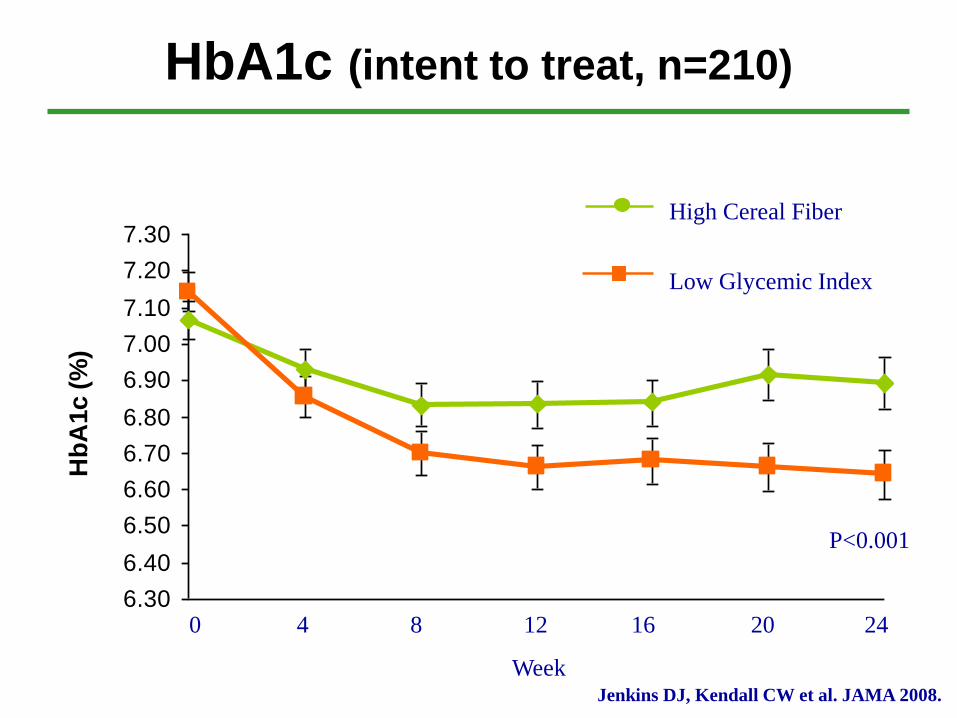
HbA1c (intent to treat, n=210)
0 4 8 12 16 20 24
Week
6.30
6.40
6.50
6.60
6.70
6.80
6.90
7.00
7.10
7.20
7.30
Hb
A1c (
%)
Low Glycemic Index
High Cereal Fiber
P<0.001
Jenkins DJ, Kendall CW et al. JAMA 2008.
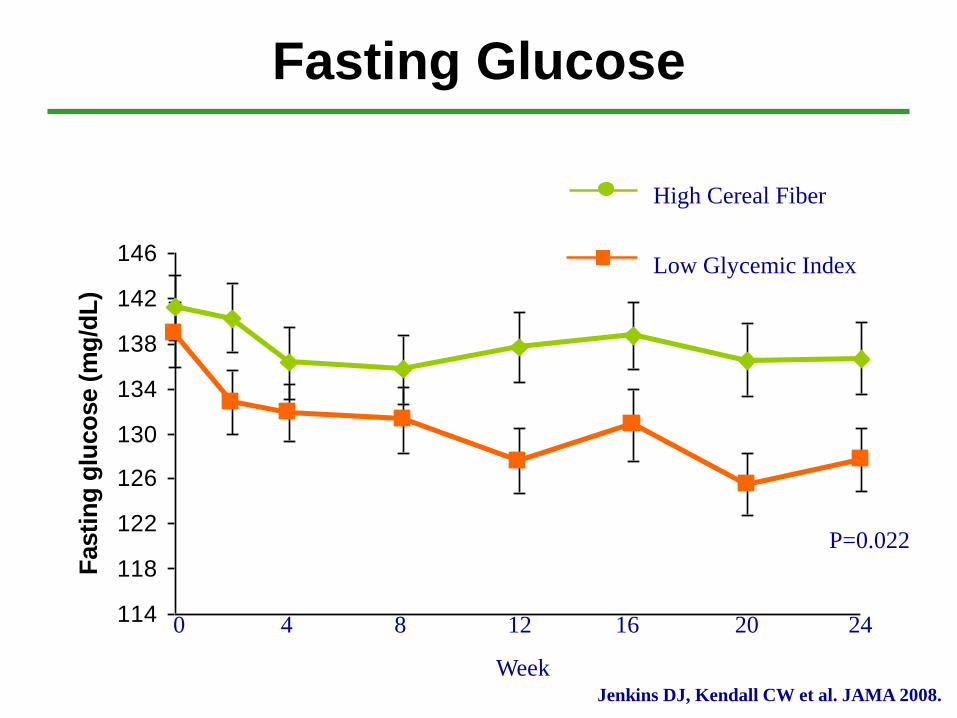
Fasting Glucose
114
118
122
126
130
134
138
142
146
Fasti
ng
glu
co
se (
mg
/dL
)
Low Glycemic Index
High Cereal Fiber
P=0.022
0 4 8 12 16 20 24
WeekJenkins DJ, Kendall CW et al. JAMA 2008.
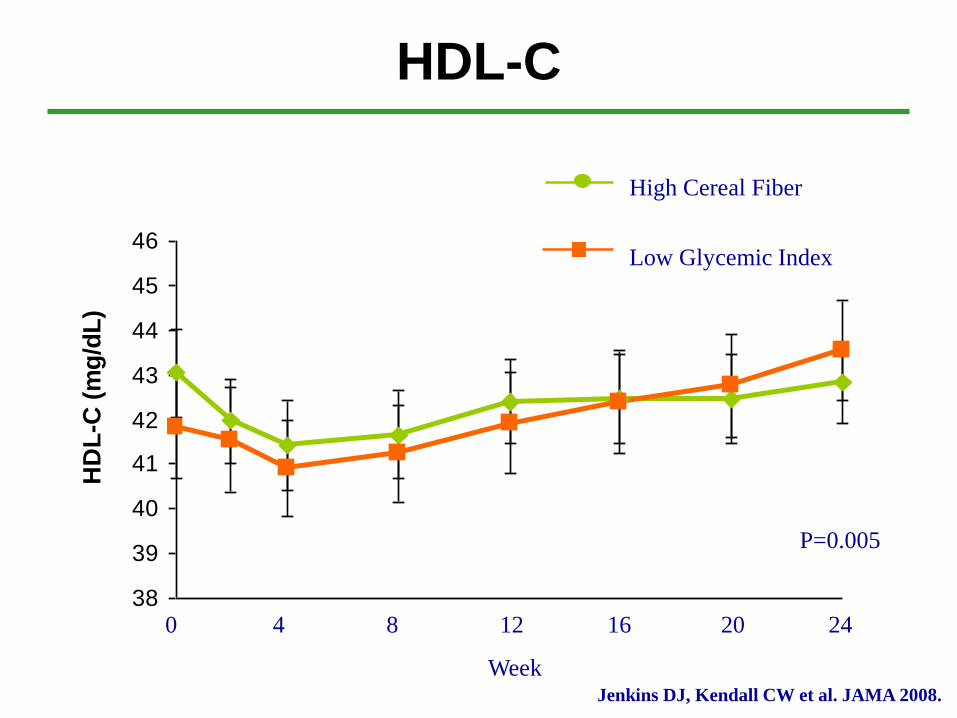
HDL-C
38
39
40
41
42
43
44
45
46
HD
L-C
(m
g/d
L)
Low Glycemic Index
High Cereal Fiber
P=0.005
0 4 8 12 16 20 24
WeekJenkins DJ, Kendall CW et al. JAMA 2008.
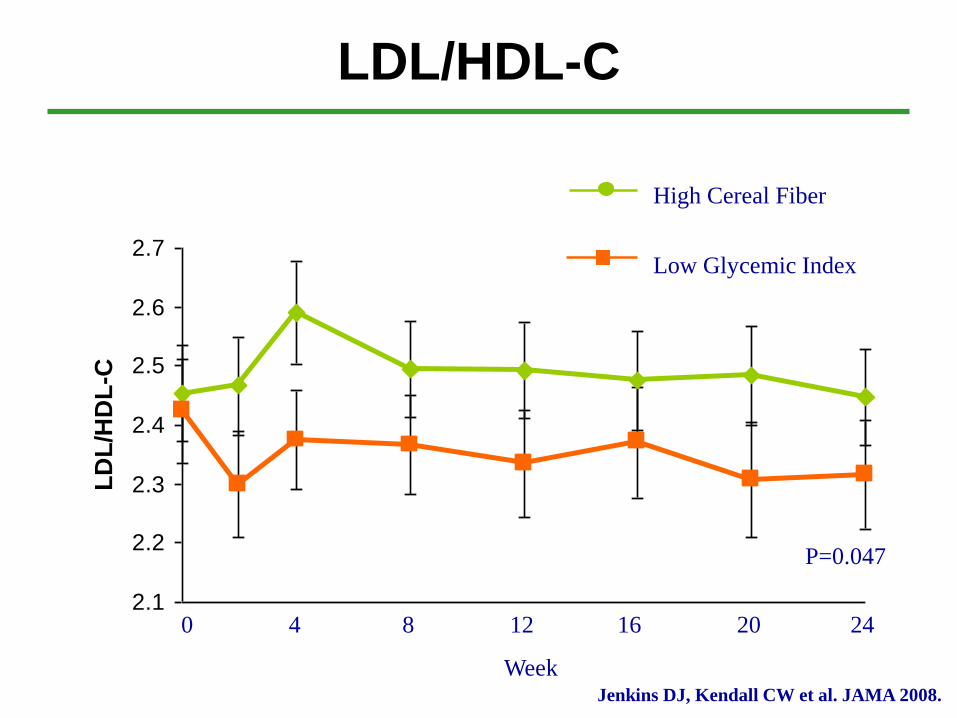
LDL/HDL-C
2.1
2.2
2.3
2.4
2.5
2.6
2.7
LD
L/H
DL
-C
Low Glycemic Index
High Cereal Fiber
P=0.047
0 4 8 12 16 20 24
WeekJenkins DJ, Kendall CW et al. JAMA 2008.
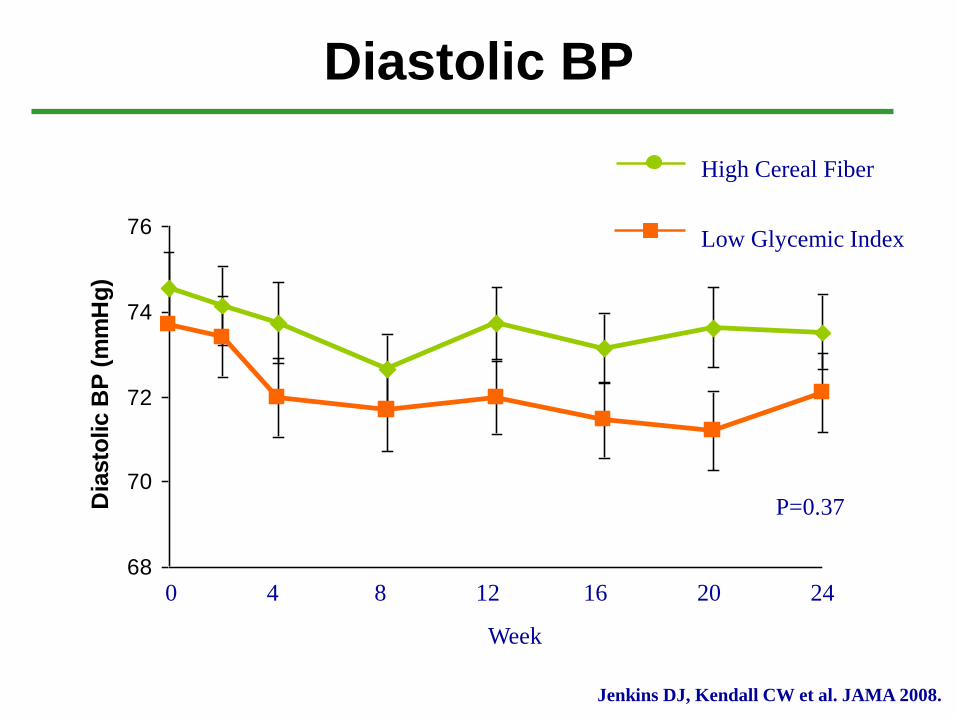
Diastolic BP
68
70
72
74
76
Dia
sto
lic B
P (
mm
Hg
)
Low Glycemic Index
High Cereal Fiber
Jenkins DJ, Kendall CW et al. JAMA 2008.
0 4 8 12 16 20 24
Week
P=0.37
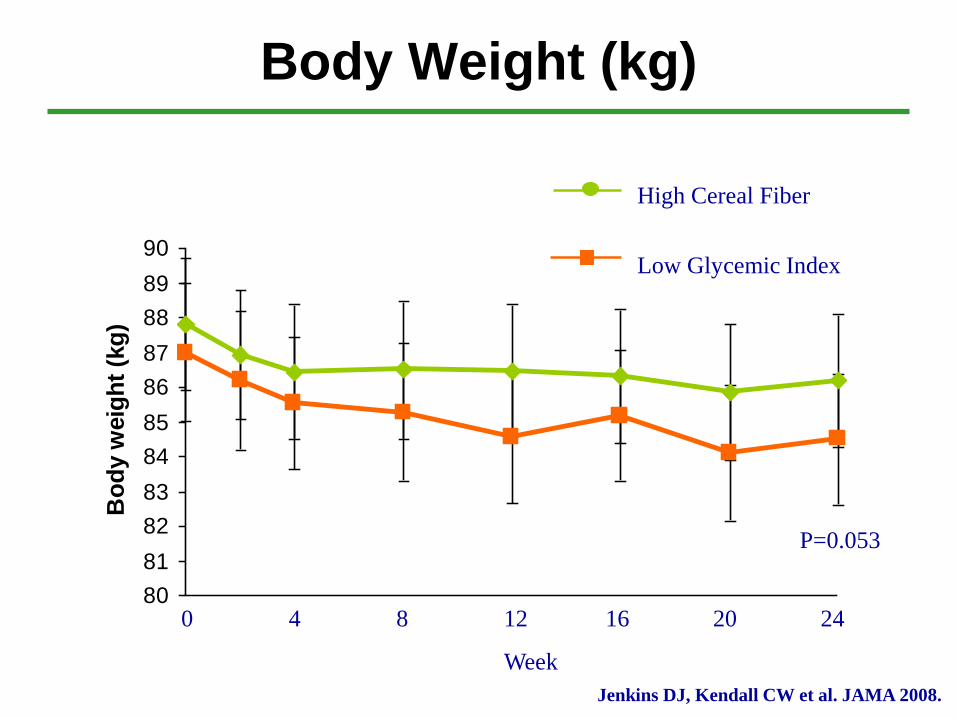
Body Weight (kg)
80
81
82
83
84
85
86
87
88
89
90
Bo
dy w
eig
ht
(kg
)
Low Glycemic Index
High Cereal Fiber
P=0.053
0 4 8 12 16 20 24
Week
Jenkins DJ, Kendall CW et al. JAMA 2008.
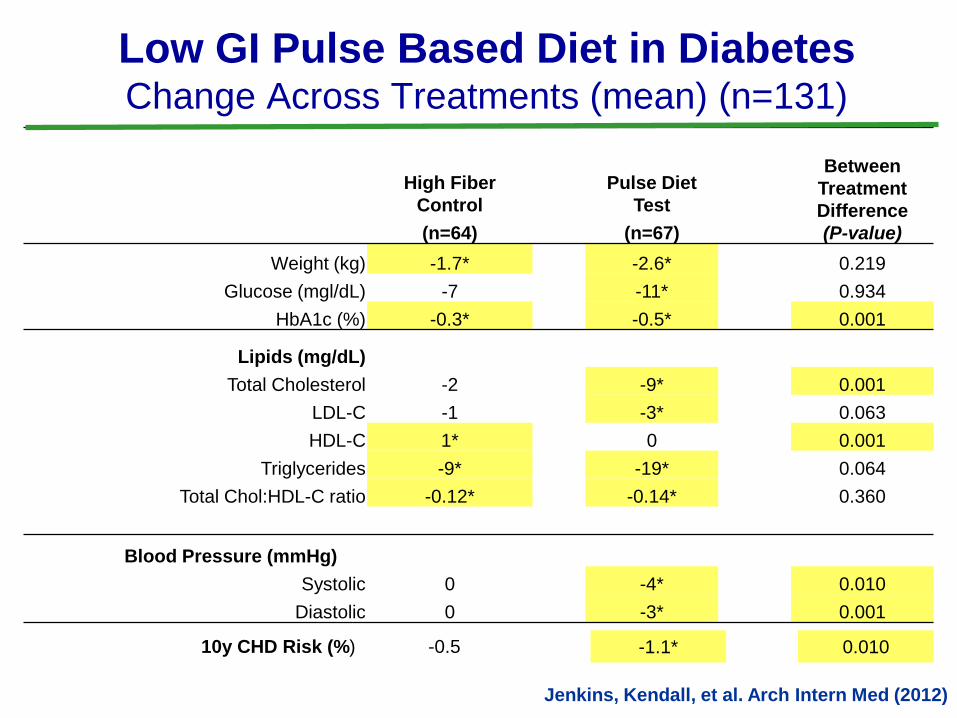
Between
Treatment
Difference
(P-value)
High Fiber
Control
Pulse Diet
Test
(n=64) (n=67)
Weight (kg) -1.7* -2.6* 0.219
Glucose (mgl/dL) -7 -11* 0.934
HbA1c (%) -0.3* -0.5* 0.001
Lipids (mg/dL)
Total Cholesterol -2 -9* 0.001
LDL-C -1 -3* 0.063
HDL-C 1* 0 0.001
Triglycerides -9* -19* 0.064
Total Chol:HDL-C ratio -0.12* -0.14* 0.360
Blood Pressure (mmHg)
Systolic 0 -4* 0.010
Diastolic 0 -3* 0.001
Low GI Pulse Based Diet in DiabetesChange Across Treatments (mean) (n=131)
10y CHD Risk (%) -0.5 -1.1* 0.010
Jenkins, Kendall, et al. Arch Intern Med (2012)
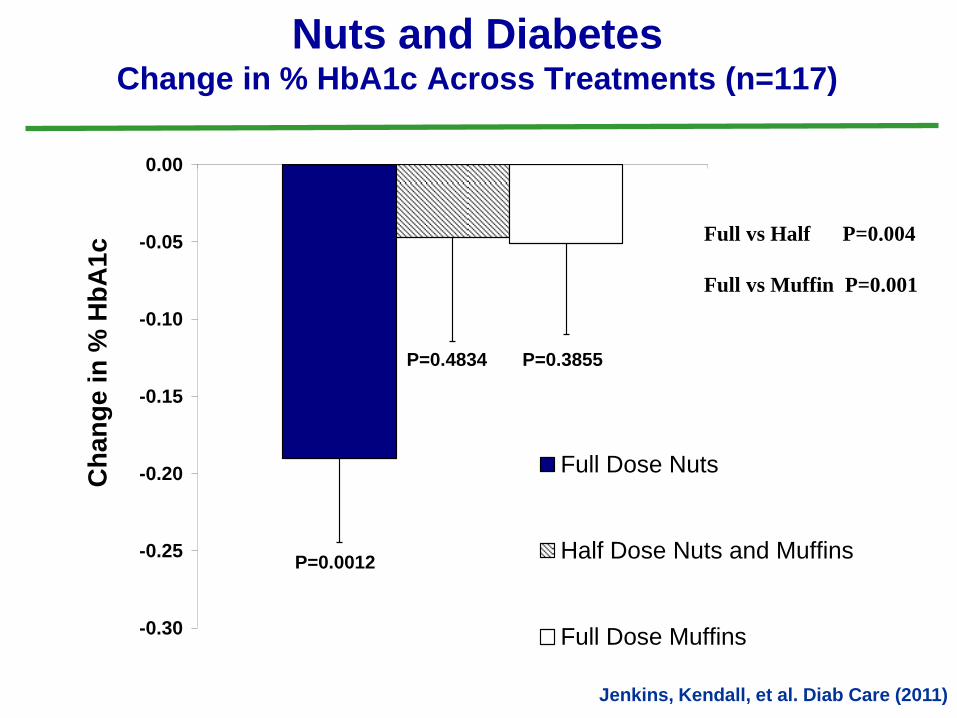
-0.30
-0.25
-0.20
-0.15
-0.10
-0.05
0.00
Ch
an
ge
in
% H
bA
1c
Full Dose Nuts
Half Dose Nuts and Muffins
Full Dose Muffins
P=0.0012
P=0.3855P=0.4834
Nuts and DiabetesChange in % HbA1c Across Treatments (n=117)
Jenkins, Kendall, et al. Diab Care (2011)
Full vs Half P=0.004
Full vs Muffin P=0.001
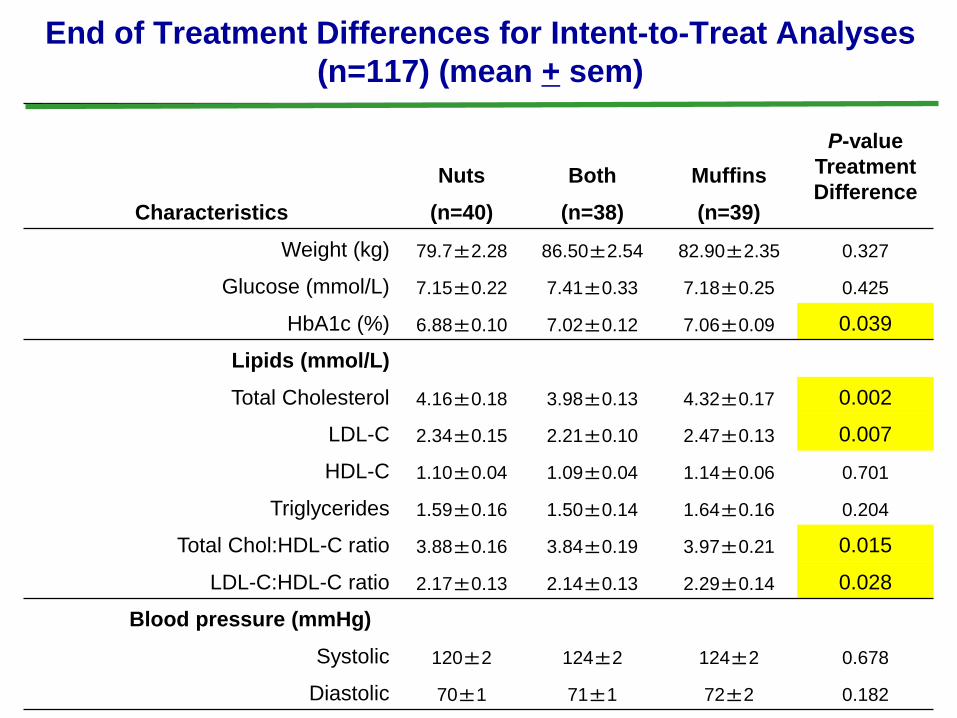
P-value
Treatment
DifferenceNuts Both Muffins
Characteristics (n=40) (n=38) (n=39)
Weight (kg) 79.7±2.28 86.50±2.54 82.90±2.35 0.327
Glucose (mmol/L) 7.15±0.22 7.41±0.33 7.18±0.25 0.425
HbA1c (%) 6.88±0.10 7.02±0.12 7.06±0.09 0.039
Lipids (mmol/L)
Total Cholesterol 4.16±0.18 3.98±0.13 4.32±0.17 0.002
LDL-C 2.34±0.15 2.21±0.10 2.47±0.13 0.007
HDL-C 1.10±0.04 1.09±0.04 1.14±0.06 0.701
Triglycerides 1.59±0.16 1.50±0.14 1.64±0.16 0.204
Total Chol:HDL-C ratio 3.88±0.16 3.84±0.19 3.97±0.21 0.015
LDL-C:HDL-C ratio 2.17±0.13 2.14±0.13 2.29±0.14 0.028
Blood pressure (mmHg)
Systolic 120±2 124±2 124±2 0.678
Diastolic 70±1 71±1 72±2 0.182
End of Treatment Differences for Intent-to-Treat Analyses
(n=117) (mean + sem)
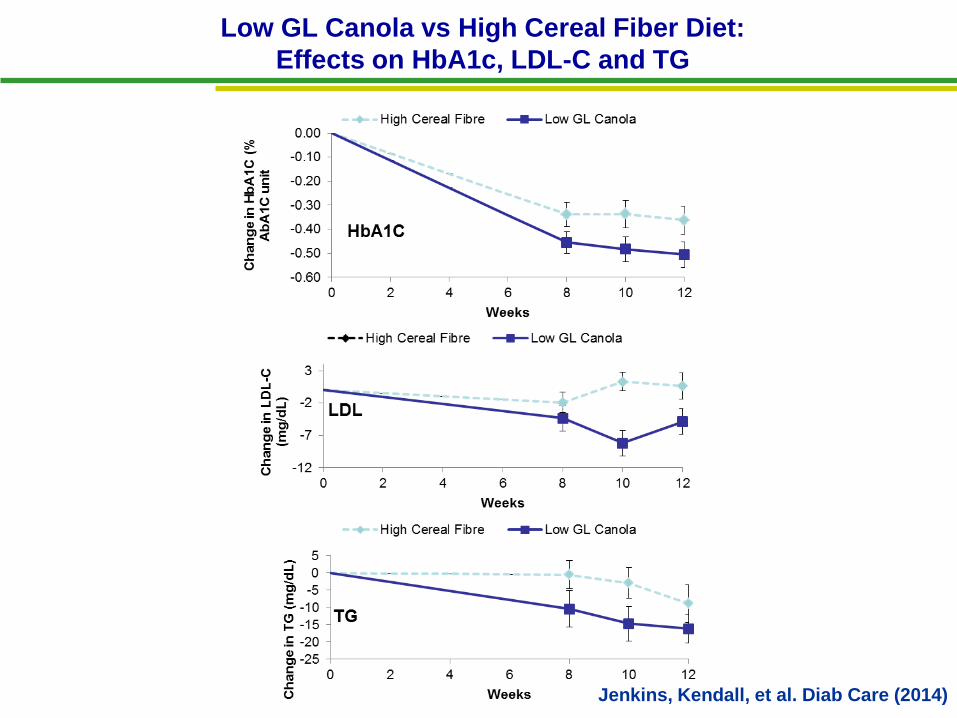
Low GL Canola vs High Cereal Fiber Diet:
Effects on HbA1c, LDL-C and TG
Jenkins, Kendall, et al. Diab Care (2014)
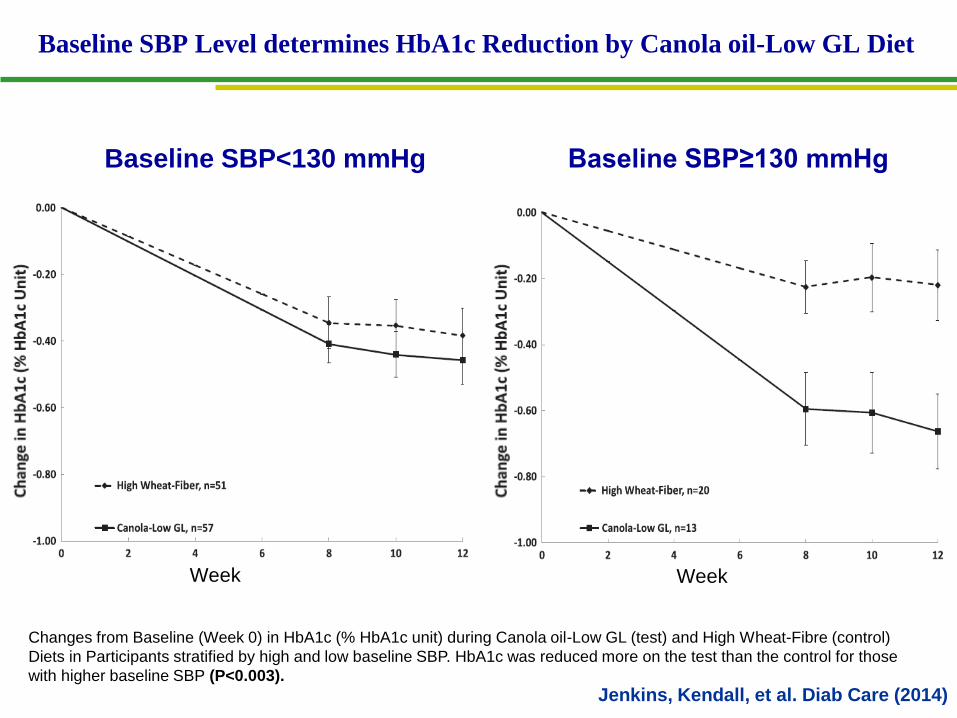
Baseline SBP Level determines HbA1c Reduction by Canola oil-Low GL Diet
Changes from Baseline (Week 0) in HbA1c (% HbA1c unit) during Canola oil-Low GL (test) and High Wheat-Fibre (control)
Diets in Participants stratified by high and low baseline SBP. HbA1c was reduced more on the test than the control for those
with higher baseline SBP (P<0.003).
Baseline SBP<130 mmHg Baseline SBP≥130 mmHg
Week Week
Jenkins, Kendall, et al. Diab Care (2014)
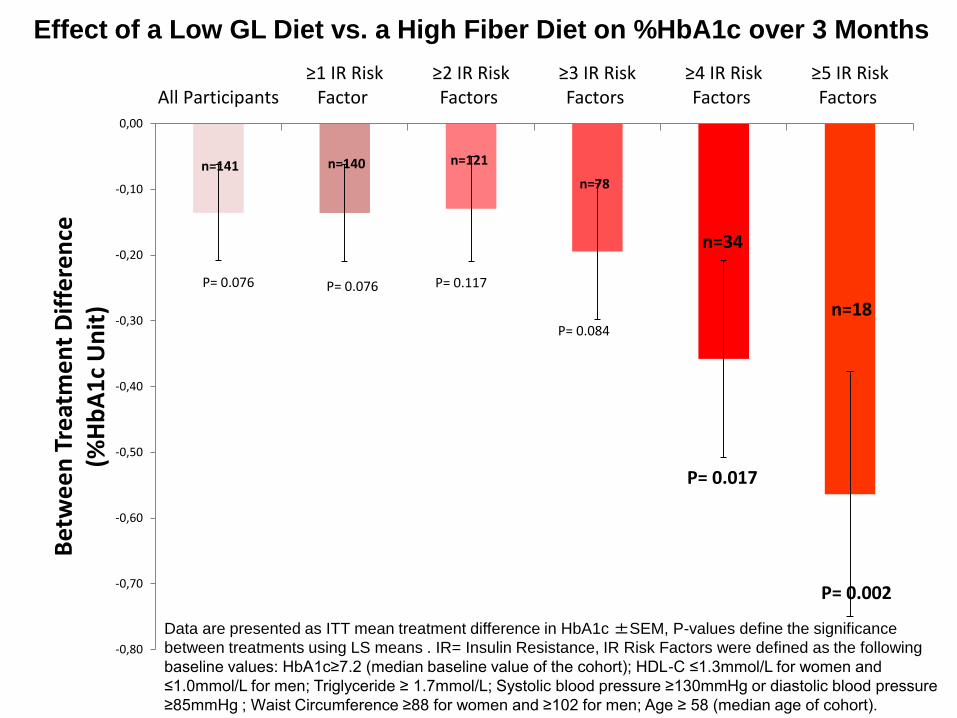
Effect of a Low GL Diet vs. a High Fiber Diet on %HbA1c over 3 Months
Data are presented as ITT mean treatment difference in HbA1c ±SEM, P-values define the significance
between treatments using LS means . IR= Insulin Resistance, IR Risk Factors were defined as the following
baseline values: HbA1c≥7.2 (median baseline value of the cohort); HDL-C ≤1.3mmol/L for women and
≤1.0mmol/L for men; Triglyceride ≥ 1.7mmol/L; Systolic blood pressure ≥130mmHg or diastolic blood pressure
≥85mmHg ; Waist Circumference ≥88 for women and ≥102 for men; Age ≥ 58 (median age of cohort).
-0,80
-0,70
-0,60
-0,50
-0,40
-0,30
-0,20
-0,10
0,00
All Participants≥1 IR Risk
Factor ≥2 IR Risk Factors
≥3 IR Risk Factors
≥4 IR Risk Factors
≥5 IR Risk Factors
Bet
we
en
Tre
atm
en
t D
iffe
ren
ce(%
Hb
A1
c U
nit
)
P= 0.076 P= 0.076 P= 0.117
P= 0.084
P= 0.017
P= 0.002
n=141 n=140 n=121
n=78
n=34
n=18
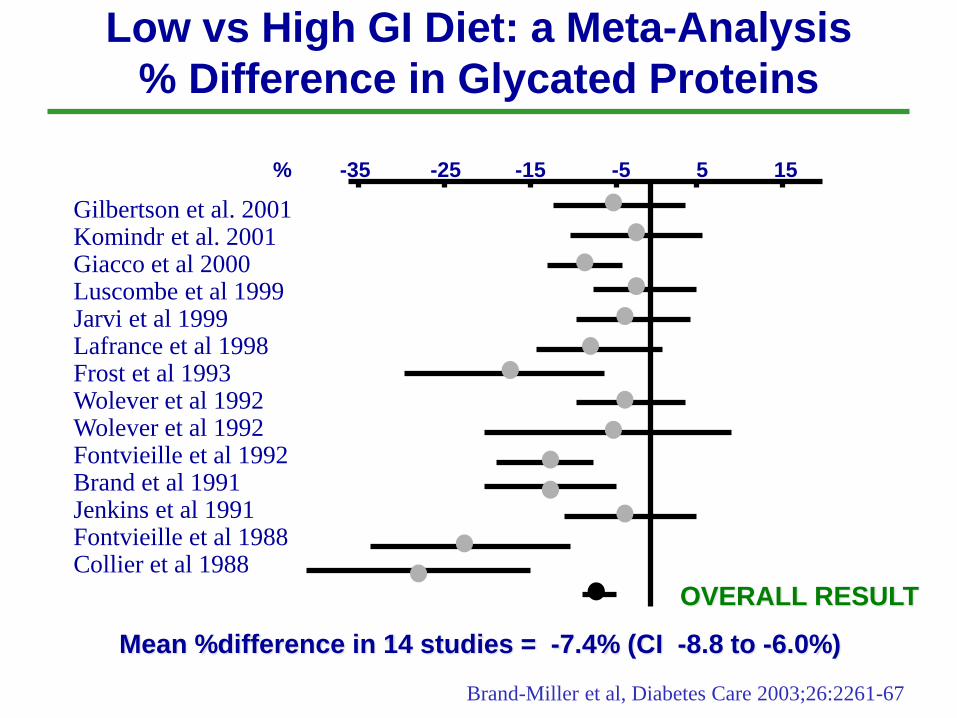
Low vs High GI Diet: a Meta-Analysis
% Difference in Glycated Proteins
% -35 -25 -15 -5 5 15
Gilbertson et al. 2001Komindr et al. 2001Giacco et al 2000Luscombe et al 1999Jarvi et al 1999Lafrance et al 1998Frost et al 1993Wolever et al 1992Wolever et al 1992Fontvieille et al 1992Brand et al 1991Jenkins et al 1991Fontvieille et al 1988Collier et al 1988
Mean %difference in 14 studies = -7.4% (CI -8.8 to -6.0%)
OVERALL RESULT
Brand-Miller et al, Diabetes Care 2003;26:2261-67
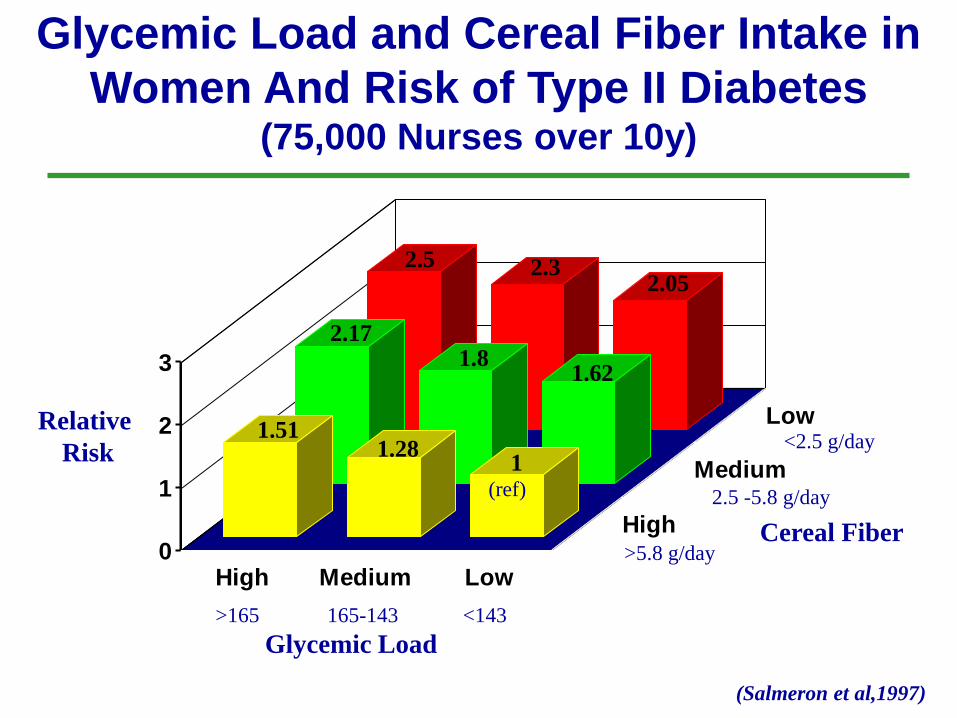
2.5 2.32.05
2.171.8
1.62
1.511.28
1
0
1
2
3
High Medium Low
High
Medium
LowRelative
Risk
>165 165-143 <143
Glycemic Load
>5.8 g/day
2.5 -5.8 g/day
<2.5 g/day
(Salmeron et al,1997)
(ref)
Cereal Fiber
Glycemic Load and Cereal Fiber Intake in
Women And Risk of Type II Diabetes (75,000 Nurses over 10y)
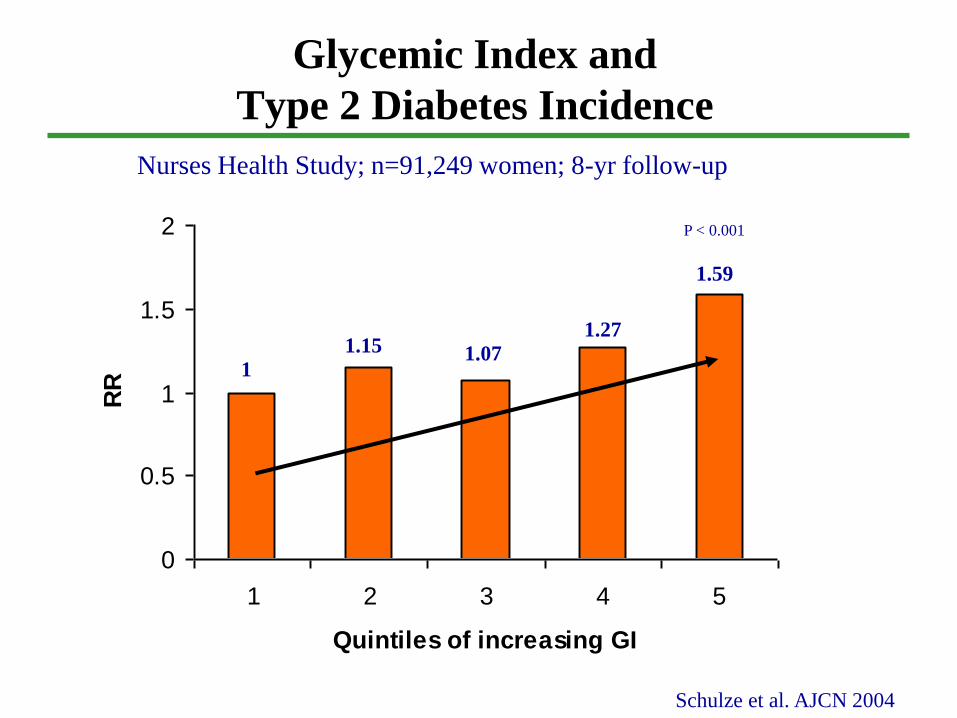
Glycemic Index and
Type 2 Diabetes Incidence
0
0.5
1
1.5
2
1 2 3 4 5
Quintiles of increasing GI
RR
Schulze et al. AJCN 2004
Nurses Health Study; n=91,249 women; 8-yr follow-up
P < 0.001
1
1.15 1.07
1.27
1.59
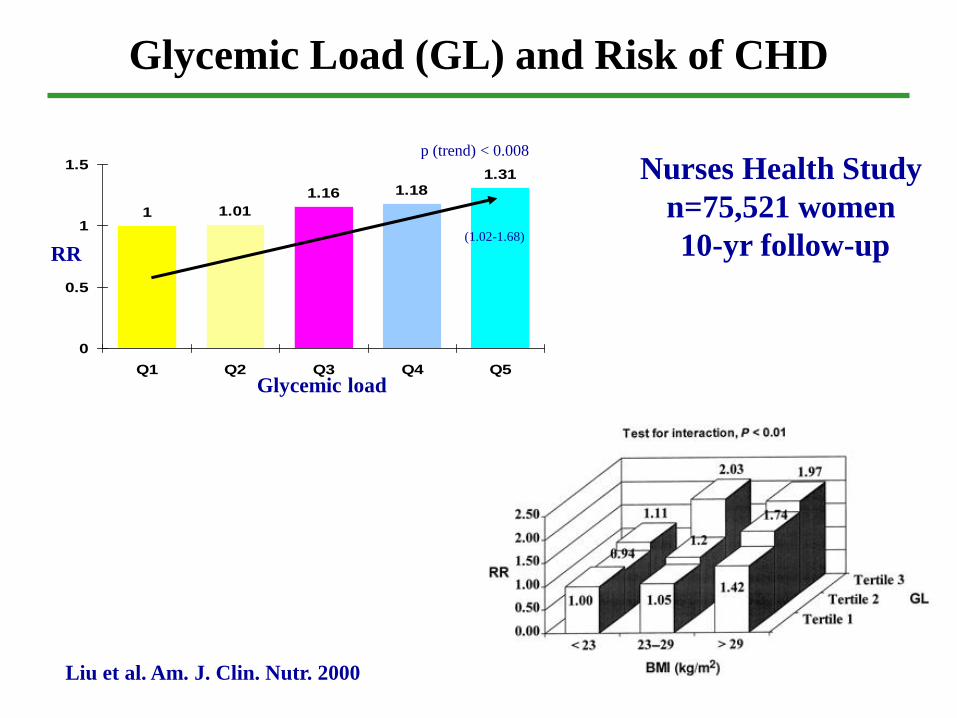
Glycemic Load (GL) and Risk of CHD
Liu et al. Am. J. Clin. Nutr. 2000
Nurses Health Study
n=75,521 women
10-yr follow-up
1
1.16 1.181.31
1.01
0
0.5
1
1.5
Q1 Q2 Q3 Q4 Q5
Glycemic load
RR
p (trend) < 0.008
(1.02-1.68)
Summary
• Low GI advice can reduce the GI of the diet
• Low GI diets have shown metabolic benefits in Type 2 diabetes. Glycemic control significantly improved and CVD risk factors decreased.
• Longer-term dietary studies with harder end points are
needed (e.g. CHD, MRI and atherosclerotic plaque formation).
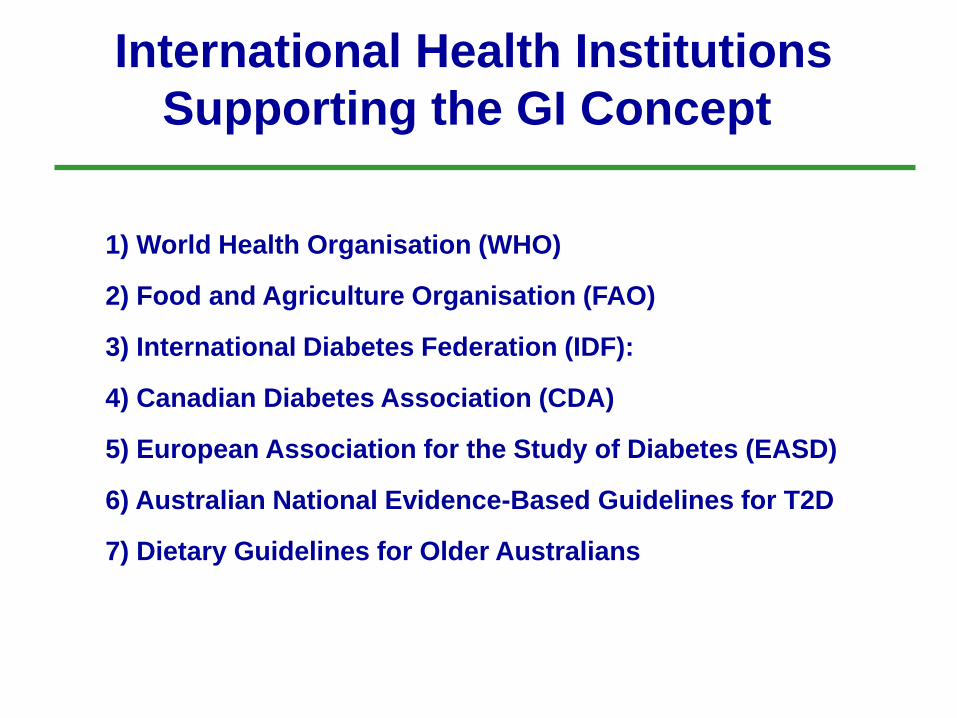
International Health Institutions
Supporting the GI Concept
1) World Health Organisation (WHO)
2) Food and Agriculture Organisation (FAO)
3) International Diabetes Federation (IDF):
4) Canadian Diabetes Association (CDA)
5) European Association for the Study of Diabetes (EASD)
6) Australian National Evidence-Based Guidelines for T2D
7) Dietary Guidelines for Older Australians
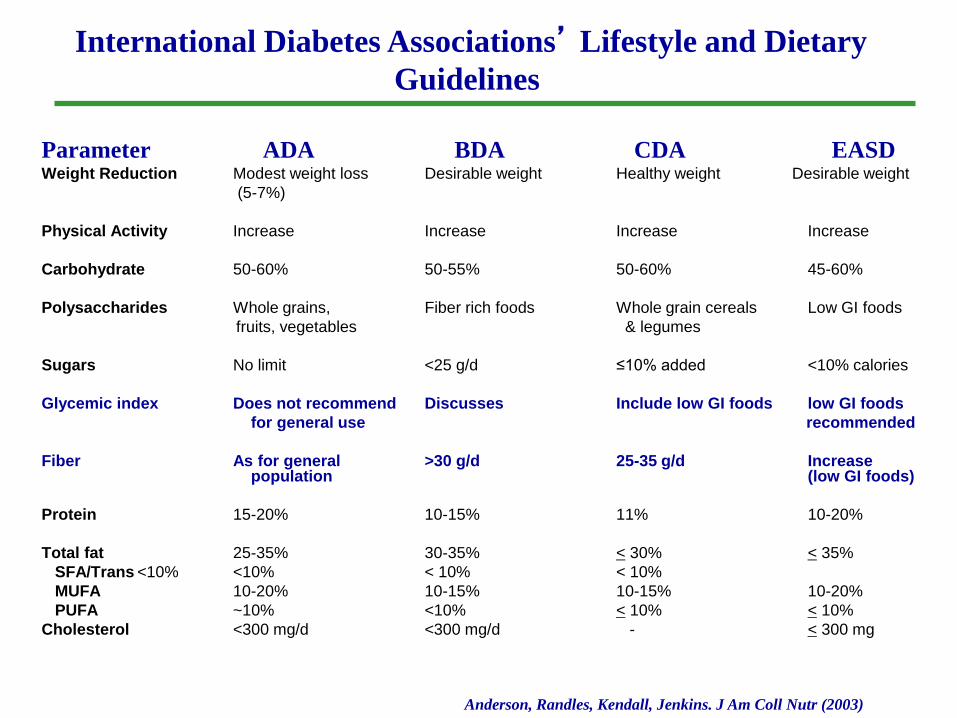
Parameter ADA BDA CDA EASDWeight Reduction Modest weight loss Desirable weight Healthy weight Desirable weight
(5-7%)
Physical Activity Increase Increase Increase Increase
Carbohydrate 50-60% 50-55% 50-60% 45-60%
Polysaccharides Whole grains, Fiber rich foods Whole grain cereals Low GI foods
fruits, vegetables & legumes
Sugars No limit <25 g/d ≤10% added <10% calories
Glycemic index Does not recommend Discusses Include low GI foods low GI foods
for general use recommended
Fiber As for general >30 g/d 25-35 g/d Increase population (low GI foods)
Protein 15-20% 10-15% 11% 10-20%
Total fat 25-35% 30-35% < 30% < 35%
SFA/Trans <10% <10% < 10% < 10%
MUFA 10-20% 10-15% 10-15% 10-20%
PUFA ~10% <10% < 10% < 10%
Cholesterol <300 mg/d <300 mg/d - < 300 mg
International Diabetes Associations’ Lifestyle and Dietary
Guidelines
Anderson, Randles, Kendall, Jenkins. J Am Coll Nutr (2003)
Glycemic Index, Glycemic Load and Glycemic Response:
An International Scientific Consensus Summit
Stresa, Italy • June 7th, 2013
Organizers: Oldways & Nutrition Foundation of Italy
Goal: To bring together international experts on
carbohydrates and health in order to advance
worldwide understanding of the key role of
carbohydrates in a healthy diet.
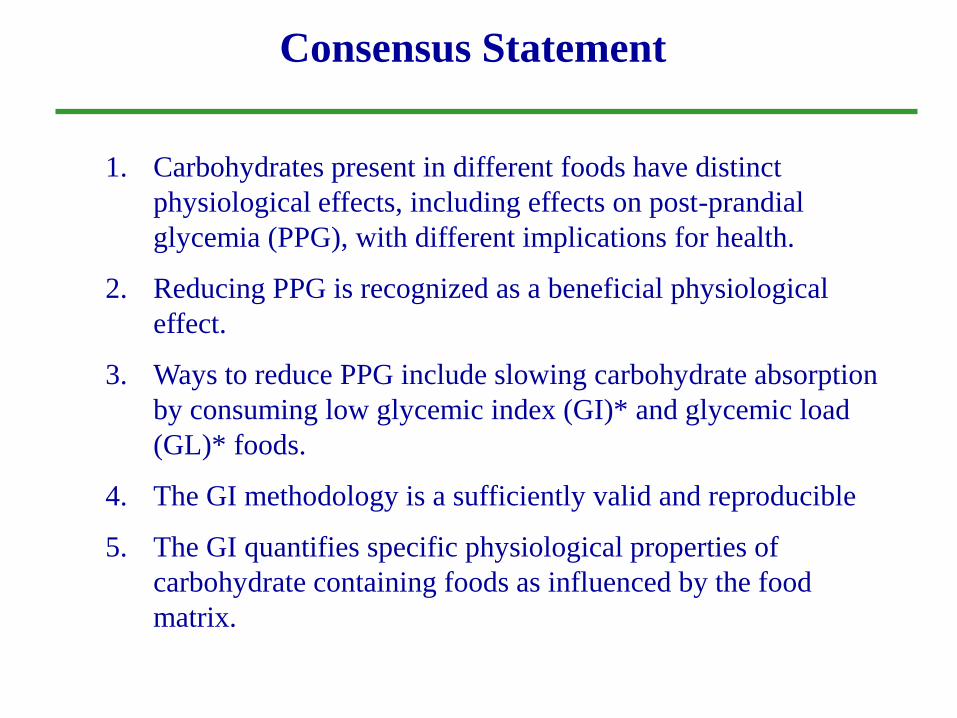
Consensus Statement
1. Carbohydrates present in different foods have distinct
physiological effects, including effects on post-prandial
glycemia (PPG), with different implications for health.
2. Reducing PPG is recognized as a beneficial physiological
effect.
3. Ways to reduce PPG include slowing carbohydrate absorption
by consuming low glycemic index (GI)* and glycemic load
(GL)* foods.
4. The GI methodology is a sufficiently valid and reproducible
5. The GI quantifies specific physiological properties of
carbohydrate containing foods as influenced by the food
matrix.
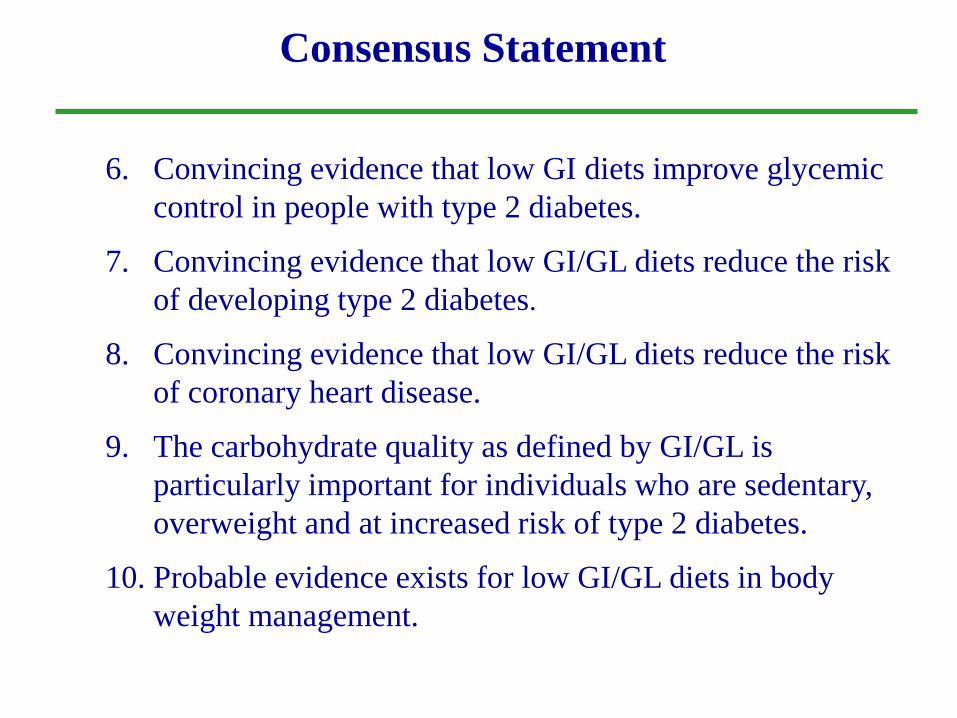
Consensus Statement
6. Convincing evidence that low GI diets improve glycemic
control in people with type 2 diabetes.
7. Convincing evidence that low GI/GL diets reduce the risk
of developing type 2 diabetes.
8. Convincing evidence that low GI/GL diets reduce the risk
of coronary heart disease.
9. The carbohydrate quality as defined by GI/GL is
particularly important for individuals who are sedentary,
overweight and at increased risk of type 2 diabetes.
10. Probable evidence exists for low GI/GL diets in body
weight management.
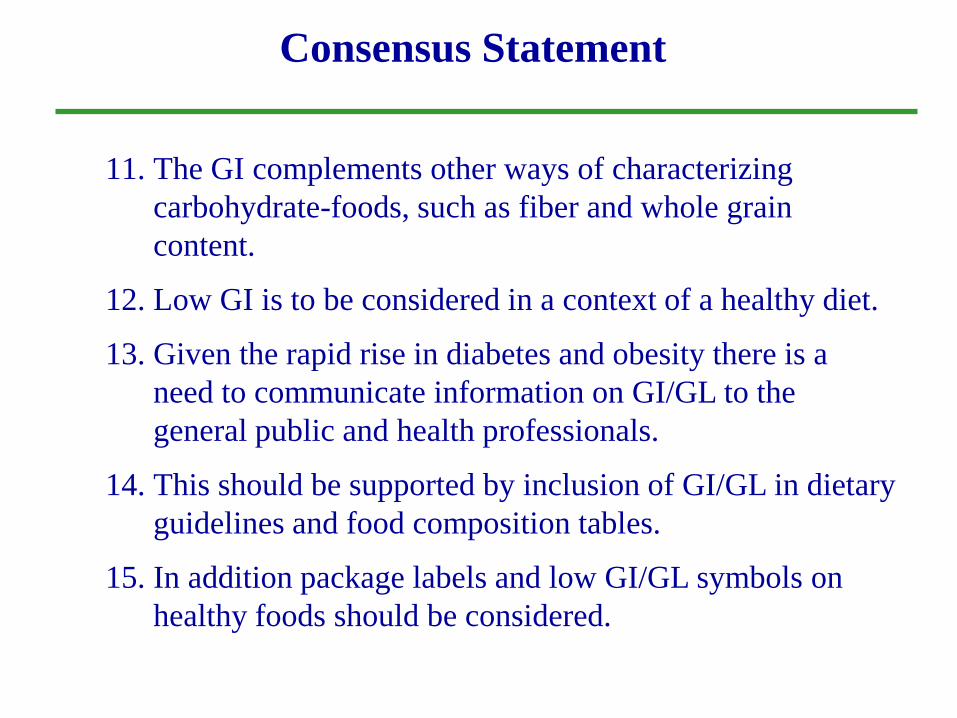
Consensus Statement
11. The GI complements other ways of characterizing
carbohydrate-foods, such as fiber and whole grain
content.
12. Low GI is to be considered in a context of a healthy diet.
13. Given the rapid rise in diabetes and obesity there is a
need to communicate information on GI/GL to the
general public and health professionals.
14. This should be supported by inclusion of GI/GL in dietary
guidelines and food composition tables.
15. In addition package labels and low GI/GL symbols on
healthy foods should be considered.
Glycemic Index, Glycemic Load and Glycemic Response:
An International Scientific Consensus Summit
Stresa, Italy • June 7th, 2013
An international panel of experts has formed the “International
Carbohydrate Quality Consortium (ICQC)” which met in Stresa on June
6-7, 2013 and discussed the importance of carbohydrate quality in
addition to quantity.

Thank you for your attention
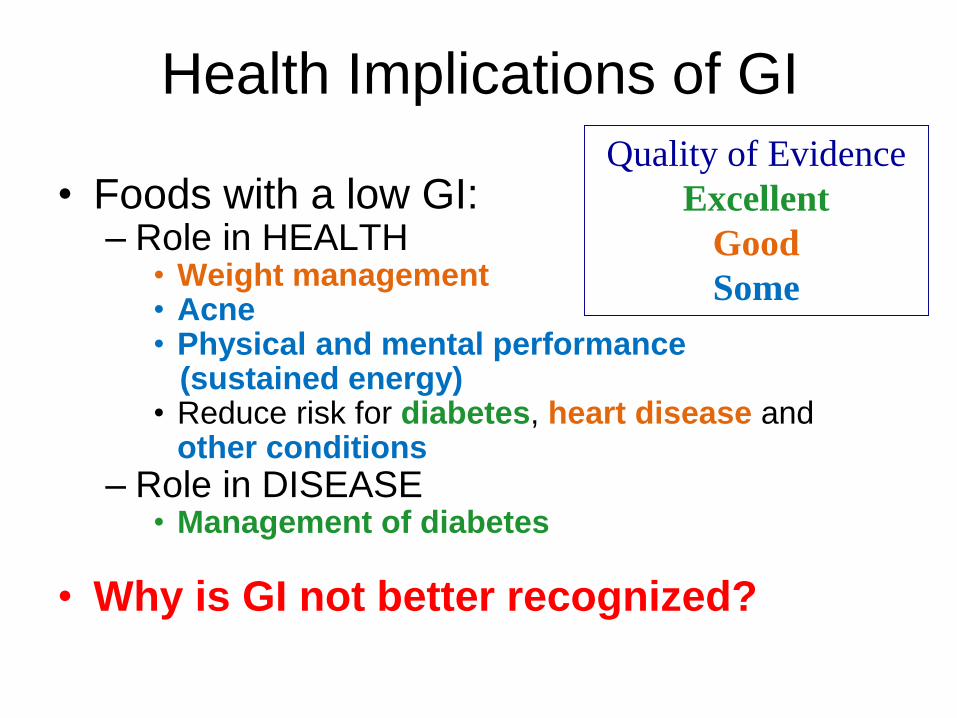
Health Implications of GI
• Foods with a low GI:– Role in HEALTH
• Weight management• Acne• Physical and mental performance
(sustained energy)• Reduce risk for diabetes, heart disease and
other conditions
– Role in DISEASE• Management of diabetes
• Why is GI not better recognized?
Quality of Evidence
Excellent
Good
Some