a monte carlo study of the momentum dependence on … · on the results of tracking unknown...
TRANSCRIPT

SLAC-R-838
A Monte Carlo Study of the Momentum Dependence
on the Results of Tracking Unknown Particle Species
in the BaBar Detector
Stephen Sewerynek
SLAC-R-838
Prepared for the Department of Energy under contract number DE-AC02-76SF00515
Printed in the United States of America. Available from the National Technical Information Service, U.S. Department of Commerce, 5285 Port Royal Road, Springfield, VA 22161.

This document, and the material and data contained therein, was developed under sponsorship of the United States Government. Neither the United States nor the Department of Energy, nor the Leland Stanford Junior University, nor their employees, nor their respective contractors, subcontractors, or their employees, makes an warranty, express or implied, or assumes any liability of responsibility for accuracy, completeness or usefulness of any information, apparatus, product or process disclosed, or represents that its use will not infringe privately owned rights. Mention of any product, its manufacturer, or suppliers shall not, nor is it intended to, imply approval, disapproval, or fitness of any particular use. A royalty-free, nonexclusive right to use and disseminate same of whatsoever, is expressly reserved to the United States and the University.

A MONTE CARLO STUDY OF THE MOMENTUM DEPENDENCE
ON THE RESULTS OF TRACKING UNKNOWN PARTICLE SPECIES
IN THE BABAR DETECTOR
By
Stephen Sewerynek
B�Sc��Hon�� University of Toronto� ����
a thesis submitted in partial fulfillment of
the requirements for the degree of
Master of Science
in
the faculty of graduate studies
department of physics and astronomy
We accept this thesis as conforming
to the required standard
� � � � � � � � � � � � � � � � � � � � � � � � � � � � � � � � � � � � � � � � � � � � � � � � � � � � � � �
� � � � � � � � � � � � � � � � � � � � � � � � � � � � � � � � � � � � � � � � � � � � � � � � � � � � � � �
� � � � � � � � � � � � � � � � � � � � � � � � � � � � � � � � � � � � � � � � � � � � � � � � � � � � � � �
the university of british columbia
April ����
c� Stephen Sewerynek� ����
In presenting this thesis in partial fulllment of the requirements for an advanced degree
at the University of British Columbia� I agree that the Library shall make it freely
available for reference and study� I further agree that permission for extensive copying
of this thesis for scholarly purposes may be granted by the head of my department or by
his or her representatives� It is understood that copying or publication of this thesis for
nancial gain shall not be allowed without my written permission�
Department of Physics and Astronomy
The University of British Columbia
�� Agricultural Road
Vancouver� BC� Canada
V�T �Z�
Date�

Abstract
The BABAR experiment is composed of an international collaboration that will test the
Standard Model prediction of CP violation� To accomplish this a new detector was
constructed at the asymmetric B Factory� located at the Stanford Linear Accelerator
Center� The tests will shed some light on the origins of CP violation� which is an
important aspect in explaining the matter antimatter asymmetry in the universe� In
particular� the BABAR experiment will measure CP violation in the neutral B meson
system�
In order to succeed� the BABAR experiment requires excellent track tting and particle
species identication� Prior to the current study� track tting was done using only one
particle species � the pion� But given the momentum dependence on the accuracy of the
results from this choice of particle species� a better algorithm needed to be developed�
Monte Carlo simulations were carried out and a new algorithm utilizing all ve particle
species present in the BABAR detector was created�
ii

Table of Contents
Abstract ii
List of Tables vi
List of Figures vii
Quotes ix
Acknowledgments x
� Introduction �
��� The Sakharov Criteria � � � � � � � � � � � � � � � � � � � � � � � � � � � �
����� Baryon Non�Conservation � � � � � � � � � � � � � � � � � � � � �
���� The Process of CP Violation � � � � � � � � � � � � � � � � � � �
����� Thermal Equilibrium Lost � � � � � � � � � � � � � � � � � � � � �
�� Summary � � � � � � � � � � � � � � � � � � � � � � � � � � � � � � � � � � �
� CP Violation �
�� A Brief History of CP Violation � � � � � � � � � � � � � � � � � � � � � � �
���� The Neutral Kaon System � � � � � � � � � � � � � � � � � � � � � �
� The Neutral B Mesons � � � � � � � � � � � � � � � � � � � � � � � � � � � �
�� Three Types of CP Violation in B Decays � � � � � � � � � � � � � � � � ��
���� CP Violation in Decay � � � � � � � � � � � � � � � � � � � � � � � ��
iii

��� CP Violation in Mixing � � � � � � � � � � � � � � � � � � � � � � ��
���� CP Violation in the Interference Between Decays With andWith�
out Mixing � � � � � � � � � � � � � � � � � � � � � � � � � � � � � �
�� CP Violation in BABAR � � � � � � � � � � � � � � � � � � � � � � � � � � � �
�� Summary � � � � � � � � � � � � � � � � � � � � � � � � � � � � � � � � � � ��
� The BaBar Detector ��
��� The Silicon Vertex Tracker � � � � � � � � � � � � � � � � � � � � � � � � � ��
�� The Drift Chamber � � � � � � � � � � � � � � � � � � � � � � � � � � � � � ��
���� The Drift Chamber Design � � � � � � � � � � � � � � � � � � � � � ��
��� The DIRC � � � � � � � � � � � � � � � � � � � � � � � � � � � � � � � � � �
��� The Electromagnetic Calorimeter � � � � � � � � � � � � � � � � � � � � � �
��� The Instrumented Flux Return � � � � � � � � � � � � � � � � � � � � � � �
��� Summary � � � � � � � � � � � � � � � � � � � � � � � � � � � � � � � � � � �
� The Drift Chamber ��
��� Ionization Detectors � � � � � � � � � � � � � � � � � � � � � � � � � � � � �
�� Gas Properties � � � � � � � � � � � � � � � � � � � � � � � � � � � � � � � ��
��� Gas Type Choice � � � � � � � � � � � � � � � � � � � � � � � � � � � � � � ��
����� Electron Di�usion � � � � � � � � � � � � � � � � � � � � � � � � � � �
���� Drift Velocity � � � � � � � � � � � � � � � � � � � � � � � � � � � � ��
��� A Drift Chamber in a Magnetic Field � � � � � � � � � � � � � � � � � � � ��
��� Summary � � � � � � � � � � � � � � � � � � � � � � � � � � � � � � � � � � ��
� The Silicon Vertex Tracker ��
��� Basic Semiconductor Properties � � � � � � � � � � � � � � � � � � � � � � ��
����� Charge Carriers � � � � � � � � � � � � � � � � � � � � � � � � � � � ��
iv

���� Intrinsic Charge Carrier Concentration � � � � � � � � � � � � � � ��
����� Mobility � � � � � � � � � � � � � � � � � � � � � � � � � � � � � � � ��
�� The np Semiconductor Junction � � � � � � � � � � � � � � � � � � � � � � ��
��� Micro�Strip Detectors � � � � � � � � � � � � � � � � � � � � � � � � � � � � �
��� Summary � � � � � � � � � � � � � � � � � � � � � � � � � � � � � � � � � � ��
Tracking Reconstruction ��
��� Reconstruction � � � � � � � � � � � � � � � � � � � � � � � � � � � � � � � ��
����� Tracking � � � � � � � � � � � � � � � � � � � � � � � � � � � � � � � ��
�� Summary � � � � � � � � � � � � � � � � � � � � � � � � � � � � � � � � � � ��
� Multiple Mass Hypothesis Analysis �
��� Methodology � � � � � � � � � � � � � � � � � � � � � � � � � � � � � � � � ��
�� Electron Results � � � � � � � � � � � � � � � � � � � � � � � � � � � � � � � ��
��� Muon Results � � � � � � � � � � � � � � � � � � � � � � � � � � � � � � � � ��
��� Kaon Results � � � � � � � � � � � � � � � � � � � � � � � � � � � � � � � � ��
��� Proton Results � � � � � � � � � � � � � � � � � � � � � � � � � � � � � � � ��
��� The E�ect of Changing the Sigma Value � � � � � � � � � � � � � � � � � ��
��� Recommendation � � � � � � � � � � � � � � � � � � � � � � � � � � � � � � ��
� Conclusion
��� Summary � � � � � � � � � � � � � � � � � � � � � � � � � � � � � � � � � � ��
Bibliography ��
v

List of Tables
��� Electron Momentum Cuto�s �GeV c� for �S � ���� at a ��� CL � � � ��
�� Muon Momentum Cuto�s �GeV c� for �S � ���� at a ��� CL � � � � ��
��� Kaon Momentum Cuto�s �GeV c� for �S � ���� at a ��� CL � � � � � ��
��� Proton Momentum Cuto�s �GeV c� for �S � ���� at a ��� CL � � � � ��
��� Momentum Cuto�s �GeV c� for Various Values of �S at a ��� CL � � ��
vi

List of Figures
�� Cartoon of an e�e� collision and the resulting BB pair� � � � � � � � � � �
��� Layout of the BABAR detector � � � � � � � � � � � � � � � � � � � � � � � ��
�� SVT view in a plane containing the beam axis� � � � � � � � � � � � � � � ��
��� Cross�sectional view of the SVT in the plane orthogonal to the beam axis� ��
��� Side view of the BABAR drift chamber� � � � � � � � � � � � � � � � � � � � �
��� Cell layout in the BABAR drift chamber� � � � � � � � � � � � � � � � � � � �
��� Schematic of a single radiator bar of a DIRC counter� � � � � � � � � � � �
��� Side view of the EMC calorimeter� � � � � � � � � � � � � � � � � � � � � �
��� The IFR Barrel � � � � � � � � � � � � � � � � � � � � � � � � � � � � � � � �
��� Side view of the BABAR drift chamber� � � � � � � � � � � � � � � � � � � � �
�� �� ns isochrones in a typical BABAR drift chamber cell� � � � � � � � � � � ��
��� Energy band structure of insulators� semiconductors� and metals� � � � ��
�� Schematic diagram of an np junction� � � � � � � � � � � � � � � � � � � � �
��� �S vs� Monte Carlo Momentum for pz� d� �� and z for an Electron� � � �
�� �S�pt� vs� Monte Carlo Momentum for an Electron� � � � � � � � � � � ��
��� Electron �S�pt� distribution for �� � p � � GeV c � � � � � � � � ��
��� �S vs� Monte Carlo Momentum for pz� d� �� and z for a Muon� � � � � ��
��� �S�pt� vs� Monte Carlo Momentum for a Muon� � � � � � � � � � � � � � ��
��� Muon �S�pt� distribution for ��� � p � ��� GeV c � � � � � � � � � � ��
vii

��� �S vs� Monte Carlo Momentum for pt� d� �� and z for a Kaon� � � � � � ��
��� �S�pz� vs� Monte Carlo Momentum for a Kaon � � � � � � � � � � � � � ��
��� Kaon �S�pz� distribution for �� � p � �� GeV c � � � � � � � � � � � �
���� �S vs� Monte Carlo Momentum for pz� d� �� and z for a Proton � � � � ��
���� �S�pt� vs� Monte Carlo Momentum for a Proton � � � � � � � � � � � � ��
��� Proton �S�pt� distribution for ��� � p � �� GeV c � � � � � � � � � � ��
���� The E�ect of Changing the Sigma Value on Cuto� Momentum� � � � � ��
viii

Quotes
In the beginning the Universe was created� This has made a lot of people very angry
and has been widely regarded as a bad move�
� Douglas Adams
I don�t pretend to understand the Universe � it�s a great deal bigger than I am�
� Thomas Carlyle
A friend of mine once sent me a post card with a picture of the entire planet Earth
taken from space� On the back it said� �Wish you were here��
� Steven Wright
ix

Acknowledgments
Let�s see whom do I have to thank� Ah yes� I suppose that I owe the most gratitude
to my supervisor Dr� Janis McKenna� Her energy rivals that of the Energizer bunny
and without it I fear that she would not have been able to correct my many grammar
and typing mistakes� I especially wish to thank her for all those free dinners that she
and her husband paid for � � of which were steak�
My thanks also go out to Chris Hearty and Dave Axen for providing comments and
corrections�
My fellow o�ce dwellers also deserve some credit for putting up with my choice of
music and sometimes spontaneous outbursts� They include Douglas Thiessen� Jiansen
Lu� and Roby Austin�
While at SLAC I got to enjoy the many benets of being around so many intelligent
people at the top of their eld � I also got the enjoy the thrill of taking unsanctioned
electric cart rides down the klystron gallery and down to the BABAR pit area� I would
like to thank Stephen Scha�ner for putting up with my endless amount of questions
and Charlie Young for dealing with all my Beta concerns�
Lastly I would like to thank my parents for always putting up with my sometimes crazy
ideas and their continued support of all my endeavours� The fact that they are half
way across the country has reduced my stress level by many orders of magnitude and
x

I am sure that after reading this thesis they will come to the conclusion that their son
is further out there than mere geography dictates�
xi

Chapter �
Introduction
The Big Bang created the universe some �� billion year ago� The very early universe was
lled with matter� antimatter� and energy� Two of these quantites� matter and energy�
are still prevalent in today�s universe� But one may then ask� �what happened to all
the antimatter�� Upon combination� matter and antimatter annihilate one another in a
burst of energy� If the early universe consisted of equal amounts matter and antimatter
then we would not exist today� One is then forced to suppose that there was a slight
asymmetry between the quantities of matter antimatter which would then account for
there being any matter in the present day universe at all�
��� The Sakharov Criteria
In an attempt to explain the matter antimatter asymmetry in the universe A�D�
Sakharov ��� proposed that the following three requirements be satised� �i� a non�
conservation of baryons� �ii� a process of CP violation� and �iii� the absence of ther�
modynamic equilibrium�
�

Chapter �� Introduction
����� Baryon Non�Conservation
The asymmetry between matter antimatter manifests itself in an imbalance between
the numbers of baryons and antibaryons present in the universe� If such a baryon anti�
baryon imbalance does exist it would mean that baryons could decay into non�baryons
�the opposite being true as well�� As an example� imagine a baryon� X� decaying
into quarks� q� and an electron� e�� through the reaction X � qq � e� �similarly an
antibaryon through the process X � qq � e��� If this process were possible� then
baryon number would not be conserved as the products on the right side of the above
equations are mesons and leptons� Although certain Grand Unied Theories �GUTs�
predict baryon non�conservation� to date no experimental evidence has been gathered
to support the existence of baryon number non�conservation�
����� The Process of CP Violation
Taken alone� a baryon non�conserving interaction could not likely account for all the
matter antimatter irregularity in the universe� The only way an excess of quarks over
antiquarks could develop is if the partial decay rate of the X to a quark was slightly
greater than that of anX to an antiquark� This mechanism� of favouring the production
of matter over antimatter �or vice�versa�� is called the process of CP violation� This
important subject is dealt with in more detail in Chapter �
����� Thermal Equilibrium Lost
The last Sakharov condition deals with the evolution of the universe from a state
of thermal equilibrium to a state of non�equilibrium� This is needed because while
the universe is in thermal equilibrium matter and antimatter are constantly being
interchanged with energy� In such a state� any asymmetry between the matter and

Chapter �� Introduction �
antimatter that may have developed would be erased�
The current scenario for the evolution of the universe is that initially baryons and
antibaryons existed in equal proportions� At some later time� processes that violate
CP and baryon number conservation started to occur which led to an excess of baryons
over antibaryons� This imbalance was preserved by having the universe out of thermal
equilibrium� After a short while the baryon number violating reactions were suppressed
and the baryon excess in the universe was �frozen in�� The remaining antibaryons
combined with some of the baryons and produced photons� After this� the only particles
left over were photons and baryons� which is what populates the universe today�
��� Summary
As the previous argument outlined� CP violation is an essential ingredient in the recipe
of matter antimatter asymmetry� The BABAR experiment will experimentally examine
this important aspect in explaining the evolution of the universe�
Excellent track tting and particle species identication is essential for the BABAR
experiment to succeed� This thesis will deal with the investigation of multiple ttings
of tracks of unknown species in the BABAR detector� Of the ve types of charged particle
species detected �electrons� muons� pions� kaons� and protons�� the most abundant are
the pions� The identication of these tracks are not known a priori� Because of this�
all tracks are tracked as a pion by default� Given the momentum dependence on
the accuracy of results from this default choice of particle species� a better algorithm
needed to be developed� Specically� at what momentum is it benecial� in terms of
accuracy� to track the unknown particles as all ve particle species rather than as just
the default pion choice�

Chapter �
CP Violation
There are three discrete transformations one can perform on a given object that are of
interest in the attempt to understand CP violation� The rst is charge conjugation�
denoted by C� When performed it changes the particle into its antiparticle� Consider
a state Xj�x� t �� when acted upon by C�
CXj�x� t � Xj�x� t �� ����
where X denotes the antiparticle of X� Another transformation� parity or P � replaces
an object with its mirror image and rotates it ��� degrees about the axis perpendicular
to the mirror� Using the same state as above one gets�
PXj�x� t � Xj � �x� t � � ���
Another operation is called time reversal or just simply T � As its name implies it
reverses the direction of time when applied to a state
TXj�x� t � Xj�x��t � � ����
A system is said to exhibit a given symmetry if the action of a certain transformation
leaves that system unchanged as far as physical laws are concerned� Charge conjugation
and parity when applied individually are not symmetries of nature� It was thought that
�

Chapter �� CP Violation �
the combination of CP would however be a conserved quantity� This idea was shattered
in the early �����s when it was discovered that the kaons� K�S and K
�L� are not invariant
with respect to CP symmetry ��� Later it was shown that the Standard Model �SM�
does indeed allow CP to be violated in the presence of three quark generations ����
However the allowed amount of CP violation in the SM is likely not su�cient to account
for the level of asymmetry needed to explain the matter antimatter asymmetry of the
universe ����
Below is a further explanation of what CP violation is and how its measured� For an
excellent and more detailed review and discussion of CP violation please see section �
in The BABAR Physics Book ����
��� A Brief History of CP Violation
It is benecial rst to see where one has been before attempting to go further� CP
violation was rst discovered in the neutral kaon system and it is with this topic that
this discussion begins�
����� The Neutral Kaon System
Kaons were discovered in cosmic rays by physicists in Europe shortly after the end of the
Second World War� They are neutral particles that decay into positive and negative
�or neutral� pions� Because of their relatively long life�times they were assigned a
quantum number called strangeness� The K� meson is assigned a strangeness of ��
and the pions it decays to are each said to have � strangeness� The antiparticle partner
to the neutral kaon� the K�� is given a strangeness of ��� The K� and K
�both decay

Chapter �� CP Violation �
into two pions
K� � ��� K� � �� ����
K� � ��� K
� � ��
It was unusual to have separate particles decaying into exactly the same nal state�
So much so that there was a real problem of how you should distinguish them at all�
In ���� Murray Gell�Mann and Abraham Pa!s postulated that the K� and K�are
coupled via their nal states and that during decays are not observed separately but in
two �normal modes� characterized by two di�erent lifetimes ���� Gell�Mann and Pa!s
said that CP symmetry would reveal information about the �normal modes� or the
proper linear combination of K� and K�� Letting the CP operation act on a state of
two pions one gets
CP j�� � �����j�� �
��j�� � ����
since pions are odd under a parity transformation� Now if one tries to perform the
same operation on a system of three pions the outcome turns out to be a state that
has a CP eigenvalue of ���
CP j��� � �����j��� �
��j��� � ����
CP acting on any state twice gives back the initial state again�
�CP ��Xj�x� t � Xj�x� t � � ����
This characteristic of the CP operation can be summed up by saying that it has two
eigenvalues� �� and ��� This lead to a denition for the two �normal modes� of the K

Chapter �� CP Violation �
system" one combination being symmetric and the other antisymmetric�
jK� � �p�jK� � �jK�
�� ����
jK� � �p�jK� � �jK�
��� ����
Solving for K� and K�one nds
jK� � �p�jK� � �jK� �� �����
jK��
�p�jK� � �jK� ��� �����
Described in this way� if CP were a perfect symmetry� a beam of K� mesons would be
composed of equal parts K� and K�� The action of CP on jK� � and jK�� may be
deduced from the above denitions�
CP jK� � jK��
CP jK�� jK� � ����
If CP was respected by the mechanism responsible for the decay of theK meson system
then the nal state would either consist of two or three pions� Letting CP act on the
symmetric state� K�� gives back the same state with an eigenvalue of ���
CP jK� � CP ��p��jK� � �jK�
��
�p�jK�
� �jK� ��
jK� � �����
But CP acting on the antisymmetric state� K�� yields an eigenvalue of ���
CP jK� � CP ��p��jK� � �jK�
��

Chapter �� CP Violation �
�p�jK�
� �jK� ��
��� �p��jK� � �jK�
��
��jK� � �����
It was found that the K� had a shorter lifetime than the K�� which lead to the conven�
tion of calling the symmetric state KS and the antisymmetric state KL� So if CP was
conserved in the K system then the symmetric state could only decay into two pions
�but not three� and the antisymmetric state is forced to decay into three pions only
�not two�� Since the rate of decay for a particle system depends on the excess energy
available �or phase space�� the KS and KL will have dramatically di�erent lifetimes
because the mass of a K is ���� MeV while the mass of a pion is only ���� MeV� It isclear to see that there is more kinetic energy available� hence more phase space� for the
two pion decay than the three pion decay� This huge di�erence in phase space is why
there is such a large di�erence in the K�S and K
�L lifetimes� The lifetime of a KS is only
����� x �����s� compared to the lifetime of a KL which is ���� x ����s ���� A beam of
kaons would initially contain equal parts of KS and KL but if one waited long enough�
all the KS would decay and only the KL would remain� This fact also provided a test
of CP symmetry� Since the KL is odd under CP then it is forbidden to decay into two
pions� ��� a CP even state� It was experimentally discovered that KL did indeed
decay into �� about � out of every ��� times ���� It then had to be conceded that
CP was not a perfect symmetry after all� but just a nearly perfect symmetry�
Chapter �� CP Violation �
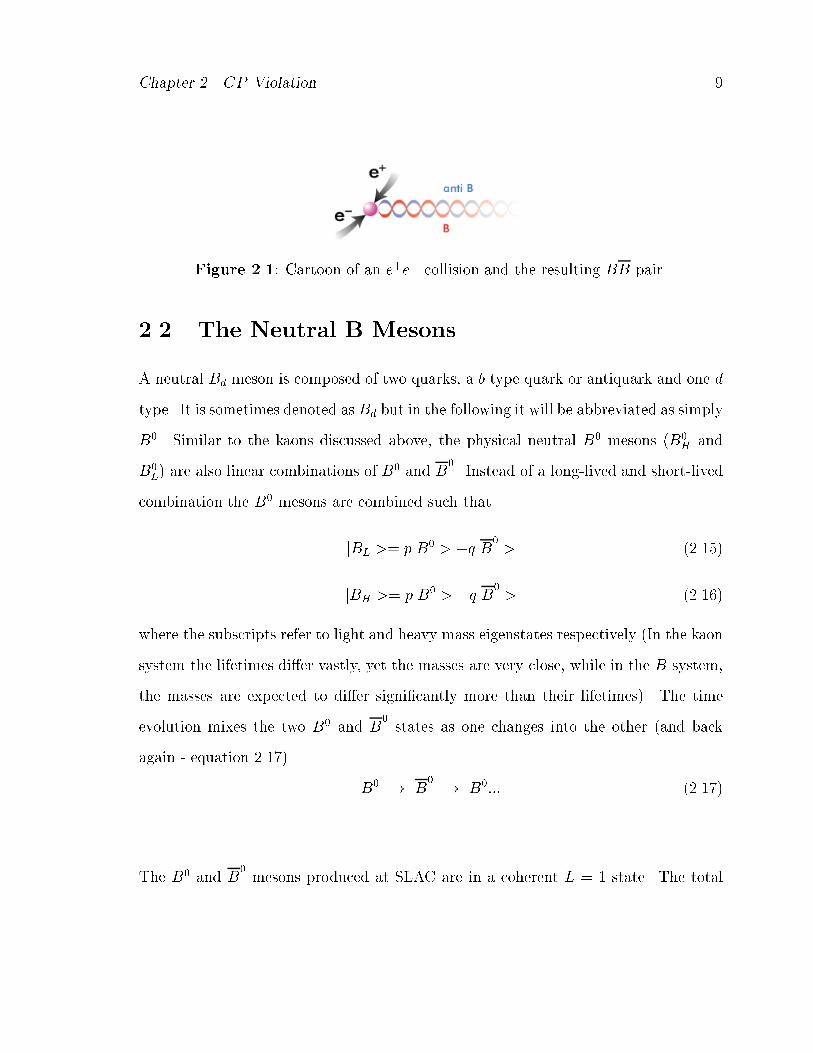
Figure ���� Cartoon of an e�e� collision and the resulting BB pair�
��� The Neutral B Mesons
A neutral Bd meson is composed of two quarks� a b type quark or antiquark and one d
type� It is sometimes denoted as Bd but in the following it will be abbreviated as simply
B�� Similar to the kaons discussed above� the physical neutral B� mesons �B�H and
B�L� are also linear combinations of B
� and B�� Instead of a long�lived and short�lived
combination the B� mesons are combined such that
jBL � pjB� � �qjB�� �����
jBH � pjB� � �qjB�� �����
where the subscripts refer to light and heavy mass eigenstates respectively �In the kaon
system the lifetimes di�er vastly� yet the masses are very close� while in the B system�
the masses are expected to di�er signicantly more than their lifetimes�� The time
evolution mixes the two B� and B�states as one changes into the other �and back
again � equation �����
B� � B� � B���� �����
The B� and B�mesons produced at SLAC are in a coherent L � state� The total
Chapter �� CP Violation ��
angular momentum for a system is given by
J L � S �����
where L is the angular momentum and S is the combined spin of the particles� SLAC
is operating at the #��S� resonance which is a J � state� Since the B� and B�
produced from the decay of the #��S� particle have zero spin they must be in an
L � state for the conservation of angular momentum �equation ���� to hold� All
this means is that the two components of a physical B meson evolve in a coherent
state so that at anytime there is exactly one B� and one B�present �gure ���� as
Bose symmetry states that a pair of identical bosons would have to be in a symmetric
state� If two B�s are identical then the overall wavefunction would be symmetric� but
the L � state is antisymmetric� Therefore� the two components of a B meson cannot
both be a B� or B�� but must be one of each� When one of the B� particles decays� the
other continues to evolve� and depending on the time di�erence between the decays of
the rst and second B�� there is a possibility of detecting an event with two nal state
B�s or B�s� To measure CP asymmetries one looks for events were one B decays to a
nal CP eigenstate and the other to a �tagging� mode � that is one that identies its
b�$avour�
��� Three Types of CP Violation in B Decays
In the Standard Model the B mesons can violate CP symmetry in one of the following
three ways� �i� CP violation in decay� �ii� direct CP violation in mixing� and �iii� CP
violation in the interference between decays with and without mixing� To date there
is no experimental evidence for CP violation in B decays at all�

Chapter �� CP Violation ��
����� CP Violation in Decay
This occurs when the transitions to the nal states for the B� and B�are not of equal
magnitude� As an example� if a B� decays according to�
B� � X� �����
where X is a nal state consisting of or more particles� then the corresponding B�
decay would look like
B� � X� ����
where X is the charge conjugate of the X state� If the decay rate for the processes in
equations ��� and �� are not equal then the system exhibits CP violation in decay�
This is often referred to as direct CP violation� The asymmetries in charged B decays
are from CP violation in decay�
����� CP Violation in Mixing
This occurs when the mass eigenstates are di�erent from the weak eigenstates� This
type of CP violation has been seen in the neutral kaon system� It is also referred
to as indirect CP violation� The magnitude of this e�ect would be dependent on the
di�erence in lifetimes of the two B decays� Since the neutral B mesons have a negligible
fractional di�erence in lifetime� O������� this e�ect is expected to be small in the Bsystem� but is large in the kaon system� where the K masses di�er by orders of
magnitude�

Chapter �� CP Violation �
����� CP Violation in the Interference Between Decays With
and Without Mixing
To explore this e�ect consider a neutral B decay into a nal CP eigenstate� Both the
B� and B�can decay to the same nal state� To observe the CP violation� the decays
of a time�evolving neutral B� state that began as a B� at time zero are compared to
one that started out as a B�� If one starts with a B�� then the amplitude for the
process
B� � B� � X ����
interferes with the process in equation ���� The quantum mechanical interference
between these two processes leads to CP violation in the system�
��� CP Violation in BABAR
The BABAR experiment is designed to be very sensitive to the CP violation denoted as
the third type described above �although BABAR is also sensitive to the rst two types
� it is optimized for the third�� Experiments done at SLAC in ���� found that the B
mesons have a lifetime of order of a picosecond� This long lifetime is benecial� as it
improves the chances that a B� would oscillate into a B�before decaying� Because the
lifetime is of the order of the B� mixing parameter� one would expect �� B� � B�
oscillation before the B decayed� B mesons can be easily produced from an electron
positron collider tuned to a center of mass energy of ��� GeV� which is the #��S�resonance� If the beams have equal energies� then the resulting B mesons would be
roughly stationary � making it hard to measure the decay time� Measuring the lifetime
directly would be a di�cult task� Instead� if a particle is boosted signicantly with
respect to the center of mass frame� a measurement of the distance a particle travels�

Chapter �� CP Violation ��
and its velocity� allow one to calculate its lifetime ���c d�� where d is the decay
distance� is the lifetime� � is the velocity c and � is the relativistic boost� It was
proposed by Pier Oddone of Lawrence Berkeley National Laboratory that if the electron
and positron beams had di�erent energies� then the resulting B mesons would be
moving as the center of mass after the collision would be moving boosted ���� and
hence easier to measure the small distances the B mesons move� This is desirable� as
then one only has to measure the position of production and decay of a B meson to
determine its lifetime� The PEP�II collider at SLAC stores an electron beam of energy
���� GeV and a positron beam of ���� GeV� In this conguration� the B mesons
produced move at approximately half the speed of light and travel approximately ��
microns before decaying� This distance can be measured accurately but it requires a
detector that is capable of measuring distances with an intrinsic resolution of � ���m�in order to achieve a vertex resolution of approximately �� �m�
��� Summary
After being rst observed in the kaon system the origin of CP violation is still a
puzzle to physicists� It is hoped that the BABAR experiment will shed some light on
this intriguing problem and determine whether its origins are indeed in the current
Standard Model�

Chapter �
The BaBar Detector
The main goal of the BABAR experiment is to measure CP asymmetries in the neutral
B meson system to determine if CP violation originates in CKM mixing in the SM�
To facilitate this� a new detector has been built at SLAC� The various collaboration
members from each country were assigned specic parts of the overall detector� At
this moment the completed sub�detectors are being fully assembled at SLAC� In the
building planning of such a detector� numerous criteria needed to be addressed�
� The need for an asymmetric detector� Since the two beams are of unequal energythe decay products are boosted forward in the laboratory frame�
� The fact that various machine elements have to come very close to the interactionregion� Because of the high luminosities needed in the experiment unusual beam
optics must be placed within close proximity of the interaction point where the
two beams cross�
� A need for outstanding vertex resolution� The B mesons travel roughly parallel
to the z�axis so that the decay times are measured via the di�erence in their
decay positions�
� To be able to perform tracking over a wide momentum range � �� MeV c �
pt � � � GeV c�
��

Chapter �� The BaBar Detector ��
Figure ���� Layout of the BABAR detector� See text for key�
� To have the ability to discriminate between electrons� muons� pions� kaons andprotons over a wide kinematic range� The process of tagging can only be done
with a high e�ciency if electrons� muons� and kaons can be identied� Also a �K discrimination at high momentum ��� GeV� is essential in order to distinguish
the di�erent decay channels �B� � ��� B� � K��� B� � ���� B� � K��
and B� � K��
� To be able to detect photons and �s over the wide energy range � � MeV � E
� � � GeV�
� To have neutral hadron identication capability�
After all the above required criteria were assessed� a design was established and the
detector constructed� A schematic of the detector is shown in Figure ���� The major

Chapter �� The BaBar Detector ��
subsystems of the detector are�
�� A Silicon Vertex Tracker �SVT�� This provides precise position information on
charged tracks and also is the sole tracking device for very low energy charged
particles �eg pt � ��� MeV c��
� A Drift Chamber �DCH� lled with a helium�based gas� in order to minimize
multiple scattering� This is responsible for the main momentum measurements
for charged particles and helps in particle identication �PID� through energy
loss measurements �dE dx� and also contributes to the trigger�
�� A Detector of Internally Re$ected Cherenkov light �DIRC�� This is designed and
optimized for charged hadron PID�
�� A Cesium Iodide Electromagnetic Calorimeter �EMC�� It provides good identi�
cation and energy measurements for neutral particles as well as electrons down
to an energy of about ��� GeV as well as contributing to the trigger�
�� A superconducting coil� which provides a ��� T solenoidal magnetic eld�
�� An Instrumented Flux Return �IFR� for muon identication down to about ���
GeV and neutral hadron PID�
The BABAR detector is extensively described in the Technical Design Report �TDR�
����� This chapter serves only to highlight the main features of each sub�detector�
��� The Silicon Vertex Tracker
The main task of the vertex detector is to reconstruct the spatially separated decay
vertices of the two primary B mesons in order to determine the time between the two

Chapter �� The BaBar Detector ��
Figure ���� Detail of the inner part of the apparatus� showing the cross�sectional viewof the silicon vertex tracker in a plane containing the beam axis�
decays� The SVT also provides excellent angular information as it is not so severely
limited by the multiple scattering which plagues the other sub�detectors� For charged
particles with transverse momenta less than ��� MeV c� the SVT supplies all the
tracking information as such low momentum particles will not reach the drift chamber�
The basis on which BABAR hopes to observe CP violation is to measure the separation
between the two B vertices with a precision better than one half the mean separation
of � ���m at PEP�II ����� This works out to a precision of better than �� �m for a
single vertex position measurement� Better precision would aid in pattern recognition�
vertex reconstruction and background rejection� so the SVT is designed to have an
intrinsic hit resolution of ��� ���m for the inner layers and ��� ���m for the outer
ones�
Figures �� and ��� show two di�erent views of the Silicon Vertex Tracker� The SVT

Chapter �� The BaBar Detector ��
x
y
Figure ���� Layout of the BABAR silicon vertex tracker� Cross�sectional view in theplane orthogonal to the beam axis�
consists of ve concentric cylindrical layers of double�sided silicon wafer detectors�
Each layer is divided in azimuth into modules� The three inner layers have � detector
modules� Layers � and � contain �� and �� detector modules respectively� The two
outer layers are further divided into �a� and �b� modules� with �a��type modules
situated at a slightly smaller radius than the corresponding �b��type ones �Fig �����
which allows the detectors to overlap� A pin�wheel type arrangement is employed in
the inner modules to guarantee a similar overlap�
Each module is divided into two electrically separated forward and backward half�
modules� The inner sides of the detectors have strips oriented perpendicular to the
Chapter �� The BaBar Detector ��
beam direction to measure the z coordinate� while the outer sides have longitudinal
strips� which allow for the � coordinate measurement� The modules are supported on
Kevlar ribs mounted to the end cones located in the forward and backward directions�
A carbon�ber space frame supports the assembly� which is mounted on the PEP�II
nal focusing magnets�
The BABAR SVT has ��� silicon detectors in total� covering an area of about �m� with
a total of � ���� ��� readout channels�
��� The Drift Chamber
The drift chamber is the primary tracking device of the BABAR detector� It provides
up to �� measurements of space coordinates per track� which will ensure a high recon�
struction e�ciency for tracks with transverse momenta greater than ��� MeV c� The
DCH performance goals are to provide spatial resolution better than ����m� averaged
over the cell in the r � � plane� and to supply particle identication �PID� for low
momentum tracks by dE dx� � For low momentum tracks� the momentum resolution
is limited by the multiple coulomb scattering in the inner cylinder of the DCH as well
as in the silicon vertex detector�
����� The Drift Chamber Design
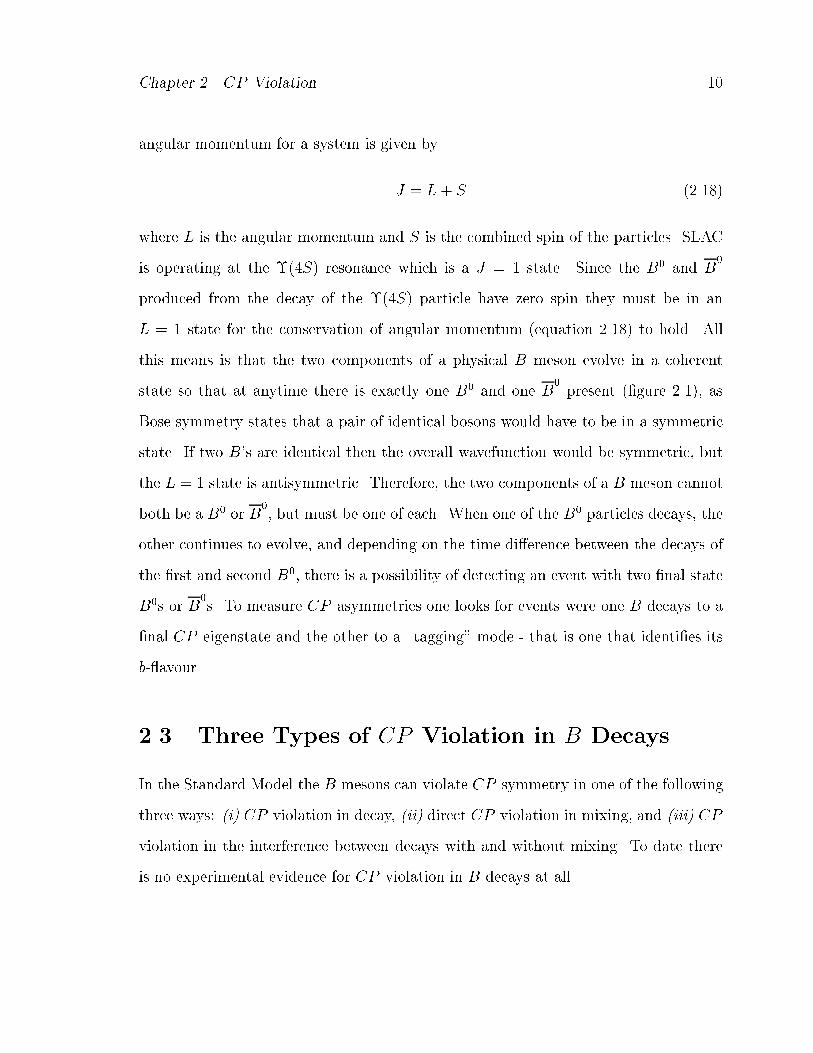
A schematic view of the BABAR drift chamber is shown in gure ���� The DCH is a
�� cm long cylinder with inner radius of ��� cm and outer radius of ���� cm� Since
the collision products are boosted forward in the lab frame� the detector is designed
to reduce the amount of material in the forward end� To accomplish this� the forward
�dE�dx is the energy loss per unit length for a particle traversing a particular medium�
Chapter �� The BaBar Detector �
IP1618
469236
324 681015 1749
551 973
17.1920235
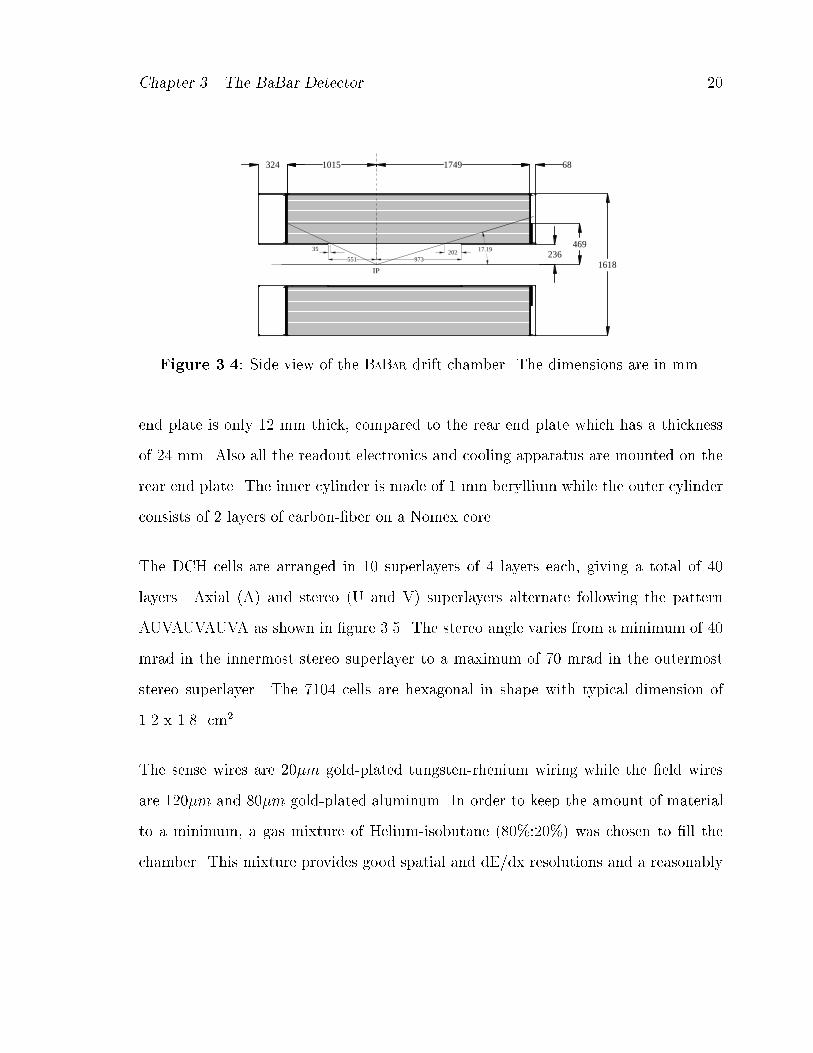
Figure ���� Side view of the BABAR drift chamber� The dimensions are in mm�
end plate is only � mm thick� compared to the rear end plate which has a thickness
of � mm� Also all the readout electronics and cooling apparatus are mounted on the
rear end plate� The inner cylinder is made of � mm beryllium while the outer cylinder
consists of layers of carbon�ber on a Nomex core�
The DCH cells are arranged in �� superlayers of � layers each� giving a total of ��
layers� Axial �A� and stereo �U and V� superlayers alternate following the pattern
AUVAUVAUVA as shown in gure ���� The stereo angle varies from a minimum of ��
mrad in the innermost stereo superlayer to a maximum of �� mrad in the outermost
stereo superlayer� The ���� cells are hexagonal in shape with typical dimension of
�� x ��� cm��
The sense wires are ��m gold�plated tungsten�rhenium wiring while the eld wires
are ���m and ���m gold�plated aluminum� In order to keep the amount of material
to a minimum� a gas mixture of Helium�isobutane �������� was chosen to ll the
chamber� This mixture provides good spatial and dE dx resolutions and a reasonably

Chapter �� The BaBar Detector �
Figure ���� Cell layout in the BABAR drift chamber�

Chapter �� The BaBar Detector
short drift time� Nominal voltages of ���� V for the sense wires� ��� V for the eld�
shaping wires� and ��� V for the eld wires at the boundaries of the superlayers are
supplied by high voltage assemblies mounted on the rear end plate�
For drift�time measurements� the electronics detects the leading edge of the signal from
the charge arriving at the sense wires and then digitizes the time with a � ns resolution�
The dE dx measurements require integrating the total charge in the pulse�
��� The DIRC
The DIRC is a new type of Cherenkov�based detector devoted to PID� Specically it
is designed to provide excellent kaon identication for both tagging purposes and at
high momenta for rare B meson decays� To di�erentiate the two�body decay modes
B� � �� and B� � K��� the DIRC must be able to separate pions from kaons
up to about � GeV c� at large dip angles in the laboratory frame� The DIRC will also
aid in muon identication in the low momentum range where the IFR is ine�cient
�� ��� MeV c��
The DIRC operates on the principle that charged particles traversing a DIRC quartz bar
produce Cherenkov light� Through internal re$ections the Cherenkov light is carried
to the backward end of the bar �forward�going light is rst re$ected from a mirror
located at the front end of the bar � see gure ����� The high optical quality of the
quartz bar preserves the angle of the emitted Cherenkov light� The measurement of
this angle� along with knowledge of track angle and momentum from the drift chamber�
allows a determination of the particle velocity� from which its mass can be deduced�
An advantage of the DIRC for an asymmetric collider is that the high momentum
tracks are boosted forward� which causes a much higher light yield than for particles

Chapter �� The BaBar Detector �
Particle Trajectoryn2
Plan View
n2
Side View
DetectorSurface
Parti
cle T
raje
ctor
y
n3
Quartz
n3
n3
n3
n1
n1
tz
z
y
z
x
ty
tx
7172A55-94
zθD
Figure ��� Schematic of a single radiator bar of a DIRC counter� The particletrajectory is shown as a connected line of dots" representative trajectories of Cherenkovphotons are shown by lines with arrows�
at normal incidence� This is due to two e�ects� the longer path length in the quartz
and a larger fraction of the produced light being internally re$ected in the bar�
The DIRC is made up of ��� long straight polished bars of synthetic quartz with rect�
angular section� arranged in a ��sided polygonal barrel� The DIRC radiator extends
through the steel of the solenoid $ux return in the backward direction to bring the
Cherenkov light outside the tracking and magnetic volumes�
At the instrumented end of the quartz bars� the Cherenkov image is permitted to
expand and be projected into a tank of puried water� called the Stando� Box� Water
was chosen because its refractive index matches pretty closely to that of the quartz

Chapter �� The BaBar Detector �
180.9 cm
e+e–
8184A17–96
91 cm15.8°
140.8°
IP26.9°
112.7 cm
Figure ���� The EMC layout� Side view showing dimensions �in mm� of the calorime�ter barrel and forward endcap�
bars� thus minimizing the total internal re$ection at the quartz�water interface� The
Stando� Box contains approximately ������ photo multiplier tubes �PMTs� to cover
the detector area� The PMTs are located about �� m from the end of the quartz
bars� The phototubes are located in a gas�tight volume as protection against helium
leaks from the drift chamber� The DIRC occupies only � cm in radial direction of the
detector� which allows for a relatively large radius for the drift chamber while at the
same time keeping the volume of the CsI Calorimeter reasonably low�
��� The Electromagnetic Calorimeter
The primary physics goals of the BABAR detector� which require the tagging and recon�
struction of B events containing CP eigenstate decays� are ideally suited to Cesium

Chapter �� The BaBar Detector �
Iodide �CsI� calorimetry� The need to e�ectively and cleanly reconstruct CP eigen�
states containing one or more � decays makes excellent electromagnetic calorimetry
essential� High e�ciency for low energy photons is also required to o�set the small
branching fractions typical of most CP eigenstates and to make it possible to recon�
struct nal states containing several �s� By facilitating lepton identication �e� and
e�� separation� the calorimeter also provides one of the tags needed for every CP
analysis�
The calorimeter consists of a cylindrical barrel section and a forward conic endcap
�Figure ����� Radially� the barrel is located outside the DIRC system and within the
magnet cryostat� The barrel has an inner radius of �� cm and an outer radius of ���
cm� It is located asymmetrically about the interaction point� The barrel consists of
���� CsI�Tl� crystals� arranged in �� polar�angle ��� rows of distinct crystal sizes� each
having �� identical crystals in azimuthal angle ����
The forward endcap is a conic section with front and back surfaces tilted ��o with
respect to the vertical� It contains �� CsI�Tl� crystals� arranged in � � rings� starting
at an inner radius of ���� cm from the beam line� In order to reduce the amount of
inactive material in front of the detector all the cooling� cables� and services are located
at the back�
��� The Instrumented Flux Return
Muon identication and neutral hadron detection are provided by the Instrumented
Flux Return� which makes use of the large iron structure needed as the magnet return
yoke� It is segmented and instrumented with Resistive Plate Counters �RPCs� and
consists of a central part �Barrel� and two plugs �End Caps� �gure �����

Chapter �� The BaBar Detector �
Figure ���� The IFR Barrel� layout of the RPC Modules�
An interesting feature of the BABAR experiment is the graded segmentation of the iron�
which varies from � �� cm� increasing with the radial distance from the interaction
region� This segmentation is the result of detailed Monte Carlo studies which have
shown that muon identication at low momentum and K�L detection improve� for a
given amount of absorber� as the thickness of the iron plates decreases� This e�ect
is most important in the rst absorption length� so that grading the segmentation
improves the performance without increasing the number of layers signicantly� The
iron is segmented into �� plates� giving a total thickness of �� cm in the Barrel and
�� cm in the End Caps� Each End Cap door has a hexagonal shape and is divided
vertically into halves to allow access to the inner detectors�

Chapter �� The BaBar Detector �
The main goal of the IFR detector is to achieve the highest practical muon tagging
e�ciency� About ��� of allB decays contain at least one muon in the region covered by
the BABAR detector� Charged tracks found in the DCH will be matched with segments
in the IFR and be identied using a detailed analysis of the hit patterns in the active
detectors� Neutral hadron �K�L and neutrons� identication will result from a detailed
analysis of the hit patterns in the active detectors with no track matches from the
tracking chambers�
��� Summary
The BABAR detector has taken years to plan and build� This e�ort will be justied by the
observation �though not guaranteed� a non�observation of CP asymmetry would also
have strong implications on the SM� and understanding of CP violating processes in the
neutralB meson system� But the physical detector is only the rst step in the journey of
observing� cataloging� and fully understanding the origin of CP violation� The output
from the various sub�detector components are used as input in the reconstruction
software� This software is responsible for taking all the electronic information and
making an accurate representation of what actually happened in the detector� It is
only after this is done can one see if CP violation has occurred�

Chapter �
The Drift Chamber
Drift chambers are used to detect and measure ionizing radiation� This radiation is the
result of charged particles passing through the chamber and interacting with the gas
contained inside� The three original gas type detectors were the ionization chamber� the
proportional counter and the Geiger�M!uller counter� Not until the late �����s with the
invention of the multi�wire proportional chamber did these gas ionization instruments
become a integral part of high energy physics experiments� From this renewed interest
came the development of the drift chamber as well as the time projection chamber�
Although employing the same basic principles as the proportional counter� these two
new detectors bore little resemblance to their simple predecessor�
��� Ionization Detectors
All ionization detectors work in essentially the same way� The detectors are composed
of cells� A wire running through the center of the cell� called the anode or sense
wire� is maintained at a positive voltage relative to the wires that surround it� These
surrounding wires are called cathode or �eld wires and together with the anode create
an electric eld directed from the anode to the cathode�
When a high energy particle traverses the chamber it has the potential to create
�
Chapter �� The Drift Chamber �
+
+
+
+
+
---
--
--
anode wire(positive)
charged particle
cathode wire(ground)
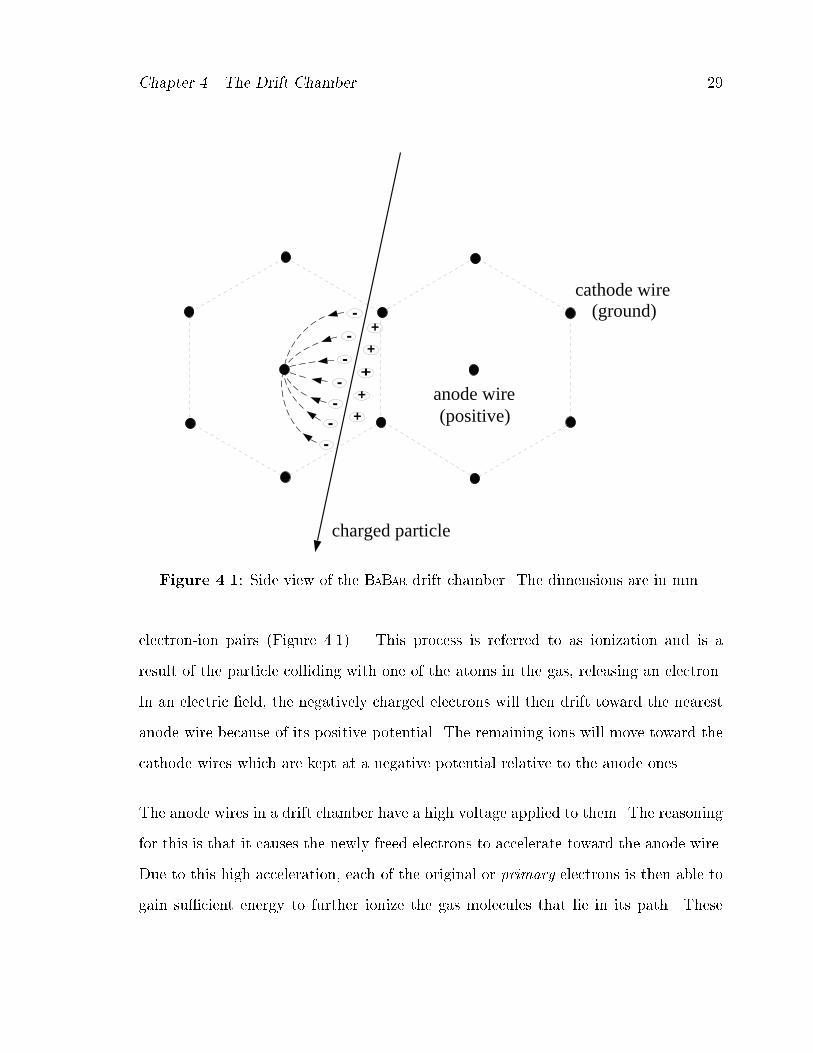
Figure ���� Side view of the BABAR drift chamber� The dimensions are in mm�
electron�ion pairs �Figure ���� � This process is referred to as ionization and is a
result of the particle colliding with one of the atoms in the gas� releasing an electron�
In an electric eld� the negatively charged electrons will then drift toward the nearest
anode wire because of its positive potential� The remaining ions will move toward the
cathode wires which are kept at a negative potential relative to the anode ones�
The anode wires in a drift chamber have a high voltage applied to them� The reasoning
for this is that it causes the newly freed electrons to accelerate toward the anode wire�
Due to this high acceleration� each of the original or primary electrons is then able to
gain su�cient energy to further ionize the gas molecules that lie in its path� These

Chapter �� The Drift Chamber ��
secondary electrons can then repeat the process� increasing the number of electrons
that are moving toward the anode wire� This procedure escalates and is referred to
as an ionization avalanche� If there are enough electrons in the avalanche that are
collected at the anode wire then a signal may be detected on the wire� The number of
electrons that are collected on the sense wire is directly proportional to the energy of
the charged particle that produced the primary electron� The gas gain is dened to be
the ratio of the number of electrons in the avalanche that arrive at the sense wire to
the number of initial primary ions� and is typically on the order of ��� ����
The time between the rst ionization at time t�� and the arrival of the signal at the
wire at time� t� can be measured using an external trigger �t� is also obtained from
an iteration t of all the tracks in an event�� Using this information the drift time
can be determined� If the electrons drift toward the sense wire with a known velocity�
vd� called the drift velocity� then the drift distance of the particle to the wire when it
passed through the cell can also be calculated�
x
Z t
t�
vd dt� �����
How well the position of the particle is known and the detection e�ciency is primarily
governed by the choice of gas and the cell size and geometry used in the chamber�
��� Gas Properties
Numerous gas properties dictate whether a certain gas is appropriate to ll a drift
chamber� A few of these characteristics include the type of gas� drift velocities and
how the quality for various gases re$ect on chamber stability�

Chapter �� The Drift Chamber ��
��� Gas Type Choice
The specic requirements for the BABAR drift chamber were outlined in Chapter ��
These included a gas that minimized multiple Coulomb scattering and provided good
spatial and dE dx resolutions with a reasonably short drift time� Although important
for this particular experiment� there are a number of more generic issues one faces
when deciding what gas to use to ll a drift chamber�
A drift chamber operating at room temperature can only be lled with elements that
are in a gaseous state� These include oxygen �O��� nitrogen �N��� $uorine �F��� and the
noble gases� helium �He�� neon �Ne�� argon �Ar�� krypton �Kr�� and xenon �Xe�� In the
above list only the noble gases are monatomic while the others �oxygen� nitrogen and
$uorine� are diatomic� Diatomic molecules are more complex than monatomic ones
and if molecular size is an issue� then this needs to be addressed�
A main function of the gas in a drift chamber is to aid in the production of an ionization
avalanche� Depending on whether the gas is monatomic or diatomic� this avalanche
can occur at di�erent operating anode voltages� This avalanche arises in noble gases
at a much lower anode voltage than with gas mixtures comprised of complex diatomic
molecules� Due to the numerous non�ionizing energy dissipative modes present in the
diatomic molecules� they are able disperse energy through collisions or disassocations
into smaller molecules� These modes are not accessible in the noble gas molecules
which can only return to their ground states by the release of a photon� This photon
is then able to continue the process of ionization avalanche and hence a lower anode
voltage is needed to obtain a su�ciently large pulse arriving at the wire�
At high voltages there is a problem with having only noble gases present in the chamber�
Chapter �� The Drift Chamber �
The photon released during a noble gases de�excitation is ultraviolet� As a consequence�
it possesses an energy ����� eV for argon� ���� eV for helium����� that is greater than
the work function� of any metal cathode ���� eV for a gold plated cathode������ These
newly freed electrons then repeat the process of ionization on their journey toward the
anode� The solution to this dilemma is to add what is called a quencher gas� This
quencher gas is a complex molecule� such as carbon dioxide �CO�� or iso�butane �i�
CH���� that retards the ejection of these unwanted electrons from the cathode wires�
This is accomplished because these complex molecules have a large number of non�
radiative excited states � both rotational and vibrational� Utilizing these states� it is
possible for a complex molecule to absorb and then dissipate a wide range of photon
energies� thereby eliminating the ultraviolet radiation before it reaches the cathode�
Since these modes do not result in a production of an electron� the extra ionization
process is stopped from occurring�
Although the quencher gas solves one problem it creates another� the process of wire
aging� This occurs when liquid or solid polymer deposits begin to form on the chamber
wires� seriously a�ecting the operation of the drift chamber �����
����� Electron Di�usion
The limit on the spatial resolution of a drift chamber is governed predominantly by
the di�usion of electrons in the chamber medium as they move toward the anode
wire ����� In the absence of an electric eld� the electron�ion pair formed by the
particle di�uses uniformly outward� from regions of high concentration to regions of
low concentration from their point of creation� The concentration of electrons at a
�The work function of a metal is the energy that a photon needs in order to just free one of theoutermost electrons�

Chapter �� The Drift Chamber ��
later position x after di�using at time t is approximately Gaussian� and is given by the
following expression �����
dN
dx
N�p�D t
exp
�� x�
�D t
�����
where x is the distance from the point of ionization�N� is the initial number of electrons
at x � and t �� and D is the di�usion coe�cient which� from kinetic theory� is
given by�
D
�u�
��
�average
�
�l u �����
where u is the mean thermal velocity of the electron discharged by the incoming ionizing
particle� � is the frequency of electron collisions with the chamber gas and l is the
mean distance that the electron travels before colliding with an atom or molecule in
the chamber medium �called the mean free path��
Comparing Equation �� to the form of a Gaussian distribution� distributed about
x ��
y �
�pexp
�� x�
��
�� �����
the standard deviation of the electron distribution� or the spatial spread of electrons
at x is identied as�
��x� pDt
sD � l
vd�x�
sme u
�
eE�x�l� �����
where E�x� is the electric eld� e is the charge of an electron and me is the electron
mass� The dependence of spatial resolution on the size of the cell is now explicitly
clear� The di�usion distribution varies as the square root of the drift length� which
means that the longer the path the electron travels� the more di�use the distribution
will be due to an increase in the number of collisions� Ultimately� a high di�usion
will adversely a�ect the spatial resolution of a drift chamber since the timing for a

Chapter �� The Drift Chamber ��
dispersed group of electrons becomes di�cult to determine accurately� Therefore� a
small cell size should give improved spatial resolution as well as avoid the use of very
high voltages� With drift path lengths on the order of � cm� spatial resolution values
of less than ��� �m are expected �����
����� Drift Velocity
The drift velocity� vd� of an electron superimposed on random thermal motion in the
presence of an electric eld� is given by the expression �����
vd�x�
�
e l
me uE�x� �����
Low drift velocities lead to large drift times and therefore better position resolution
because of the improved timing resolution� In experiments such as BABAR where there
is expected to be a high count rate� a high drift velocity is required as one has to worry
about deadtime� in the drift chamber�
��� A Drift Chamber in a Magnetic Field
Another method of gaining more information from the drift chamber is by placing it
in a magnetic eld� The Lorentz force� F� is dened as�
F q v �B �����
where B is a uniform magnetic eld� The magnetic eld de$ects charged particles that
have a component of velocity perpendicular to B causing them to trace out a helix as
they propagate along the z�axis� The radius of curvature� r� for this helix is given by�
r mv sin �
q B
p sin �
q B�����
�This is the �nite time required by the detector to process an event during which time it is unableto react to any other signals�

Chapter �� The Drift Chamber ��
Figure ���� �� ns isochrones in a typical BABAR drift chamber cell�
where q is the charge of the particle� Taking the expression for the transverse momen�
tum� pt p sin �� together with Equation ��� gives�
pt r q B� �����
So if one knows the magnetic eld� then one can determine the radius of curvature and
hence the momentum of a charged particle in the drift chamber� The BABAR experiment
uses a ��� T magnetic eld which has been extensively studied� Figure �� shows the
�� ns isochrones in a typical cell of the drift chamber�
Chapter �� The Drift Chamber ��
��� Summary
The advent of the drift chamber has meant that it is now possible to measure the
trajectories of particles in high energy physics experiments with great precision� By
careful consideration on the choice of gas type� cell size and drift velocity� one can
localize particles to distances of O����m�� In the BABAR experiment this increasedaccuracy will aid in pattern recognition� and will be used in dE dx calculations�

Chapter �
The Silicon Vertex Tracker
The silicon vertex tracker is a type of detector based on the crystalline semiconductor
silicon� Work on crystal detectors was performed back in the early �����s ���� but it
was not until the late �����s that real development on these instruments began� The
basic operating principle of a semiconductor detector is analogous to gas ionization
detectors� Instead of a gas� the medium is now a solid semiconductor material� Passing
ionizing radiation creates electron�hole pairs �instead of electron�ion pairs� which are
then collected by an electric eld� The average energy required to create an electron�
hole pair is about �� times smaller than the energy needed for gas ionization� This
advantage leads to a better energy resolution� Because they are crystalline materials�
semiconductor detectors have a greater sensitivity to radiation� which limits their long
term use� To fully understand the operation of the SVT� one rst needs a brief overview
of semiconductor properties along with a general outline of semiconductor detectors�
��� Basic Semiconductor Properties
A semiconductor is a crystalline material whose outer shell atomic levels display an
energy band structure ����� This structure consists of a valence band� a �forbidden
energy gap and a conduction band �Figure ����� The energy bands are actually regions
��

Chapter �� The Silicon Vertex Tracker ��
Figure ���� Energy band structure of insulators� semiconductors� and metals�
of closely spaced energy levels which are close enough to be regarded as a continuum�
The �forbidden energy gap is a region devoid of energy levels� The conduction band
is the highest energy band� In this region� electrons are detached from their parent
atoms and are free to roam the entire crystal� In contrast� the valence band electrons
are more tightly bound and remain associated with their respective atoms�
The width of the gap and bands is determined by the lattice spacing between the
atoms� In a conductor the energy gap is nonexistent� while for insulators the gap is
large� In a semiconductor� the energy gap is intermediate in size so that only a few
electrons are excited into the conduction band by thermal energy� Therefore� when an
electric eld is applied� a small current is produced�
����� Charge Carriers
Thermal energy can excite a valence electron into the conduction band� thereby leaving
a hole in its original position� In such a state the neighbouring valence electron will

Chapter �� The Silicon Vertex Tracker ��
jump from its bond to ll this hole� This leaves a hole in the now neighbouring position�
If the next neighbouring electron repeats the process and so on� then the hole appears
to move through the crystal� The hole is positive relative to the sea of negative electrons
in the valence band and its movement through the crystal creates an electric current�
In a semiconductor� the electric current arises from two sources� the movement of free
electrons in the conduction band and the movement of holes in the valence band�
If the major charge carriers are the electrons then the semiconductor is referred to as
a n�type semiconductor� If on the other hand the holes are the ones carrying most of
the charge then the semiconductor is called a p�type semiconductor�
����� Intrinsic Charge Carrier Concentration
As stated above� electron�hole pairs are constantly being generated by thermal energy�
Simultaneously� there are a certain number of electrons and holes which recombine�
Under stable conditions� an equilibrium concentration of electron�hole pairs is estab�
lished� If ni is the concentration of electrons �or holes� and T is the temperature
then�
ni pNcNv exp�
�Eg
kT� AT ��� exp�
�Eg
kT� �����
where Nc is the number of states in the conduction band� Nv is the number of states in
the valence band� Eg is the energy gap at � K� k is the Boltzmann constant and A is
a constant independent of T � Typical values of ni are on the order of ��� x ���� cm��
for silicon at T ��� K�

Chapter �� The Silicon Vertex Tracker ��
����� Mobility
The drift velocity of the electrons and holes through a semiconductor under the action
of an externally applied electric eld are
ve �eE ����
vh �hE �����
where E is the magnitude of the electric eld and �e and �h are the mobilities of the
electrons and holes respectively� For a given material� the mobilities are functions of
E and the temperature T � For silicon at normal temperatures ����� �e and �h are
constant for E � ��� V cm� thereby making the relationship between velocity and E
linear� For E between ��� � �� V cm� � varies approximately as E����� while for E
� �� V cm� � varies as E��� At these high E values the velocity saturates� due in
part to a proportional fraction of the kinetic energy acquired by the electrons and holes
being drained by collisions with the lattice atoms�
For temperatures between ���K and ���K� � also varies approximately as T�m� In
silicon m �� for electrons and m �� for holes�
The current in a semiconductor is determined by the mobilities� The current density
J �v� where � is the charge density and v is the velocity in a semiconductor is given
by
J eni��e � �h�E� �����
where the fact that current is carried by both electrons and holes has been used�

Chapter �� The Silicon Vertex Tracker ��
��� The np Semiconductor Junction
All present day semiconductor detectors depend on the formation of a semiconductor
junction to function� A simple junction is the np junction which is formed by the
juxtaposition of a n�type material and a p�type semiconductor� One method of achiev�
ing this is to di�use su�cient p�type impurities into one end of a homogeneous bar of
n�type material so as to change that end into a p�type semiconductor �����
The np junction creates a special zone around the interface between the two materials�
Due to the di�erence in the concentration of electrons and holes between the two
materials� there is an initial di�usion of holes toward the n�region and a corresponding
di�usion of electrons toward the p�region� Consequently� the di�using electrons ll
up holes in the p�region while the holes capture electrons in the n�region �gure ����
Although initially neutral� the n and p structures begin to develop a denite charge�
Being injected with extra electrons� the p�region becomes negative while the n�region
becomes positive� This creates an electric eld across the junction that eventually
stops the di�usion process� As a result a region of immobile charge is created referred
to as the depletion zone� The electric eld gives rise to a potential di�erence across
the junction� called the contact potential� Any electron or hole created or entering the
depletion zone is swept out by the electric eld� If ionizing radiation enters this zone
and produces an electron�hole pair then a current signal proportional to the ionization
will be detected by placing contacts on either end of the junction�

Chapter �� The Silicon Vertex Tracker �
Figure ���� �a� Schematic diagram of an np junction� �b� Diagram of electron energylevels showing creation of a contact potential V��
��� Micro�Strip Detectors
In the �����s� there was a renewed interest in using semiconductor detectors in high
energy physics� This was due in part to a demonstration that showed a � �m spa�
tial resolution using a silicon micro�strip detector ���� Such a device is composed of
separate readout strips arranged at very small intervals� O��� �m�� The micro�stripdetector that BABAR is using use double�sided silicon strips� AC coupled with polysili�
con bias resistors ���� Six di�erent types of detectors are needed �I to VI� in BABAR�
each having a di�erent physical dimension� number of strips and readout pitches� The
�barrel� portion of the detector �I to V� have orthogonal strips on two sides� The strips
responsible for reading out the z coordinate are on the junction side for the model I�
II� and III detectors� and on the ohmic side for models IV and V� The strip on the
�wedge� detectors are not orthogonal on the two sides� The ohmic side� responsible
for measuring the z coordinate� has strips that with a constant width and pitch� The
junction side has strips having di�erent starting and ending pitches and is responsible
for reading out the � coordinate�

Chapter �� The Silicon Vertex Tracker ��
��� Summary
Semiconductor detectors have advanced along way since they were used primarily for
energy measurements� BABAR is employing a silicon detector with an intrinsic resolution
of � �� �m� This great precision will aid the in the position measurements of the
decaying particles in the BABAR detector and will be a valuable asset in the search for
CP asymmetry�

Chapter �
Tracking Reconstruction
The most important role of the tracking reconstruction is nding charged tracks and
providing the most accurate possible estimate of the physics parameters of the un�
derlying charged particle� E�ciency of close to ���� in CP physics events that have
a transverse momenta� pt� greater than �� MeV c is required within the acceptance
of the Silicon Vertex Tracker and the Drift Chamber� Along with the CP physics
requirements are�
�� Documentation of the e�ciency of tracking� This includes information on rates
of lost and unphysical tracks� two track resolutions� etc�
� Provide precise position and angular information to the DIRC� EMC� and IFR�
with accuracy consistent with their resolution�
�� Provide an estimate of the position of the beam spot� and do production primary
vertex nding�
In addition� many detector sub�systems require an accurate estimate of in which bunch
a given event originated� Although this will involve the use of detailed information from
other systems� responsibility for this is placed with the DCH and tracking software
because of need and opportunity�
��

Chapter �� Tracking Reconstruction ��
��� Reconstruction
The BABAR reconstruction software �� is organized as a set of Modules� which process
sequentially the data in an Event� The execution of these modules is controlled by
a Framework� which provides a command line facility for controlling execution and
access to the Tcl Tk scripting language� A typical reconstruction package usually
consists of approximately �� modules� arranged in Sequences to do subdetector�specic
processing �hit nding� etc��� followed by pattern recognition� tting� and subdetector�
specic particle identication�
Eventually the results of these computations will be saved in an event store that is
currently being constructed� During this construction phase another means of data
storage needed to be developed� The BABAR Event Analysis Summary Tapes �Beast
tapes� were the solution that was used� Utilizing these tapes meant that certain of the
high�level reconstruction results could be stored after computation and read back into
simple analysis software�
The output of reconstruction is accessed through an analysis toolkit called Beta ����
Beta provides code enabling the analyst to treat charged tracks and clusters as four�
vectors� It also provides access to vertexing� particle identication� Monte�Carlo sim�
ulation truth information� and reconstruction of sequential decay chains� Beta can be
used with either the output of the fast simulation� Aslund� the summary tapes �Beast��
or the full reconstruction� In this way� the same analysis program can generally be used
for each kind of input�

Chapter �� Tracking Reconstruction ��
���� Tracking
Before a charged particle trajectory can be reconstructed it must rst be tracked� What
this entails can be broken down into two stages� pattern recognition and tting�
Pattern Recognition
The two tracking devices� the silicon vertex detector and the drift chamber� each use
their own specic track nding algorithms to locate tracks� The silicon vertex detector
algorithm rst combines r�� and z hits in the same silicon wafer to form space points�It then does an exhaustive search for good helical tracks� requiring hits in at least four
out of the ve layers of silicon�
Two drift chamber algorithms are run in sequence� The rst drift chamber algorithm
nds straight�line track segments in all ten superlayers� It then combines segments to
form rst a circular track using r and � information �using axial segments only� and
with a strong bias towards tracks coming from the interaction point�� and then a helical
track �by adding stereo segments to the axial track��
The second drift chamber tracking�nding algorithm uses D circular superlayer seg�
ments in three adjacent superlayers �all eight possibilities are tried� to form a trial
helix� If a helix of su�cient quality is found� it is projected forward and backward� and
other segments are added� This algorithm is designed to nd tracks not coming from
the primary vertex �such as K�S and other decays�� tracks which only pass through a
small number of superlayers �large dip angle tracks�� and low pt tracks �loopers��
Another piece of code merges the separately�found drift chamber and silicon vertex
detector tracks� It projects each silicon vertex detector and drift chamber track to the

Chapter �� Tracking Reconstruction ��
support tube and looks for good matches� Those that match are combined into a single
track� which is placed in the output list of good tracks�
Fitting
After pattern recognition� all tracks are initially tted with a simple helix tter� which
ignores interactions with materials� After merging of drift chamber and silicon vertex
detector tracks� the merged tracks are assigned track parameters based on a weighted
average of the two input tracks� All tracks in the output list �merged or not� are
then retted with a Kalman lter tter� using as a mass hypothesis the mass of the
pion� The e�ects of multiple scattering and energy loss in the detector are included in
the t� The detector description used in the calculation of material e�ects includes a
fairly detailed model of the vertex detector� including support structure� models of the
beampipe and support tube� and a simple model of the drift chamber �treating the gas
as a set of concentric cylinders of homogeneous wire gas mixture��
Kalman Filtering
In the standard least squares t formalism for vertex reconstruction� all the tracks
within an event are tted to a single vertex in one single step� Due to this� it is often
regarded as a global method� The dimensions of matrices and vectors in this formalism
are proportional to the total number of measured tracks in the event� N � Because
the required processing time for the inversion of a matrix is proportional to N�� this
method runs into trouble when trying to deal with events containing a high multiplicity
of charged particles� Additionally� due to the global structure of this formalism� it is
less $exible in handling di�erent vertex hypotheses within a single event�
By contrast� the Kalman lter� which was originally designed to optimize dynamical

Chapter �� Tracking Reconstruction ��
systems� uses the information of di�erent particle trajectories about the vertex con�
secutively one after another ���� Because of this the Kalman lter is considered a
local technique� Beginning with a start value for the vertex position� one compares this
position with the information about the vertex from one track� By a correct weighting
of the start value and the information from the track� one calculates a new estimate
for the vertex position� This position is then compared with the information of the
next particle track in the event producing another new estimate� This procedure is
then repeated for each track one wants to t to a single vertex� until one obtains the
nal vertex position� This technique is called �lter�
��� Summary
The BABAR reconstruction package is the result of many people�s work over the last few
years� It reconstructs the many di�erent event types at high speed �� �� Hz� that areexpected to occur in the interaction region of the BABAR experiment� It relies heavily
on the quality of output from the various sub�detectors to function adequately�

Chapter �
Multiple Mass Hypothesis Analysis
The classication of particle species in the BABAR detector is of paramount importance
if one wishes to observe CP violation processes� Determining when it is acceptable to
track unknown species as pions� as all ve particle species� or as some subset of the
ve particle species in the detector plays a vital role in obtaining the best kinematic
information for the events and hence plays a critical role in species classication�
�� Methodology
The rst step in addressing the issue of multiple mass ts was to be able to read�in and
analyze given events and then change the tracking particle hypothesis� The specic
code needed was not in existence so a C�� class was designed and constructed which
was responsible for organizing the results of a given simulation into a form that would
make it possible to examine� This code was inserted into the Beta framework and
numerous computer simulations were carried out�
The computer simulations that were performed numbered four� one for each particle
type �the pion was not addressed as it is the default choice in the tting algorithm�� For
an individual mass hypothesis� approximately ������ Monte Carlo �MC� events were
considered� ranging in momenta from �� MeV c to ��� GeV c� The MC events included
��

Chapter � Multiple Mass Hypothesis Analysis ��
backgrounds and resolution� which fully simulated the detector response down to the
electronics readout and is based on GEANT ���� Output simulated electron signals and
is similar in format to the raw data read o� the detector�
The track parameters chosen to examine the momentum dependence were�
�� d �the distance to closest approach to the IP�
� �
�� z
�� pz
�� pt
All but d were examined at three locations in the detector�
�� Interaction Point �IP�
� The entrance to the DCH �dened as the lowest wire hit�
�� The exit of the DCH �dened as the highest wire hit�
For the distance of closest approach to the IP� d� which is only dened at the IP� no
other location was considered� Three locations were chosen because of the di�erent
aspects each one o�ers in testing the momentum dependence of the tracking results�
The IP is important for vertexing and physics information� the entrance to the DCH is
needed to help match tracks coming from the SVT� and the exit of the DCH is required
to match tracks in the outer detectors �DIRC� EMC� IFR��

Chapter � Multiple Mass Hypothesis Analysis ��
The output from these track ts were stored in the form of HBOOK ��� les that
were then loaded into Physics Analysis Workstation �PAW� ��� for further analysis�
Once in PAW the results from the ts could be analyzed� A new parameter� �S� was
constructed which gauged the momentum dependence of a certain parameter� It was
dened as�
�S�parameter� parameter�WhatParticleIs�� parameter�Pion�
parameterError�WhatParticleIs������
The units of d and z are in cm� � is in radians� pz and pt are in GeV c and �S has
units of �� In this way the result from tracking a particle as what it really is� for a
given parameter� could be compared to the result of tracking this particle as a pion�
The parameter �S was plotted as a function of Monte Carlo momentum to observe its
momentum dependency� To facilitate statistical analysis� the full momentum range was
sub�divided into ��� MeV c partitions� The �S parameter was then examined in each
of these momentum �slices�� The momentum cuto� was dened to be the maximum
momentum �slice� at which �S failed to be less than ���� at a ��� Condence Level
�CL�� This investigation was repeated for each parameter at each location for all four
computer simulations�
�� Electron Results
The momentum dependence of �S for the ve chosen parameters at the IP is shown
in gures ��� and ��� The various electron cuto� values are summarized in table ����
After looking through the table� the limiting case was found to be for the parameter
pt at the IP� This momentum �slice� is shown in gure ����

Chapter � Multiple Mass Hypothesis Analysis �
Values at the IP
ΔS(pz)
Mon
te C
arlo
Mom
entu
m (
GeV
/c)
ΔS(d)
Mon
te C
arlo
Mom
entu
m (
GeV
/c)
ΔS(φ)
Mon
te C
arlo
Mom
entu
m (
GeV
/c)
ΔS(z)
Mon
te C
arlo
Mom
entu
m (
GeV
/c)
0
0.2
0.4
0.6
0.8
1
-5 0 50
0.2
0.4
0.6
0.8
1
-5 0 5
0
0.2
0.4
0.6
0.8
1
-5 0 50
0.2
0.4
0.6
0.8
1
-5 0 5 10
Figure ���� �S vs� Monte Carlo Momentum for pz� d� �� and z for an Electron�

Chapter � Multiple Mass Hypothesis Analysis ��
Values at the IP
ΔS(pt)
Mon
te C
arlo
Mom
entu
m (
GeV
/c)
0
0.2
0.4
0.6
0.8
1
-10 -8 -6 -4 -2 0 2 4 6
Figure ���� �S�pt� vs� Monte Carlo Momentum for an Electron�

Chapter � Multiple Mass Hypothesis Analysis ��
Values at the IP
ΔS(pt)
Num
ber
of T
rack
s
0
5
10
15
20
25
30
35
40
45
-0.8 -0.7 -0.6 -0.5 -0.4 -0.3 -0.2 -0.1 0
Figure ���� Electron �S�pt� distribution for �� � p � � GeV c
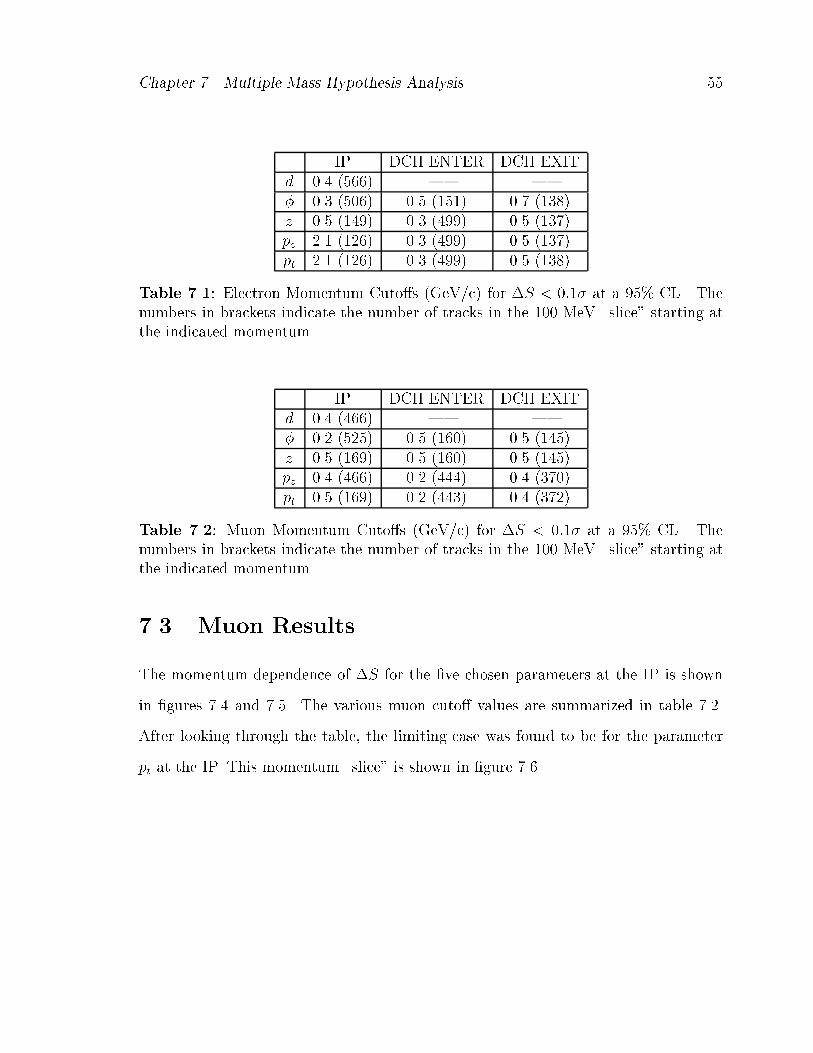
Chapter � Multiple Mass Hypothesis Analysis ��
IP DCH ENTER DCH EXITd ��� ����� % %� ��� ����� ��� ����� ��� �����z ��� ����� ��� ����� ��� �����pz �� ���� ��� ����� ��� �����pt �� ���� ��� ����� ��� �����
Table ���� Electron Momentum Cuto�s �GeV c� for �S � ���� at a ��� CL � Thenumbers in brackets indicate the number of tracks in the ��� MeV �slice� starting atthe indicated momentum�
IP DCH ENTER DCH EXITd ��� ����� % %� �� ���� ��� ����� ��� �����z ��� ����� ��� ����� ��� �����pz ��� ����� �� ����� ��� �����pt ��� ����� �� ����� ��� ����
Table ���� Muon Momentum Cuto�s �GeV c� for �S � ���� at a ��� CL � Thenumbers in brackets indicate the number of tracks in the ��� MeV �slice� starting atthe indicated momentum�
�� Muon Results
The momentum dependence of �S for the ve chosen parameters at the IP is shown
in gures ��� and ���� The various muon cuto� values are summarized in table ���
After looking through the table� the limiting case was found to be for the parameter
pt at the IP� This momentum �slice� is shown in gure ����

Chapter � Multiple Mass Hypothesis Analysis ��
Values at the IP
ΔS(pz)
Mon
te C
arlo
Mom
entu
m (
GeV
/c)
ΔS(d)
Mon
te C
arlo
Mom
entu
m (
GeV
/c)
ΔS(φ)
Mon
te C
arlo
Mom
entu
m (
GeV
/c)
ΔS(z)
Mon
te C
arlo
Mom
entu
m (
GeV
/c)
0
0.2
0.4
0.6
0.8
1
-5 0 50
0.2
0.4
0.6
0.8
1
-2.5 0 2.5 5 7.5
0
0.2
0.4
0.6
0.8
1
-5 0 50
0.2
0.4
0.6
0.8
1
-5 0 5
Figure ���� �S vs� Monte Carlo Momentum for pz� d� �� and z for a Muon�

Chapter � Multiple Mass Hypothesis Analysis ��
Values at the IP
ΔS(pt)
Mon
te C
arlo
Mom
entu
m (
GeV
/c)
0
0.2
0.4
0.6
0.8
1
-8 -6 -4 -2 0 2 4 6 8
Figure ���� �S�pt� vs� Monte Carlo Momentum for a Muon�

Chapter � Multiple Mass Hypothesis Analysis ��
Values at the IP
ΔS(pt)
Num
ber
of T
rack
s
0
2
4
6
8
10
12
14
16
-0.18 -0.16 -0.14 -0.12 -0.1 -0.08 -0.06 -0.04 -0.02
Figure ��� Muon �S�pt� distribution for ��� � p � ��� GeV c

Chapter � Multiple Mass Hypothesis Analysis ��
IP DCH ENTER DCH EXITd ��� ����� % %� ��� ����� �� ����� ��� ����z ��� ����� ��� ���� ��� ����pz �� ���� ��� ����� �� �����pt ��� ����� ��� ���� �� �����
Table ���� Kaon Momentum Cuto�s �GeV c� for �S � ���� at a ��� CL � Thenumbers in brackets indicate the number of tracks in the ��� MeV �slice� starting atthe indicated momentum�
�� Kaon Results
The momentum dependence of �S for the ve chosen parameters at the IP is shown in
gures ��� and ���� The various kaon cuto� values are summarized in table ���� After
looking through the table� the limiting case was found to be for the parameter pz at
the IP� This momentum �slice� is shown in gure ����
�� Proton Results
The momentum dependence of �S for the ve chosen parameters at the IP is shown
in gures ���� and ����� The various proton cuto� values are summarized in table ����
After looking through the table� the limiting case was found to be for the parameter
pt at the IP� This momentum �slice� is shown in gure ����
�� The Eect of Changing the Sigma Value
Due to the time constraints placed on the tracking reconstruction software and the
extra time required to ret tracks using multiple mass hypotheses� additional analysis

Chapter � Multiple Mass Hypothesis Analysis ��
Values at the IP
ΔS(pt)
Mon
te C
arlo
Mom
entu
m (
GeV
/c)
ΔS(d)
Mon
te C
arlo
Mom
entu
m (
GeV
/c)
ΔS(φ)
Mon
te C
arlo
Mom
entu
m (
GeV
/c)
ΔS(z)
Mon
te C
arlo
Mom
entu
m (
GeV
/c)
0
0.25
0.5
0.75
1
1.25
1.5
1.75
2
-2.5 0 2.5 5 7.50
0.25
0.5
0.75
1
1.25
1.5
1.75
2
-2 0 2 4
0
0.25
0.5
0.75
1
1.25
1.5
1.75
2
-5 0 50
0.25
0.5
0.75
1
1.25
1.5
1.75
2
-4 -2 0 2 4
Figure ���� �S vs� Monte Carlo Momentum for pt� d� �� and z for a Kaon�

Chapter � Multiple Mass Hypothesis Analysis ��
Values at the IP
ΔS(pz)
Mon
te C
arlo
Mom
entu
m (
GeV
/c)
0
0.25
0.5
0.75
1
1.25
1.5
1.75
2
-8 -6 -4 -2 0 2 4 6
Figure ���� �S�pz� vs� Monte Carlo Momentum for a Kaon

Chapter � Multiple Mass Hypothesis Analysis �
Values at the IP
ΔS(pz)
Num
ber
of T
rack
s
0
1
2
3
4
5
6
-0.1 -0.08 -0.06 -0.04 -0.02 0 0.02 0.04 0.06 0.08 0.1
Figure ��� Kaon �S�pz� distribution for �� � p � �� GeV c
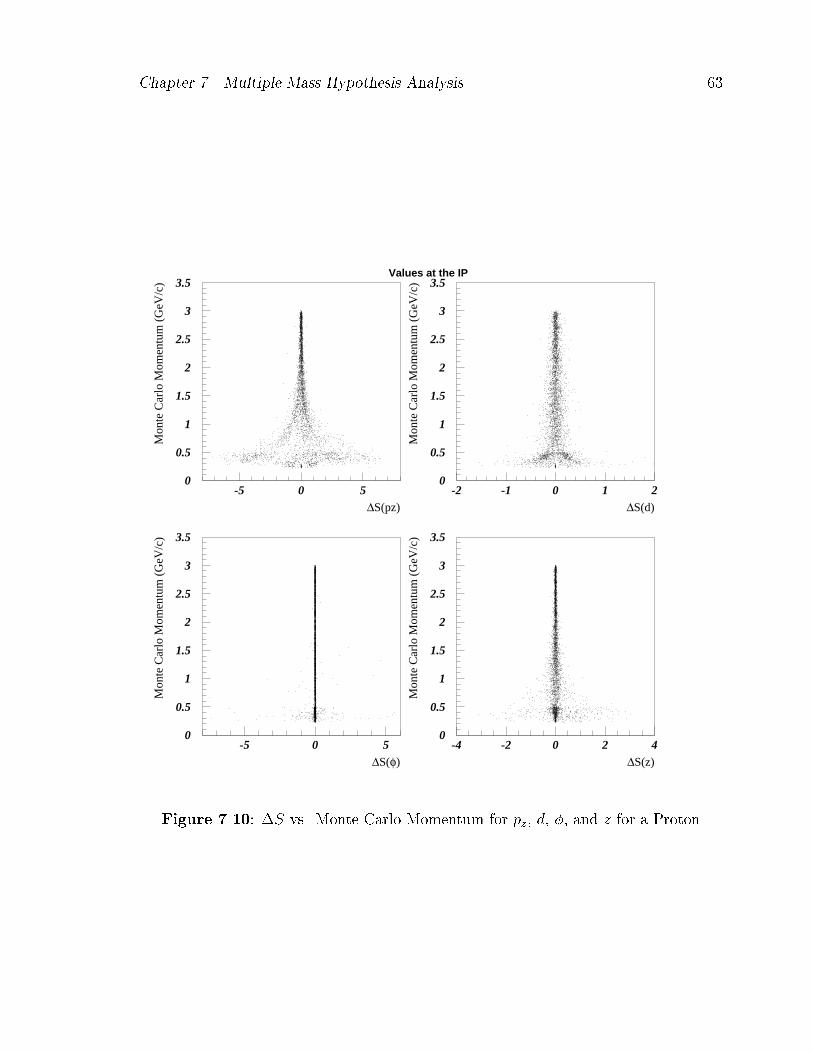
Chapter � Multiple Mass Hypothesis Analysis ��
Values at the IP
ΔS(pz)
Mon
te C
arlo
Mom
entu
m (
GeV
/c)
ΔS(d)
Mon
te C
arlo
Mom
entu
m (
GeV
/c)
ΔS(φ)
Mon
te C
arlo
Mom
entu
m (
GeV
/c)
ΔS(z)
Mon
te C
arlo
Mom
entu
m (
GeV
/c)
0
0.5
1
1.5
2
2.5
3
3.5
-5 0 50
0.5
1
1.5
2
2.5
3
3.5
-2 -1 0 1 2
0
0.5
1
1.5
2
2.5
3
3.5
-5 0 50
0.5
1
1.5
2
2.5
3
3.5
-4 -2 0 2 4
Figure ����� �S vs� Monte Carlo Momentum for pz� d� �� and z for a Proton
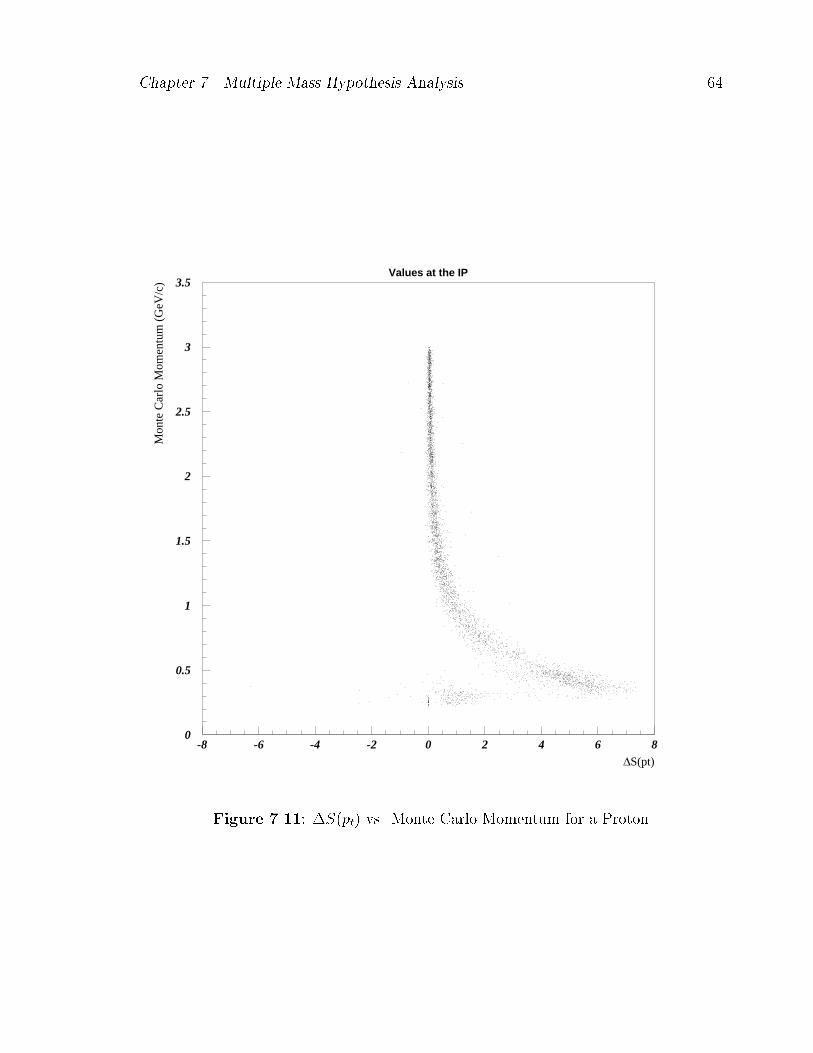
Chapter � Multiple Mass Hypothesis Analysis ��
Values at the IP
ΔS(pt)
Mon
te C
arlo
Mom
entu
m (
GeV
/c)
0
0.5
1
1.5
2
2.5
3
3.5
-8 -6 -4 -2 0 2 4 6 8
Figure ����� �S�pt� vs� Monte Carlo Momentum for a Proton

Chapter � Multiple Mass Hypothesis Analysis ��
Values at the IP
ΔS(pt)
Num
ber
of T
rack
s
0
2
4
6
8
10
12
14
16
-0.2 -0.1 0 0.1 0.2 0.3 0.4 0.5 0.6 0.7
Figure ����� Proton �S�pt� distribution for ��� � p � �� GeV c

Chapter � Multiple Mass Hypothesis Analysis ��
IP DCH ENTER DCH EXITd �� ���� % %� ��� ���� �� ���� �� ����z �� ���� � ����� �� �����pz �� ����� �� ����� �� �����pt ��� ����� �� ���� �� ���
Table ���� Proton Momentum Cuto�s �GeV c� for �S � ���� at a ��� CL � Thenumbers in brackets indicate the number of tracks in the ��� MeV �slice� starting atthe indicated momentum�
Figure ����� The E�ect of Changing the Sigma Value on Cuto� Momentum�

Chapter � Multiple Mass Hypothesis Analysis ��
�S � Electron Muon Kaon Proton���� �� ���� ��� ����� �� ����� ��� �������� ��� ����� ��� ����� ��� ����� �� ��������� �� ����� ��� ����� �� ����� ��� ��������� ��� ����� ��� ����� ��� ����� ��� ��������� ��� ����� ��� ����� ��� ���� ��� ��������� ��� ����� ��� ����� ��� ���� ��� ��������� ��� ����� ��� ����� ��� ����� ��� �������� ��� ����� �� ����� ��� ����� �� ��������� ��� ����� �� ����� ��� ����� �� ��������� ��� ����� �� ����� ��� ����� ��� �����
Table ���� Momentum Cuto�s �GeV c� for Various Values of �S at a ��� CL� Thenumbers in brackets indicate the number of tracks in the ��� MeV range starting atthe indicated momentum�
was done using various acceptable values of �S� The tight constraint of �S � ���� at
��� CL was relaxed in ���� steps and its e�ect on the momentum cuto� values were
tallied �table ����� This e�ect is also shown graphically in gure �����
� Recommendation
Instead of using an �all or nothing� approach to tracking the unknown species in the
detector as pions or as all ve particle species� a cascading cuto� is recommended� Due
to the wide momentum range between the various cuto�s for the four particle species
it would be benecial to only turn on tting of each particle species as it is warranted�
For the original requirement that the parameter �S be less than ���� at a ��� CL the
momentum cuto�s for the respective particle species are�
Electron �� GeV�c
Muon ��� GeV�c

Chapter � Multiple Mass Hypothesis Analysis ��
Kaon �� GeV�c
Proton ��� GeV�c
�eg� For momenta greater than ��� GeV c� t track as a pion only� For momenta greater
than �� GeV c� t track as a pion and proton� For momenta greater than �� GeV c�
t track as a pion� proton� and electron� For momenta greater than ��� GeV c� t track
as a pion� proton� electron� and kaon� For values of momenta below ��� GeV c� t track
as all � particle species�� These values� along with the cascading condition� are currently
being implemented in version ������ of the BABAR reconstruction software� Currently
work is being done to optimize performance vs� CPU time using the momentum cuto�s
given in table ����

Chapter
Conclusion
Deciding when it is necessary to track particles of unknown species in the BABAR
detector as pions or as all ve particle species is crucial for both computational time
constraints and the accuracy of track t results� Naively� one could choose to always
track particles in the detector as all ve particle species� This dramatically increases
the processing time required for each track and is highly ine�cient� This thesis deals
with an analysis of Monte Carlo events in an e�ort to quantify the momentum cuto�s of
the ve particle species in the detector� The results of this analysis will aid in BABAR�s
goal of quickly and cleanly observing CP violation in the neutral B system�
��� Summary
The code to implement the cascading condition algorithm is currently installed and in
use in the BABAR reconstruction software version ������� The values for the momentum
cut�o�s for the four particle species are also included in the above code�
��

Bibliography
��� A�D� Sakharov Soviet Physics Usp ��� � �������
�� J�H� Christenson et al Physical Review Letters ��� ��� �������
��� M� Kobayashi and T� Maskawa� �CP Violation in the Renormalizable Theory ofWeak Interaction��Progress Theoretical Physics� �� �� �������
��� G� Farrar� �CP Violation and the Baryonic Asymmetry of the Universe�� NuclearPhysics B� Proceedings� Supplements� ��� �� �������
��� Y� Nir and H� Quinn� The BABAR Physics Book� SLAC Report ���� October �����
��� M� Gell�Mann and A� Pa!s� �Behavior of Neutral Particles Under Charge Conju�gation�� Physical Review Letters� �� ���� �������
��� Particle Data Group� C� Caso et al� The European Physical Journal C�� � �������
��� J�H� Christenson� J�W� Cronin� V�L� Fitch and R� Turlay� �Evidence for the decay of the K�
� meson�� Physical Review Letters� ��� ��� �������
��� P� Oddone� in Proceedings of the UCLA Workshop� Linear Collider BB FactoryConceptual Design� edited by D� Stork� World Scientic ������� p� ���
���� �Technical Design Report�� �BABAR Collaboration�� SLAC�REP��� �������
���� A� Snyder� �The E�ect of Vertex Cuts on CP Reach�� BABAR Note &��� �������
��� G� Charpak� �Applications of proportional chambers and drift chambers in high�energy physics and other elds�� Nature� ���� �������
���� W�R� Leo� Techniques for Nuclear and Particle Physics Experiments� Springer�Verlag� ����
���� R�C� Weast and S�M� Selby� Eds�� CRC Handbook of Chemistry and Physics� forty�eightth edition� The Chemical Rubber Company� �����
���� J� Heise� �Studies of Helium�Based Gas Mixtures Using a Small Cell Drift Cham�ber� UBC M�Sc� Thesis� �����
��

Bibliography ��
���� P� Rice�Evans� Spark� Streamer� Proportional and Drift Chambers� The RichelieuPress� London� �����
���� S� Uno� et al� �Study of a drift chamber lled with a helium�ethane mixture��Nuclear Instruments and Methods in Physics Research� A���� �� �������
���� J�M� McKenzie� � Development of the Semiconductor Radiation Detector�� Nu�clear Instruments and Methods in Physics Research� ��� �� �������
���� J� Millman and C�C� Halkias� Integrated Electronics� Analog and Digital Circuitsand Systems� McGraw�Hill Book Company� ����
��� B� Hyams� et al� �A Silicon Counter Telescope to Study Shortlived Particles inHigh�Energy Hadronic Interactions�� Nuclear Instruments and Methods in PhysicsResearch� ���� �� �������
��� D� Barbieri et al� �Silicon Sensors for the BABAR Vertex Tracker�� submitted toNuovo Cimento�
�� E�D� Frank et al��Architecture of the BABAR Reconstruction System�� to be pub�lished in Computer Physics Communications�
��� B� Jacobsen� �Beta� A High�level Toolkit for BABAR Physics Analysis�� submittedto Computer Physics Communications�
��� R� Luchsinger and C� Grab� �Vertex reconstruction by means of the method ofKalman ltering�� Computer Physics Communications� �� �����
��� R� Brun et al� �GEANT� Simulation Program for Particle Physics Experiments�User Guide and Reference Manual�� CERN�DD �� Rev�� July �����
��� R� Brun et al� �Physics Analysis Workstation�� CERNLIB� Q��� �����