a research project submitted in partial fulfillment...
TRANSCRIPT
BANKRUPTCY PREDICTION OF FIRMS LISTED AT THE NAIROBI
SECURITIES EXCHANGE
BY
SAMIRA MOHAMED
D63/73046/2012
A RESEARCH PROJECT SUBMITTED IN PARTIAL FULFILLMENT OF
THE REQUIREMENT FOR THE AWARD OF THE DEGREE OF
MASTER OF SCIENCE IN FINANCE, SCHOOL OF BUSINESS
UNIVERSITY OF NAIROBI
NOVEMBER 2013
ii
DECLARATION
This project is my original work and has not been submitted for a degree to any other University.
_____________________________ _________________
SAMIRA MOHAMED DATE
D63/73046/2012
This research project has been presented for examination with my approval as the University
Supervisor.
____________________________ __________________
SUPERVISOR DATE
DR. JOSIAH ADUDA
CHAIRMAN DEPT. OF FINANCE & ACCOUNTING
SCHOOL OF BUSINESS
UNIVERSITY OF NAIROBI

iii
DEDICATION
To my Dad and Mum, You are the best. To my adorable husband Issack Fish. You are my
inspiration

iv
ACKNOWLEDGEMENT
My greatest gratitude goes to the Almighty Allah whose Grace and Mercy has been abundant for
me all through my entire MSc Finance course. I sincerely want to thank all those who stood by
me during my entire studies and contributed in one way or another.
First, I would like to appreciate my dear husband for his constant support and love. This thesis
would not have been possible unless I have had our warm family environment and his deep
understanding. Issack, thank you for listening to me, bearing with me and encouraging me by
your motivating words. I appreciate your patience when I was too busy with this course. You are
a wonderful husband to help me become successful.
Secondly, I owe my deepest gratitude to Dr. Josiah Aduda for his valuable comments and useful
suggestions. He has made available his support in a number of ways from the initial to the final
level, enabling me to develop an understanding of the subject.
Thirdly, I would like to thank the team of CORDAID Foundation–Drought Emergency
Assistance Department especially Mr. Najir Ahmed Khan and BroadReach Healthcare especially
Philip Wambua, Ahmed Arale and Cassandra Blazer for their helpful advice and encouragement
in the entire course.
Fourthly, it is an honour for me to thank my parents who have always been my biggest
motivators and supporters in life.
Lastly to all my MSc Finance colleagues for their encouragement and for the ideas we shared
from their experiences and backgrounds that made my studies a success
v
TABLES OF CONTENTS
DECLARATION......................................................................................................................................... ii
DEDICATION............................................................................................................................................ iii
ACKNOWLEDGEMENT ......................................................................................................................... iv
LIST OF TABLES .................................................................................................................................... vii
LIST OF ABBREVIATIONS ................................................................................................................. viii
ABSTRACT ................................................................................................................................................ ix
CHAPTER ONE ......................................................................................................................................... 1
INTRODUCTION ....................................................................................................................................... 1
1.1 Background of the Study............................................................................................................... 1
1.1.1 Bankruptcy Prediction ........................................................................................................... 2
1.1.2 Nairobi Securities Exchange ................................................................................................. 3
1.2 Research Problem ......................................................................................................................... 4
1.3 Research Objectives ...................................................................................................................... 6
1.4 Value of the Study ........................................................................................................................ 6
CHAPTER TWO ........................................................................................................................................ 8
LITERATURE REVIEW .......................................................................................................................... 8
2.1 Introduction ................................................................................................................................... 8
2.2 Review of Theories ....................................................................................................................... 8
2.2.1 Valuation Models .................................................................................................................. 8
2.2.2 Option Pricing Theory .......................................................................................................... 9
2.2.3 Efficient Market Hypothesis Theory ................................................................................... 10
2.3 Review of Empirical Studies....................................................................................................... 11
2.4 Bankruptcy Prediction Models.................................................................................................... 12
2.4.1. Qualitative Models .............................................................................................................. 12
2.4.2. Quantitative Models ............................................................................................................ 13
2.4.2.1. Multi-Discriminant Analysis ........................................................................................... 13
2.4.2.2. Springate Model (Canadian) ........................................................................................... 17
2.4.2.3. Blasztk Model (Canadian) .............................................................................................. 18
2.5 Chapter Summary ....................................................................................................................... 18
vi
CHAPTER THREE .................................................................................................................................. 19
RESEARCH METHODOLOGY ............................................................................................................ 19
3.1. Introduction ................................................................................................................................. 19
3.2. Research Design .......................................................................................................................... 19
3.3. Population of the study ............................................................................................................... 19
3.4. Sample Selection ......................................................................................................................... 19
3.5. Data Collection ........................................................................................................................... 20
3.6. Data Analysis .............................................................................................................................. 20
CHAPTER FOUR ..................................................................................................................................... 22
DATA ANALYSIS, RESULTS AND DISCUSSIONS ........................................................................... 22
4.1. Introduction ................................................................................................................................. 22
4.2. Data Presentation ........................................................................................................................ 22
4.2.1 Descriptive Successful Firms .............................................................................................. 22
4.2.2 Analysis of Successful Firms .............................................................................................. 23
4.2.3 Descriptive Failed Firms ..................................................................................................... 25
4.2.4 Analysis of Failed Firms ..................................................................................................... 26
4.3. Summary and Interpretation of Findings .................................................................................... 29
CHAPTER FIVE ...................................................................................................................................... 32
SUMMARY, CONCLUSIONS AND RECOMMENDATION ............................................................. 32
5.1. Summary ..................................................................................................................................... 32
5.2. Conclusions ................................................................................................................................. 33
5.3. Policy Recommendations ............................................................................................................ 34
5.4. Limitations of the Study .............................................................................................................. 34
5.5. Suggestions for Further Research ............................................................................................... 35
REFERENCES .......................................................................................................................................... 37
APPENDICES ........................................................................................................................................... 41
Appendix 1: Firms Listed on the NSE .................................................................................................... 41
Appendix 2: Sample Data ....................................................................................................................... 45
vii
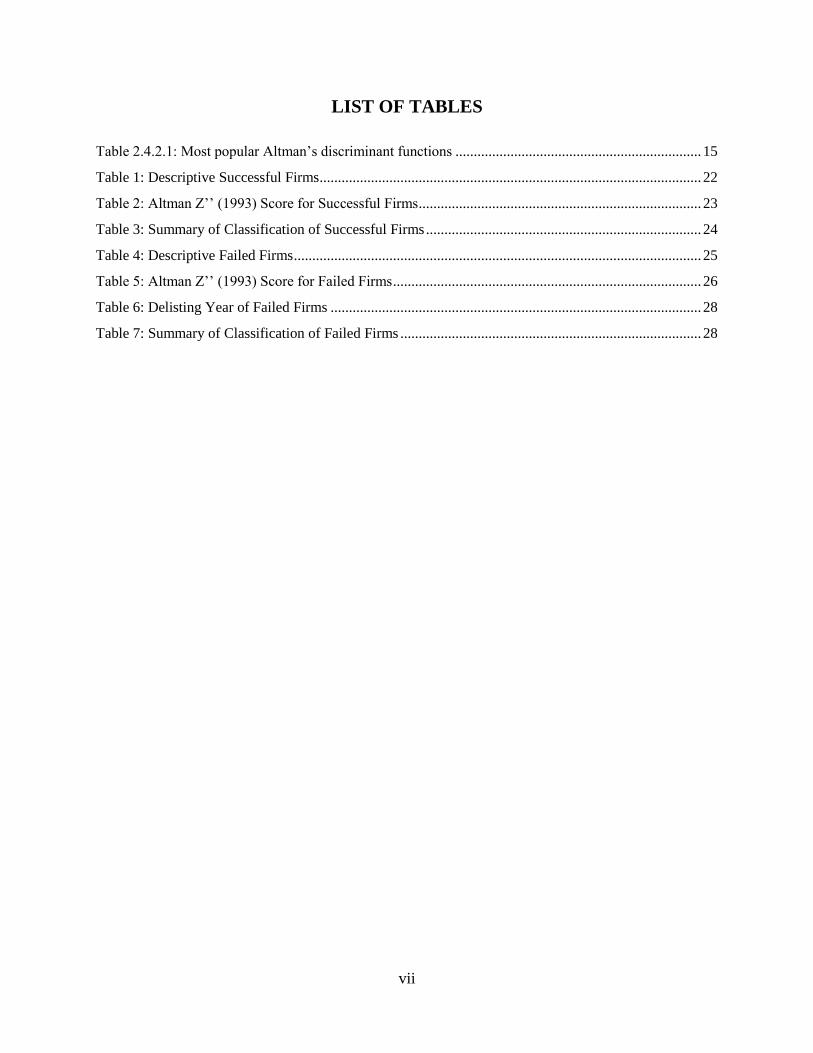
LIST OF TABLES
Table 2.4.2.1: Most popular Altman’s discriminant functions ................................................................... 15
Table 1: Descriptive Successful Firms ........................................................................................................ 22
Table 2: Altman Z’’ (1993) Score for Successful Firms ............................................................................. 23
Table 3: Summary of Classification of Successful Firms ........................................................................... 24
Table 4: Descriptive Failed Firms ............................................................................................................... 25
Table 5: Altman Z’’ (1993) Score for Failed Firms .................................................................................... 26
Table 6: Delisting Year of Failed Firms ..................................................................................................... 28
Table 7: Summary of Classification of Failed Firms .................................................................................. 28
viii
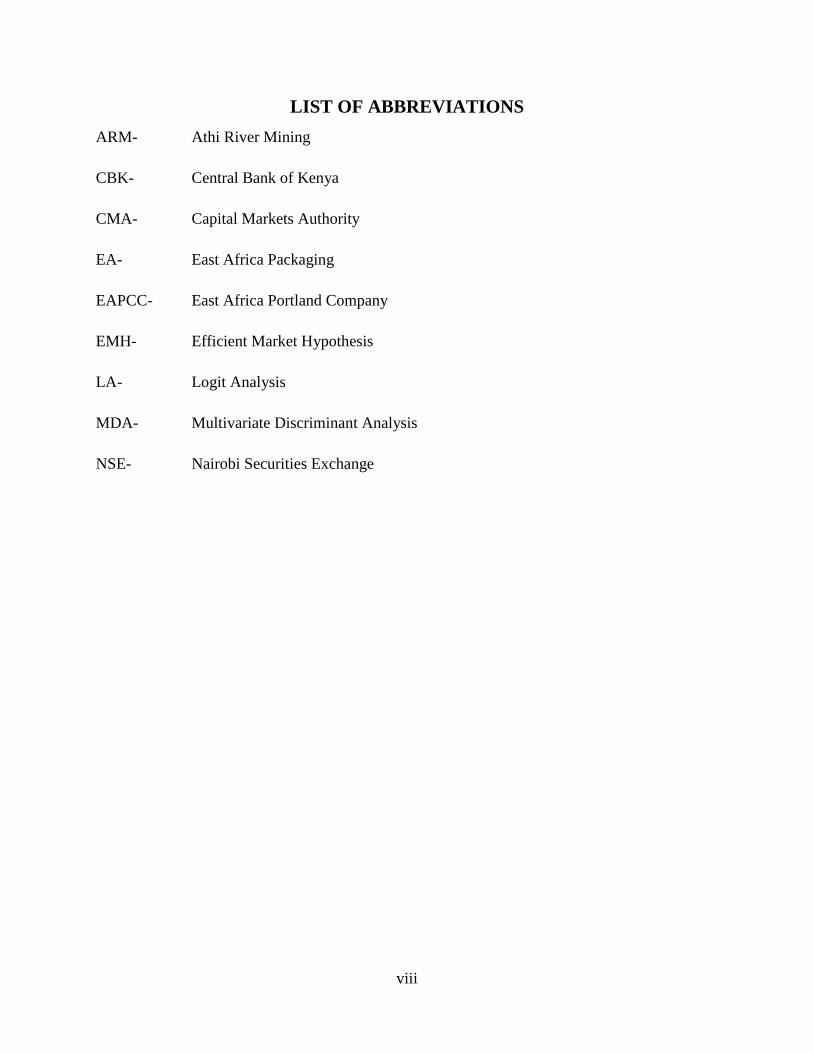
LIST OF ABBREVIATIONS
ARM- Athi River Mining
CBK- Central Bank of Kenya
CMA- Capital Markets Authority
EA- East Africa Packaging
EAPCC- East Africa Portland Company
EMH- Efficient Market Hypothesis
LA- Logit Analysis
MDA- Multivariate Discriminant Analysis
NSE- Nairobi Securities Exchange
ix
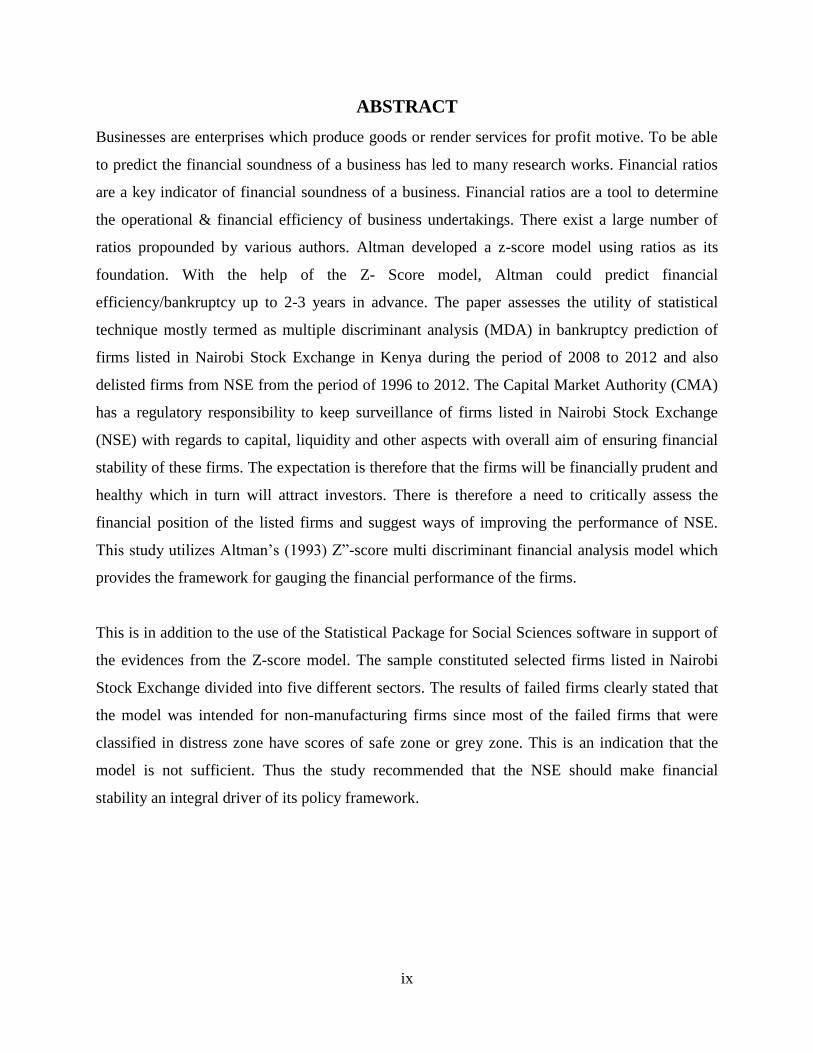
ABSTRACT
Businesses are enterprises which produce goods or render services for profit motive. To be able
to predict the financial soundness of a business has led to many research works. Financial ratios
are a key indicator of financial soundness of a business. Financial ratios are a tool to determine
the operational & financial efficiency of business undertakings. There exist a large number of
ratios propounded by various authors. Altman developed a z-score model using ratios as its
foundation. With the help of the Z- Score model, Altman could predict financial
efficiency/bankruptcy up to 2-3 years in advance. The paper assesses the utility of statistical
technique mostly termed as multiple discriminant analysis (MDA) in bankruptcy prediction of
firms listed in Nairobi Stock Exchange in Kenya during the period of 2008 to 2012 and also
delisted firms from NSE from the period of 1996 to 2012. The Capital Market Authority (CMA)
has a regulatory responsibility to keep surveillance of firms listed in Nairobi Stock Exchange
(NSE) with regards to capital, liquidity and other aspects with overall aim of ensuring financial
stability of these firms. The expectation is therefore that the firms will be financially prudent and
healthy which in turn will attract investors. There is therefore a need to critically assess the
financial position of the listed firms and suggest ways of improving the performance of NSE.
This study utilizes Altman’s (1993) Z”-score multi discriminant financial analysis model which
provides the framework for gauging the financial performance of the firms.
This is in addition to the use of the Statistical Package for Social Sciences software in support of
the evidences from the Z-score model. The sample constituted selected firms listed in Nairobi
Stock Exchange divided into five different sectors. The results of failed firms clearly stated that
the model was intended for non-manufacturing firms since most of the failed firms that were
classified in distress zone have scores of safe zone or grey zone. This is an indication that the
model is not sufficient. Thus the study recommended that the NSE should make financial
stability an integral driver of its policy framework.
1
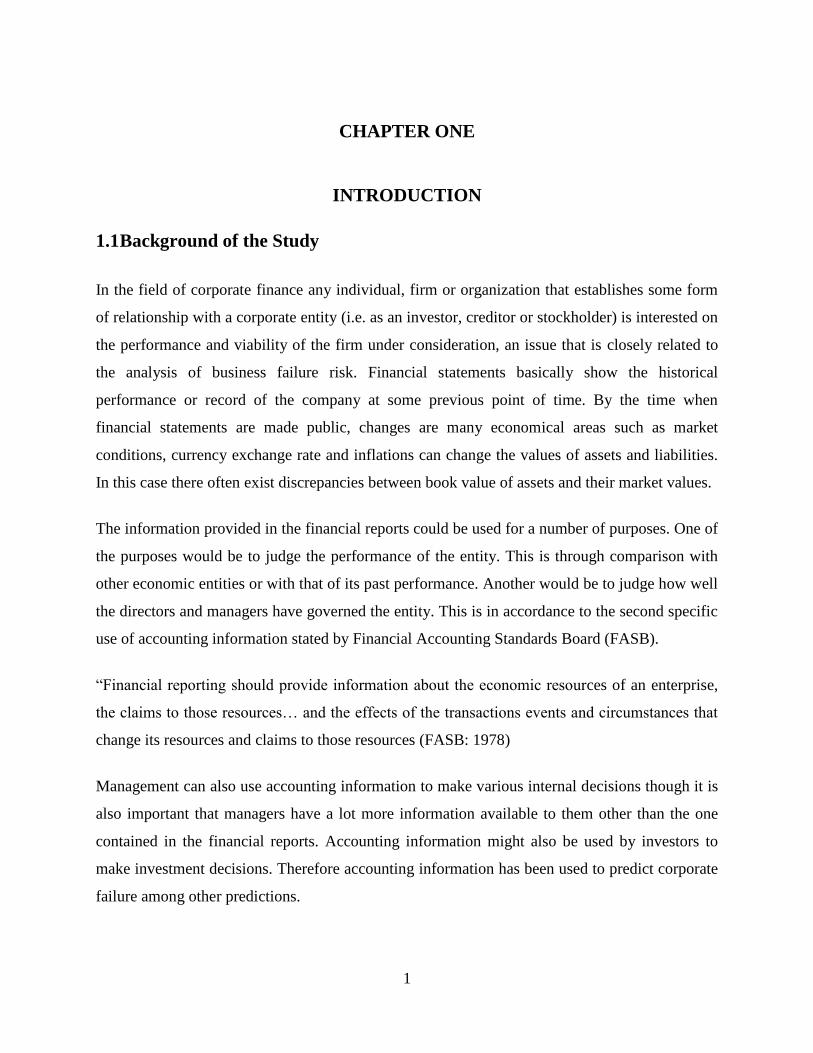
CHAPTER ONE
INTRODUCTION
1.1 Background of the Study
In the field of corporate finance any individual, firm or organization that establishes some form
of relationship with a corporate entity (i.e. as an investor, creditor or stockholder) is interested on
the performance and viability of the firm under consideration, an issue that is closely related to
the analysis of business failure risk. Financial statements basically show the historical
performance or record of the company at some previous point of time. By the time when
financial statements are made public, changes are many economical areas such as market
conditions, currency exchange rate and inflations can change the values of assets and liabilities.
In this case there often exist discrepancies between book value of assets and their market values.
The information provided in the financial reports could be used for a number of purposes. One of
the purposes would be to judge the performance of the entity. This is through comparison with
other economic entities or with that of its past performance. Another would be to judge how well
the directors and managers have governed the entity. This is in accordance to the second specific
use of accounting information stated by Financial Accounting Standards Board (FASB).
“Financial reporting should provide information about the economic resources of an enterprise,
the claims to those resources… and the effects of the transactions events and circumstances that
change its resources and claims to those resources (FASB: 1978)
Management can also use accounting information to make various internal decisions though it is
also important that managers have a lot more information available to them other than the one
contained in the financial reports. Accounting information might also be used by investors to
make investment decisions. Therefore accounting information has been used to predict corporate
failure among other predictions.
2
The prediction of business failures or bankruptcy has for a long time caught the attention of
managers, investors, stakeholders, scholars among many more. The failure of the business
resulted in heavy losses to various stakeholders among them being; creditors, government,
investment by shareholders, employees and general economic slowdown. These losses were
costly and hence attracted a lot of research to be carried out. Most of the researches were
concerned on how to avoid and eliminate the losses therein associated. When company is facing
financial distress, book value of company liabilities can become worth more than the market
value of the same liabilities. If this happen, then firm is in danger of not meeting its obligations
to creditors. In this case creditors may not be paid and in worst of financial distressed time, the
creditors may receive nothing in interest or principal, if the firm files for bankruptcy. Therefore
this research will focus on the bankruptcy prediction of firms listed under the Nairobi Securities
Exchange in Kenya. Detailed description of the topic is explained below.
1.1.1 Bankruptcy Prediction
O’Leary (2001) argues that Prediction of bankruptcy probably is one of the most important
business decision-making problems. Affecting the entire life span of a business, failure results in
a high cost from the collaborators (firms and organizations), the society, and the country’s
economy (Ahn, Cho, and Kim, 2000). Thus, the evaluation of business failure has emerged as a
scientific field in which many academics and professionals have studied to find other optimal
prediction models, depending on the specific interest or condition of the firms under
examination.
Over the last 35 years, the topic of company failure prediction has developed to a major research
domain in corporate finance. Academic researchers from all over the world have been
developing a gigantic number of corporate failure prediction models, based on various types of
modeling techniques. Besides the classic cross-sectional statistical methods, which have
produced numerous failure prediction models, researchers have also been using several
alternative methods for analyzing and predicting business failure. To date, a clear overview and
discussion of the application of alternative methods in corporate failure prediction is still lacking.
3
Though one of the best-known models for predicting corporate financial distress is the Altman’s
Z-Score model (Altman, 1993). Altman’s work has shown that the Z-Score and its variants have
a very high degree of accuracy in predicting corporate financial distress in the U.S as well as in
the emerging markets (Altman, Hatzell and Peck, 1995). The purpose of this study is to provide
an out-of-sample test of the Z-Score model of 1993 and its variants by applying them to a sample
of firms listed in the Nairobi Securities Exchange. The results provide us with evidence of the
validity of a set of financial ratios, identified with reference to the Nairobi Securities Exchange
listed firms, in predicting bankruptcies. The study covers 62 firms listed in the Nairobi Securities
Exchange during the period 2008-2012.
1.1.2 Nairobi Securities Exchange
This study of bankruptcy prediction will be focusing on firms listed in Nairobi Securities
Exchange. The NSE is regulated by the Capital Market Authority in Kenya. The interest in the
area of bankruptcy prediction has increased due to considerable number of corporate failures
around the globe in recent years especially since the early 1990s. The Nairobi Securities
Exchange was constituted as Nairobi Stock Exchange in 1954 as a voluntary association of
stockbrokers in the European community registered under the Societies Act.
In 1954 the Nairobi Stock Exchange was then constituted as a voluntary association of
stockbrokers registered under the Societies Act. Since Africans and Asians were not permitted to
trade in securities, until after the attainment of independence in 1963, the business of dealing in
shares was confined to the resident European community. At the dawn of independence, stock
market activity slumped, due to uncertainty about the future of independent Kenya. Therefore
Nairobi Securities Exchange has been operating now for 59 years but failed to pick the growth
momentum and currently the market has just 61 listed firms. Nairobi Securities Exchange has a
responsibility to develop and regulate the market operations to ensure efficient trading. Therefore
the companies listed under the Nairobi Securities Exchange are expected to be financially
healthy so as to end business failures. While there are about 61 companies listed in NSE, not all
are in a financially sound position. Although at the point of listing, these listed companies must
meet the listing requirement of NSE, given time, the company’s financial position and business
direction can change for better or for worse. There are many reasons for these changes
4
especially governance, management, financial appetite, or risk profile. Therefore surveillance in
the market is necessary to ensure efficient trading hence economic growth of the country.
Notable failures include Global Crossing, Enron, Adelphia, WorldCom, HH Insurance, One Tel,
and Ansert Airlines in 2001, and most recently FIN Corp in 2007. The predicting of financial
distress is an early warning signal to keep investors from being in loss. It has been more than 70
years, since Ramser& Foster, and Fitzpatrick in 1931-1932, and 44 years, since Beaver (1966)
but still they have not found the theory of financial distress. They were more statistical
consideration then the intuitive models or fundamental causes of financial distress (Ooghe &
Prijcker, 2007; Balcean & Ooghe, 2004). Since The Altman’s model widely used among the
investors, though it is not an intuitive model, once a firm is predicted having a financial distress
next year, it has been treated as it has been financial distress currently, Whtaker (1999).Therefore
significance of predicting bankruptcy has been on the rise due to its severe effects on firm’s
operations, its environment (management, credit institutions, stakeholders, investors, employees)
and whole economy, Arnold (2007). Evidence show that the market value of distressed firms
decline substantially, Warner (1977).
1.2 Research Problem
Companies are often assumed to have a perpetual life while in reality companies fail and this
infinite assumption collapses. This leads to heavy losses to all stakeholders. Therefore this raises
concern to all on how to predict probable failure. Early sign of failure detection will minimize
failure associated costs. For instance the shareholders could withdraw their investments, the
consumer in the economy will look for alternative markets, and the executive management will
make better refined strategies to curb upcoming failures while the suppliers will look for more
stable firms to supply their items in order to maintain their supply chain. Therefore in order to
predict bankruptcies each stakeholder seeks information through classical and non-classical
failure prediction models. Some of the leading studies have also been summarized in the
following paragraphs.
Beaver (1966) applies a business failure prediction based on financial ratios. Using a Univariate
Discriminant Analysis, he categorizes 30 financial ratios into six groups, and then chooses one
ratio from each group with lowest percentage error. He drives the ability of each ratio in failure
5
prediction one at a time and concludes that the ratio analysis can be employed in the prediction
of failures even five years prior to failure.
Altman (1968) argues that the traditional univariate analysis could be confusing in failure
prediction, since a firm could be considered as failure, based on a specific financial ratio but a
non-failure on the basis of another one. Altman (1968) in his studies titled, “Financial Ratios
Discriminant Analysis and the prediction of corporate Bankruptcy” which was published in the
journal of Finance advanced a Z-score MDA model. The MDA could predict occurrences of
bankruptcy 94% and 72% correctly one year and two years respectively before its actual
occurrence. His model emerged with the following ratios as the most significant as far as
bankruptcy prediction was concerned: Working capital to total assets, Retained Earnings to total
assets, Earnings before interest to total assets, Market value equity to book value of total debt
and sales to total assets. In also another study on corporate failure, Altman and Mcough (1974)
carried out an analysis of the relationship between bankrupt companies and auditors reports prior
to bankruptcy. Their work resulted in the conclusion that Altman’s model can signal going-
concern problems earlier than the auditors’ opinion in a company that eventually enters
bankruptcy.
In Kenya, many studies have been done to establish the bankruptcy prediction of firms. Keige,
(1991) researched on business failure prediction using discriminant analysis who argues that it is
possible to predict failure with up to 90% accuracy two years before the event. Issack Mwangi,
(1991) researched on prediction of corporate failure using price adjusted accounting data. He
argues that the most critical ratios in the financial ratios were the liquidity and debt service
ratios. Barasa, (2007) also researched on the evolution of prediction models from classical to
non-classical failure prediction models where he stated that Kenyan [an East African country]
history of bank failures is evidence that this is not a foreign problem, but a problem similarly
experienced in and within its surrounding. The scenario depicts equally depressing trends in
1980s’ and 1990s’1. Kenyan as an illustration of countries in the Eastern Africa recorded
seventeen (17) bank failures since December 1984 up to September 2007 along with twenty four
(24) financial institutions within the same period (CBK, Inspectorate Report, 2007).Therefore
time has passed and there is the gap of incorporating the classical and non-classical with the
current existing technology and this has motivated my study on bankruptcy prediction of listed
6
firms at the Nairobi Securities Exchange. This study therefore differs from the above studies
done in that the bankruptcy prediction in firms listed in the Nairobi Securities Exchange using
the latest Altman’s Z” Score of 1993.
1.3 Research Objectives
The study is set to achieve the utility of statistical technique mostly termed as multiple
discriminant analysis (MDA) in bankruptcy prediction of NSE listed firms.
1.4 Value of the Study
This study is likely to be of interest to the following;
The government and policy makers may be interested in the study of bankruptcy prediction of
firms listed in the NSE. The study will give insight to the government and its policy role
especially in the Ministry of Finance on the impact of bankruptcy prediction on long term
financial stability of the economy. It will also help them seek trainings on the importance of
bankruptcy prediction. The Ministry of Education and higher education will also gain insight on
the need for making exclusive bankruptcy prediction education a part of the school curriculum.
The result of the study will inform the ongoing financial sector reforms in the country. The
Capital Market Authority which is a regulatory and oversight body may also find important to
benefit from this study by enhancing maintenance of appropriate legal and regulatory
framework.
The study can also chip in during the review of policies and making recommendation to the
Government on new policy issue that could enhance market development. This will in return
promote the guidance given to the market operators like Nairobi Securities Exchange and
improve surveillance of the firms listed in the Nairobi Securities Exchange with regard to capital,
liquidity and other aspects with overall am of ensuring financial stability of the listed firms. This
study will also benefit the Nairobi Securities Exchange in terms of capacity building and
enhancing the listed firms to maintain strong financial stability before and after the listing. NSE
will also pick its growth momentum from 61 listed firms currently to capture at least three
quarter of the firms in the economy of the Kenyan market and also extended to more regional
markets with East and Central Africa. NSE can also benefit from the study by doubling its
7
responsibility for development and regulation of the market operations to boost trading
efficiencies.
The study will be also useful to investors in that there will be able to know about the status of
companies listed in the Nairobi Securities Exchange and will boost their knowledge of the
importance of bankruptcy prediction. It will be a preventive tool to them so that they can avoid
situations of hostile takeover due to business failures which can be taken care of. This will hence
ease the stringent rules of preventing mangers from going for training which might have boosted
the company since most stockholders see it as waste of company resources. Therefore in the long
the management of companies will be well acquainted with current information and give them
more capacity in terms of strategizing on the tools to combine for effective bankruptcy
prediction.
Employee, clients and suppliers of different firms in the economy of Kenya will also benefit
from this study. The study will enable see the performance of the firm they work for and see
whether it is growing or collapsing. With this information at hand, the employees will be able to
advice the management on ways of preventing business failure through different models of
bankruptcy prediction. In so doing this will also boost their skills and growth to their career. The
clients, this information will help them see which firms are financial stable or not so that they
can plan themselves on the consistency of getting services from these firms. The suppliers will
be able to analyze their credit rating strategies to firms they lend. With this in place, they will be
assured of future payments of their accounts receivable and consistency chain of supply through
consistent production.
Scholars and researchers may use this study as a base for further research in the local
environment. The study will contribute to the existing body of knowledge on bankruptcy
prediction in Kenya. It will also stimulate prospective researchers to replicate the study in other
sectors of the economy and in other regions of the country.
8
CHAPTER TWO
LITERATURE REVIEW
2.1 Introduction
The bankruptcy prediction has attracted the attention of both academic researcher and business
management. Several prediction models have evolved over a long period. Since late 1960’s
serious investigation into possibility of developing suitable business failure prediction models to
help avert enormous loss resulting from business bankruptcy commenced (Altman, 1984;
Dimitras, et al 1996, Altman and Narayanan 1997). Consequently many types of models and
methods of predicting business failure have been developed with varying assumptions and
computational complexities. The classical cross-sectional methods have proved to be the most
popular business failure prediction methods (Zavgren, 1983; and Atiya, 2001).
2.2 Review of Theories
2.2.1 Valuation Models
Valuation is a processed set of procedures used to estimate the economic value of an owner’s
interest in a business. Valuation is used by financial market participants to determine the price
they are willing to pay or receive to perfect a sale of business. There are two valuation methods
which have since been used to value the marketable securities. These are Capital Asset Pricing
Model (CAPM) and Arbitrage Pricing Model (APM). The CAPM model was developed
concurrently by Treynor (1961) and Sharpe (1963, 1964). A typical CAPM model was E(Ri)=Rj
+ [E(Rm)-Rf]Bi where E(Ri) is the expected rate of return on asset i, Rf is the risk-free rate of
return, E(Rm) is the expected market rate of return, B is the variance of risky asset i. This when
plotted on a graph will give the security market line.
Second model is the Arbitrage Pricing Model (APM) which was developed by Ross, (1976). It is
based on the idea that the asset’s returns can be predicted using the relationship between the
same asset’s and many common risk factor. This theory predicts a relationship between the
returns of a portfolio and the returns of a single asset through a linear combination of many
independent of many macro-economic variables. It is often viewed as an alternative to Capital
9
Asset Pricing Model, since the APT has more flexible assumption requirements. Therefore the
analysis shows that period-specific probabilities of business failure are instrumental to the
assessment of expected values of cash flows in such models. Under somewhat restrictive
conditions the failure risk can alternatively be accommodated through an adjustment of the
discount rate, i.e. expected values of future cash flows conditioned on business survival can
simply be discounted with such a discount rate. The result holds both in bond and equity DCF
valuation modeling. In order for the accounting-based residual income valuation model to
appropriately capture the failure risk, an additional accounting “failure loss recognition”
principle as well as a novel term in the model specification have been identified.
2.2.2 Option Pricing Theory
The most commonly used models today are the Black-Scholes model and the binomial model.
The basic intuition behind option pricing or contingent claims model (e.g. Merton, 1974, 1977) is
that the equity of a levered firm can be viewed as a call option to acquire the value of the firm’s
asset by paying off the face value of the debt at the debt’s maturity. From this perspective, a firm
will be insolvent if the value of the firm’s asset falls below what the firm owes its creditors at
debt maturity. In that event, equity holders will default on the debt (file for bankruptcy) and
simply hand over the firm’s assets to its creditors and walk away free (protected by their limited
liability rights. The probability of default at debt maturity in this case (the firm’s assets are less
than the face value of the debt) is driven by the five primary option pricing variables: the natural
logarithm of the book value of total liabilities due to maturity representing the option’s exercise
price, the logarithm of the current market value of the firm’s assets, the standard deviations of
percentage firm value changes, the average time to the debt’s maturity representing the option’s
expiration , and the difference between the expected asset return and the firm’s payout yield
(interest and dividend payments as proportion of asset value).
Both theories on options pricing have wide margins for error because their values are derived
from other assets, usually the price of a company's common stock. Time also plays a large role in
option pricing theory, because calculations involve time periods of several years and more.
Marketable options require different valuation methods than non-marketable ones, such as those
given to company employees.
10
2.2.3 Efficient Market Hypothesis Theory
Fama, (1970) defined an efficient financial market as "one in which prices always fully reflect
available information”. [1] the most common type of efficiency referred to in financial markets is
the allocative efficiency, or the efficiency of allocating resources. This includes producing the
right goods for the right people at the right price. A trait of allocatively efficient financial market
is that it channels funds from the ultimate lenders to the ultimate borrowers in a way that the
funds are used in the most socially useful manner.
Fama, (1970) identified three levels of market efficiency. One of them being Weak-form
efficiency which states that prices of the securities instantly reflect full information of the past
prices. This means future price movements cannot be predicted by using past prices. It is simply
to say that, past data on stock prices are of no use in predicting future stock price changes.
Everything is random. In this kind of market, should simply use a "buy-and-hold" strategy.
Semi-strong efficiency as second level of market efficiency which states that asset prices fully
reflect all of the publicly available information. Therefore, only investors with additional inside
information could have advantage on the market. Any price anomalies are quickly found out and
the stock market adjusts. Strong-form efficiency as the third level of market efficiency states that
asset prices fully reflect all of the public and inside information available. Therefore, no one can
have advantage on the market in predicting prices since there is no data that would provide any
additional value to the investors. Fama also created the efficient-market hypothesis (EMH)
theory, which states that in any given time, the prices on the market already reflect all known
information, and also change fast to reflect new information. Therefore, no one could outperform
the market by using the same information that is already available to all investors, except through
luck.
Tobin, (1958) also identified four efficiency types that could be present in a financial market and
they include information arbitrage efficiency which states that asset prices fully reflect all of the
privately available information (the least demanding requirement for efficient market, since
arbitrage includes realizable, risk free transactions). Arbitrage involves taking advantage of price
similarities of financial instruments between 2 or more markets by trading to generate losses. It
involves only risk-free transactions and the information used for trading is obtained at no cost.
Therefore, the profit opportunities are not fully exploited, and it can be said that arbitrage is a
11
result of market inefficiency. This reflects the weak-information efficiency model. Fundamental
valuation efficiency a second efficiency states that asset prices reflect the expected past flows of
payments associated with holding the assets (profit forecasts are correct, they attract investors).
Fundamental valuation involves lower risks and less profit opportunities. It refers to the accuracy
of the predicted return on the investment. Financial markets are characterized by predictability
and inconsistent misalignments that force the prices to always deviate from their fundamental
valuations. This reflects the semi-strong information efficiency model. Full insurance efficiency
a third efficiency type ensures the continuous delivery of goods and services in all contingencies.
Finally functional/Operational efficiency states that products and services available at the
financial markets are provided for the least cost and are directly useful to the participants.
Therefore every financial market will contain a unique mixture of the identified efficiency types.
2.3 Review of Empirical Studies
Previous bankruptcy research had identified many ratios that were important in predicting
bankruptcy. Among the most popular financial ratios used by researchers were; Beaver (1966)
estimated a univariate financial distress model. Altman (1968) analyzed the financial distress
problem of a firm by employing a multiple discriminant analysis (MDA), Martin (1977) and
Ohlson (1980) investigated the profitability of a company under Logit model. The application of
a financial distress models includes static univariate analysis, multivariate discriminant analysis,
Logit model, probit model and neural network, and dynamic Merton model, CUSUM and so on.
Several recent papers have also served to emphasize the need for a timely model of UK financial
failure prediction, the parameters of which are fully in the public domain. First, Campbell,
Hilscher and Szilagyi (2008) show that financially distressed firms have delivered anomalously
low returns in the US. There is no UK equivalent to the model they use to estimate distress risk,
something we attempt to address in this paper. Second, Pope (2010) suggests that factor
mimicking portfolios based on financial distress risk may help deliver more powerful factor
models of expected returns. In respect of the UK, this suggestion pre-supposes that an
appropriate model is available. Of course, with regard to the latter one can make the case for
using a model that is well-understood, such as the z-score models of Taffler (1983, 1984) and
this is precisely the approach followed in Agarwal and Taffler (2008a), which provides some
fascinating evidence that momentum may be a proxy for distress risk.
12
However, in doing so it provides UK evidence that is consistent with the Campbell et al (2008)
finding, leaving the conundrum that markets, apparently, do not adequately price distress risk.
This alone motivates the search for a “better” distress prediction model that might resolve this
anomaly. Third, Agarwal and Taffler (2007) note the dramatic increase in UK firms with “at
risk” z-scores from 1997 onwards, which might imply the need for an updated UK prediction
model. Fourth, Shumway (2001) shows that a “hazard” or “dynamic logit” model gives better
predictive power than a simpler logit model. Chava and Jarrow (2004) develop this further by
adding industry controls, and show that such a model can easily be estimated using standard
statistical packages. As far as we are aware, these approaches to modeling, combined with the
Campbell et al (2008) innovations, have not been attempted in the UK. However, in the current
financial climate one scarcely needs to allude to the academic literature to justify an interest in a
timely measure of failure prediction – the likely interest from the wider community in such a
model is, regrettably, all too obvious.
In Kenya, Keige (1991) did a study on business failure prediction using discriminant analysis.
Kiragu (1993) did another study on the prediction of corporate failure using price adjusted data.
Kogi (2003) did an analysis of the discriminant corporate failure prediction model based on
stability of financial ratios.
In this paper, we will focus on statistical technique called multiple discriminant analysis as an
efficient predictor of corporate bankruptcy. We will examine the models predictive ability on
several completely holdout samples of firms listed under the NSE in Kenya.
2.4 Bankruptcy Prediction Models
Business failure models can be broadly divided into two groups: quantitative models, which are
based largely on published financial information; and qualitative models, which are based on an
internal assessment of the company concerned. Both types attempt to identify characteristics,
whether financial or non-financial, which can then be used to distinguish between surviving and
failing companies (Robinson and Maguire, 2001).
2.4.1. Qualitative Models
This category of model rests on the premise that the use of financial measures as sole indicators
of organizational performance is limited. For this reason, qualitative models are based on non-
13
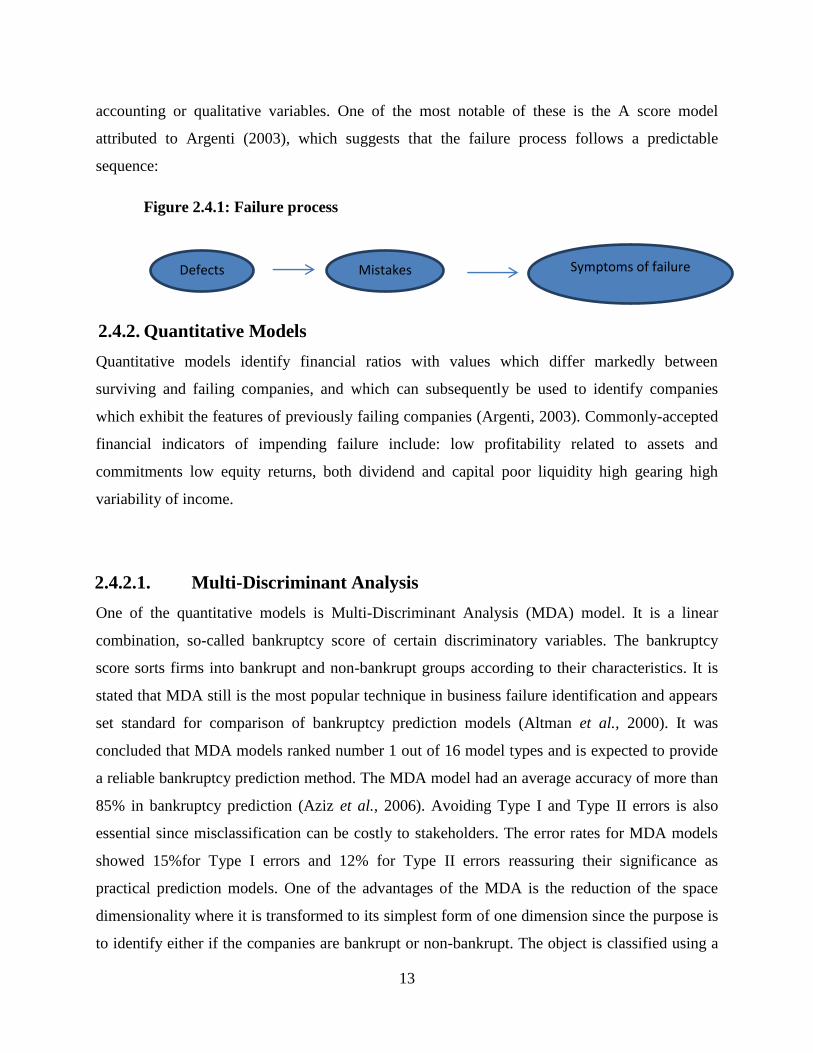
accounting or qualitative variables. One of the most notable of these is the A score model
attributed to Argenti (2003), which suggests that the failure process follows a predictable
sequence:
Figure 2.4.1: Failure process
2.4.2. Quantitative Models
Quantitative models identify financial ratios with values which differ markedly between
surviving and failing companies, and which can subsequently be used to identify companies
which exhibit the features of previously failing companies (Argenti, 2003). Commonly-accepted
financial indicators of impending failure include: low profitability related to assets and
commitments low equity returns, both dividend and capital poor liquidity high gearing high
variability of income.
2.4.2.1. Multi-Discriminant Analysis
One of the quantitative models is Multi-Discriminant Analysis (MDA) model. It is a linear
combination, so-called bankruptcy score of certain discriminatory variables. The bankruptcy
score sorts firms into bankrupt and non-bankrupt groups according to their characteristics. It is
stated that MDA still is the most popular technique in business failure identification and appears
set standard for comparison of bankruptcy prediction models (Altman et al., 2000). It was
concluded that MDA models ranked number 1 out of 16 model types and is expected to provide
a reliable bankruptcy prediction method. The MDA model had an average accuracy of more than
85% in bankruptcy prediction (Aziz et al., 2006). Avoiding Type I and Type II errors is also
essential since misclassification can be costly to stakeholders. The error rates for MDA models
showed 15%for Type I errors and 12% for Type II errors reassuring their significance as
practical prediction models. One of the advantages of the MDA is the reduction of the space
dimensionality where it is transformed to its simplest form of one dimension since the purpose is
to identify either if the companies are bankrupt or non-bankrupt. The object is classified using a
Defects Mistakes Symptoms of failure

14
single discriminant score namely the outcome of a discriminant function that transforms
individual variable values. In 1993, Altman revised his model to incorporate a “four variable Z-
Score” prediction model (Altman, 1993). Altman felt this revised model significantly improved
the predictive ability of his model and made it simpler to incorporate. Altman’s 1968 model took
the following form -:
Z’’ = 6.56X1 + 3.26X2 + 6.72X3 + 1.05X4
Where: X1 = (Current Assets - Current Liabilities)/Total Assets
X2 = Retained Earnings/Total Assets
X3 = Earnings Before Interest and Taxes/Total Assets
X4 = Book Value of Equity/Total Liabilities
Z’’ > 2.60 - “Safe” Zone
1.1 < Z’’ < 2.60 - “Grey” Zone
Z”< 1.1 - “Distress” Zone
Additionally, two adaptation of the 1968’s Z-score model are presented: the Z’-score and the Z”-
score. These models are summarized in order to clarify the differences and why the study is
testing the Z-Score of 1993.
15
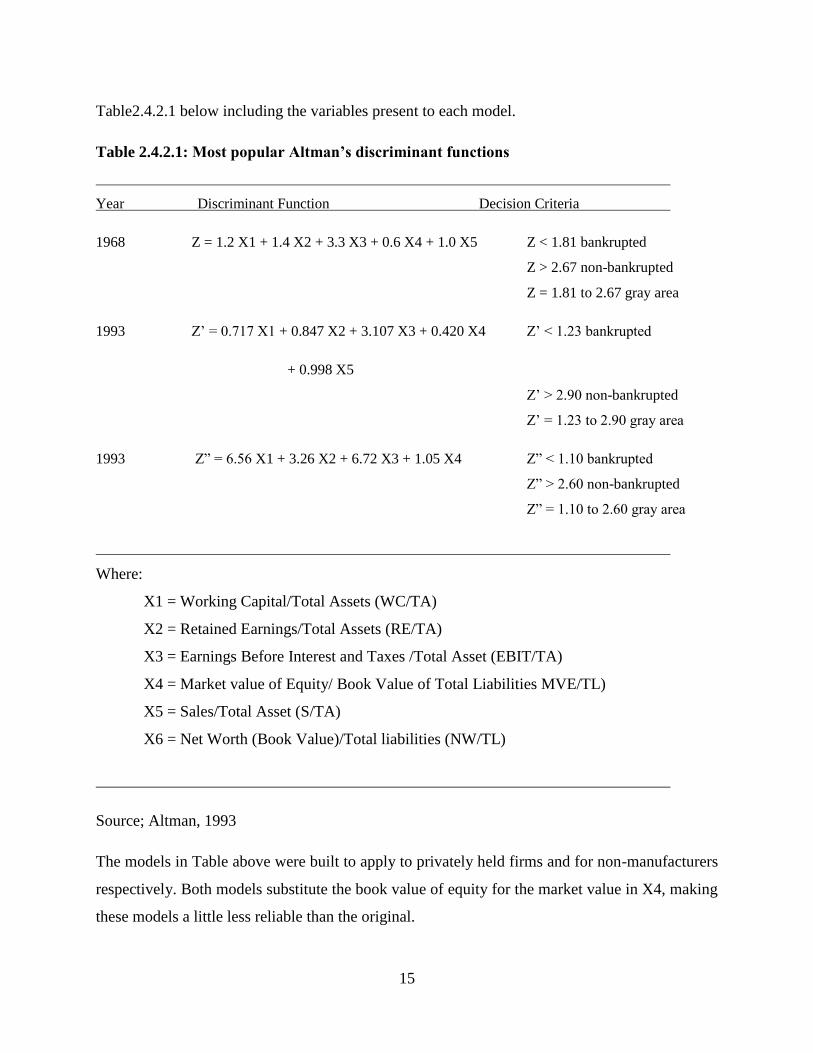
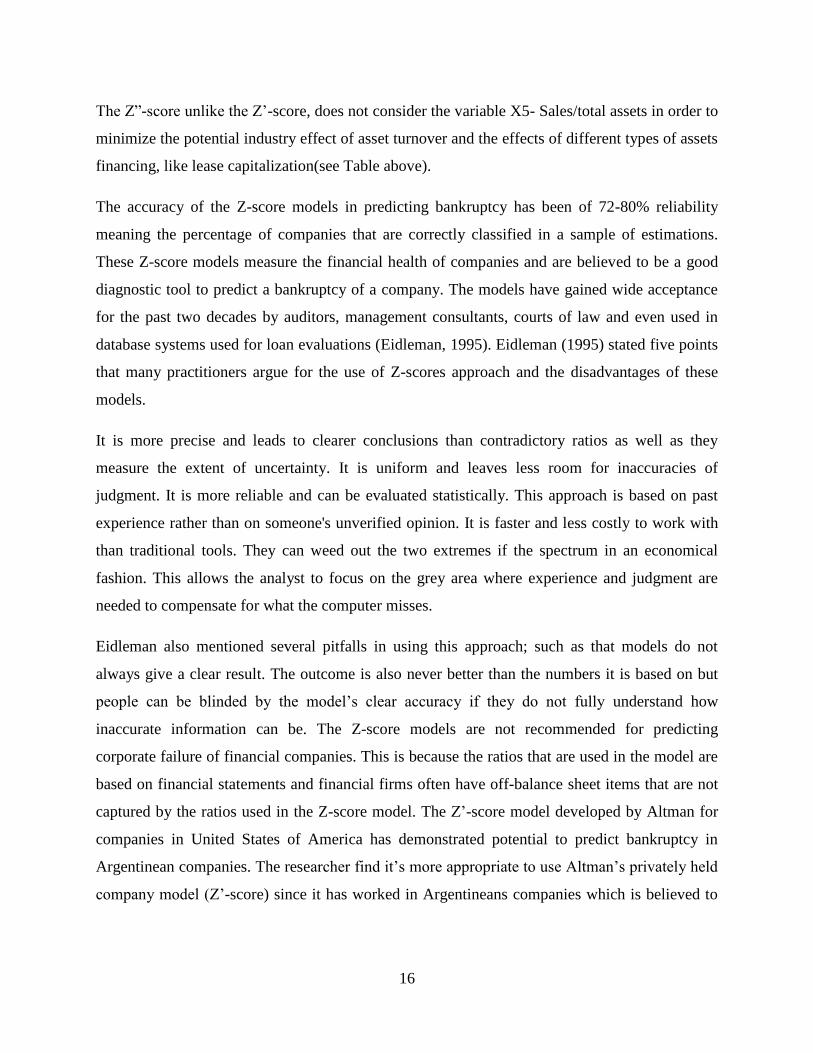
Table2.4.2.1 below including the variables present to each model.
Table 2.4.2.1: Most popular Altman’s discriminant functions
Year Discriminant Function Decision Criteria
1968 Z = 1.2 X1 + 1.4 X2 + 3.3 X3 + 0.6 X4 + 1.0 X5 Z < 1.81 bankrupted
Z > 2.67 non-bankrupted
Z = 1.81 to 2.67 gray area
1993 Z’ = 0.717 X1 + 0.847 X2 + 3.107 X3 + 0.420 X4 Z’ < 1.23 bankrupted
+ 0.998 X5
Z’ > 2.90 non-bankrupted
Z’ = 1.23 to 2.90 gray area
1993 Z” = 6.56 X1 + 3.26 X2 + 6.72 X3 + 1.05 X4 Z” < 1.10 bankrupted
Z” > 2.60 non-bankrupted
Z” = 1.10 to 2.60 gray area
Where:
X1 = Working Capital/Total Assets (WC/TA)
X2 = Retained Earnings/Total Assets (RE/TA)
X3 = Earnings Before Interest and Taxes /Total Asset (EBIT/TA)
X4 = Market value of Equity/ Book Value of Total Liabilities MVE/TL)
X5 = Sales/Total Asset (S/TA)
X6 = Net Worth (Book Value)/Total liabilities (NW/TL)
Source; Altman, 1993
The models in Table above were built to apply to privately held firms and for non-manufacturers
respectively. Both models substitute the book value of equity for the market value in X4, making
these models a little less reliable than the original.
16
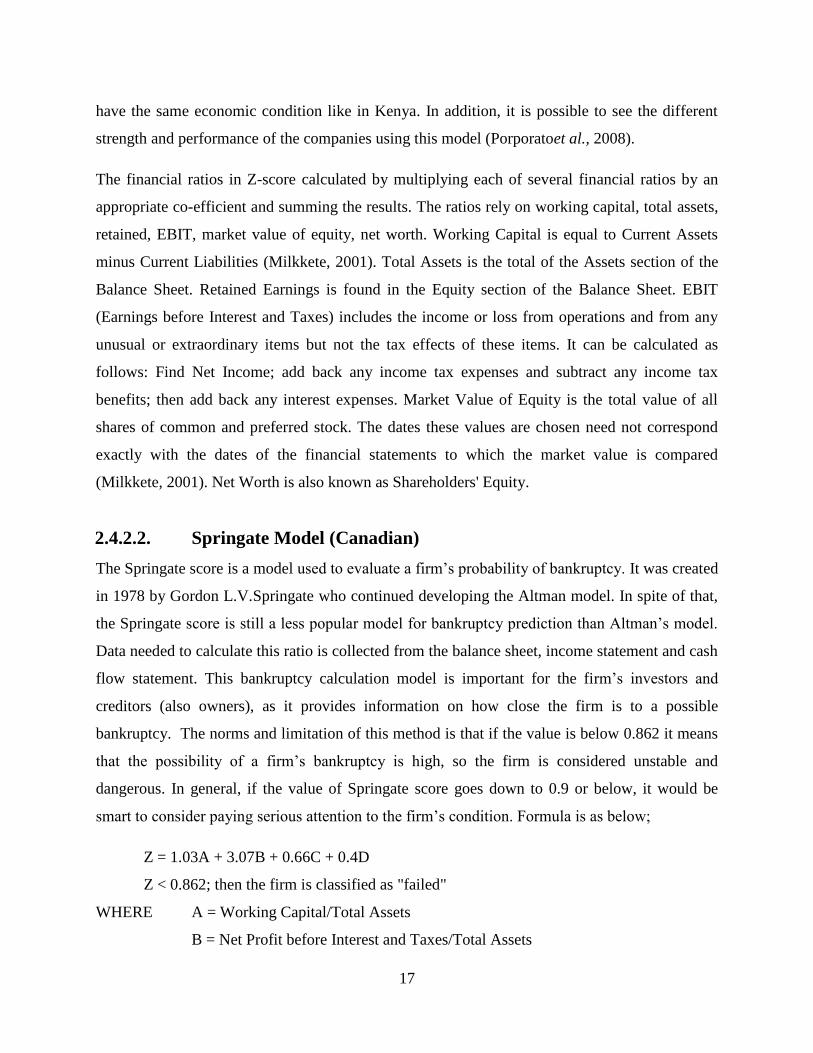
The Z”-score unlike the Z’-score, does not consider the variable X5- Sales/total assets in order to
minimize the potential industry effect of asset turnover and the effects of different types of assets
financing, like lease capitalization(see Table above).
The accuracy of the Z-score models in predicting bankruptcy has been of 72-80% reliability
meaning the percentage of companies that are correctly classified in a sample of estimations.
These Z-score models measure the financial health of companies and are believed to be a good
diagnostic tool to predict a bankruptcy of a company. The models have gained wide acceptance
for the past two decades by auditors, management consultants, courts of law and even used in
database systems used for loan evaluations (Eidleman, 1995). Eidleman (1995) stated five points
that many practitioners argue for the use of Z-scores approach and the disadvantages of these
models.
It is more precise and leads to clearer conclusions than contradictory ratios as well as they
measure the extent of uncertainty. It is uniform and leaves less room for inaccuracies of
judgment. It is more reliable and can be evaluated statistically. This approach is based on past
experience rather than on someone's unverified opinion. It is faster and less costly to work with
than traditional tools. They can weed out the two extremes if the spectrum in an economical
fashion. This allows the analyst to focus on the grey area where experience and judgment are
needed to compensate for what the computer misses.
Eidleman also mentioned several pitfalls in using this approach; such as that models do not
always give a clear result. The outcome is also never better than the numbers it is based on but
people can be blinded by the model’s clear accuracy if they do not fully understand how
inaccurate information can be. The Z-score models are not recommended for predicting
corporate failure of financial companies. This is because the ratios that are used in the model are
based on financial statements and financial firms often have off-balance sheet items that are not
captured by the ratios used in the Z-score model. The Z’-score model developed by Altman for
companies in United States of America has demonstrated potential to predict bankruptcy in
Argentinean companies. The researcher find it’s more appropriate to use Altman’s privately held
company model (Z’-score) since it has worked in Argentineans companies which is believed to
17
have the same economic condition like in Kenya. In addition, it is possible to see the different
strength and performance of the companies using this model (Porporatoet al., 2008).
The financial ratios in Z-score calculated by multiplying each of several financial ratios by an
appropriate co-efficient and summing the results. The ratios rely on working capital, total assets,
retained, EBIT, market value of equity, net worth. Working Capital is equal to Current Assets
minus Current Liabilities (Milkkete, 2001). Total Assets is the total of the Assets section of the
Balance Sheet. Retained Earnings is found in the Equity section of the Balance Sheet. EBIT
(Earnings before Interest and Taxes) includes the income or loss from operations and from any
unusual or extraordinary items but not the tax effects of these items. It can be calculated as
follows: Find Net Income; add back any income tax expenses and subtract any income tax
benefits; then add back any interest expenses. Market Value of Equity is the total value of all
shares of common and preferred stock. The dates these values are chosen need not correspond
exactly with the dates of the financial statements to which the market value is compared
(Milkkete, 2001). Net Worth is also known as Shareholders' Equity.
2.4.2.2. Springate Model (Canadian)
The Springate score is a model used to evaluate a firm’s probability of bankruptcy. It was created
in 1978 by Gordon L.V.Springate who continued developing the Altman model. In spite of that,
the Springate score is still a less popular model for bankruptcy prediction than Altman’s model.
Data needed to calculate this ratio is collected from the balance sheet, income statement and cash
flow statement. This bankruptcy calculation model is important for the firm’s investors and
creditors (also owners), as it provides information on how close the firm is to a possible
bankruptcy. The norms and limitation of this method is that if the value is below 0.862 it means
that the possibility of a firm’s bankruptcy is high, so the firm is considered unstable and
dangerous. In general, if the value of Springate score goes down to 0.9 or below, it would be
smart to consider paying serious attention to the firm’s condition. Formula is as below;
Z = 1.03A + 3.07B + 0.66C + 0.4D
Z < 0.862; then the firm is classified as "failed"
WHERE A = Working Capital/Total Assets
B = Net Profit before Interest and Taxes/Total Assets
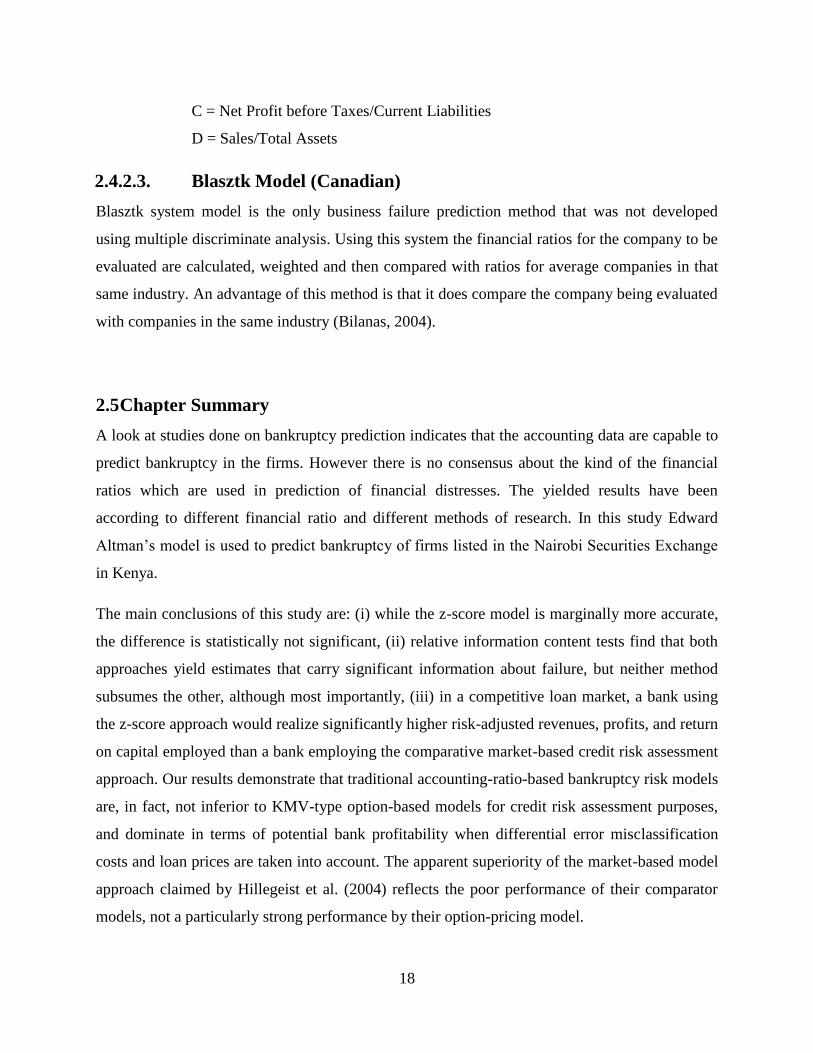
18
C = Net Profit before Taxes/Current Liabilities
D = Sales/Total Assets
2.4.2.3. Blasztk Model (Canadian)
Blasztk system model is the only business failure prediction method that was not developed
using multiple discriminate analysis. Using this system the financial ratios for the company to be
evaluated are calculated, weighted and then compared with ratios for average companies in that
same industry. An advantage of this method is that it does compare the company being evaluated
with companies in the same industry (Bilanas, 2004).
2.5 Chapter Summary
A look at studies done on bankruptcy prediction indicates that the accounting data are capable to
predict bankruptcy in the firms. However there is no consensus about the kind of the financial
ratios which are used in prediction of financial distresses. The yielded results have been
according to different financial ratio and different methods of research. In this study Edward
Altman’s model is used to predict bankruptcy of firms listed in the Nairobi Securities Exchange
in Kenya.
The main conclusions of this study are: (i) while the z-score model is marginally more accurate,
the difference is statistically not significant, (ii) relative information content tests find that both
approaches yield estimates that carry significant information about failure, but neither method
subsumes the other, although most importantly, (iii) in a competitive loan market, a bank using
the z-score approach would realize significantly higher risk-adjusted revenues, profits, and return
on capital employed than a bank employing the comparative market-based credit risk assessment
approach. Our results demonstrate that traditional accounting-ratio-based bankruptcy risk models
are, in fact, not inferior to KMV-type option-based models for credit risk assessment purposes,
and dominate in terms of potential bank profitability when differential error misclassification
costs and loan prices are taken into account. The apparent superiority of the market-based model
approach claimed by Hillegeist et al. (2004) reflects the poor performance of their comparator
models, not a particularly strong performance by their option-pricing model.
19
CHAPTER THREE
RESEARCH METHODOLOGY
3.1. Introduction
This chapter presented an outline of the research methodology used in the study. It covered the
research design, target population, described the sample population, outlines the data collection
procedures and sources and described the data analysis tools.
3.2. Research Design
The main purpose of this research was to determine the bankruptcy prediction of firms listed in
the NSE. The researcher used descriptive research design. This was deemed appropriate as it
involved a depth of study of the bankruptcy prediction of firms listed in NSE which helped the
researcher to describe the state of current affairs of firms and assess the characteristics of the
situation. The research was established for a period between 2008- 2012. This period was
considered by the researcher to be adequate for establishing any bankruptcy prediction of the
NSE listed firms.
3.3. Population of the study
The population of this study comprised of all firms listed on the NSE. Failed firms were
considered to be those that had either been suspended or delisted from the NSE to date. They
were only10 firms during this period. Non-failed firms were all entities listed in the NSE since
the year 1989-2008. To fall under this study’s category of non-failed firms, the firms had been
suspended or delisted for the period under focus. As at September 2013 there were 62 firms
listed on the NSE. This statistic was received from NSE and the Capital Markets Authority
(CMA) website. This was convenient due to the fact that financial statements of listed firms were
readily available and reliable.
3.4. Sample Selection
The sample size comprised of at least one firm from each of the twelve sectors listed on the NSE
(Appendix 1) depending on the availability of data. Convenient sampling technique was used to
20
establish bankruptcy prediction of firms across all industries/ sector of the NSE and the data is
easily accessible and reliable for listed firms.
3.5. Data Collection
Data was obtained from financial reports of the listed companies at the Nairobi Securities
Exchange and the Capital Markets Authority. The secondary data was in form of current assets
and liabilities, total assets, retained earnings, earnings before interest and taxes, book value of
equity, and sales. The period covered by the study was extended to five years, starting from
2008-2012.Discriminant analysis was used. Specifically a discriminant function was formulated
from the ratios. The function was in the form; Z=a1X1 + a2X2 + a3X3 +…. + anXn where Z=
discriminant score, a1, a2,…an =discriminant coefficients and X1, X2,…Xn= independent
variables.
3.6. Data Analysis
The field of research on bankruptcy prediction has revealed a large number of significant
predictors of failure (Beaver, 1968a; Blum, 1974; Altman, 1968; Altman, et al., 1977; Chatterjee
et al., 1966; Back et al., 1996). The variables were classified into profitability, liquidity, and
solvency, degree of economic distress, leverage, efficiency, variability and size. The selected
variables were used in discriminant analysis to develop a model for failure prediction
Discriminant analysis model was used in the data analysis, reason being that it was termed as an
efficient predictor of corporate bankruptcy. Discriminant analysis is a multivariate technique that
seeks to determine whether a set of variables significantly differentiate among two or more sets
of data, as well as determine specific combination variables that most efficiently differentiate
among groups. In this case the aim was to determine that sets of ratios that maximize the
differences between failed and non-failed firms.
The Z-score is a linear combination of four or five common business ratios, weighted by
coefficients. The coefficients were estimated by identifying a set of firms which had been
declared bankrupt. These were matched by sample of firms which had survived, matching being
done by industry and asset size. Five measures were objectively weighted and summed up to
arrive at an overall score that then becomes the basis for classification of firms into one of the
prior groupings (distressed and non-distressed).
21
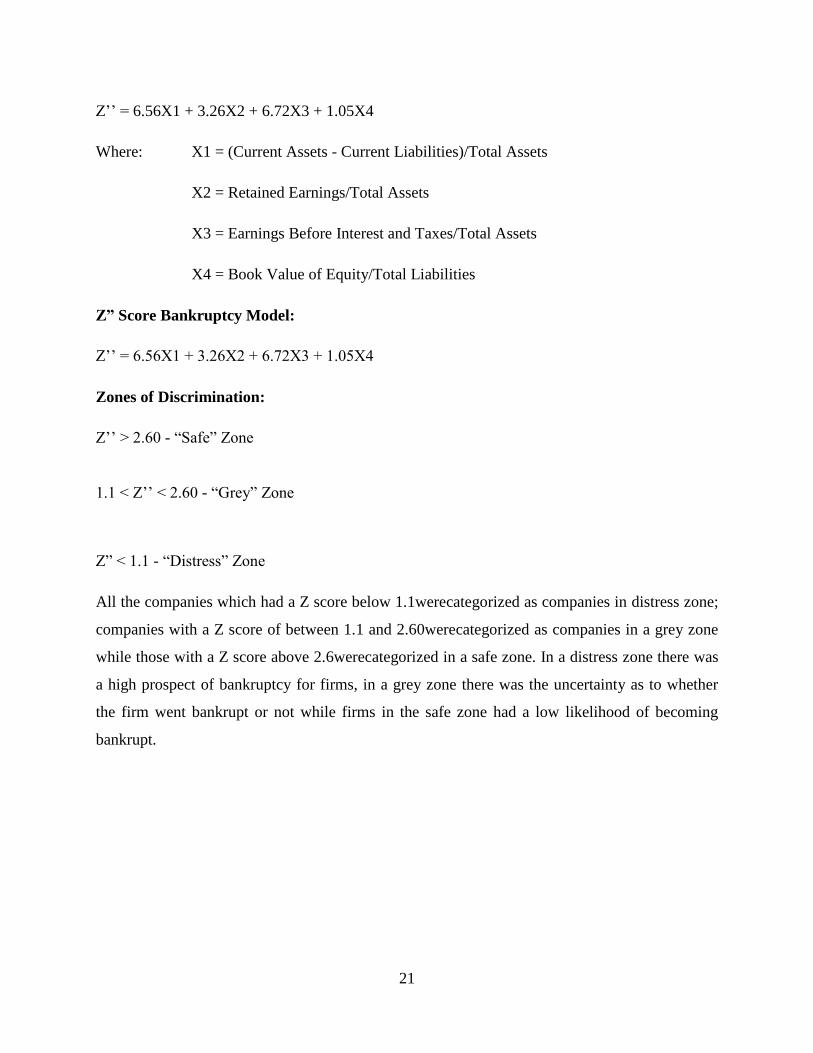
Z’’ = 6.56X1 + 3.26X2 + 6.72X3 + 1.05X4
Where: X1 = (Current Assets - Current Liabilities)/Total Assets
X2 = Retained Earnings/Total Assets
X3 = Earnings Before Interest and Taxes/Total Assets
X4 = Book Value of Equity/Total Liabilities
Z” Score Bankruptcy Model:
Z’’ = 6.56X1 + 3.26X2 + 6.72X3 + 1.05X4
Zones of Discrimination:
Z’’ > 2.60 - “Safe” Zone
1.1 < Z’’ < 2.60 - “Grey” Zone
Z” < 1.1 - “Distress” Zone
All the companies which had a Z score below 1.1werecategorized as companies in distress zone;
companies with a Z score of between 1.1 and 2.60werecategorized as companies in a grey zone
while those with a Z score above 2.6werecategorized in a safe zone. In a distress zone there was
a high prospect of bankruptcy for firms, in a grey zone there was the uncertainty as to whether
the firm went bankrupt or not while firms in the safe zone had a low likelihood of becoming
bankrupt.
22
CHAPTER FOUR
DATA ANALYSIS, RESULTS AND DISCUSSIONS
4.1. Introduction
Data analysis is a process of gathering, modeling and transforming data with the goal of
highlighting useful information, suggesting conclusions and supporting decision making. This
chapter shows the analysis, results and discussion of findings of the study as set out in chapter
three. The Statistical Package for Social Sciences software and MS Excel Application were used
and the findings were presented as descriptive statistics and tables. Data was collected from
audited financials reports for the selected companies as set out in the appendices.
4.2. Data Presentation
4.2.1 Descriptive Successful Firms
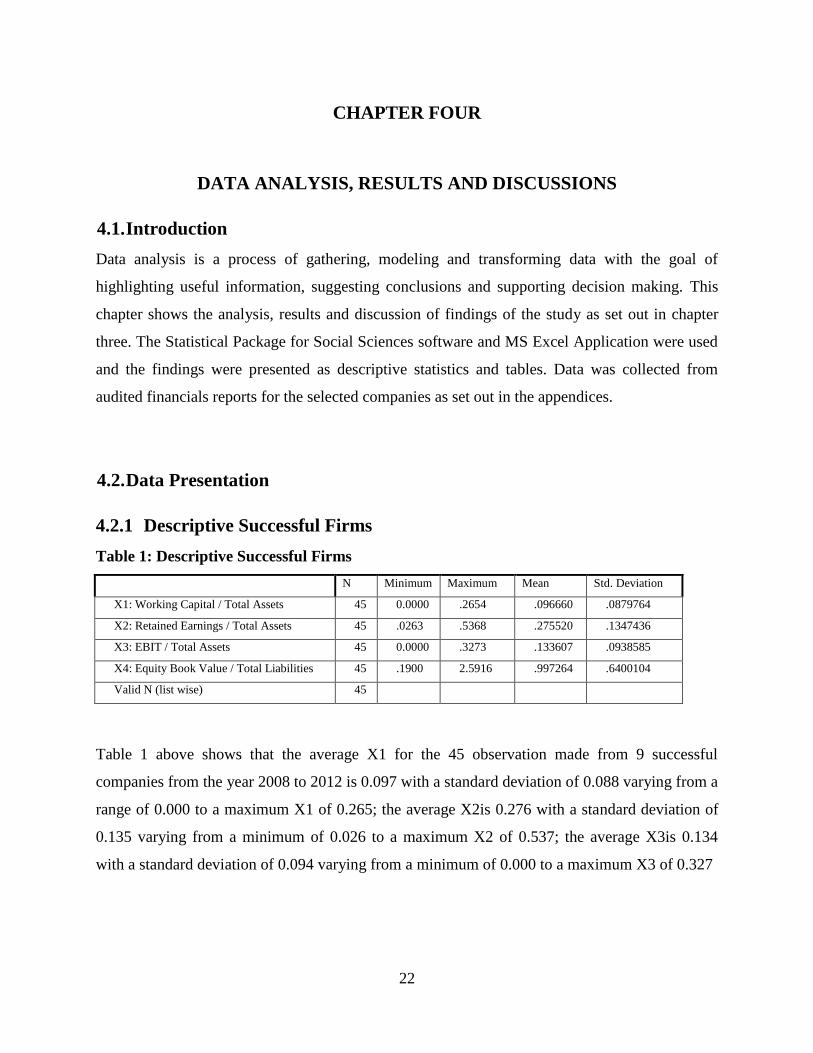
Table 1: Descriptive Successful Firms
N Minimum Maximum Mean Std. Deviation
X1: Working Capital / Total Assets 45 0.0000 .2654 .096660 .0879764
X2: Retained Earnings / Total Assets 45 .0263 .5368 .275520 .1347436
X3: EBIT / Total Assets 45 0.0000 .3273 .133607 .0938585
X4: Equity Book Value / Total Liabilities 45 .1900 2.5916 .997264 .6400104
Valid N (list wise) 45
Table 1 above shows that the average X1 for the 45 observation made from 9 successful
companies from the year 2008 to 2012 is 0.097 with a standard deviation of 0.088 varying from a
range of 0.000 to a maximum X1 of 0.265; the average X2is 0.276 with a standard deviation of
0.135 varying from a minimum of 0.026 to a maximum X2 of 0.537; the average X3is 0.134
with a standard deviation of 0.094 varying from a minimum of 0.000 to a maximum X3 of 0.327
23
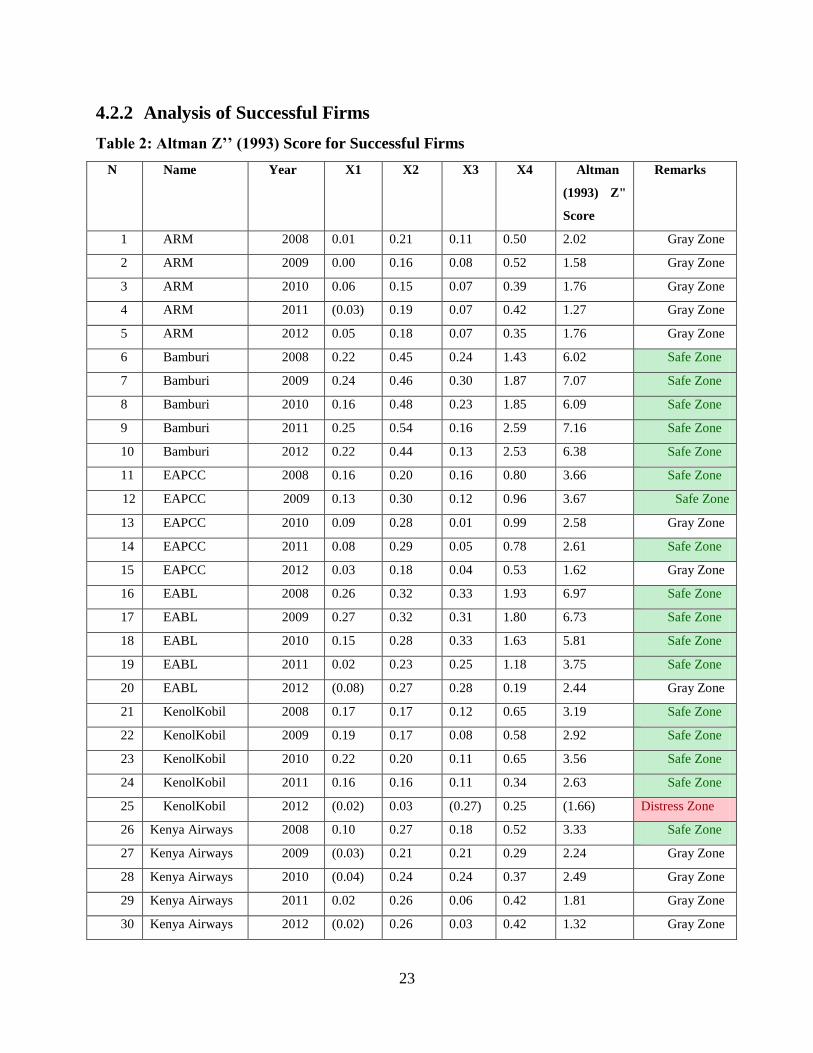
4.2.2 Analysis of Successful Firms
Table 2: Altman Z’’ (1993) Score for Successful Firms
N Name Year X1 X2 X3 X4 Altman
(1993) Z"
Score
Remarks
1 ARM 2008 0.01 0.21 0.11 0.50 2.02 Gray Zone
2 ARM 2009 0.00 0.16 0.08 0.52 1.58 Gray Zone
3 ARM 2010 0.06 0.15 0.07 0.39 1.76 Gray Zone
4 ARM 2011 (0.03) 0.19 0.07 0.42 1.27 Gray Zone
5 ARM 2012 0.05 0.18 0.07 0.35 1.76 Gray Zone
6 Bamburi 2008 0.22 0.45 0.24 1.43 6.02 Safe Zone
7 Bamburi 2009 0.24 0.46 0.30 1.87 7.07 Safe Zone
8 Bamburi 2010 0.16 0.48 0.23 1.85 6.09 Safe Zone
9 Bamburi 2011 0.25 0.54 0.16 2.59 7.16 Safe Zone
10 Bamburi 2012 0.22 0.44 0.13 2.53 6.38 Safe Zone
11 EAPCC 2008 0.16 0.20 0.16 0.80 3.66 Safe Zone
12 EAPCC 2009 0.13 0.30 0.12 0.96 3.67 Safe Zone
13 EAPCC 2010 0.09 0.28 0.01 0.99 2.58 Gray Zone
14 EAPCC 2011 0.08 0.29 0.05 0.78 2.61 Safe Zone
15 EAPCC 2012 0.03 0.18 0.04 0.53 1.62 Gray Zone
16 EABL 2008 0.26 0.32 0.33 1.93 6.97 Safe Zone
17 EABL 2009 0.27 0.32 0.31 1.80 6.73 Safe Zone
18 EABL 2010 0.15 0.28 0.33 1.63 5.81 Safe Zone
19 EABL 2011 0.02 0.23 0.25 1.18 3.75 Safe Zone
20 EABL 2012 (0.08) 0.27 0.28 0.19 2.44 Gray Zone
21 KenolKobil 2008 0.17 0.17 0.12 0.65 3.19 Safe Zone
22 KenolKobil 2009 0.19 0.17 0.08 0.58 2.92 Safe Zone
23 KenolKobil 2010 0.22 0.20 0.11 0.65 3.56 Safe Zone
24 KenolKobil 2011 0.16 0.16 0.11 0.34 2.63 Safe Zone
25 KenolKobil 2012 (0.02) 0.03 (0.27) 0.25 (1.66) Distress Zone
26 Kenya Airways 2008 0.10 0.27 0.18 0.52 3.33 Safe Zone
27 Kenya Airways 2009 (0.03) 0.21 0.21 0.29 2.24 Gray Zone
28 Kenya Airways 2010 (0.04) 0.24 0.24 0.37 2.49 Gray Zone
29 Kenya Airways 2011 0.02 0.26 0.06 0.42 1.81 Gray Zone
30 Kenya Airways 2012 (0.02) 0.26 0.03 0.42 1.32 Gray Zone
24
31 Mumias Sugar 2008 0.08 0.29 0.11 1.77 4.11 Safe Zone
32 Mumias Sugar 2009 0.08 0.30 0.07 1.35 3.37 Safe Zone
33 Mumias Sugar 2010 0.18 0.35 0.12 1.50 4.67 Safe Zone
34 Mumias Sugar 2011 0.15 0.34 0.11 1.66 4.63 Safe Zone
35 Mumias Sugar 2012 0.05 0.34 0.06 1.35 3.30 Safe Zone
36 Safaricom 2008 (0.17) 0.49 0.27 1.34 3.74 Safe Zone
37 Safaricom 2009 (0.20) 0.48 0.17 1.28 2.73 Safe Zone
38 Safaricom 2010 (0.11) 0.49 0.20 1.49 3.80 Safe Zone
39 Safaricom 2011 (0.11) 0.49 0.16 1.45 3.50 Safe Zone
40 Safaricom 2012 (0.13) 0.49 0.14 1.45 3.20 Safe Zone
41 Total Kenya 2008 0.16 0.15 0.07 0.53 2.54 Gray Zone
42 Total Kenya 2009 0.07 0.07 0.02 0.40 1.25 Gray Zone
43 Total Kenya 2010 0.09 0.09 0.05 0.46 1.66 Gray Zone
44 Total Kenya 2011 0.07 0.07 0.00 0.35 1.05 Distress Zone
45 Total Kenya 2012 0.16 0.07 (0.00) 0.76 2.08 Gray Zone
The table 2 above shows the different values of X1, X2, X3, X4, Altman Z” Scores for the 1993
model as well as the remarks for the finding as per Altman explanation of different scores.
Altman’s (1993) Z’’ score model was applied for the nine listed successful firms and results
were shown alongside with remarks of the categories which they fall into. However, 35.6 % of
the observed firms that ought to be classified in the safe zone had z’’ scores that classified them
in the gray zone whereas two observations that rendered to Total and Kenol Kobil in the distress
zone in the years 2011 and 2012 respectively.
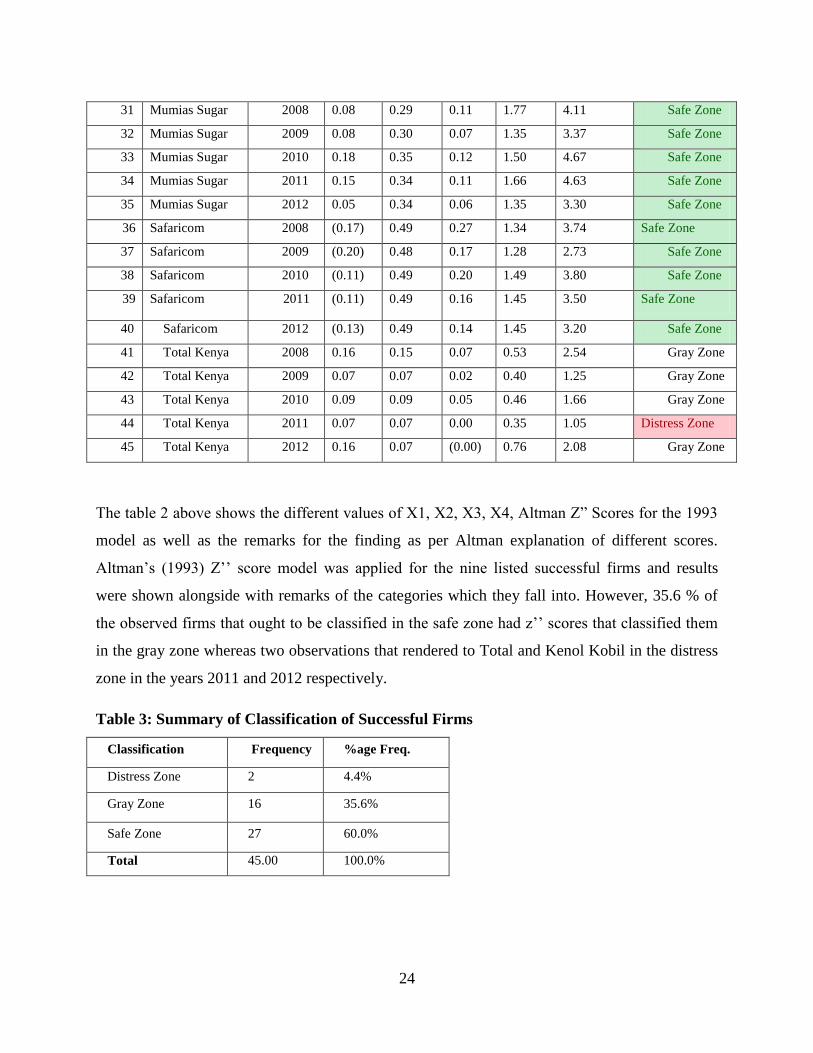
Table 3: Summary of Classification of Successful Firms
Classification Frequency %age Freq.
Distress Zone 2 4.4%
Gray Zone 16 35.6%
Safe Zone 27 60.0%
Total 45.00 100.0%
25
It can be noted that Altman’s (1993) Z’’ score model correctly classified 60% of the observed
firms and 4.4% were classified in the distress zone whereas a big portion of successful firms
were in the gray zone 35.6% of observed firms which greatly increases uncertainty about their
future classification. This shows that the model should be used with utmost caution for
classifying firms as either failed or successful since there’s a greater margin of error. Altman’s
(1993) Z’’ score model was intended for non-manufacturing firms and has only four variables
which he thought could best predict bankruptcy and more so he presumed that all the multi
discriminant assumptions were satisfied and he went ahead to run such a model. However
contemporary critiques advocate for the use of logistic regression because of the many
assumptions of multi discriminant analysis that are rarely in reality satisfied which ultimately
reduce errors of wrong classification. The findings agree with those of Alareeni and Branson
(2012) who found that Altman Z’’ score (1993) model had limited predictive power as compared
to that of Altman Z score of 1968.
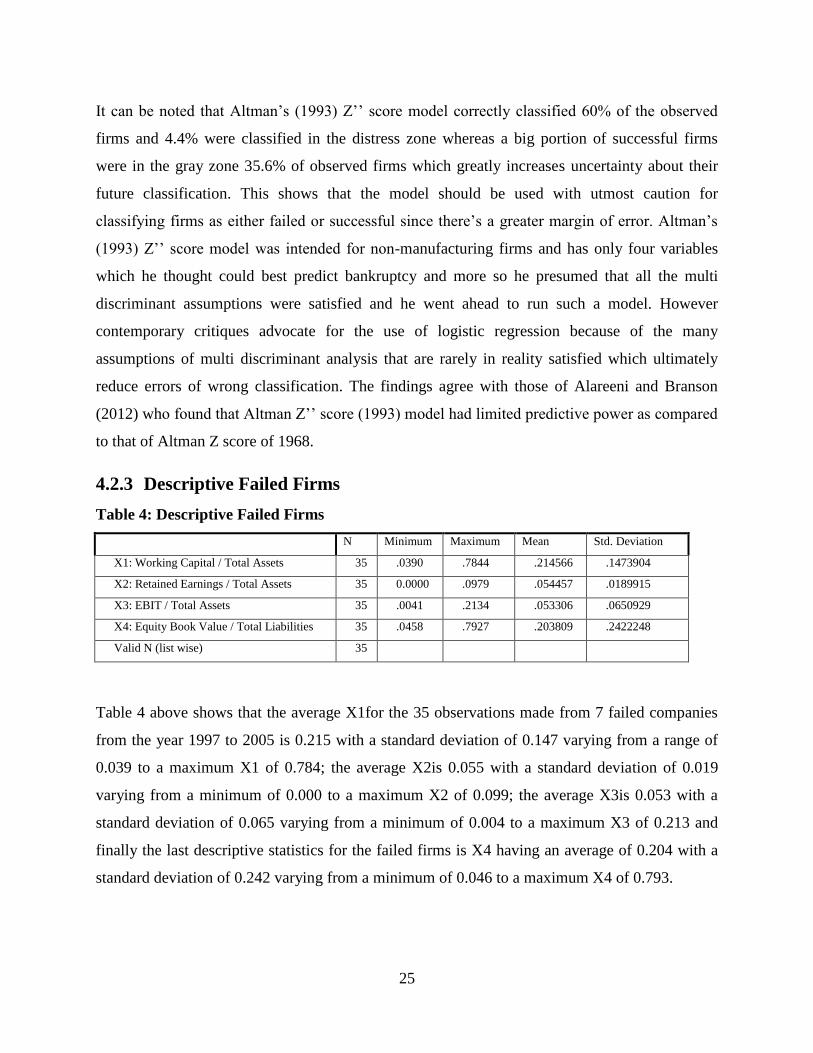
4.2.3 Descriptive Failed Firms
Table 4: Descriptive Failed Firms
N Minimum Maximum Mean Std. Deviation
X1: Working Capital / Total Assets 35 .0390 .7844 .214566 .1473904
X2: Retained Earnings / Total Assets 35 0.0000 .0979 .054457 .0189915
X3: EBIT / Total Assets 35 .0041 .2134 .053306 .0650929
X4: Equity Book Value / Total Liabilities 35 .0458 .7927 .203809 .2422248
Valid N (list wise) 35
Table 4 above shows that the average X1for the 35 observations made from 7 failed companies
from the year 1997 to 2005 is 0.215 with a standard deviation of 0.147 varying from a range of
0.039 to a maximum X1 of 0.784; the average X2is 0.055 with a standard deviation of 0.019
varying from a minimum of 0.000 to a maximum X2 of 0.099; the average X3is 0.053 with a
standard deviation of 0.065 varying from a minimum of 0.004 to a maximum X3 of 0.213 and
finally the last descriptive statistics for the failed firms is X4 having an average of 0.204 with a
standard deviation of 0.242 varying from a minimum of 0.046 to a maximum X4 of 0.793.
26
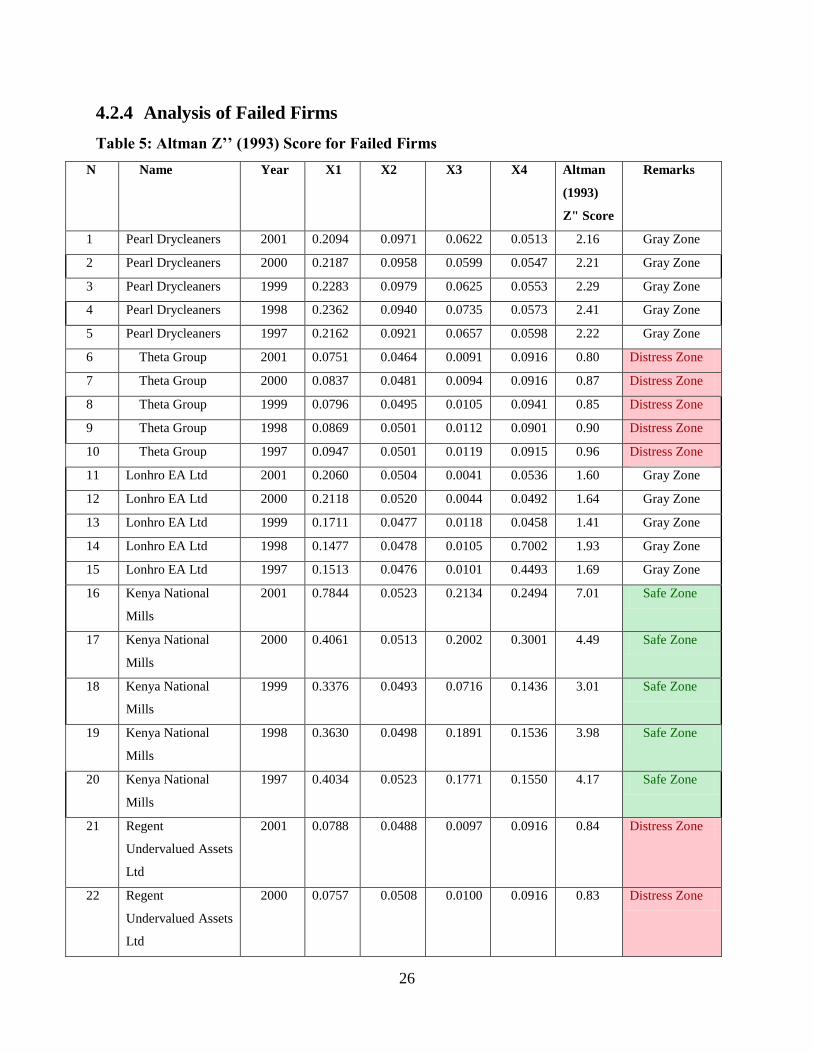
4.2.4 Analysis of Failed Firms
Table 5: Altman Z’’ (1993) Score for Failed Firms
N Name Year X1 X2 X3 X4 Altman
(1993)
Z" Score
Remarks
1 Pearl Drycleaners 2001 0.2094 0.0971 0.0622 0.0513 2.16 Gray Zone
2 Pearl Drycleaners 2000 0.2187 0.0958 0.0599 0.0547 2.21 Gray Zone
3 Pearl Drycleaners 1999 0.2283 0.0979 0.0625 0.0553 2.29 Gray Zone
4 Pearl Drycleaners 1998 0.2362 0.0940 0.0735 0.0573 2.41 Gray Zone
5 Pearl Drycleaners 1997 0.2162 0.0921 0.0657 0.0598 2.22 Gray Zone
6 Theta Group 2001 0.0751 0.0464 0.0091 0.0916 0.80 Distress Zone
7 Theta Group 2000 0.0837 0.0481 0.0094 0.0916 0.87 Distress Zone
8 Theta Group 1999 0.0796 0.0495 0.0105 0.0941 0.85 Distress Zone
9 Theta Group 1998 0.0869 0.0501 0.0112 0.0901 0.90 Distress Zone
10 Theta Group 1997 0.0947 0.0501 0.0119 0.0915 0.96 Distress Zone
11 Lonhro EA Ltd 2001 0.2060 0.0504 0.0041 0.0536 1.60 Gray Zone
12 Lonhro EA Ltd 2000 0.2118 0.0520 0.0044 0.0492 1.64 Gray Zone
13 Lonhro EA Ltd 1999 0.1711 0.0477 0.0118 0.0458 1.41 Gray Zone
14 Lonhro EA Ltd 1998 0.1477 0.0478 0.0105 0.7002 1.93 Gray Zone
15 Lonhro EA Ltd 1997 0.1513 0.0476 0.0101 0.4493 1.69 Gray Zone
16 Kenya National
Mills
2001 0.7844 0.0523 0.2134 0.2494 7.01 Safe Zone
17 Kenya National
Mills
2000 0.4061 0.0513 0.2002 0.3001 4.49 Safe Zone
18 Kenya National
Mills
1999 0.3376 0.0493 0.0716 0.1436 3.01 Safe Zone
19 Kenya National
Mills
1998 0.3630 0.0498 0.1891 0.1536 3.98 Safe Zone
20 Kenya National
Mills
1997 0.4034 0.0523 0.1771 0.1550 4.17 Safe Zone
21 Regent
Undervalued Assets
Ltd
2001 0.0788 0.0488 0.0097 0.0916 0.84 Distress Zone
22 Regent
Undervalued Assets
Ltd
2000 0.0757 0.0508 0.0100 0.0916 0.83 Distress Zone
27
23 Regent
Undervalued Assets
Ltd
1999 0.0781 0.0523 0.0113 0.0941 0.86 Distress Zone
24 Regent
Undervalued Assets
Ltd
1998 0.0930 0.0529 0.0120 0.0901 0.96 Distress Zone
25 Regent
Undervalued Assets
Ltd
1997 0.0943 0.0514 0.0127 0.0915 0.97 Distress Zone
26 Uchumi
Supermarket
2005 0.0390 - 0.2002 0.3332 1.95 Gray Zone
27 Uchumi
Supermarket
2004 0.3376 0.0493 0.0716 0.6965 3.59 Safe Zone
28 Uchumi
Supermarket
2003 0.3687 0.0491 0.0681 0.7573 3.83 Safe Zone
29 Uchumi
Supermarket
2002 0.3584 0.0485 0.0806 0.7848 3.87 Safe Zone
30 Uchumi
Supermarket
2001 0.3639 0.0477 0.0790 0.7927 3.91 Safe Zone
31 EA Packaging 2002 0.2171 0.0485 0.0042 0.0523 1.67 Gray Zone
32 EA Packaging 2001 0.2122 0.0483 0.0044 0.0510 1.63 Gray Zone
33 EA Packaging 2000 0.1829 0.0456 0.0123 0.0517 1.49 Gray Zone
34 EA Packaging 1999 0.1496 0.0457 0.0109 0.0587 1.27 Gray Zone
35 EA Packaging 1998 0.1493 0.0455 0.0105 0.0591 1.26 Gray Zone
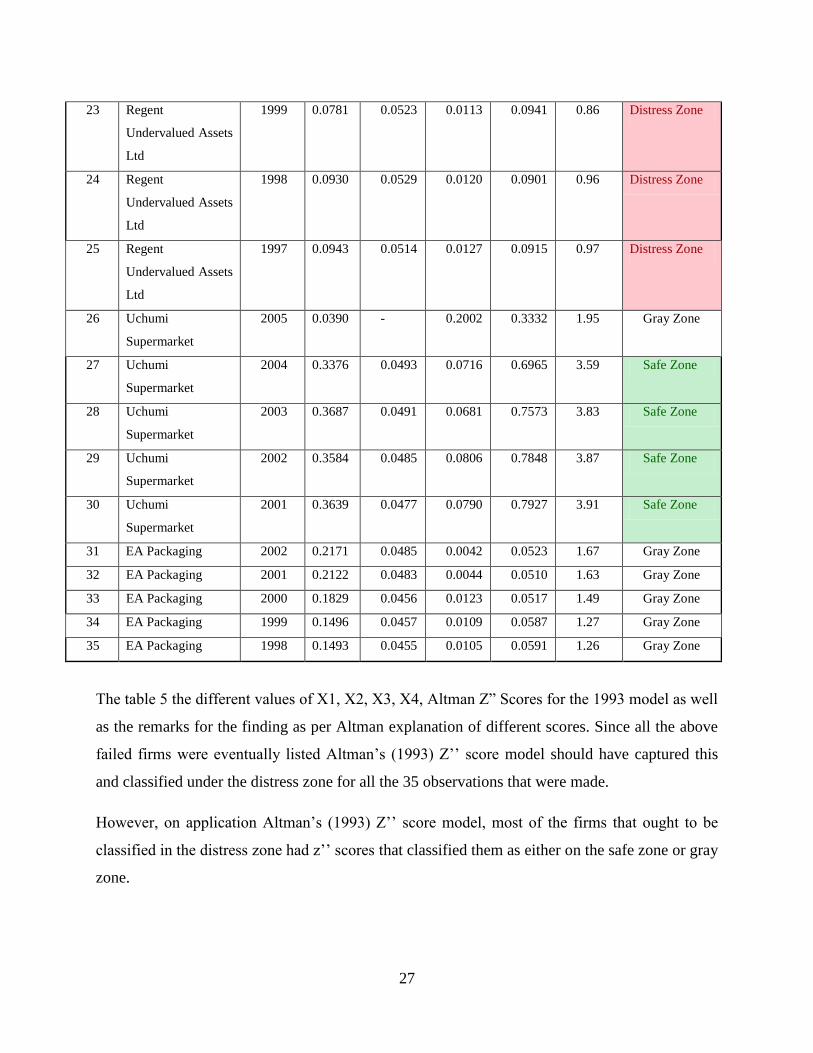
The table 5 the different values of X1, X2, X3, X4, Altman Z” Scores for the 1993 model as well
as the remarks for the finding as per Altman explanation of different scores. Since all the above
failed firms were eventually listed Altman’s (1993) Z’’ score model should have captured this
and classified under the distress zone for all the 35 observations that were made.
However, on application Altman’s (1993) Z’’ score model, most of the firms that ought to be
classified in the distress zone had z’’ scores that classified them as either on the safe zone or gray
zone.
28
Table 6: Delisting Year of Failed Firms
Company Year Delisted
1 Pearl Drycleaners 2001
2 Theta Group 2001
3 Lonhro EA Ltd 2001
4 Kenya National Mills 2002
5 Regent Undervalued Assets Ltd 2001
6 Uchumi Supermarket 2005
7 EA Packaging 2003
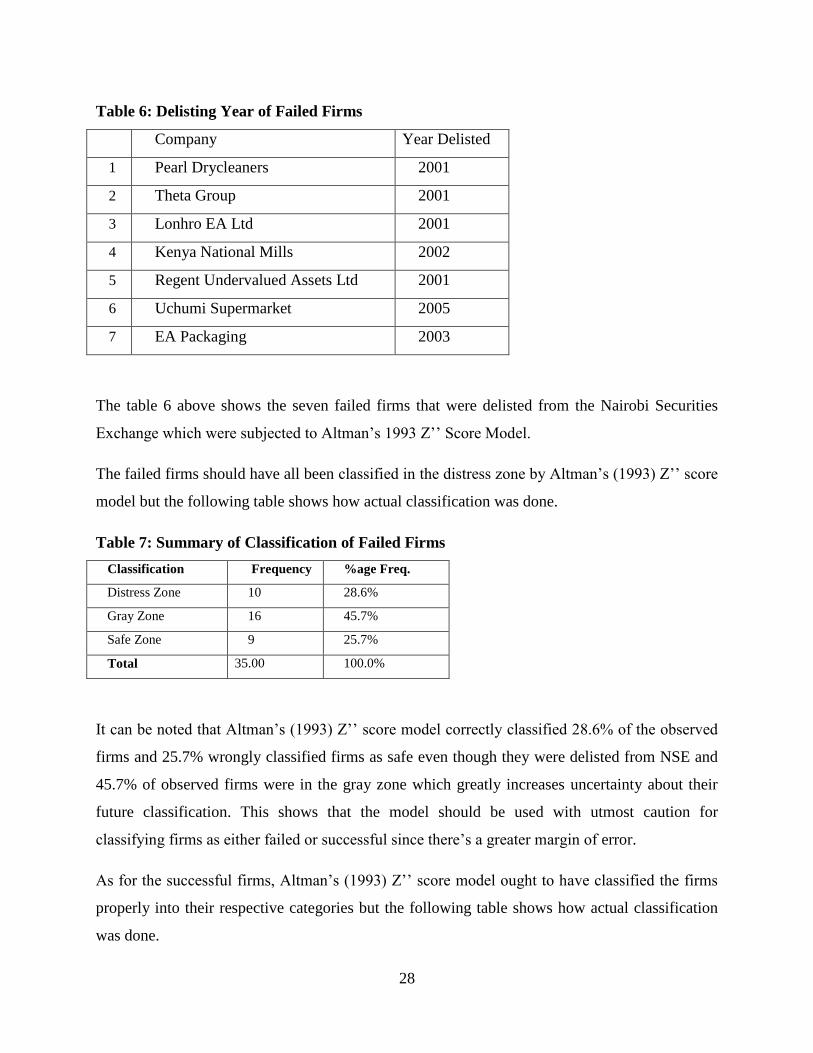
The table 6 above shows the seven failed firms that were delisted from the Nairobi Securities
Exchange which were subjected to Altman’s 1993 Z’’ Score Model.
The failed firms should have all been classified in the distress zone by Altman’s (1993) Z’’ score
model but the following table shows how actual classification was done.
Table 7: Summary of Classification of Failed Firms
Classification Frequency %age Freq.
Distress Zone 10 28.6%
Gray Zone 16 45.7%
Safe Zone 9 25.7%
Total 35.00 100.0%
It can be noted that Altman’s (1993) Z’’ score model correctly classified 28.6% of the observed
firms and 25.7% wrongly classified firms as safe even though they were delisted from NSE and
45.7% of observed firms were in the gray zone which greatly increases uncertainty about their
future classification. This shows that the model should be used with utmost caution for
classifying firms as either failed or successful since there’s a greater margin of error.
As for the successful firms, Altman’s (1993) Z’’ score model ought to have classified the firms
properly into their respective categories but the following table shows how actual classification
was done.
29
4.3. Summary and Interpretation of Findings
The research employed nine sample firms form the successful firms which translated to forty five
observations and seven failed firms which also translated to thirty five observations. The five
financial ratios mentioned above were used as indicators in the equation for judging the financial
soundness of NSE listed firms for the period 2008 to 2012. So far the study indicated that the
Altman’s Z”-scores was helpful in predicting corporate defaults as well as an easy-to-calculate
measure of control for financial distress status of companies in academic studies. The Z-Score
above 2.6 indicates a company to be healthy. Besides, such a company is also not likely to enter
bankruptcy. However, Z-Scores ranging from 1.1-2.6 were taken to lie in the grey area while
scores below 1.1 indicated distressed or more precisely failed companies. The results showed
that the model was successful to predict non-failed firms but did not satisfy the classifications of
failed firms as explained below.
It can be noted that Altman’s (1993) Z’’ score model correctly classified 28.6% of the observed
firms and 25.7% wrongly classified firms as safe even though they were delisted from NSE and
45.7% of observed firms were in the gray zone which greatly increases uncertainty about their
future classification. This shows that the model should be used with utmost caution for
classifying firms as either failed or successful since there’s a greater margin of error. As for the
successful firms, Altman’s (1993) Z’’ score model ought to have classified the firms properly
into their respective categories. After the analysis of the data presented from successful firms it
was eminent that Altman’s (1993) Z”-score model correctly classified 27 observations of
successful firms in the safe zone. This meant that these firms had a low likelihood of becoming
bankrupt and hence had a stable financial position. Eight of the successful firms were precisely
from the construction sector, nine from the manufacturing sector, four from energy and
petroleum sector, five from the telecommunication sector and one from commercial services.
These firms were therefore summarized to meet their maturing short term obligations, efficient
management in manufacturing, sales administration and other activities due to its cumulative
profitability over time represented by the retained earnings over total asset variable. From the
findings of the successful firms in the safe zone, it was also noted that the management of these
firms had overall effectiveness as shown by the returns generated.
30
The model also classified 16 observations out of the 45 from the successful firms of the observed
firms in the gray zone. This means that there is uncertainty of the future financial stability of
these firms. The firms could either go into financial distress in which they might be subjected to
hostile takeover or collapse of the business entity. It can also be said that financial aspect of the
above firms in the gray zone may rise and become stable to perform both its long term and short
term obligations. The construction sector represented the most uncertain sector in terms of
financial stability. Seven observations in that sector therefore operate under uncertain
environment. Under the commercial sector also 5 observations (from Kenya Airways) operated
under uncertain environment. This meant that external factors like political stability put the firm
into uncertain situations.
Finally the findings of the analyzed successful firm also indicate that the model classified 2
observations out of the 45 into distress zone. These firms were Kenol Kobil during the year 2012
and Total Kenya in 2011 and both of the firms fall under the sector of energy and petroleum in
the Nairobi Securities Exchange list. From the analysis, this finding indicated the firms went into
financial distress during those years.
The model also analyzed the firms that were termed as failed and delisted from Nairobi
Securities Exchange from the period 1996 to 2012. The firms also had similar zones of
classification though their margin of error is high. 10 out of the 35 observations were classified
in the distress zone hence going into financial distress or bankruptcy. Those firms were the likes
of Theta Group from the year 1997 to 2001 and Regent Undervalued assets limited from the year
1997 to 2000. From our findings these firms were unable to meet their financial obligations and
hence went into insolvency.
Most of the firms that ought to be classified in the distress zone had Z”-scores that categorized
them as either safe or gray zones. The firms that were classified in the safe zone were the likes of
Kenya national Mills during the period of 1997 to 2001 and Uchumi supermarket during the
period of 2001 to 2004. The findings indicated that these firms were financially healthy while in
the real sense that was not the case. Kenya National Mills was acquired by another firm while
Uchumi supermarket had the financial crises which all over the Kenyan market news.
31
The remaining 16 observations out of the 35 failed observations were classified in the zone of
uncertainty which mostly termed as the gray zone. Since time has passed these firms have either
gone into financial distress or stabilized in their financial performance. Examples of these were
Pearl Drycleaners from the period of 1997 to 2001; Lonhro EA limited from the period of 1997
to 2001; Uchumi supermarket in 2005; East Africa Packaging from 1998 to 2002. Except
Uchumi all the other three firms are not currently listed in NSE and that might be an indication
that the firms went into financial distress.
However, the study noted that Altman’s (1993) Z”-score model was not sufficient to differentiate
between failed and non-failed firms. Altman’s (1993) Z’’ score model was intended for non-
manufacturing firms and appropriate model for retail firms. The model has only four variables
which he thought could best predict bankruptcy and more so he presumed that all the multi
discriminant assumptions were satisfied and he went ahead to run such a model. This showed
that the model should be used with utmost caution for classifying firms as either failed or non-
failed firms since there was a greater margin of error for the failed firms. Contemporary critiques
advocate for the use of logistic regression because of the many assumptions of multi discriminant
analysis that are rarely in reality satisfied which ultimately reduce errors of wrong classification.
The findings therefore agree with those of Alareeni and Branson (2012) who found that Altman
Z’’ score (1993) model had limited predictive power as compared to that of Altman Z score of
1968.The study therefore indicated that the model of Altman’s (1993) Z”-score is suitable for
non-manufacturing firms and retail firms as the model was intended for such firms.
32
CHAPTER FIVE
SUMMARY, CONCLUSIONS AND RECOMMENDATION
5.1. Summary
The study involved the bankruptcy prediction of firms listed in the Nairobi Securities Exchange.
It used the data from audited financial statements of firms listed and it was derived from the
portal of Capital Market Authority and Nairobi Securities Exchange. The Altman’s (1993) Z”
score model was used to do the study due to its popularity in the failure prediction studies to
other prediction models in the recent years. This research also explored the analysis of failed
firms using the same model so as to compare the utility of the statistical model. To test this I sort
firms whose data was available and which were delisted from Nairobi Securities Exchange from
the period 1996 to 2012.
In order to test the efficient utility of the model I also used Statistical Package for Social
software. The research employs a database of 5sectors from the Nairobi Securities Exchange for
non-failed firms of which nine firms were sampled for the period from 2008 to 2012 .Another
database of failed firms was also employed and seven firms were sampled from the list of
delisted firms from NSE.
The study showed that Altman’s (1993) Z”-score correctly classified 28.6% of the observed
firms from the sample of failed firms and wrongly classified 25.7% of the same as safe even
though they were delisted from NSE. The remaining 45.7% were also classified in the grey zone
and this increases the uncertainty about their future classifications. On the other hand, the study
also shows the predictive ability of the model where it classified correctly 60% of the observed
firms in safe zones and 4.4% classified in the distress zone. In addition the remaining 35.6% of
observed firms were classified in the grey zone and this increases the uncertainty about their
future classification in the current listed firms in NSE.
33
5.2. Conclusions
The motivation for empirical research in corporate bankruptcy prediction is clear in that the early
detection of financial distress and the use of corrective measures are preferable to protection
under bankruptcy law. This study has provided a critical analysis of large number of empirical
studies on bankruptcy prediction based variously on statistical techniques. It appears that there is
substantial disagreement over the most suitable methodology and substantial scope for model
development. In general financial ratios can be used to predict bankruptcy. However the type of
ratio that will best discriminate between failing and non-failing firms appears to differ from place
to place. From the analysis presented, it would appear that current ratio, retained earnings to total
asset, earnings before interest and taxes to total assets and book value of equity to total liabilities
can be used to successfully predict failures. This therefore suggests that investors and
stakeholders should pay attention to liquidity and activity ratios.
The review shows that multi-discriminant analysis model has been frequently used due to its
consistently high predictive accuracy achieved in relatively large number of studies with smaller
adjusted standard deviations. This therefore suggests that the MDA model overall the most
reliable methods of bankruptcy prediction. From the above findings we conclude that Altman’s
(1993) Z” score model is efficient in predicting bankruptcy prediction. In recent years,
bankruptcy prediction has gained widespread attention in increasing popularity in corporations.
The study explores the utility of statistical technique mostly termed as MDA. This technique is
used to predict a firm’s going concern status from four variables. This model contained four
predictive variables was used and was as follows:
Z” 6.56X1 + 3.26X2 + 6.72X3 + 1.05X4
Where Z” is the discriminant score
Xl is the working capital/Total Asset
X2 is the Retained Earnings/Total Asset
X3 is the Earnings Before Interest and Taxes/Total Asset
X4 is the Book Value of Equity/Total liabilities
34
5.3. Policy Recommendations
Several important policy implications emerge from this study. First, a disjoint was noted in
correlation between is expected of listed firms in terms of financial performance and the benefit
to be accrued from CMA surveillance on them. This is due to the fact that firms have been
delisted from NSE due to other factors and not due to financial performance as per the analysis
in chapter of failed firms. It has also been noted that NSE has been performing poorly as
evidenced when it was suspended for 15 minutes on October 2008 after its 20-share index falling
below 4,000 points. This points out that CMA and NSE role and responsibility needs to be
strengthened. The NSE should make financial stability an integral driver of its policy framework
through adoption of financial analysis models.
Second, we should be alert of the fact that at times the signs of a major financial distress exhibits
within a very short time that the predictive ability of financial ratios become temporarily
redundant. This situation is common during an expected downturn of the economy. Nonetheless,
financial ratios would give vital information to different stakeholders under normal operations. It
is therefore recommended that practical applicability of bankruptcy prediction should be checked
after some period of time as the economy changes.
Finally the outcome of the study suggests that stakeholders in a business firm can predict failure
before it occurs by paying attention to current ratios and performance ratios. The fact that such
can help predict failure before it occurs implies that stakeholders in a firm can avoid the losses
associated with failures by taking appropriate actions well in advance. This will also be an early
warning system to other interested parties.
5.4. Limitations of the Study
Financial data is only one source of signal about corporate failure. In reality other non-
quantifiable circumstances and reasons could lead to failure. Examples are the catastrophes and
exogenous considerations like the effects of political instability in Kenya during the 2007 to
2008 periods. Therefore when these other factors are considered the researcher will have
conclusive method for predicting bankruptcy of firms.
The publicly available information was inadequate especially in delisted firms. Data was not
available from most firms which were delisted from due to the fact that most companies give
35
minimum legal disclosures which have been found wanting. This has narrowed down the scope
of the study to the few firms whose data was available.
The sample size used here is small and concentrated on few selected firms in the different
sectors. The study could have been conclusive if conducted across all firms listed in the Nairobi
Securities Exchange. It has left critical sectors like insurance and financial service sectors due to
the fact that most companies give minimum legal disclosures which have been found wanting.
The coefficients would most probably change if a larger sample was used. This was mostly
contributed due to the limited time frame that the study was conducted in.
5.5. Suggestions for Further Research
The study has tried to strengthen the position of existing work in bankruptcy prediction,
particularly based on Altman’s (1993) Z” score model. From the insights gained in the course of
the investigation, the researcher offers the following suggestions, which should act as a direction
to future researchers:
Another research area that could be extended is to test bankruptcy prediction models to non-
listed firms, relatively smaller turnover sized firms where the incidences of business failure is
greater than larger corporations. This will help determine financial position of all firms in the
economy and give more insights to investors on their investment decisions. With this suggestion
regulatory bodies like Nairobi Securities Exchange and Capital Market Authority will be in a
position to capture wider market in terms of listing new firms.
A replication of this study should be done after some time to find out if there are any changes
that have taken place. A comparison can then be done with the current data of that time. From
this, a definite recommendation should be arrived at as to whether the model used was helpful in
predicting bankruptcy failures
Researchers should investigate the development of bankruptcy prediction models using different
statistical methodology other than multi-discriminant analysis, such as artificial neural networks
(ANNs), logit or probit analysis, to compare and select the most efficient model. This will
evaluate the progress towards bankruptcy prediction in firms across the economy and to find out
whether they are valid, adequate and whether they provide early warning of bankruptcy. With

36
this suggestion in place, there will be more available research studies on the bankruptcy
prediction and will be of great importance to both academicians and investors in relating with the
current market and best procedures in making conclusive decisions concerning firms in the
economy.
37
REFERENCES
Agarwal, V. and Taffler, R.J, R.J. (2008b), “Does financial distress risk drive the momentum
anomaly?”, Financial Management, Vol.37, No. 3, pp.461-484
Ahn, B. S., Cho, S. S., and Kim, C.Y. (2000).“The integrated methodology of rough set theory
and artificial neural network for business failure prediction”. Expert Systems with
Applications, 18, 65-74.
Altman, E. (1968). Financial ratios, discriminant analysis and the prediction of corporate
bankruptcy. The Journal of Finance 23(4): 589-609.
Altman, E. (1993). Corporate financial distress: A complete guide to predicting,
avoiding and dealing with bankruptcy, (2nd
Ed.). New York: John Wiley & Sons.
Altman, E., J. Hartzell, J., & Peck, M. (1995). Emerging market corporate bonds: A scoring
system. New York: Saloman Brothers Inc.
Alareeni, B., & Branson, J. (2012). Predicting listed companies’ failure in Jordan using Altman
models : A case study. International Journal of Business and Management; 8, 1.
Argenti, M. (2003). Financial ratios as predictors of failure, Empirical Research in Accounting:
Selected Studies, University of Chicago, Chicago, Ill., 71-111.
Barasa, (2007) Evolution of prediction models from classical to non-classical failure prediction.
Unpublished thesis, University of Nairobi.
Beaver, W. 1966. Financial ratios as predictors of failure. Journal of Accounting
Research 5: 71-111.
Black, F. and Scholes, M.(1973) “The Pricing of Option and Corporate Liabilities.”
The Journal of Political Economy 81(3),637-659
Campbell, J.Y., Hilscher, J . and Szilagyi, J.(2008), “In search of distress risk
38
Journal of Finance, Vol. 63, No.6, pp.2899-2939
Casey, C. 1980. The usefulness of accounting ratios for subjects' predictions of corporate
failure: Replication and extensions. Journal of Accounting Research 18(2): 603-613.
Chava, S. and Jarrow, R. (2004), „Bankruptcy prediction with industry effects‟,
Review of Finance, Vol. 8, No. 4, pp. 537-569.
Dimitras, A., S. Zanakis and C. Zopounidis. 1996. A survey of business failures with an
emphasis on prediction methods and industrial applications. European Journal of
Operational Research 90: 487-513.
Eidleman, E.B. (2007) “A discriminant analysis of predictors of business failure,” Journal of
Accounting Research, Spring, Institute of Professional Accounting, Chicago, I ll., 167-
179.
Edward Elgar. (1997) “Market Efficiency”: Stock Market Behaviour in Theory and Practice.
ISBN 978-1858981611.
Fama, E.F and French, K.R (1992), “The Cross-Section of Expected Stock Returns”,
Journal of Finance, Vol.47 2, p. 427-465
FitzPatrick, P. 1932. A comparison of ratios of successful industrial enterprises with
those of failed companies. The Certified Public Accountant (October, November,
December): 598-605, 656-662, and 727-731, respectively.
Tobin, James (1958). “Liquidity preference as behavior towards risk”, The Review of
Economic Studies, 25, 65-86.
Keige, P. (1991). Business Failure Prediction Using Discriminate Analysis. Unpublished thesis,
39
University of Nairobi.
Kiragu, M. (1993). The Prediction of Corporate Failure Using Price Adjusted Accounting Data.
Unpublished thesis, University of Nairobi
Kogi, S. (2003). An Analysis of The Discriminant Corporate Failure Prediction Model Based on
Stability of Financial Ratios. Unpublished thesis, University of Nairobi
Martin, D., 1977, “Early warnings of bank failure: A logit regression approach”,
Journal of Banking and Finance, 1, 249-276.
Merton, R.C. (1974), “On the Pricing of Corporate Debt: The Risk Structure of Interest Rates”,
Journal of Finance, Vol. 29, no. 2, p. 449-470
O’Leary, E. G, (2001)"Business Failure Prediction and the Efficient Market Hypothesis"
Unpublished M.B.A. Research Project, Simon Fraser University, November
Ohlson, J. 1980. Financial ratios and the probabilistic prediction of bankruptcy. Journal
of Accounting Research 18(1): 109-131.
Ooghe H., Camerlynck J., Balcaen S., 2003, The Ooghe-Joos-De Vos failure prediction models:
a cross-industry validation. Brussels Economic Review, Vol. 46, nr. 1, Spring 2003, p. 39-
70.
Patrick, S. and Ooghe, H. (2004) 35 years of studies on business failure: an overview of the
classic statistical methodologies and their related problems, The British Accounting
Review, 38(1), 63-93.
Pope, P.F. (2010), „Bridging the Gap between Accounting and Finance‟,
British Accounting Review, Vo. 42, No. 1, pp. 88-102.
40
Robinson, R.A. and M. G. Maguire (2001) “Top common causes of construction contractor
failures”, Journal of Construction Accounting and Taxation, Jan/Feb 2003.
Ross, S.A(1976) “The Arbitrage Theory of Capital Asset Pricing.”
The Journal of Economic Theory 13(3), 341-360
Rose, P. and J. Kolari. 1985. Early warning systems as a monitoring device for bank
condition. Quarterly Journal of Business and Economics 24(1): 43-60.
Sharpe, W.F(1963) “A Simplified Model for Portfolio Analysis.”
Management Science 9(2), 277-293
Springate, and Gordon L.V., (1978).“Predicting the Possibility of Failure in a Canadian Firm”.
Unpublished M.B.A. Research Project, Simon Fraser University.
Taffler, R. 1984. Empirical models for the monitoring of UK corporations. Journal of
Banking and Finance 8(2): 199-227.
Treynor, J.L.(1961) “Market Value, Time, and Risk.” Unpublished manuscript.
“Rough draft dated 8/8/61,# 95-209
Zavgren C, 1983, The prediction of corporate failure: the state of the art.
Journal of Accounting Literature, Vol. 2, p. 1-37.
Zmijewski M.E., 1984, Methodological issues related to the estimation of financial
distress prediction models. Journal of Accounting Research, Supplement to Vol. 22, p.
59-86.
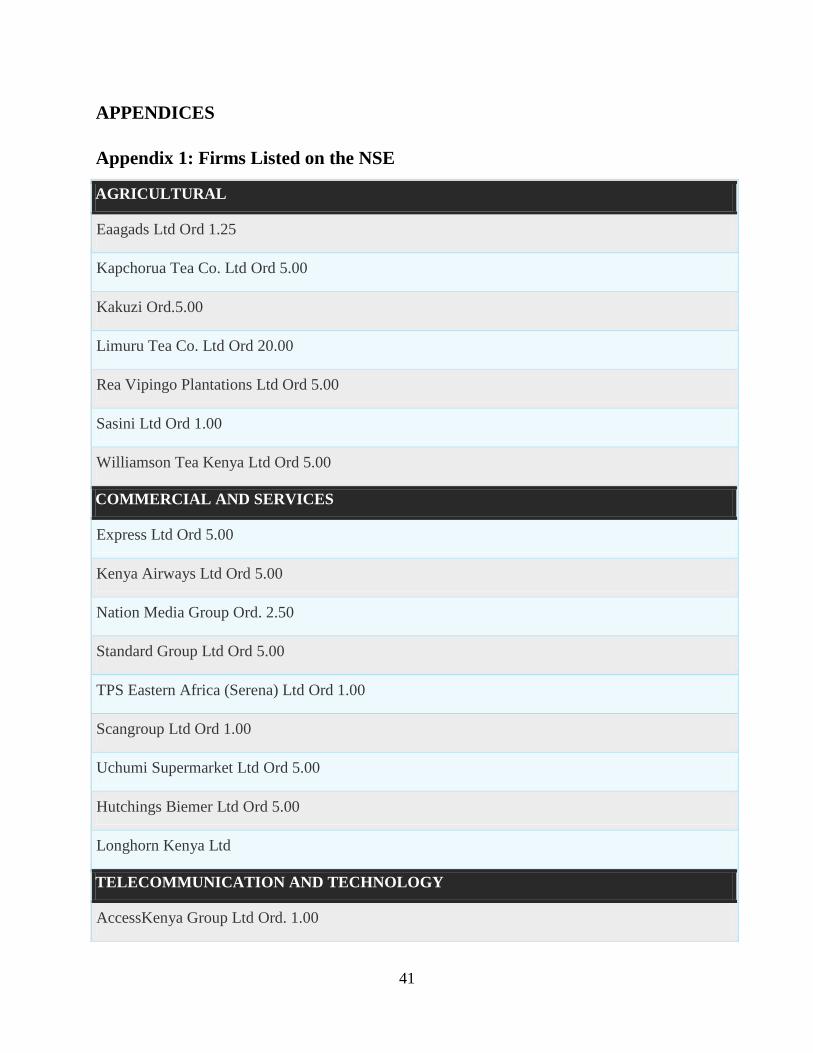
41
APPENDICES
Appendix 1: Firms Listed on the NSE
AGRICULTURAL
Eaagads Ltd Ord 1.25
Kapchorua Tea Co. Ltd Ord 5.00
Kakuzi Ord.5.00
Limuru Tea Co. Ltd Ord 20.00
Rea Vipingo Plantations Ltd Ord 5.00
Sasini Ltd Ord 1.00
Williamson Tea Kenya Ltd Ord 5.00
COMMERCIAL AND SERVICES
Express Ltd Ord 5.00
Kenya Airways Ltd Ord 5.00
Nation Media Group Ord. 2.50
Standard Group Ltd Ord 5.00
TPS Eastern Africa (Serena) Ltd Ord 1.00
Scangroup Ltd Ord 1.00
Uchumi Supermarket Ltd Ord 5.00
Hutchings Biemer Ltd Ord 5.00
Longhorn Kenya Ltd
TELECOMMUNICATION AND TECHNOLOGY
AccessKenya Group Ltd Ord. 1.00
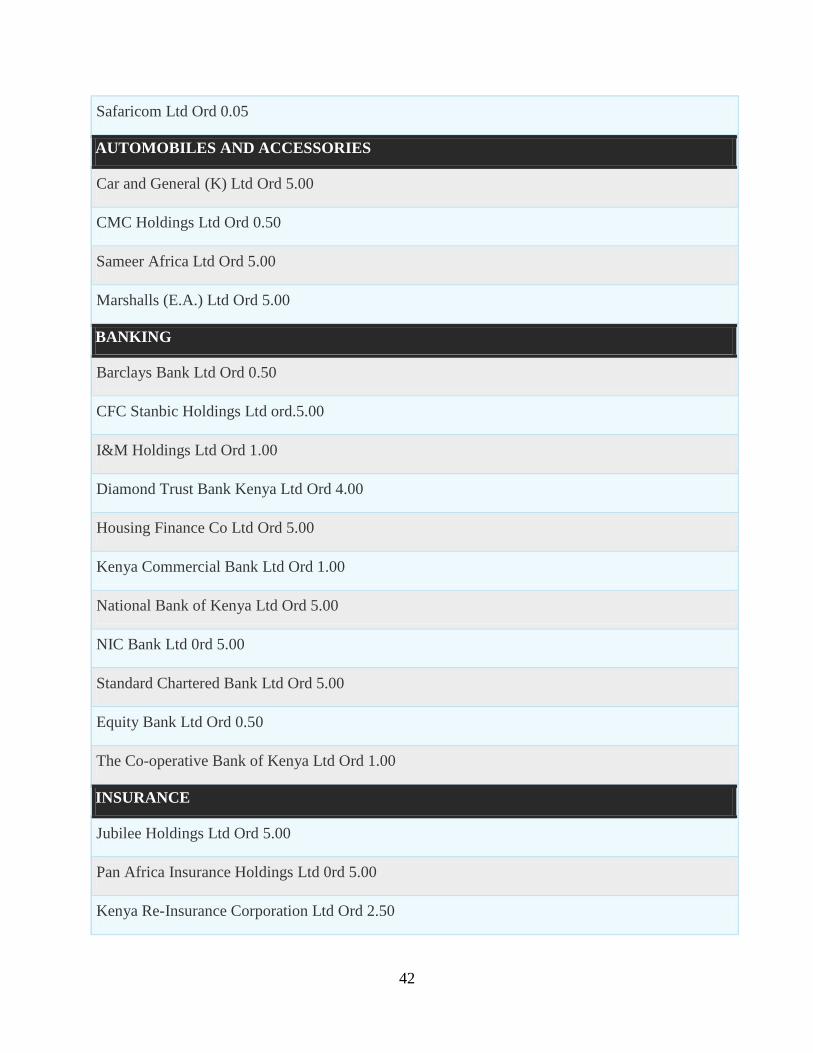
42
Safaricom Ltd Ord 0.05
AUTOMOBILES AND ACCESSORIES
Car and General (K) Ltd Ord 5.00
CMC Holdings Ltd Ord 0.50
Sameer Africa Ltd Ord 5.00
Marshalls (E.A.) Ltd Ord 5.00
BANKING
Barclays Bank Ltd Ord 0.50
CFC Stanbic Holdings Ltd ord.5.00
I&M Holdings Ltd Ord 1.00
Diamond Trust Bank Kenya Ltd Ord 4.00
Housing Finance Co Ltd Ord 5.00
Kenya Commercial Bank Ltd Ord 1.00
National Bank of Kenya Ltd Ord 5.00
NIC Bank Ltd 0rd 5.00
Standard Chartered Bank Ltd Ord 5.00
Equity Bank Ltd Ord 0.50
The Co-operative Bank of Kenya Ltd Ord 1.00
INSURANCE
Jubilee Holdings Ltd Ord 5.00
Pan Africa Insurance Holdings Ltd 0rd 5.00
Kenya Re-Insurance Corporation Ltd Ord 2.50
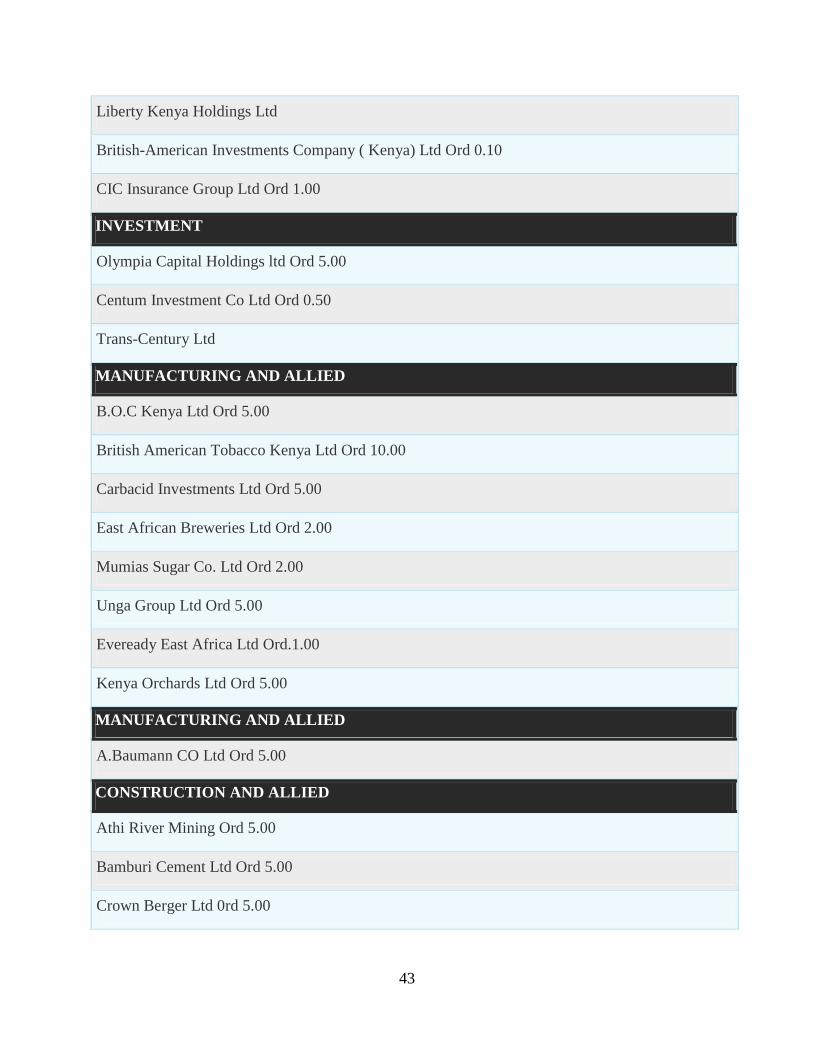
43
Liberty Kenya Holdings Ltd
British-American Investments Company ( Kenya) Ltd Ord 0.10
CIC Insurance Group Ltd Ord 1.00
INVESTMENT
Olympia Capital Holdings ltd Ord 5.00
Centum Investment Co Ltd Ord 0.50
Trans-Century Ltd
MANUFACTURING AND ALLIED
B.O.C Kenya Ltd Ord 5.00
British American Tobacco Kenya Ltd Ord 10.00
Carbacid Investments Ltd Ord 5.00
East African Breweries Ltd Ord 2.00
Mumias Sugar Co. Ltd Ord 2.00
Unga Group Ltd Ord 5.00
Eveready East Africa Ltd Ord.1.00
Kenya Orchards Ltd Ord 5.00
MANUFACTURING AND ALLIED
A.Baumann CO Ltd Ord 5.00
CONSTRUCTION AND ALLIED
Athi River Mining Ord 5.00
Bamburi Cement Ltd Ord 5.00
Crown Berger Ltd 0rd 5.00
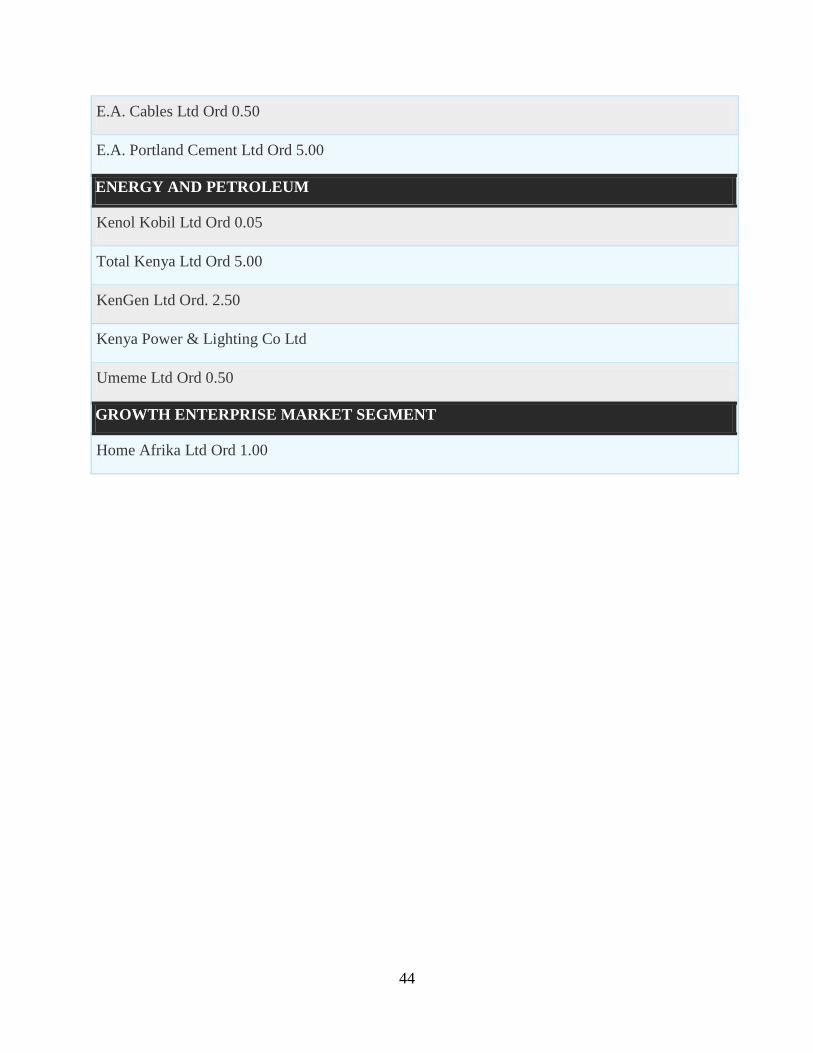
44
E.A. Cables Ltd Ord 0.50
E.A. Portland Cement Ltd Ord 5.00
ENERGY AND PETROLEUM
Kenol Kobil Ltd Ord 0.05
Total Kenya Ltd Ord 5.00
KenGen Ltd Ord. 2.50
Kenya Power & Lighting Co Ltd
Umeme Ltd Ord 0.50
GROWTH ENTERPRISE MARKET SEGMENT
Home Afrika Ltd Ord 1.00

45
Appendix 2: Sample Data
Non- failed firms
Ref Name Year Total Assets Current
Assets
Current
Liabilities
Total
Liabilities
Retained
Earnings
Equity EBIT
Kes '000' Kes '000' Kes '000' Kes '000' Kes '000' Kes '000' Kes '000'
1 Athi River Mining 2008 6,352,478 1,885,011 1,842,931 4,225,935 1,362,975 2,127,543 705,450
2009 12,141,091 3,362,746 3,353,762 8,012,161 1,886,662 4,128,930 948,714
2010 16,564,899 4,240,061 3,206,459 11,921,297 2,499,082 4,662,168 1,112,962
2011 20,549,023 3,756,304 4,453,136 14,446,497 3,827,809 5,998,657 1,362,912
2012 26,953,100 7,936,410 6,502,840 19,832,580 4,945,503 7,013,771 1,790,296
2 Bamburi Cement
Limited
2008 20,720,000 10,036,000 5,443,000 11,613,000 9,377,000 16,602,000 4,889,000
2009 32,112,000 12,773,000 4,944,000 11,171,000 14,674,000 20,941,000 9,596,000
2010 33,306,000 12,863,000 7,464,000 11,680,000 15,931,000 21,626,000 7,564,000
2011 33,502,000 13,356,000 5,097,000 9,328,000 17,983,000 24,174,000 5,368,000
2012 43,038,000 16,462,000 7,011,000 12,177,000 18,875,000 30,861,000 5,423,000
3 East African Portland
Cement Company
limited
2008 9,073,345 2,661,738 1,176,375 5,046,596 1,835,456 1,098,000 1,474,057
2009 12,053,977 3,131,045 1,512,392 5,939,115 3,606,005 1,098,000 1,452,078
2010 12,037,565 2,911,680 1,836,650 6336364 3,341,441 1,098,000 90,015
2011 13,530,871 3,172,070 2,100,179 7,268,415 3,923,685 1,098,000 653,640
2012 14,158,592 2,635,509 2,265,774 9,241,968 2,608,340 1,098,000 610,479
4 East African Breweries
Limited
2008 33,254,248 17,534,514 8,867,918 11,137,405 10,509,910 3,272,698 10,883,834
2009 35,832,389 18,941,137 9,432,296 12,464,145 11,332,702 3,272,698 11,038,838
2010 38,420,691 17,456,435 11,684,390 14,716,239 10,768,656 3,272,698 12,568,087
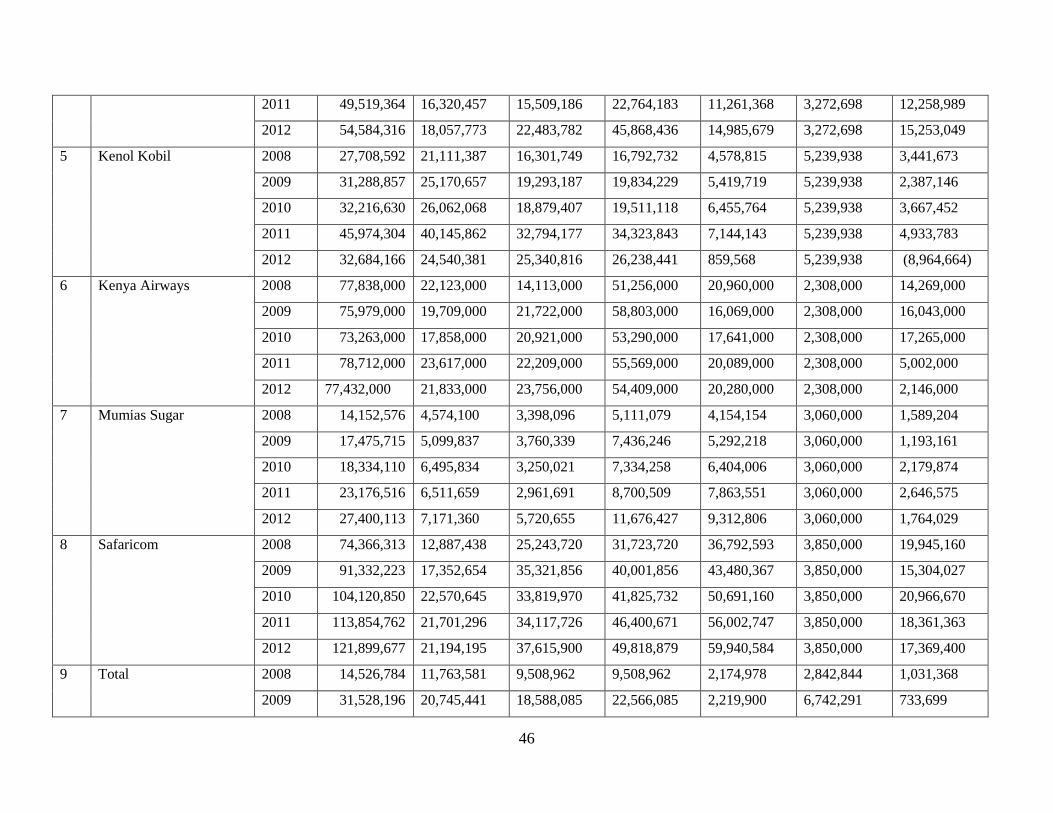
46
2011 49,519,364 16,320,457 15,509,186 22,764,183 11,261,368 3,272,698 12,258,989
2012 54,584,316 18,057,773 22,483,782 45,868,436 14,985,679 3,272,698 15,253,049
5 Kenol Kobil 2008 27,708,592 21,111,387 16,301,749 16,792,732 4,578,815 5,239,938 3,441,673
2009 31,288,857 25,170,657 19,293,187 19,834,229 5,419,719 5,239,938 2,387,146
2010 32,216,630 26,062,068 18,879,407 19,511,118 6,455,764 5,239,938 3,667,452
2011 45,974,304 40,145,862 32,794,177 34,323,843 7,144,143 5,239,938 4,933,783
2012 32,684,166 24,540,381 25,340,816 26,238,441 859,568 5,239,938 (8,964,664)
6 Kenya Airways 2008 77,838,000 22,123,000 14,113,000 51,256,000 20,960,000 2,308,000 14,269,000
2009 75,979,000 19,709,000 21,722,000 58,803,000 16,069,000 2,308,000 16,043,000
2010 73,263,000 17,858,000 20,921,000 53,290,000 17,641,000 2,308,000 17,265,000
2011 78,712,000 23,617,000 22,209,000 55,569,000 20,089,000 2,308,000 5,002,000
2012 77,432,000 21,833,000 23,756,000 54,409,000 20,280,000 2,308,000 2,146,000
7 Mumias Sugar 2008 14,152,576 4,574,100 3,398,096 5,111,079 4,154,154 3,060,000 1,589,204
2009 17,475,715 5,099,837 3,760,339 7,436,246 5,292,218 3,060,000 1,193,161
2010 18,334,110 6,495,834 3,250,021 7,334,258 6,404,006 3,060,000 2,179,874
2011 23,176,516 6,511,659 2,961,691 8,700,509 7,863,551 3,060,000 2,646,575
2012 27,400,113 7,171,360 5,720,655 11,676,427 9,312,806 3,060,000 1,764,029
8 Safaricom 2008 74,366,313 12,887,438 25,243,720 31,723,720 36,792,593 3,850,000 19,945,160
2009 91,332,223 17,352,654 35,321,856 40,001,856 43,480,367 3,850,000 15,304,027
2010 104,120,850 22,570,645 33,819,970 41,825,732 50,691,160 3,850,000 20,966,670
2011 113,854,762 21,701,296 34,117,726 46,400,671 56,002,747 3,850,000 18,361,363
2012 121,899,677 21,194,195 37,615,900 49,818,879 59,940,584 3,850,000 17,369,400
9 Total 2008 14,526,784 11,763,581 9,508,962 9,508,962 2,174,978 2,842,844 1,031,368
2009 31,528,196 20,745,441 18,588,085 22,566,085 2,219,900 6,742,291 733,699
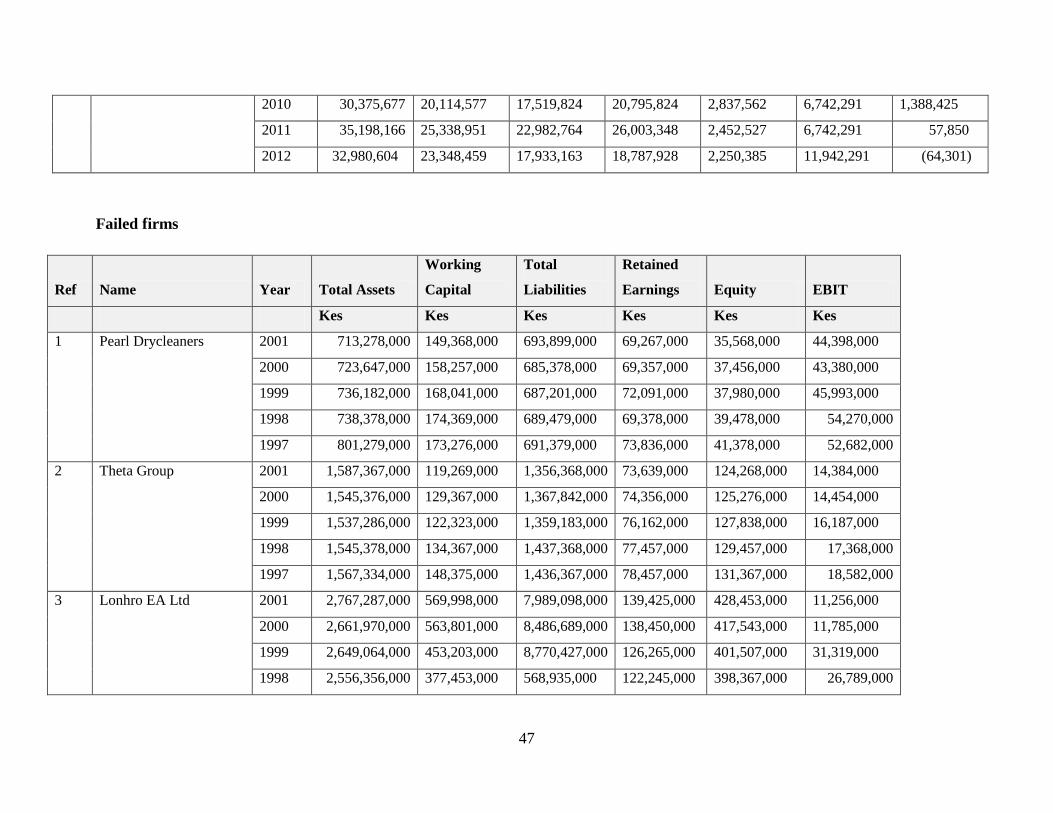
47
2010 30,375,677 20,114,577 17,519,824 20,795,824 2,837,562 6,742,291 1,388,425
2011 35,198,166 25,338,951 22,982,764 26,003,348 2,452,527 6,742,291 57,850
2012 32,980,604 23,348,459 17,933,163 18,787,928 2,250,385 11,942,291 (64,301)
Failed firms
Ref Name Year Total Assets
Working
Capital
Total
Liabilities
Retained
Earnings Equity EBIT
Kes Kes Kes Kes Kes Kes
1 Pearl Drycleaners 2001 713,278,000 149,368,000 693,899,000 69,267,000 35,568,000 44,398,000
2000 723,647,000 158,257,000 685,378,000 69,357,000 37,456,000 43,380,000
1999 736,182,000 168,041,000 687,201,000 72,091,000 37,980,000 45,993,000
1998 738,378,000 174,369,000 689,479,000 69,378,000 39,478,000 54,270,000
1997 801,279,000 173,276,000 691,379,000 73,836,000 41,378,000 52,682,000
2 Theta Group 2001 1,587,367,000 119,269,000 1,356,368,000 73,639,000 124,268,000 14,384,000
2000 1,545,376,000 129,367,000 1,367,842,000 74,356,000 125,276,000 14,454,000
1999 1,537,286,000 122,323,000 1,359,183,000 76,162,000 127,838,000 16,187,000
1998 1,545,378,000 134,367,000 1,437,368,000 77,457,000 129,457,000 17,368,000
1997 1,567,334,000 148,375,000 1,436,367,000 78,457,000 131,367,000 18,582,000
3 Lonhro EA Ltd 2001 2,767,287,000 569,998,000 7,989,098,000 139,425,000 428,453,000 11,256,000
2000 2,661,970,000 563,801,000 8,486,689,000 138,450,000 417,543,000 11,785,000
1999 2,649,064,000 453,203,000 8,770,427,000 126,265,000 401,507,000 31,319,000
1998 2,556,356,000 377,453,000 568,935,000 122,245,000 398,367,000 26,789,000
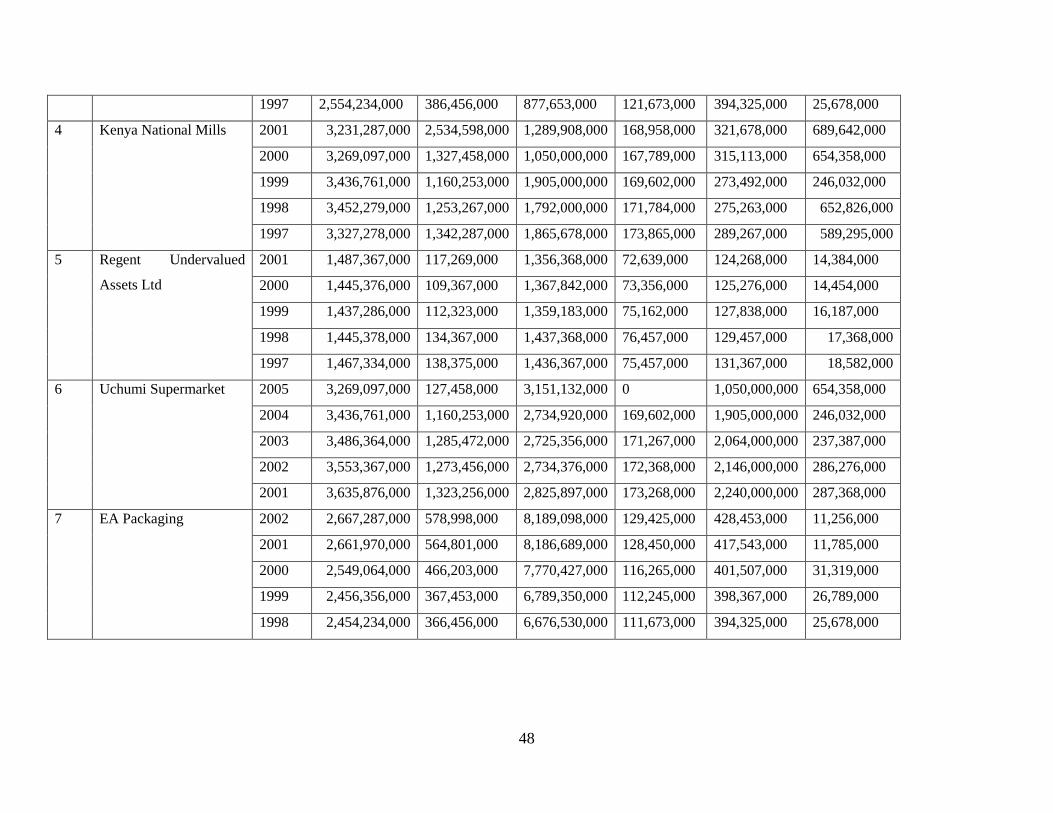
48
1997 2,554,234,000 386,456,000 877,653,000 121,673,000 394,325,000 25,678,000
4 Kenya National Mills 2001 3,231,287,000 2,534,598,000 1,289,908,000 168,958,000 321,678,000 689,642,000
2000 3,269,097,000 1,327,458,000 1,050,000,000 167,789,000 315,113,000 654,358,000
1999 3,436,761,000 1,160,253,000 1,905,000,000 169,602,000 273,492,000 246,032,000
1998 3,452,279,000 1,253,267,000 1,792,000,000 171,784,000 275,263,000 652,826,000
1997 3,327,278,000 1,342,287,000 1,865,678,000 173,865,000 289,267,000 589,295,000
5 Regent Undervalued
Assets Ltd
2001 1,487,367,000 117,269,000 1,356,368,000 72,639,000 124,268,000 14,384,000
2000 1,445,376,000 109,367,000 1,367,842,000 73,356,000 125,276,000 14,454,000
1999 1,437,286,000 112,323,000 1,359,183,000 75,162,000 127,838,000 16,187,000
1998 1,445,378,000 134,367,000 1,437,368,000 76,457,000 129,457,000 17,368,000
1997 1,467,334,000 138,375,000 1,436,367,000 75,457,000 131,367,000 18,582,000
6 Uchumi Supermarket 2005 3,269,097,000 127,458,000 3,151,132,000 0 1,050,000,000 654,358,000
2004 3,436,761,000 1,160,253,000 2,734,920,000 169,602,000 1,905,000,000 246,032,000
2003 3,486,364,000 1,285,472,000 2,725,356,000 171,267,000 2,064,000,000 237,387,000
2002 3,553,367,000 1,273,456,000 2,734,376,000 172,368,000 2,146,000,000 286,276,000
2001 3,635,876,000 1,323,256,000 2,825,897,000 173,268,000 2,240,000,000 287,368,000
7 EA Packaging 2002 2,667,287,000 578,998,000 8,189,098,000 129,425,000 428,453,000 11,256,000
2001 2,661,970,000 564,801,000 8,186,689,000 128,450,000 417,543,000 11,785,000
2000 2,549,064,000 466,203,000 7,770,427,000 116,265,000 401,507,000 31,319,000
1999 2,456,356,000 367,453,000 6,789,350,000 112,245,000 398,367,000 26,789,000
1998 2,454,234,000 366,456,000 6,676,530,000 111,673,000 394,325,000 25,678,000