a review of design and hedging strategies for … nicholls.pdfhedging strategies for modern...
TRANSCRIPT

1
A Review of Design and Hedging Strategies for
Modern Australian Investment Guarantee Products
Patrick BrennanJohn NichollsZac Roberts

2
Australian super environment
The Australian super system is the envy of the world, but any back-slapping should be tempered by the realisation that the fate of most people’s retirement savings is now increasingly linked to world stockmarkets…. Despite the system’s grandiloquent title of Superannuation Guarantee, most members don’t have any guarantee on their payouts if markets turn nasty – and after they retire most will still rely on market-based investment accounts to pay their funded pensions.
Super reality check overdue Opinion Editor, Australian Financial Review, 5 January 2007
3
Australian super environment
Super assets now are slightly larger than the national GDP figure and also exceed the total market value of the Australian stockmarket…. Gary Weaven (chairman of Industry Funds Management) has forecast further spectacular market growth, predicting that total assets will quadruple from $1 trillion now to $4 trillion in just 13 years.
A 2020 vision for super amounts to $4 trillion Barrie Dunstan, Australian Financial Review, 27 March 2007

4
1. Current Investment Guarantees in Australia
2. Simple Accumulation Phase Investment Guarantees
3. Simple Draw-Down Phase Investment Guarantees
4. Investment Risk Management Strategies
5. Benefit to an Investor
6. Conclusions
Contents

5
Current guarantees are limitedInvestment Guarantee Complexity
Conservative capital guaranteed
funds
Complicated “limited entry” capital guaranteed
investmentsGenerally open for a limited time Limited or no investment choice Single fixed maturity dateInitial capital guaranteed at the maturity date only
Products that give investors a choice of funds and provide
simple investment guarantees over those funds
Suitable for the average individual to invest the majority of their retirement savingsIn US, Japan and recently introduced in Europe
What is missing?

6
Increasing demand for guaranteesLegislative Changes- Increase in super assets- Pre and post retirees
Increasing proportion of individuals determining their own superannuation investment decisionsAverage account size for industry, public sector and retail fund members has increased by 43% over the five years to 30 June 2006Likely to keep increasingRemoval of tax on super earnings and withdrawals from age 60
Demographic Changes - Ageing baby boomers- Increasing life expectancy- Increasing health costs
Population aged 65 or above increased from 11.4% to 13.4% in the 15 years from 1991 to 2006 Projected to reach 18.7% by 2021, 23.4% by 203665 year old life expectancy increased by approx. 2 years in the 10 years from 1995 to 2005
Attractiveness of modern investment guarantee products
Current retirees have become accustomed to higher “market-linked” returns Adding an investment guarantee can result in higher average returns and superior returns under poor scenarios than moving to a conservative asset mix

7
Will the supply be created?Factors that have
limited supplyFactors that may drive an
increase in supplyInvestment Account experience has left low appetite for the associated investment risk
Ownership structure of the Australian wealth management industry
Australian insurance industry has developed in a manner that sees individuals buy separate insurance and savings products
Increasing investor demand
Improvements in financial hedging and modelling techniques
Ability of multi-nationals to adapt successful product designs across countries
Increasing sophistication of the superannuation industry

8
1. Current Investment Guarantees in Australia
2. Simple Accumulation Phase Investment Guarantees
3. Simple Draw-Down Phase Investment Guarantees
4. Investment Risk Management Strategies
5. Benefit to an Investor
6. Conclusions
Contents
9
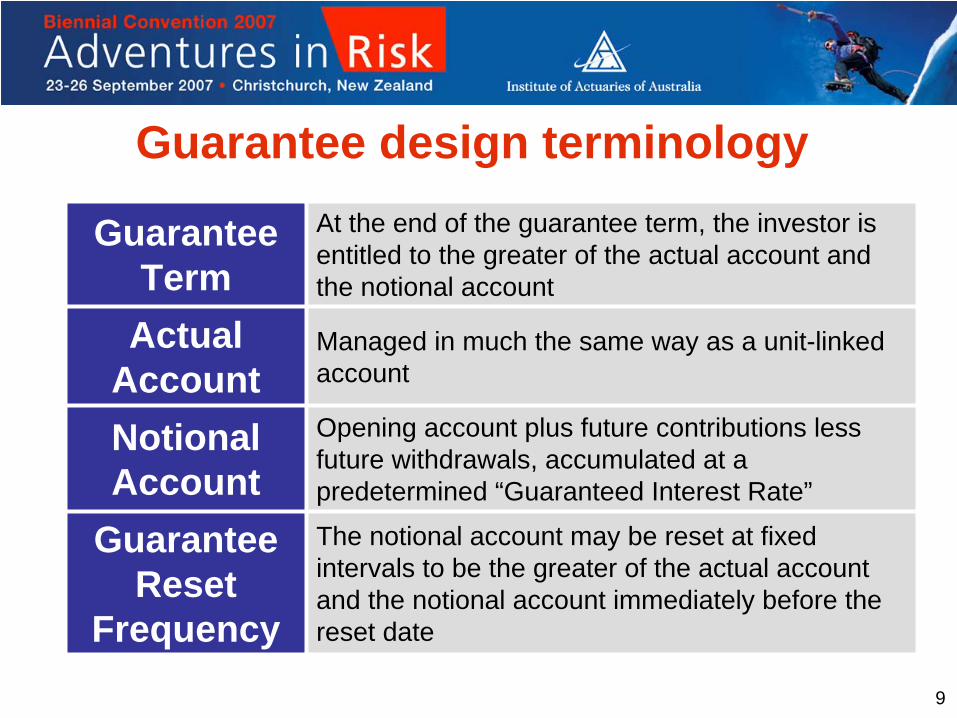
Guarantee design terminology
Guarantee Term
At the end of the guarantee term, the investor is entitled to the greater of the actual account and the notional account
Actual Account
Managed in much the same way as a unit-linked account
Notional Account
Opening account plus future contributions less future withdrawals, accumulated at a predetermined “Guaranteed Interest Rate”
Guarantee Reset
Frequency
The notional account may be reset at fixed intervals to be the greater of the actual account and the notional account immediately before the reset date

10
6 guarantee designs that could be sold to an individual before retirementOpening account balance of $100,000Annual contributions of $6,000 ($500 at the start of each month)
Sample guarantee designs
Guarantee Term 5 yrs 5 yrs 5 yrs 5 yrs 5 yrs 5 yrs
Interest Rate -3% -3% 0% 0% +3% +3%
Reset Frequency None 1 yr None 1 yr None 1 yr

11
Illustration of 0% guaranteeEvolution of actual & notional accounts in a single scenario
100,000
110,000
120,000
130,000
140,000
150,000
160,000
0 1 2 3 4 5
Actual Account ValueNotional Account (1 year reset)Notional Account (no reset)

12
LimitationsNo allowance for a profit margin for the guarantee providerNo allowance for actual costs of hedging the investment risk
Guarantee charge is likely to be more than the theoretical cost
Theoretical guarantee cost: processProject account
balance under a set of stochastic MC
economic scenarios
For each scenario, calculate the PV of the guarantee
amount paid
Calculate the average of these PVs
over the set of stochastic scenarios
Calculate an annual guarantee charge (express as % of account balance)Over the entire set of stochastic scenarios the average of the PV of the
guarantee charges deducted from the account balance is equal to the average of the PV of the guarantee amount paid (from the previous step)

13
Guarantee Term of 5 years
Show of hands, which is the best guarantee design (most likely to sell)
Interest Rate Reset Frequency Theoretical Cost
-3% No reset 0.16%
-3% 1 year 0.85%
0% No reset 0.58%
0% 1 year 1.74%
+3% No reset 1.92%
+3% 1 year 3.95%
Theoretical guarantee cost: results
14
1. Current Investment Guarantees in Australia
2. Simple Accumulation Phase Investment Guarantees
3. Simple Draw-Down Phase Investment Guarantees
4. Investment Risk Management Strategies
5. Benefit to an Investor
6. Conclusions
Contents

15
6 guarantee designs that could be sold to an individual at retirementOpening account balance of $180,000Annual draw-downs of $12,000 for 15 years ($1,000 per month)Investor continues to receive these guaranteed draw-downs even if the actual account balance is zero. At the end of the guarantee term, the investor receives the maximum of the actual account and the notional account.
Sample guarantee designs
Guarantee Term 15 yrs 15 yrs 15 yrs 15 yrs 15 yrs 15 yrs
Interest Rate 0% 0% 0% +3% +3% +3%
Reset Frequency None 5 yrs 1 yr None 5 yrs 1 yr

16
Illustration of 3% guaranteeEvolution of actual & notional accounts in a single scenario
0
30,000
60,000
90,000
120,000
150,000
180,000
0 1 2 3 4 5 6 7 8 9 10 11 12 13 14 15
Actual Account ValueNotional Account (1 year reset)Notional Account (5 year reset)Notional Account (no reset)

17
Guarantee Term of 15 years
Show of hands, which is the best guarantee design (most likely to sell)
Interest Rate Reset Frequency Theoretical Cost
0% No reset 0.10%
0% 5 years 0.31%
0% 1 year 0.62%
+3% No reset 0.57%
+3% 5 years 1.07%
+3% 1 year 1.72%
Theoretical guarantee cost: results

18
1. Current Investment Guarantees in Australia
2. Simple Accumulation Phase Investment Guarantees
3. Simple Draw-Down Phase Investment Guarantees
4. Investment Risk Management Strategies
5. Benefit to an Investor
6. Conclusions
Contents

19
Risk management strategies
Stay Naked Not recommended for companies that wish to participate in this market in the long term
Purchase Static Protection
Investment banks could tailor protection to the particular needs of an investment guarantee provider
Internal Dynamic Hedging
Regular (daily) monitoring of the hedge position against pre-defined limits
Outsource the Hedging Outsource the hedging process to a specialist
Outsource the Guarantee
Use an investment bank to provide the investment guarantee
Reinsure May be a viable way of transferring any unwanted risk
Hold Capital Cover residual risk or risk that cannot be hedged
20
Dynamic hedging process

21
Dynamic hedging process
Assumptions
Hedging Software
Live Market Data Economic Scenario
Generator
Investor Data From Mainframe
Greeks Calculator
Execute Trades
Product A
Product B
Product C

22
Hedging decisions required
Hedge Strategy What is being hedged? How can it be hedged?Delta Sensitivity to changes in
the price of equitiesEquity futures
Gamma Sensitivity to changes in delta
Equity options
Rho Sensitivity to changes in interest rates
Interest rate swaps
Rho Convexity Sensitivity to changes in rho convexity
Interest rate caps and floors
What should be hedged?How should it be hedged?At what level should the risk limits be set?

23
Comparison of hedging strategiesAccumulation phase: 5 years, 0%, no reset
Unhedged, delta, delta and gamma
Monthly profit over 100 real world scenarios
Cost of hedging: Difference between the average profit and
the average profit with no hedging
Benefit of hedging: Extent to which the hedging strategy
decreases the profit volatility
Average profit each month
Standard deviation of profit each month
Upper and lower first percentile profit each month

24
No hedging
Profit is extremely volatile
-6,000
-4,000
-2,000
0
2,000
4,000
6,000
Average Average +/- 1 SD 1% Extremes

25
Delta hedging
Significant reduction in the volatility of the monthly profitOver all months the average difference between the upper and lower first percentile profit reduces by 70%
-6,000
-4,000
-2,000
0
2,000
4,000
6,000
Average Average +/- 1 SD 1% Extremes
26
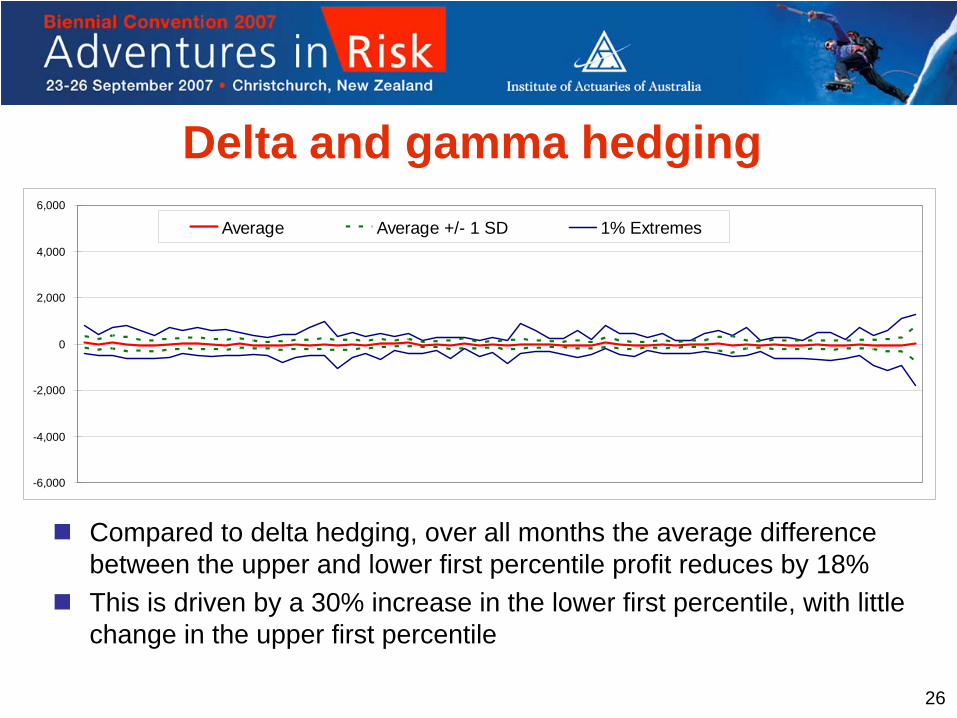
Delta and gamma hedging
Compared to delta hedging, over all months the average difference between the upper and lower first percentile profit reduces by 18% This is driven by a 30% increase in the lower first percentile, with little change in the upper first percentile
-6,000
-4,000
-2,000
0
2,000
4,000
6,000
Average Average +/- 1 SD 1% Extremes

27
Comparison of hedging strategiesMonthly Profit No Hedging Delta Delta & Gamma
Average 56 -22 -24
Standard Deviation 622 220 176
Upper 1% Level 2,278 610 596
Upper 5% Level 1,025 299 255
Lower 5% Level -906 -401 -314
Lower 1% Level -2,369 -865 -632
Annual guarantee charge of 0.7% is insufficient to cover the cost of the investment guarantee and the associated hedging strategiesWe did not allow for the costs associated with holding capital to cover residual risks, which would be greatest under no hedging

28
1. Current Investment Guarantees in Australia
2. Simple Accumulation Phase Investment Guarantees
3. Simple Draw-Down Phase Investment Guarantees
4. Investment Risk Management Strategies
5. Benefit to an Investor
6. Conclusions
Contents

29
We projected the maturity benefit received by an investor over 2,000 real world stochastic scenariosAn alternative to investing aggressively and paying for an investment guarantee is to invest more conservatively, with no guaranteeTo explore this alternative we compared the distribution of the maturity benefit for four investment strategiesAssumed a guarantee charge of 0.7% pa of the account balance
Guarantee or go conservative?
Equities Bonds Guarantee75% 25% No75% 25% Yes50% 50% No25% 75% No
Term Rate ResetAccumulation phase (cost 0.58%)
5 years 0% No
Draw-down phase (cost 0.57%)
15 years 3% No

30
Accumulation: stochastic analysisProbability distribution function of the maturity benefit
Average return
% of total negative returns
75% equities, no guarantee8.00% 10.6%
75% equities, with guarantee7.50% 0%
50% equities, no guarantee7.46% 4.2%
25% equities, no guarantee6.91% 0.3%0%
5%
10%
15%
20%
25%
30%
0~115 115~130 130~145 145~160 160~175 175~190 190~205 205~220 220~235 235~250 250~0
$ 000
No Guar 75%/25% Guar 75%/25% No Guar 50%/50% No Guar 25%/75%

31
Accumulation: back-testBack-testing: 50 sets of actual 5 year investment returns
Average return
% of total negative returns
75% equities, no guarantee8.25% 6%
75% equities, with guarantee7.61% 0%
50% equities, no guarantee7.48% 4%
25% equities, no guarantee6.81% 0%0%
5%
10%
15%
20%
25%
30%
35%
0~115 115~130 130~145 145~160 160~175 175~190 190~205 205~220 220~235 235~250 250~0
$ 000
No Guar 75%/25% Guar 75%/25% No Guar 50%/50% No Guar 25%/75%

32
Draw-down : stochastic analysisProbability distribution function of the total benefit
Average total
benefit
% of total negative returns
75% equities, no guarantee$ 382,193 10.3%
75% equities, with guarantee$ 353,816 0%
50% equities, no guarantee$ 367,709 2.5%
25% equities, no guarantee$ 350,591 0.1%0%
5%
10%
15%
20%
25%
30%
35%
0~140 140~180 180~220 220~260 260~300 300~340 340~380 380~420 420~460 460~500 500~0
$ 000
No Guar 75%/25% Guar 75%/25% No Guar 50%/50% No Guar 25%/75%

33
1. Current Investment Guarantees in Australia
2. Simple Accumulation Phase Investment Guarantees
3. Simple Draw-Down Phase Investment Guarantees
4. Investment Risk Management Strategies
5. Benefit to an Investor
6. Conclusions
Contents

34
Increasing demand for guarantees“When the baby boomers start to understand that they will live a long time, there will be a clamour for products that can sustain a high living standard, but have some kind of guarantee as well. My observation is that most people don’t know a lot about investments, so they want security more than anything else”, Monaghan (Intech) says. The post-retirement products currently on the market will not be acceptable to most baby boomers, he believes. Baby boomers want the high returns which market-linked allocated pensions currently offer, but will not want to bear their downside risk, or the risk the may outlive them.
Trading Up: investment banks court the wholesale funds management business Investment & Technology, July 2006

35
ConclusionsGrowing demand for investment guarantees
Australian market is relatively underdevelopedLegislative changesDemographic changes
Guarantees can be attractive
Possible to design guarantee with < 0.7% chargeRegular resets can make product more attractiveAdding a guarantee to an aggressive investment strategy can result in superior risk and return expectations than switching to a more conservative investment strategy
Supply should follow demand
Improvements in financial hedging and modellingMulti-nationals can import successful productsIncreasing sophistication of the super industry
36
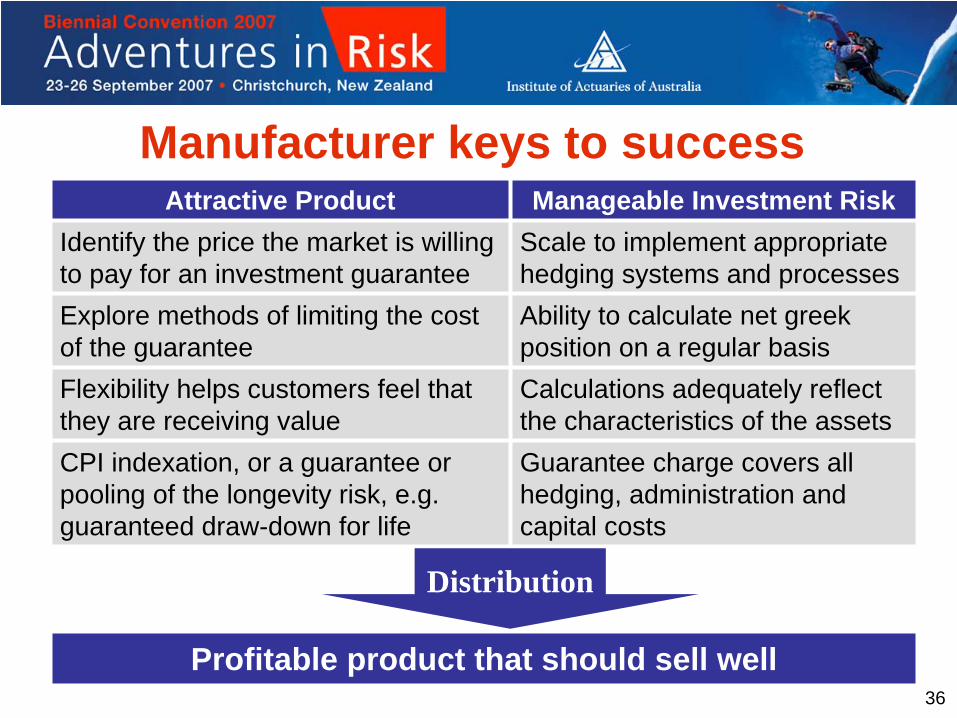
Manufacturer keys to successAttractive Product Manageable Investment Risk
Identify the price the market is willing to pay for an investment guarantee
Scale to implement appropriate hedging systems and processes
Explore methods of limiting the cost of the guarantee
Ability to calculate net greek position on a regular basis
Flexibility helps customers feel that they are receiving value
Calculations adequately reflect the characteristics of the assets
CPI indexation, or a guarantee or pooling of the longevity risk, e.g. guaranteed draw-down for life
Guarantee charge covers all hedging, administration and capital costs
Profitable product that should sell well
Distribution

37
Patrick Brennan [email protected] 02 8198 9083
John Nicholls [email protected] 03 9674 7162
Zac Roberts [email protected] 02 8258 2838
Contact Details

38
A quick surveyWhat is the likelihood of the superannuation industry developing guaranteed investment options over growth assets in the next 5 years?
Unlikely Neutral Likely
How many years before a member’s expected retirement do you think a member should start to consider this type of guarantee?
< 5 5 - 10 > 10
What annual fee (percentage of account balance) do you think a typical member would be prepared to pay for this type of guarantee?
< 0.4% 0.4% – 0.6% 0.6% – 0.8% 0.8% – 1.0% > 1.0%
What percentage of your post-retirement members or your members approaching retirement do you think would find this benefit attractive?
0% - 20% 21% - 40% 41% - 60% 61% - 80% 81% - 100%