abstract title of dissertation: an examination of the
TRANSCRIPT
ABSTRACT Title of Dissertation: AN EXAMINATION OF THE WORKING
CONDITIONS, CHALLENGES, AND TENSIONS EXPERIENCED BY MATHEMATICS TEACHERS
Ming Chang Tomayko, Doctor of Philosophy, 2007 Dissertation Directed by: Professor James T. Fey
Education Curriculum and Instruction
To make the professional work of teachers more effective and personally
satisfying, it is important to better understand the nature and effects of the evident
stresses in their work. The purpose of this study was to describe the quality of work life
of mathematics teachers in Maryland, with an eye on ultimately helping the mathematics
teaching profession and the broader education community to improve both the
effectiveness and satisfaction of K-12 teachers of mathematics.
Since school systems share many features with large organizations, the design of
the present study utilized prior research from industry on stress in the workplace to help
in understanding the strains of mathematics teaching. A review of literature suggested
five potential stressors which formed the basis of the study. The five stressors were: the
congruence of individual and organizational goals, teachers’ sense of agency, teachers’
sense of efficacy and respect, the level of professional interactions between teachers, and
the appropriateness of teachers’ work load. From these stressors, Likert-type survey
statements were generated and organized into a 77-item, online survey instrument.
Participants were solicited through flyers and e-mails. The survey data was
analyzed in two ways. First, teacher working conditions were evaluated in terms of the
five potential stressors. Then, a factor analysis of the survey data identified six
underlying components of stress in the work lives of mathematics teachers. Teacher
working conditions were then re-evaluated with respect to these six components. Finally,
a few of the survey participants were selected for follow-up interviews to provide
additional insights into their responses.
Statistical analysis using ANOVA and multiple comparison procedures resulted in
several findings. Mathematics teachers expressed having a lack of agency, particularly
with respect to decisions impacting instruction and assessment. Participants reported
feeling overloaded by their job responsibilities and many even cited interruptions to both
planning time and instructional time as serious obstacles to teaching. On the other hand,
mathematics teachers felt a strong sense of accomplishment. Comments provided by
participants indicate that they thrive on seeing students learn, grow, and succeed in
mathematics.
AN EXAMINATION OF THE WORKING CONDITIONS, CHALLENGES, AND TENSIONS
EXPERIENCED BY MATHEMATICS TEACHERS
by
Ming Chang Tomayko
Dissertation submitted to the Faculty of the Graduate School of the University of Maryland, College Park, in partial fulfillment
of the requirements for the degree of Doctor of Philosophy
2007
Dissertation Committee: Dr. James Fey, Chair Dr. Ken Berg
Dr. Lisa Boté Dr. Anna Graeber Dr. Denny Gulick

©Copyright by Ming Chang Tomayko
2007

ii
ACKNOWLEDGEMENTS
Many wonderful people were involved in making this dissertation come to
fruition. First, I would like to thank the Mid-Atlantic Center for Mathematics Teaching
and Learning, the Maryland Council of Teachers of Mathematics, and all of the
mathematics teachers who made this study possible. I would also like to thank my
committee for their valuable feedback and suggestions. I especially want to thank Jim
Fey, whose gentle prodding was greatly appreciated. I am also grateful to my family and
friends who encouraged me throughout this learning experience. Finally, I want to thank
David, who believed in me every step of the way.
iii
DEDICATION
I dedicate this dissertation to
my grandparents, my parents, and my husband
for their love and support.
iv
TABLE OF CONTENTS
List of Tables .................................................................................................................... vii List of Figures .................................................................................................................... ix Chapter 1: Introduction ....................................................................................................... 1
Rationale ......................................................................................................................... 1 Research Questions......................................................................................................... 4 Theoretical Perspective................................................................................................... 5 Definition of Strands....................................................................................................... 6
Goal Congruence ........................................................................................................ 6 Agency ........................................................................................................................ 8 Teacher Efficacy and Respect..................................................................................... 9 Professional Interaction ............................................................................................ 11 Load Appropriateness ............................................................................................... 11
Summary ....................................................................................................................... 13 Limitations .................................................................................................................... 14
Chapter 2: Literature Review............................................................................................ 16 Introduction................................................................................................................... 16 Stress ............................................................................................................................. 16 Burnout ......................................................................................................................... 21 Organizational Behavior Theory................................................................................... 23
Quality of Work Life ................................................................................................ 25 Stress in Organizations ............................................................................................. 27
Research on Barriers to Teaching ................................................................................. 29 Goal Congruence ...................................................................................................... 29 Agency ...................................................................................................................... 31 Teacher Efficacy and Respect................................................................................... 32 Professional Interaction ............................................................................................ 33 Role Overload ........................................................................................................... 33
Mathematics Education in Maryland – A Brief History............................................... 34 Education Reform at the National Level .................................................................. 34 Education Reform in Maryland ................................................................................ 36
Summary ....................................................................................................................... 40 Chapter 3: Methodology ................................................................................................... 41
Introduction................................................................................................................... 41 Setting ........................................................................................................................... 42 Sample........................................................................................................................... 43 Survey Instrument Development .................................................................................. 45 Survey Instrument......................................................................................................... 47 Survey Format............................................................................................................... 54 Procedures..................................................................................................................... 54 Coding of Independent and Dependent Variables ........................................................ 58
Independent Variables .............................................................................................. 58 Dependent Variables................................................................................................. 60
Data Analysis ................................................................................................................ 61 Descriptive Analyses ................................................................................................ 61
v
Analysis using Hypothesized Strands....................................................................... 62 Factor Analysis ......................................................................................................... 65
Identification of Factors........................................................................................ 67 Interpretation of Factors........................................................................................ 69
Analysis using Factors .............................................................................................. 72 Summary ....................................................................................................................... 73
Chapter 4: Results ............................................................................................................. 75 Participants.................................................................................................................... 75 Research Question 1 ..................................................................................................... 77
Goal Congruence ...................................................................................................... 78 Role Conflict......................................................................................................... 81 Person-environment Fit......................................................................................... 84 Role Ambiguity..................................................................................................... 86
Agency ...................................................................................................................... 87 Individual Teacher Power ..................................................................................... 91 Collective Teacher Power ..................................................................................... 93 Teacher Utilization................................................................................................ 94 Influences on Course Content............................................................................... 95 Influences on Course Methods.............................................................................. 98
Teacher Efficacy and Respect................................................................................... 99 Efficacy ............................................................................................................... 104 Respect................................................................................................................ 107
Professional Interaction .......................................................................................... 108 Teacher Collaboration Within Schools............................................................... 110 Professional Activities ........................................................................................ 112
Load Appropriateness ............................................................................................. 112 Research Question 2 ................................................................................................... 119 Research Question 3 ................................................................................................... 126
ANOVA using Strand Scores ................................................................................. 126 Gender................................................................................................................. 127 School District Size............................................................................................. 128 School District Location ..................................................................................... 133 Teaching Experience........................................................................................... 136 Teaching Placement ............................................................................................ 137
Research Question 4 ................................................................................................... 141 Research Question 5 ................................................................................................... 149
ANOVA using Factor Scores.................................................................................. 149 Gender................................................................................................................. 150 School District Size............................................................................................. 151 School District Location ..................................................................................... 155 Teaching Experience........................................................................................... 158 Teaching Placement ............................................................................................ 162
Summary ..................................................................................................................... 165 Chapter 5: Conclusions ................................................................................................... 167
Summary of Findings.................................................................................................. 168 Low Agency............................................................................................................ 168
vi
Overloaded.............................................................................................................. 172 Strong Sense of Accomplishment........................................................................... 175
Comparison of Findings with Prior Research............................................................. 175 Implications................................................................................................................. 177
The Good News ...................................................................................................... 178 The Bad News......................................................................................................... 179
Suggestions for Future Research ................................................................................ 180 Appendix A: E-mail to MCTM Membership ................................................................. 182 Appendix B: Flyer Distributed at MCTM Annual Conference ...................................... 183 Appendic C: Consent Form for Online Survey............................................................... 184 Appendix D: Online Survey Instrument ......................................................................... 186 Appendix E: E-mail to Respondents with Incomplete Surveys...................................... 197 Appendix F: E-mail to Teachers Selected for an Interview............................................ 198 Appendix G: Consent Form for Interview...................................................................... 199 Appendix H: Sample Interview Protocol........................................................................ 200 Appendix I: Program Code for Velicer’s Minimum Average Partial Procedure............ 202 References....................................................................................................................... 203
vii
LIST OF TABLES
Table 1. Goal Congruence Survey Items .......................................................................... 48 Table 2. Agency Survey Items.......................................................................................... 49 Table 3. Teacher Efficacy and Respect Survey Items ...................................................... 51 Table 4. Professional Interaction Survey Items ................................................................ 53 Table 5. Load Appropriateness Survey Items................................................................... 53 Table 6. Survey Statements and Loadings for Factor 1 .................................................... 69 Table 7. Survey Statements and Loadings for Factor 2 .................................................... 70 Table 8. Survey Statements and Loadings for Factor 3 .................................................... 71 Table 9. Survey Statements and Loadings for Factor 4 .................................................... 71 Table 10. Survey Statements and Loadings for Factor 5 .................................................. 72 Table 11. Survey Statements and Loadings for Factor 6 .................................................. 72 Table 12. Summary of Research Questions and Analysis Procedures ............................. 74 Table 13. Demographic Characteristics of Study Participants ......................................... 76 Table 14. Size and Location of School Districts of Survey Participants .......................... 77 Table 15. Response Distributions for Goal Congruence Items......................................... 79 Table 16. Response Distributions for Agency Items ........................................................ 88 Table 17. Response Distributions for Teacher Efficacy and Respect Items................... 100 Table 18. Response Distributions for Professional Interaction Items............................. 109 Table 19. Response Distributions for Load Appropriateness Items ............................... 113 Table 20. Internal Reliability Coefficients of Hypothesized Strands ............................. 119 Table 21. Test of Homogeneity of Variance of Strands When Grouped by Gender ...... 127 Table 22. ANOVA of Strands When Grouped by Gender ............................................. 128 Table 23. Test of Homogeneity of Variance of Strands When Grouped by School
District Size.................................................................................................... 128 Table 24. ANOVA of Strands When Grouped by School District Size ......................... 129 Table 25. Multiple Comparisons of Strands When Grouped by School District Size
Using Bonferroni............................................................................................ 131 Table 26. Test of Homogeneity of Variance of Strands When Grouped by School
District Location ............................................................................................ 133 Table 27. ANOVA of Strands When Grouped by School District Location.................. 134 Table 28. Multiple Comparisons of Strands When Grouped by School District
Location Using Bonferroni ............................................................................ 135 Table 29. Test of Homogeneity of Variance of Strands When Grouped by Teaching
Experience...................................................................................................... 136 Table 30. ANOVA of Strands When Grouped by Teaching Experience ....................... 137 Table 31. Test of Homogeneity of Variance of Strands When Grouped by Teaching
Placement ....................................................................................................... 137 Table 32. ANOVA of Strands When Grouped by Teaching Placement......................... 138 Table 33. Multiple Comparisons of Strands When Grouped by Teaching Placement
Using Bonferroni............................................................................................ 140 Table 34. Internal Reliability Coefficients of Theorized Factors ................................... 142 Table 35. Test of Homogeneity of Variance of Factors When Grouped by Gender ...... 150 Table 36. ANOVA of Factors When Grouped by Gender.............................................. 151
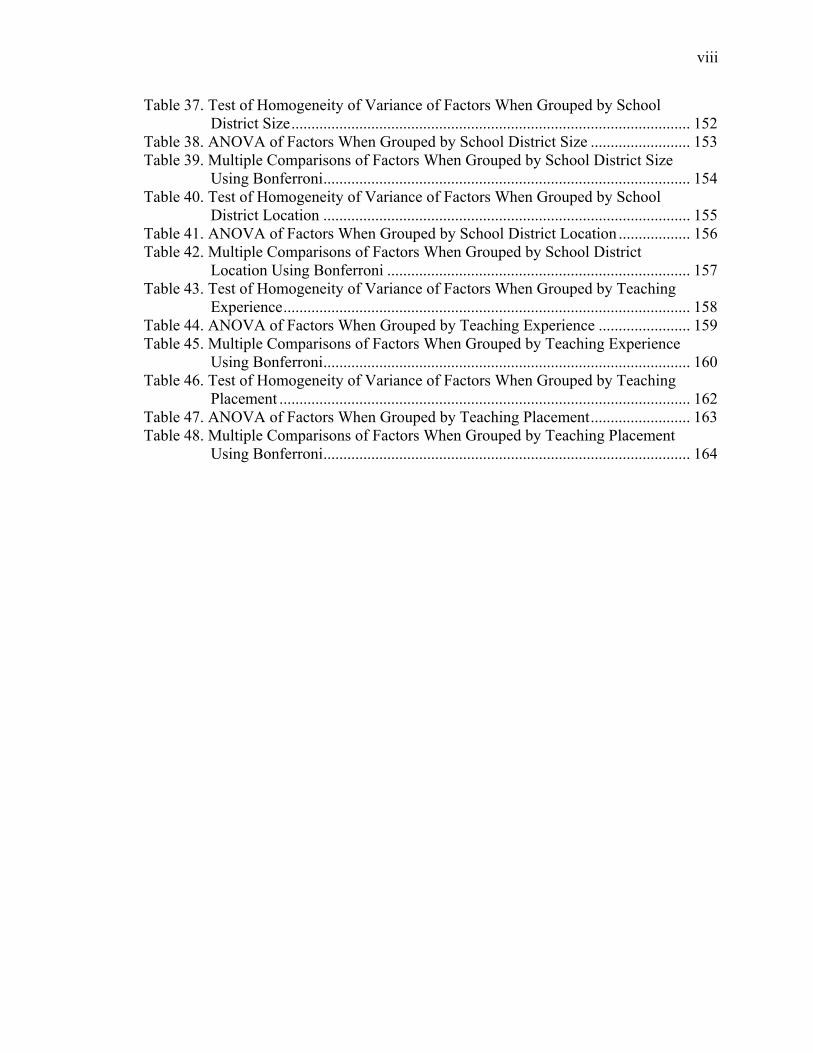
viii
Table 37. Test of Homogeneity of Variance of Factors When Grouped by School District Size.................................................................................................... 152
Table 38. ANOVA of Factors When Grouped by School District Size ......................... 153 Table 39. Multiple Comparisons of Factors When Grouped by School District Size
Using Bonferroni............................................................................................ 154 Table 40. Test of Homogeneity of Variance of Factors When Grouped by School
District Location ............................................................................................ 155 Table 41. ANOVA of Factors When Grouped by School District Location .................. 156 Table 42. Multiple Comparisons of Factors When Grouped by School District
Location Using Bonferroni ............................................................................ 157 Table 43. Test of Homogeneity of Variance of Factors When Grouped by Teaching
Experience...................................................................................................... 158 Table 44. ANOVA of Factors When Grouped by Teaching Experience ....................... 159 Table 45. Multiple Comparisons of Factors When Grouped by Teaching Experience
Using Bonferroni............................................................................................ 160 Table 46. Test of Homogeneity of Variance of Factors When Grouped by Teaching
Placement ....................................................................................................... 162 Table 47. ANOVA of Factors When Grouped by Teaching Placement......................... 163 Table 48. Multiple Comparisons of Factors When Grouped by Teaching Placement
Using Bonferroni............................................................................................ 164

ix
LIST OF FIGURES
Figure 1. The Relationship Between Pressure and Task Performance ............................. 18 Figure 2. A Model of Teacher Stress ................................................................................ 19 Figure 3. A Revised Model of Teacher Stress .................................................................. 20 Figure 4. The Seven Dimensions of the Quality of Work Life (QWL) Model ................ 26 Figure 5. Kahn and Byosiere’s Framework for the Study of Stress in Organizations...... 28 Figure 6. Model of Factor Analysis Using Principal Component Analysis (PCA)
as the Extraction Method ................................................................................. 66 Figure 7. Principal Component Axis in a Two Variable Model ....................................... 67 Figure 8. Participant Composite Scores for the Goal Congruence Strand...................... 121 Figure 9. Participant Composite Scores for the Agency Strand ..................................... 122 Figure 10. Participant Composite Scores for the Teacher Efficacy and Respect
Strand ............................................................................................................. 123 Figure 11. Participant Composite Scores for the Professional Interaction Strand.......... 124 Figure 12. Participant Composite Scores for the Load Appropriateness Strand ............ 125 Figure 13. Participant Composite Scores for the Sense of Accomplishment Factor ...... 143 Figure 14. Participant Composite Scores for the Locus of Instructional Control
Factor ............................................................................................................. 144 Figure 15. Participant Composite Scores for the Degree of Contentment With
Teaching Factor.............................................................................................. 145 Figure 16. Participant Composite Scores for the Level of Autonomy Factor ................ 146 Figure 17. Participant Composite Scores for the Professional Growth Factor ............... 147 Figure 18. Participant Composite Scores for the Freedom to Innovate Factor............... 148
1
CHAPTER 1: INTRODUCTION
Rationale
Nearly all teachers enter the profession of education with a strong belief that their
efforts will make a positive contribution to society and to the lives of individual students
(Farber, 1991; Lortie, 2002; Stiegelbauer, 1992). However, inspired beginning teachers
are often confronted with working conditions that frustrate their efforts and diminish their
belief that they will be able to make a difference. Changes in societal expectations and
control of education have had similar discouraging effects on capable experienced
teachers, leading to feelings of conflict and stress that too often culminate in burnout and
resignation from the profession.
The conflicts and frustrations of work in schools today are especially acute for
teachers in high stakes fields like mathematics. Those tensions of contemporary
mathematics teaching are expressed with passion and eloquence in recent words of an
Ohio middle school teacher who is involved in field tests of a Standards-based reform
curriculum.
As a user of CMP for the past 9 years I’ve never been shy about giving credit to
CMP for giving me knowledge, tools, and strength to teach middle school math to
middle school children. Now, with the coming of the new units, I have become
even more committed to teaching children for understanding! Over the past year I
have begun to feel the stress of the “new” state tests we’re going to give in Ohio
at grades 6, 7, and 8 and with this stress I’ve often felt like I was going to have to
give up some of what I love to teach so much … Connected Math. In fact, for the
two weeks prior to my visit to East Lansing, I had succumbed to my fears and

2
began “drilling” my kids [in] symbolic algebra at grade seven. I knew my
methods weren’t right as I could see the “deer in [the] headlights” eyes I saw
throughout my room. But, I couldn’t see what I knew was right … teaching for
understanding is so much more important than drilling for no understanding. (J.
Mamer, personal communication, February 28, 2005)
In addition to the stress induced by pressures of high stakes external assessments, today’s
mathematics teachers experience tensions caused by institutional policies that dictate
curriculum goals and teaching practices, non-academic school responsibilities that detract
from teaching, and conflict with parents and community activists who have strong ideas
about educational practices.
To make the professional work of teachers more effective and personally
satisfying, it is important to better understand the nature and effects of the evident
stresses in their work. The purpose of this study was to describe the quality of work life
of mathematics teachers in one diverse state, with an eye on ultimately helping the
mathematics teaching profession and the broader education community to improve both
the effectiveness and satisfaction of K-12 teachers of mathematics.
Because teaching shares many elements of work in all social service professions
and complex organizations, there is a useful body of prior research in social psychology
and organizational behavior to guide approaches to study of tension in mathematics
teaching. Using models from social psychology and organizational behavior theory on
quality of work life (QWL) and stress in organizations, these tensions can be clustered
around five strands. These tension strands are:

3
1. Goal Congruence
To what extent are individual teacher and institutional beliefs, goals, and
values congruent?
2. Agency
To what extent do teachers play a role in decision-making that affects their
work?
To what extent are teachers able to apply their personal skill and knowledge in
teaching mathematics?
3. Teacher Efficacy and Respect
To what extent do teachers feel they have the power to produce results?
To what extent do teachers feel they are viewed as competent professionals by
students, parents, colleagues, administrators, and the media?
4. Professional Interaction
To what extent do teachers have opportunities for collegial interaction?
5. Load Appropriateness
To what extent are teachers pressured for time from both academic and non-
academic responsibilities?
While these tensions exist across content areas and grade levels, they have
become particularly prominent in mathematics due to recent changes. Mathematics has
historically been considered essential as it is one of the three R’s – Reading, wRiting, and
aRithmetic. However, mathematics is now under increased scrutiny as a result of efforts
to ensure a mathematically literate citizenry. Calls for increased accountability and higher
standards have led to changes in mathematics testing and curriculum. The sometimes

4
conflicting pressures caused by these changes calls for a fresh take on the workplace
tensions of mathematics teachers.
Research Questions
In light of the current state of mathematics education and the existing research on
stress and tension in organizations, this research sought to answer the following research
questions.
1. What specific aspects of the professional working environment for mathematics
teaching are especially stressful and discouraging?
2. When tension is measured by the strands of goal congruence, agency, teacher efficacy
and respect, professional interaction, and load appropriateness, to what extent do
teachers of mathematics feel tensions in the conditions of their professional working
environment?
3. When tension is measured by the strands of goal congruence, agency, teacher efficacy
and respect, professional interaction, and load appropriateness, are there statistically
significant differences in the feelings of tension perceived by mathematics teachers
when examined in terms of demographic variables?
Since the five strands of goal congruence, agency, teacher efficacy and respect,
professional interaction, and load appropriateness were derived from literature in social
psychology and organizational behavior, it could be argued that the strands may not
adequately capture the sources of tension experienced by mathematics teachers. To
explore what underlying variables (sources of tension) could explain how participants
responded, I conducted a factor analysis. Ideally, the underlying variables would match
the five hypothesized strands. However, there could be differences. Once I identified the

5
underlying variables, I felt it appropriate to interpret the survey responses by re-analyzing
the data using the new item groupings. Therefore, the second phase of the study
addressed the following research questions:
4. When tension is measured by the factors identified through factor analysis, to what
extent do teachers of mathematics feel tensions in the conditions of their professional
working environment?
5. When tension is measured by the factors identified through factor analysis, are there
statistically significant differences in the feelings of tension perceived by
mathematics teachers when examined in terms of demographic variables?
Theoretical Perspective
The theoretical framework for this research draws upon a social-psychological
perspective as well as an organizational perspective. Social psychology is “the study of
the manner in which the personality, attitudes, motivations, and behavior of the
individual influence and are influenced by social groups” (Webster's Ninth New
Collegiate Dictionary, 1990, p. 1119). For the purposes of this study, the individuals of
interest are mathematics teachers and the social group is the educational institution. A
social-psychological perspective is appropriate because it is the interaction between
mathematics teachers and the educational institution and the resulting impact on beliefs,
attitudes, and behaviors which is at the heart of this research study.
Besides social psychology, an organizational perspective is also relevant when
considering teacher working conditions. The organizational perspective is based on
organizational behavior theory, the study of the structure, processes, and performance of
organizations, and the behaviors of and relationships between individuals and groups

6
within the organization (Katz & Kahn, 1978; Nelson & Quick, 2000). While there is
some overlap between the social-psychological and organizational perspectives, the key
difference is the emphasis on the role of the organization in the latter. For the current
study, the organizational perspective was used to investigate the work stress perceived by
mathematics teachers and the coping mechanisms they used as a result.
Definition of Strands
The present study was centered on five tension strands identified from
organizational research. These tension strands were goal congruence, agency, teacher
efficacy and respect, professional interaction, and load appropriateness. A description of
each strand is presented below.
Goal Congruence
The goal congruence strand assesses the extent to which mathematics teachers
perceive that their beliefs, goals, and values are in line with the beliefs, goals, and values
of the school, district, and state (Louis & Smith, 1990). Teachers’ beliefs, goals, and
values are shaped by their training and their experiences regarding the best ways to teach
and the ways students learn. The policies and rhetoric from schools, districts, and states,
however, often point to beliefs, goals, and values guided by efficiency, orderliness, and
measurable results. This dilemma is exemplified by Jim Mamer’s description of feeling
pulled in opposite directions by curriculum and testing (see page 1). In Jim’s case, he
recognizes what is educationally sound (teaching for understanding) but his instruction
falters under pressure from state tests. For some teachers, the pressures from policies can
be so paralyzing that they are unable to do what they know is best for students. This
“simultaneous occurrence of two or more role expectations”, in this case personal and

7
institutional role expectations, “such that compliance with one would make compliance
with the other more difficult” has been termed role conflict by social psychologists (Katz
& Kahn, 1978, p. 204).
The goal congruence strand also measures the congruence between the demands
of teaching and the abilities of teachers to meet those demands. For example, in any
given classroom, teachers work with students who are at a variety of levels
mathematically and students who have a variety of learning modalities. In addition, for
each grade level or course, the school and district prescribe expectations and timelines for
student achievement. Teachers are under pressure for all students to meet these
requirements. As a result, teachers can feel conflicted and overwhelmed by the demands
of teaching. Researchers have previously labeled this congruence or incongruence
between the teacher and the work environment as the Person-Environment (P-E) fit
model (French, Rodgers, & Cobb, 1974).
Another component of goal congruence is role ambiguity. For teachers, role
ambiguity manifests as a lack of clarity regarding their teaching objectives and methods.
For example, mathematics teachers are directed to follow: the guidelines of the National
Council of Teachers of Mathematics (NCTM) Principles and Standards for School
Mathematics (PSSM), the Maryland Voluntary Curriculum (MVC), and the local district
course objectives, while also keeping in mind the Maryland State Assessments (MSA),
the Maryland High School Assessments (HSA), and the local district course assessments.
In addition, a mandated textbook, administrators, and parents can all influence the
content and instructional methods a teacher employs. These numerous and varied
8
directions in which teachers are guided can result in a troublesome sense of role
ambiguity.
Agency
The agency strand measures how autonomous, empowered, and utilized teachers
feel. For example, autonomy can be gauged by asking mathematics teachers who
determines what content they teach and assess and how they teach and assess that content.
Do teachers feel they can modify lessons to better suit their own class? In conjunction
with autonomy is the idea of uniformity. Teachers are often pressured to teach the same
things the same way they are tested.
Another key aspect of the agency strand is a teacher’s role in decision-making. In
a recent survey of teachers in a Maryland school district, 91% of respondents said they
wanted to be involved in decision-making at their school, but only 48% felt as though
they were involved (Surface, 2005). Decision-making in the present study will be
evaluated with respect to curriculum, assessments, textbooks, pedagogy, and standards of
achievement. Connected to decision-making is the concept of locus of control. Do
teachers perceive that the locus of control resides with the teacher (internal) or with
others (external)?
A component of the agency strand is the extent to which teachers sense that their
skills and knowledge are required. If not, teachers can feel underutilized (Ingersoll, 2003;
Katz & Kahn, 1978) and dissatisfied (Hemmings & Metz, 1990). An extreme example of
underutilization is where districts prescribe curriculum guides so detailed and scripted
that they are mocked as teacher-proof, meaning anyone could “teach” from such a guide

9
(Feiman-Nemser & Floden, 1986). These highly specified guides can make teachers feel
disempowered and essentially reduce their role to a set of mundane, routine procedures.
In one study, Conley, Bacharach, and Bauer hypothesized that “[i]n schools in
which teachers report higher levels of work routinization, they will also report higher
levels of career dissatisfaction” (1989, p. 61). In this study, the researchers sought to
confirm Louis and Smith’s claim that one’s sense of skill and knowledge utilization is a
key facet of job satisfaction (1990). The researchers used a four-item scale to measure the
independent variable of routinization. The correlations and regressions conducted showed
that routinization was associated with career dissatisfaction at both the elementary and
secondary level and that routinization was a significant predictor of career dissatisfaction
at both levels.
Teacher Efficacy and Respect
The concept of teacher efficacy was first described in research by the RAND
organization (Armor et al., 1976). Since then, researchers have defined teacher efficacy
as “the extent to which the teacher believes he or she has the capacity to affect student
performance” (Berman, McLaughlin, Bass-Golod, Pauly, & Zellman, 1977, p. 137) or as
the “belief in their ability to have a positive effect on student learning” (Ashton, 1985, p.
142).
Teacher efficacy is derived from Bandura’s theory of self-efficacy. Bandura
described self-efficacy as “people’s judgments of their capabilities to organize and
execute courses of action required to attain designated types of performance” (Bandura,
1986, p. 391). One’s sense of self-efficacy is formed from several sources (Bandura,
1977). The most influential source is from one’s own experiences. Perceptions of efficacy

10
can be raised by successful experiences while failures, particularly repeated failures,
decrease such perceptions. For example, teachers whose students consistently fail to pass
state tests are likely to feel less and less efficacious. Another source is vicarious
experiences. In this case, if someone who I perceive is similar to me experiences success,
I will feel more capable of achieving success. However, if that person is unsuccessful, I
will feel less likely to be effective at the same task. For instance, a teacher may hear from
their colleague how difficult it is to teach students about fractions. This can cause the
teacher to have doubts about their own ability to teach fractions. Positive reinforcement
in the form of verbal or written feedback from supervisors or colleagues can also impact
one’s sense of self-efficacy. In teaching, such feedback could come from classroom
observations. However, these observations typically occur on an infrequent basis,
reducing the opportunities for teachers to receive comments on their skills.
Related to teacher efficacy is the concept of respect. A lack of respect can lead to
feelings of inefficacy. For example, teachers may feel bombarded by negative publicity.
They may hear on the radio that American students are lagging behind their international
counterparts on tests. They may read articles in the newspaper which ask why our
students cannot do better when the test items seem simple. Teachers may also find test
results published in the newspaper by school, district, or state. When teachers turn on the
television, they hear how student performance declines as students progress from grade 4
to grade 8 to grade 12, with the implication that more schooling leads to drops in scores.
In light of such disheartening news, this strand seeks to investigate how teachers perceive
they are respected by peers, parents, administrators, students, and the community.
11
Professional Interaction
The professional interaction strand considers how well the school culture
encourages professional growth and interaction. Such opportunities for frequent and
stimulating contact have been shown to reduce the feelings of isolation (Seeman, 1972)
created by the cellular structure of schools (Feiman-Nemser & Floden, 1986; Lortie,
2002). Teachers can also develop a sense of ownership and a vested interest in the
effectiveness of instruction by participating in meaningful collaborations with peers
(Louis & Smith, 1990). These collaborations may occur in many ways. For example,
classes can be scheduled such that teachers have common planning time to share and
discuss teaching ideas. Also, teachers can be given the chance to observe their peers in
the classroom to learn new or different instructional methods. Collaboration with peers
can also occur when teachers are encouraged to attend professional conferences. To make
these initiatives effective, it is important to have qualified substitute teachers available to
allow teachers time away from the classroom. Finally, another way schools can promote
professional growth is by subscribing to mathematics teaching publications to help
teachers stay abreast of research in the field.
Load Appropriateness
The term role overload comes from the study of stress in organizations (Kahn &
Byosiere, 1992). Role overload occurs when legitimate expectations are practically
impossible to fulfill within the given time constraints (Kahn, Wolfe, Quinn, Snoek, &
Rosenthal, 1964). The combination of high job demands and low resources results in
strain that is often referred to as role overload. In this study, the load appropriateness
strand assesses the extent to which teachers feel pressured for time from both academic
12
and non-academic responsibilities. The essence of this strand can be summed up by the
phrase, “and I’m supposed to do this while …” spoken by teachers when they receive
new expectations.
Role overload can stem from a variety of factors. For example, the district
curriculum guide can cause teachers to feel overloaded due to the amount of content
included and the pacing of that content. If teachers find their students are struggling with
the content, they may not feel able to spend more than the allotted time because of the
sheer quantity of material in the curriculum. Often, the curriculum content and pacing is
related to a district or state assessment. The need to prepare students for such tests can
also lead to feelings of overload, especially when students are having difficulty with the
concepts. Poor student performance on past assessments can also contribute to role
overload because of the additional demands of improving student proficiency.
Teachers can also feel overwhelmed by the numerous intrusions into teaching
time. Whether a mathematics class is scheduled to last 30 minutes, 50 minutes, or 90
minutes, the actual teaching time is significantly less due to various interruptions. For
example, instructional time is impacted when teachers must follow attendance procedures,
handle tardy students, listen to announcements, discipline disruptive students, help
struggling students, send students to receive special resources, allow students to use the
bathroom or health room, and sign field trip permission forms.
Teachers also experience intrusions in their planning time which can contribute to
feelings of role overload. Instead of being able to plan lessons or grade papers, teachers
are frequently asked to help students, proctor make-up assessments, cover class for an
absent colleague, copy handouts, and make phone calls for attendance issues, behavior
13
issues, or issues regarding student performance. Teachers may also be assigned hall duty,
lunch duty, or bus duty during periods when they are not teaching. Planning time can also
be reduced when teachers are required to attend Individualized Education Program (IEP)
meetings.
Role overload is not a new phenomenon. In 1963, Lortie interviewed 94 teachers
from Boston, Massachusetts and found that tasks and time use were common complaints
(Lortie, 2002). As part of the interview, Lortie asked participants, “What are the things
which you like least about teaching,” “What are the things which bother you most in your
work,” and “What are the little things that irritate you in your work?” In response,
teachers mentioned clerical duties, interruptions, time pressures, duties outside class,
large classes, and grading papers among other things. These findings led Lortie to
comment, “There is a note of hurt, of dignity offended, in this talk about disruption and
managing time. Intrusions on teaching carry a symbolic meaning – they depreciate the
importance of those tasks the teacher considers central” (Lortie, 2002, p.179). This
statement captures my personal feelings that the main purpose in teaching, namely
instruction of students, is often sacrificed because of the numerous other responsibilities
placed upon teachers. Not only does this contribute to role overload, but it also negatively
impacts the feeling that one is a professional.
Summary
Mathematics has traditionally been viewed as a cornerstone of American
education. However, concern over student performance on national and international
mathematics assessments has led to increased scrutiny of teachers and more stringent
policies regarding teaching practices. As a result, mathematics teachers today face new
14
challenges, tensions, and stresses which impact their ability to teach students. The
purpose of this study was to describe the working conditions of mathematics teachers in
an effort to identify and understand the tensions they face.
Since school systems share many features with large organizations, the design of
the present study utilized prior research from industry on stress in the workplace to help
in understanding the strains of mathematics teaching. A review of literature produced a
collection of five potential stressors which formed the basis of the study. From these five
stressors, Likert-type survey statements were generated and organized into an online
survey instrument.
The survey was administered to a sample of mathematics teachers and the
resulting data was analyzed in two ways. First, teacher working conditions were
evaluated in terms of the five potential stressors. Then, a factor analysis of the survey
data identified six underlying components of stress in the work lives of mathematics
teachers. Teacher working conditions were then re-evaluated with respect to these six
components. Finally, a few of the survey participants were selected for follow-up
interviews to provide additional insights into their responses.
Limitations
As with any research, there were limitations to this study which need to be
considered when interpreting the results. These limitations can be categorized as those
which impacted who participated and those which impacted how participants responded.
There were a number of factors that could have biased the composition of the
sample. First, the location of the Maryland Council of Teachers of Mathematics (MCTM)
annual conference may have restricted the participation of teachers from distant school

15
districts since flyers advertising the survey were distributed there. Second, the use of an
online survey instrument may have prevented teachers without computer or internet
access from responding. Similarly, teachers who are uncomfortable using technology
may have been dissuaded from participating because of the survey format. It is also
conceivable that the length of the survey may have caused teachers to exit the survey
prematurely. Some teachers may have been uncomfortable rating statements about
working conditions and either elected not to participate or stopped taking the survey. The
small proportion of elementary school teachers in the sample may stem from how they
see themselves (as generalists rather than math teachers). Finally, the small number of
private school teachers in the sample could be due to insufficient solicitation.
Several structural aspects of the survey could have influenced the results. First,
the survey was administered from mid-October to mid-November. This time-frame may
mute teacher perceptions of stress and tension in comparison to the spring when
mandated testing is in full swing. Second, teachers may be reluctant to seem critical of
their school or district and therefore, underreporting of stress or tension could have
occurred. Another factor that could affect the results is the fact that many participants
teach multiple classes. The design of the survey items did not permit teachers to
distinguish between their different classes as they responded. Lastly, the small number of
teachers selected for interviewing prohibits generalization of their experiences to the
sample or to teachers at large.
16
CHAPTER 2: LITERATURE REVIEW
Introduction
As with all new research, it is important to start by looking back at what others
have already discovered. This chapter highlights the findings which shaped my
theoretical perspective, hypothesized tension strands, and research questions. First, a
review of the history of stress and burnout is presented, both of which are key concepts to
studying the working conditions of teachers. Second, background information on
organizational behavior theory and a description of two areas which are particularly
salient to this investigation – the quality of work life model and the study of stress in
organizations – is provided. Third, some key research findings regarding sources of stress
and barriers to teaching are discussed. These results lend credence to the selection and
inclusion of the five tension strands (i.e., goal congruence, agency, teacher efficacy and
respect, professional interaction, and load appropriateness). Finally, the stage will be set
for the current study by detailing the state of mathematics education reform in Maryland
over the past several decades.
Stress
The study of stress has historical roots in the research of Hans Selye, an
endocrinologist. Selye found that stress caused “certain changes in the structure and
chemical composition of the body” (Selye, 1978, p. 1). Together, these changes are
known as the stress syndrome which Selye termed the general adaptation syndrome (also
known as G.A.S.). There are three stages to the general adaptation syndrome: the alarm
reaction; the stage of resistance; and the stage of exhaustion. This syndrome suggests that
when faced with a stressor, or stress-producing factor, the first response will be to react.

17
The person will then seek to resist the stressor by making adaptations. If the person is
unsuccessful at resisting the stressor through these adaptations, they will eventually
exhaust their resources and succumb. Selye went on to state: “In the course of a normal
human life, everybody goes through these first two stages many, many times. Otherwise
we could never become adapted to perform all the activities and face all the demands
which are man’s lot” (Selye, 1978, p. 79).
Selye viewed stress as a dependent variable. He defined stress as “the nonspecific
response of the body to any demand, whether it is caused by, or results in, pleasant or
unpleasant conditions” (Selye, 1978, p. 74). To help distinguish between stress caused by
pleasant conditions and stress caused by unpleasant conditions, Selye coined the terms
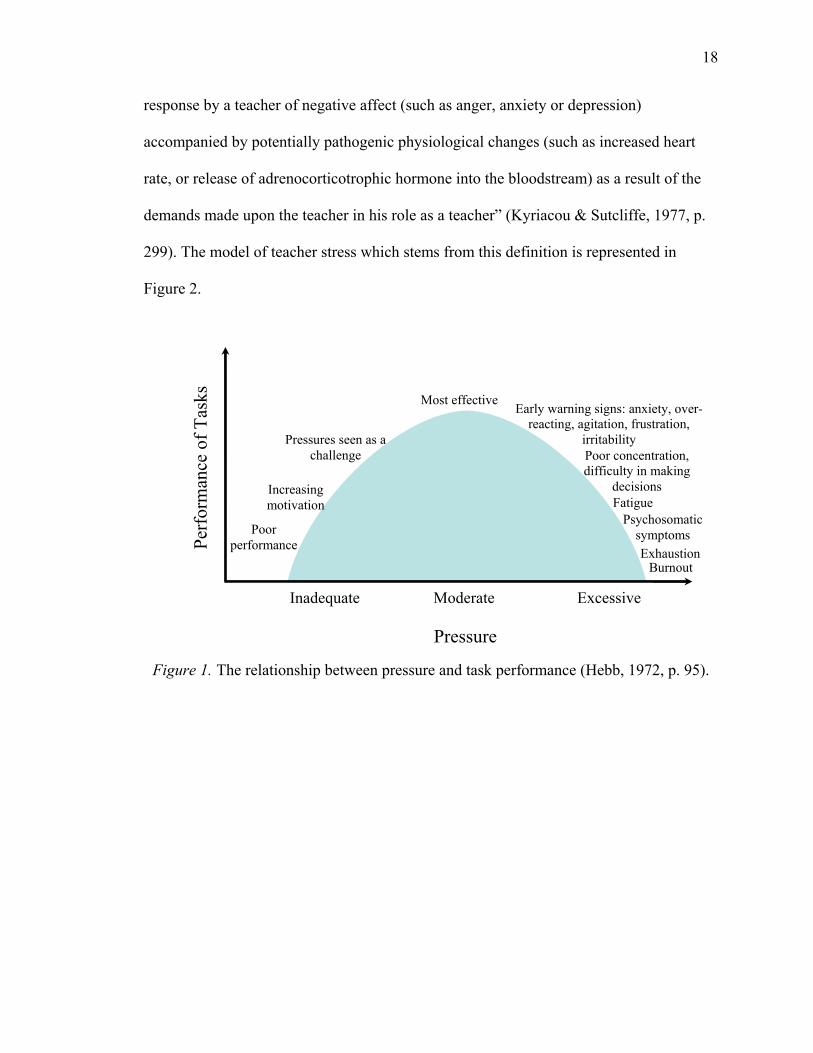
‘eustress’ (good stress) and ‘distress’ (detrimental stress). As shown in Figure 1, Hebb
(1972) also seemed to suggest that stress could be both positive and negative. At the
lower extreme, a lack of pressure will result in poor task performance. As pressure
increases to a moderate level (e.g., eustress), task performance improves. However, if
pressure is excessive (e.g., distress), task performance will suffer and feelings of anxiety,
frustration, fatigue, and even burnout can occur.
While Selye delineated two types of stress, it is not surprising that what
researchers are more intrigued by is distress, not eustress. As a result, researchers
typically use the more common term ‘stress’ even when they are only referring to
harmful stress. In keeping with the majority of the literature, I will use ‘stress’ in the
negative sense.
Stress specific to teachers has also been described in the literature. In keeping
with Selye’s view that stress is a dependent variable, teacher stress has been defined as “a
18
response by a teacher of negative affect (such as anger, anxiety or depression)
accompanied by potentially pathogenic physiological changes (such as increased heart
rate, or release of adrenocorticotrophic hormone into the bloodstream) as a result of the
demands made upon the teacher in his role as a teacher” (Kyriacou & Sutcliffe, 1977, p.
299). The model of teacher stress which stems from this definition is represented in
Figure 2.
Figure 1. The relationship between pressure and task performance (Hebb, 1972, p. 95).
Psychosomatic symptoms Pe
rfor
man
ce o
f Tas
ks
Inadequate Moderate Excessive
Pressure
Poor performance
Increasing motivation
Pressures seen as a challenge
Most effective Early warning signs: anxiety, over-
reacting, agitation, frustration, irritability
Fatigue
Burnout
Poor concentration, difficulty in making
decisions
Exhaustion
19
Figure 2. A model of teacher stress (Kyriacou & Sutcliffe, 1978, p. 3).
At the center of this model are the potential stressors, the coping mechanisms
employed, and the resulting teacher stress when the coping mechanisms fail. The
stressors may be physical (e.g., poor facilities, lack of materials) or psychological (e.g.,
poor relationships with administrators, peers, students, etc.) and can be influenced by
characteristics of the teacher (e.g., personality type, self-esteem, etc.). The build-up of
stress can lead to chronic symptoms. More recently, Kyriacou has modified his definition
of teacher stress to be “the experience by a teacher of unpleasant, negative emotions, such
as anger, anxiety, tension, frustration or depression, resulting from some aspect of their
work as a teacher” (2001, p. 28).
Critics of the early work in stress research argue that a unidirectional, response-
based model fails to address the variations in frequency, intensity, and duration of the
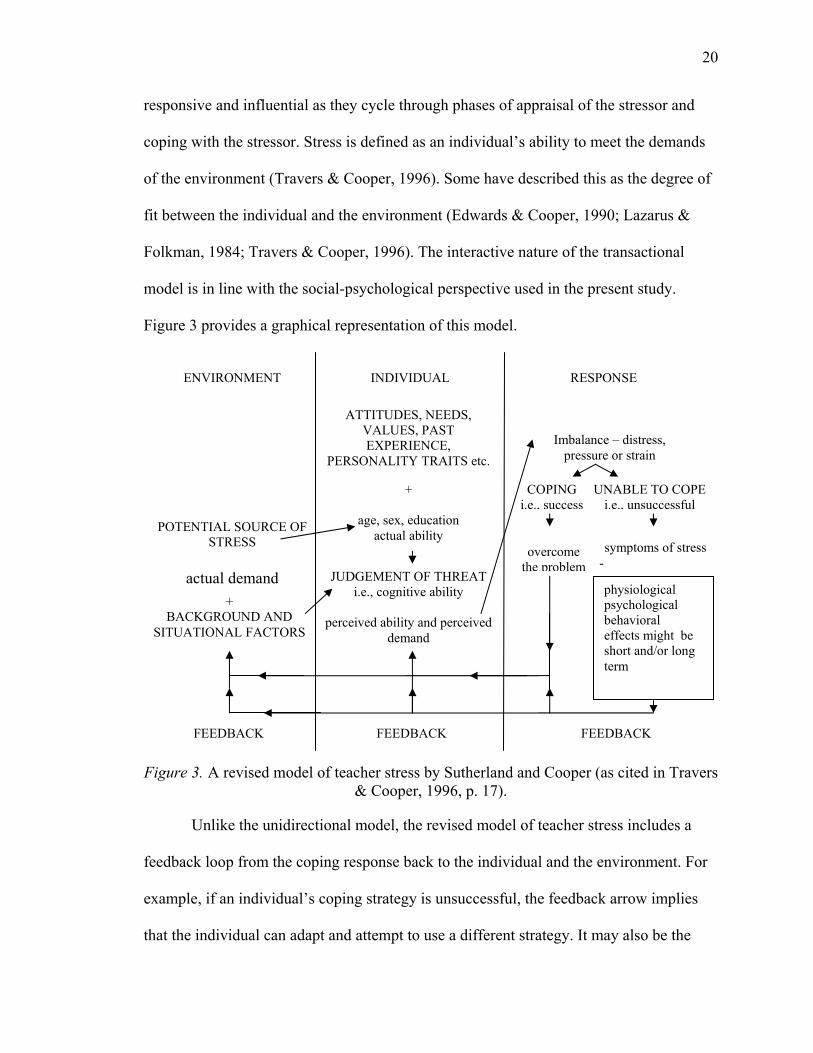
stimulus. As a result, researchers have theorized a different model of stress. In the
transactional model, stress is a “relationship between the person and the environment that
is appraised by the person as taxing or exceeding his or her resources and endangering his
or her well-being” (Lazarus & Folkman, 1984, p. 19). Dunham refers to this model as an
interactionist approach (1992). Using this model, individuals are viewed as both
Characteristics of the Individual Teacher biographical personality e.g. support self-efficacy …
Potential Stressors physical psychological
Coping Mechanisms to reduce perceived threat
Teacher Stress negative affects response correlates psychological physiological behavioral
Chronic Symptoms psychosomaticcoronary mental
20
responsive and influential as they cycle through phases of appraisal of the stressor and
coping with the stressor. Stress is defined as an individual’s ability to meet the demands
of the environment (Travers & Cooper, 1996). Some have described this as the degree of
fit between the individual and the environment (Edwards & Cooper, 1990; Lazarus &
Folkman, 1984; Travers & Cooper, 1996). The interactive nature of the transactional
model is in line with the social-psychological perspective used in the present study.
Figure 3 provides a graphical representation of this model.
Figure 3. A revised model of teacher stress by Sutherland and Cooper (as cited in Travers
& Cooper, 1996, p. 17).
Unlike the unidirectional model, the revised model of teacher stress includes a
feedback loop from the coping response back to the individual and the environment. For
example, if an individual’s coping strategy is unsuccessful, the feedback arrow implies
that the individual can adapt and attempt to use a different strategy. It may also be the
physiological psychological behavioral effects might be short and/or long term
FEEDBACK FEEDBACK
INDIVIDUAL RESPONSE
ATTITUDES, NEEDS, VALUES, PAST EXPERIENCE,
PERSONALITY TRAITS etc.
+
age, sex, education actual ability
JUDGEMENT OF THREAT i.e., cognitive ability
perceived ability and perceived
demand
overcome the problem
COPING i.e., success
UNABLE TO COPEi.e., unsuccessful
Imbalance – distress, pressure or strain
ENVIRONMENT
POTENTIAL SOURCE OF STRESS
actual demand +
BACKGROUND AND SITUATIONAL FACTORS
FEEDBACK
symptoms of stress -

21
case that the feedback causes changes in the environment which in turn impact the
perception of stress.
Burnout
Chronic stress can lead to burnout. Probably the most notable figure in the study
of burnout is Christina Maslach. Maslach’s initial interest was to uncover how
individuals maintain their composure and accomplish their tasks when faced with a
difficult situation (Maslach & Jackson, 1984). For instance, how do rescue workers at the
scene of a gruesome accident manage their emotions so as not to interfere with their job?
Maslach began by interviewing doctors and nurses and found that they often felt their
training had left them ill-equipped to handle the stresses of the job. Curious to see if
individuals in other service-oriented professions experienced similar phenomena,
Maslach then interviewed ministers, prison guards, teachers, and probation officers and
surveyed social workers through a questionnaire. A theory of burnout was beginning to
form. It appeared that burnout was manifested in the emotional exhaustion of workers
and the depersonalized nature of their interactions with clients. There also appeared to be
relationship between burnout and a decreased sense of personal accomplishment.
To test this theory, a 47-item instrument was constructed and administered to 605
people from a variety of service occupations (e.g., counselors, teachers, police, doctors,
attorneys, psychologists, nurses, and social workers) (Maslach & Jackson, 1981).
Subjects rated each item for frequency and intensity on a Likert-type scale. Factor
analysis resulted in ten factors for both the frequency and intensity scales. Four of these
ten factors explained over 75% of the variance. These four factors were emotional
exhaustion, depersonalization, personal accomplishment, and involvement. Each item

22
was evaluated on the following criteria: having “a factor loading greater than 0.40 on
only one of the four factors, a large range of subject response, a relatively low percentage
of subjects checking the ‘never’ response, and a high item-total correlation” (Maslach &
Jackson, 1981, p. 101). Using these standards, the instrument was reduced to a set of 25
items.
The revised instrument was then administered to a new sample of 420 individuals
from the same types of service professions. A factor analysis was done on the new data
with similar results. It is common practice to only extract factors with eigenvalues greater
than one (Kim & Mueller, 1978). In this analysis, the involvement factor was excluded
for this reason. Using data from the second sample, reliability coefficients for the
remaining factors were calculated and ranged from 0.72 to 0.89 (Maslach & Jackson,
1981). The resulting 22-items covering the three subscales of emotional exhaustion,
depersonalization, and personal accomplishment became the Maslach Burnout Inventory
(MBI) which has been widely used (Brissie, Hoover-Dempsey, & Bassler, 1988; Byrne,
1994; Friedman, 1991; Schwab & Iwanicki, 1982). Due to the desire to quantify burnout
in various settings, the MBI has been adapted for use with educators and non-service
occupations. The MBI Educators Survey (MBI-ES) measures the same three dimensions
as the original survey but replaces instances of the term ‘recipient’ with ‘student.’ The
MBI General Survey (MBI-GS) is comprised of 16 items and focuses on the performance
of work rather than on the service between individual and recipient. The dimensions for
the MBI-GS are exhaustion, cynicism, and professional efficacy.
Derived from her empirical research findings, Maslach defines burnout as “a
psychological syndrome of emotional exhaustion, depersonalization, and reduced

23
personal accomplishment that can occur among individuals who work with other people
in some capacity”(Maslach, Jackson, & Leiter, 1997, p. 192). The first and most
significant component is emotional exhaustion, which occurs when one has ‘given it all
they can.’ Burnout can also lead to negative, or even cynical, feelings and attitudes
toward clients. The third component of burnout is the tendency to be dissatisfied with
one’s work and to evaluate oneself in a negative light. Burnout is a serious issue because
it can result in the “deterioration in the quality of care or service that is provided”
(Maslach & Jackson, 1981, p. 100). In the case of teachers, burnout is a subject we
should all be concerned about because the education of our youth is at stake.
Organizational Behavior Theory
Systematic analysis of organizational behavior first began during the Industrial
Revolution when the advent of large factories gave rise to issues related to managing
large numbers of people and vast quantities of equipment and resources. Frederic Taylor
(1856-1915), one of the classical organizational theorists, focused on improving
efficiency and production by breaking tasks into their smallest components, determining
the best method for accomplishing that job, and standardizing that routine. Another
classical theorist, Max Weber (1864-1920), studied organizations to determine the core
characteristics that made them efficient and reliable at achieving their goals. Weber used
these characteristics to define the term bureaucracy to describe an organization where: a)
tasks were specialized, b) processes, procedures, and roles were standardized, c)
decision-making was centralized, and d) authority was structured hierarchically (Katz &
Kahn, 1978). Such bureaucratic organizations featured merit-based awards rather than
selection or promotion based on favoritism. In attempting to make organizations as
24
efficient as machines, the classical theorists failed to consider the people involved in the
organizations and the humanistic needs of those workers.
As a result of the criticisms of Taylorism and the Weberian model of bureaucracy,
researchers proposed an organizational structure that emphasized human relations. One of
these researchers was Elton Mayo (1880-1949) who is best known for his Hawthorne
experiments. The Hawthorne studies were designed to look at the effects of physical
conditions on workers’ productivity but had the surprising result that human factors were
more significant than environmental factors in determining yield (Nelson & Quick, 2000).
Consequently, organizational theorists came to believe that improvements in productivity
were linked to enhanced morale and that morale was dependent on workers feeling that
they had job security, that they belonged, that they had a good relationship with
management, and that they received recognition for their work. Throughout the twentieth
century, such revelations continued to shape the field of organizational behavior.
Unlike classical theorists who sought to find the one best way to structure
organizations in general, the goal of modern-day organizational theorists is to find the
best fit between structure, size, function, and environment for each individual
organization. With this is mind, researchers involved in organizational behavior have
studied attributes of effective organizations. For example, effective organizations tend to:
a) recruit quality people, b) structure the organization and tasks to enable workers to
achieve their goals, and c) reward employees for their accomplishments (Conley et al.,
1989). In addition, organizations cognizant of issues surrounding the quality of work life
(QWL) appear to be more effective at retaining their employees and achieving their goals
(Louis & Smith, 1990). Some of the findings related to QWL seem particularly useful
25
when considering the tensions teachers face in schools and how best to alleviate those
tensions.
Quality of Work Life
The QWL model comes from work in social psychology and draws on ideas from
the humanistic organizational behavior theories of Mayo and his contemporaries. There
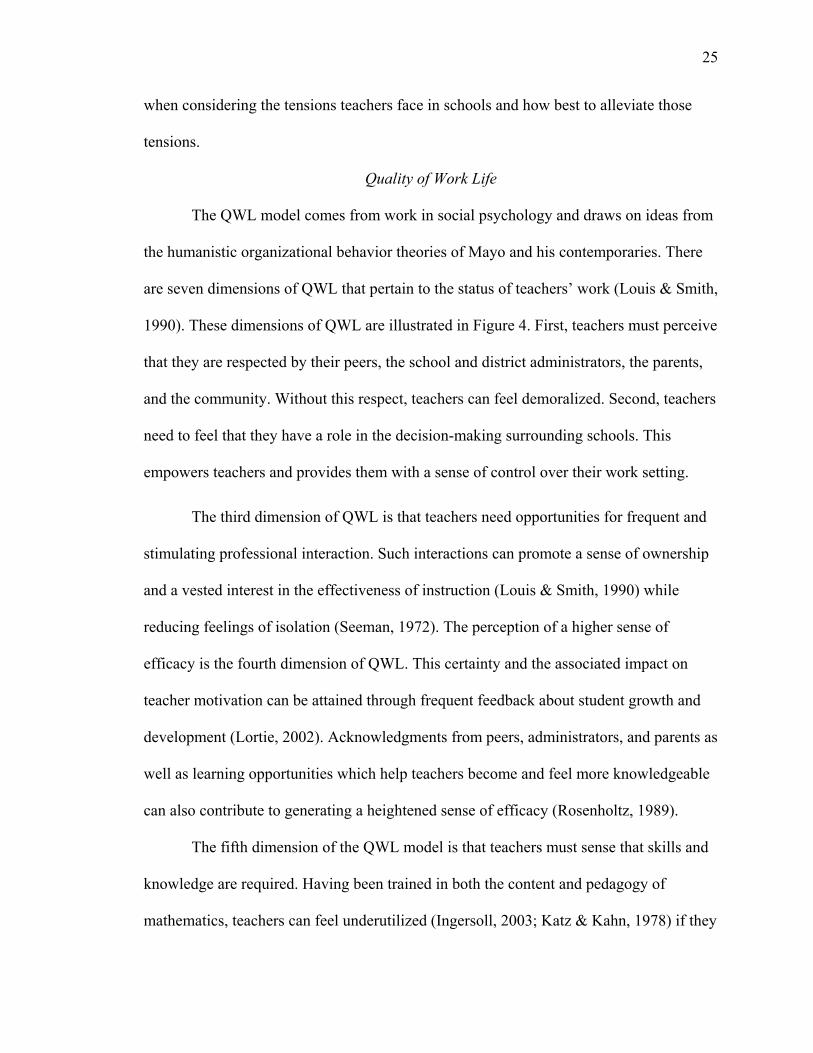
are seven dimensions of QWL that pertain to the status of teachers’ work (Louis & Smith,
1990). These dimensions of QWL are illustrated in Figure 4. First, teachers must perceive
that they are respected by their peers, the school and district administrators, the parents,
and the community. Without this respect, teachers can feel demoralized. Second, teachers
need to feel that they have a role in the decision-making surrounding schools. This
empowers teachers and provides them with a sense of control over their work setting.
The third dimension of QWL is that teachers need opportunities for frequent and
stimulating professional interaction. Such interactions can promote a sense of ownership
and a vested interest in the effectiveness of instruction (Louis & Smith, 1990) while
reducing feelings of isolation (Seeman, 1972). The perception of a higher sense of
efficacy is the fourth dimension of QWL. This certainty and the associated impact on
teacher motivation can be attained through frequent feedback about student growth and
development (Lortie, 2002). Acknowledgments from peers, administrators, and parents as
well as learning opportunities which help teachers become and feel more knowledgeable
can also contribute to generating a heightened sense of efficacy (Rosenholtz, 1989).
The fifth dimension of the QWL model is that teachers must sense that skills and
knowledge are required. Having been trained in both the content and pedagogy of
mathematics, teachers can feel underutilized (Ingersoll, 2003; Katz & Kahn, 1978) if they
26
are required to follow scripted lesson plans and use assessments provided by the district.
This dissatisfaction can be avoided if teachers have opportunities to use their talents and
to grow professionally (Louis & Smith, 1990). In addition, when teachers feel that their
expertise is considered necessary and desirable, they are less likely to leave the field.
Figure 4. The seven dimensions of the Quality of Work Life (QWL) model.
Having the resources to fulfill the duties of the job is the sixth dimension of QWL.
For teachers, this equates to having comfortable facilities, access to necessary materials,
and the absence of disruptions related to students and administration (Conley et al., 1989;
Gold & Roth, 1993; Rosenholtz, 1989). The final dimension of QWL is goal congruence
between the employee and the institution. In other words, teachers must perceive that the
beliefs, goals, and values of the school and district are consistent with their own beliefs,
QWL
Respect
Empowerment
Professional Interaction
Efficacy
Skills
Resources
Goal Congruence

27
goals, and values (Louis & Smith, 1990). These dimensions are useful in examining some
of the existing research on teaching tensions.
Stress in Organizations
Another facet of organizational behavior that is useful is the study of stress in
organizations. The study of stress is not a new phenomenon (Kahn et al., 1964) and is not
restricted to the field of education. “There is no doubt that job-related stress [is] rapidly
becoming one of the most pressing occupational safety and health concerns in the country
today” (Millar, 1992, p. 5). In particular, a framework for the study of stress in
organizations designed by Kahn and Byosiere (1992) is quite relevant to teaching
tensions. This framework is outlined in Figure 5.
The framework starts by considering the characteristics of the organization: its
structure, size, output, and finances. These characteristics can cause both physical and
psychosocial stress for members of the organization. For teachers, physical stress can be
exhibited in classrooms where noise, light, temperature, or layout cause problems.
Psychosocial stress is a result of pressures aimed at changing the behavior of employees
and has three possible components: role ambiguity, role conflict, and role overload
(Landy, 1992). Role ambiguity is when employees are unclear about the extent of their
responsibilities or when employees are unsure of whose expectations they are required to
fulfill (Kahn et al., 1964; Katz & Kahn, 1978). Role conflict happens when a person’s
role expectations are perceived to be at cross-purposes or are contradictory (Katz & Kahn,
1978). Role overload occurs when time constraints make it difficult, or even impossible,
to complete the required job tasks (Kahn et al., 1964). In the case of mathematics teachers,
these stressors are manifested in the push and pull between standardized testing and the

28
vision outlined in curriculum standards. This tension is clearly articulated in Jim
Mamer’s quote on teaching to the test versus teaching for understanding (see page 1).
Figure 5. Kahn and Byosiere’s framework for the study of stress in organizations.
Another consideration introduced in the framework is when and how an employee
perceives or is cognizant of the stressors. Either way, there is a response to the stress
which can be physiological (e.g., cardiovascular, biochemical, gastrointestinal,
musculoskeletal), psychological (e.g., depression, anxiety, low job satisfaction, sense of
futility, high tension), or behavioral (e.g., turnover, absenteeism) (Landy, 1992). These
responses compromise the health of the individual and the effectiveness of the
organization.
At any point in this framework, personal and situational factors can act as stress
mediators. For example, personal factors which may impact perceived stress and the
Perceptions and Cognitions
Consequences of Stress
Responses to Stress
Physical and Psychosocial Stressors
Organizational Characteristics
Personality Stress
Mediators
Situational Stress
Mediators
29
resulting response include having: type A/B personality, self-esteem concerns, issues
with locus of control, and demographic characteristics (Kahn et al., 1964; Landy, 1992).
Situational properties could include patterns of interaction with supervisors or peers. For
instance, if a cooperative and respectful relationship existed between the employee and
supervisor, the employee may handle the stress differently than if this were not the case.
Taken as a whole, this framework provides a means of understanding the influence of
stress in organizations.
In summary, the perspective presented in this paper for examining the issue of
teaching tensions is partially grounded in organizational behavior theory and the study of
stress in organizations. This perspective focuses on “how organizations and their
sociocultural environments affect a person’s response to work” (Byrne, 1999, p. 18). My
particular interest is in how features of the work environment are perceived by
mathematics teachers as barriers to teaching.
Research on Barriers to Teaching
This section presents relevant research related to each of the five tension strands
(goal congruence, agency, teacher efficacy and respect, professional interaction, and load
appropriateness).
Goal Congruence
The goal congruence strand seeks to measure the relationship between teacher
beliefs and institutional beliefs. Jeffrey and Woods (1998) found stark differences
between primary school teacher values and institutional values when investigating the
impact of school inspections in England. For example, teachers sought flexibility and
autonomy in their practice while the Office for Standards in Education wanted teachers to

30
follow a controlled and prescribed national curriculum. In terms of assessing students,
teachers favored qualitative, locally created measures rather than mass produced
standardized ones. The institution’s desire for control and uniformity was also at odds
with teachers’ need to feel utilized and recognized as professionals.
Teacher values were also considered in research by Bachkirova (2003). In her
study of teacher stress and personal values, Bachkirova categorized participants on three
factors: the match (m) or mismatch (mm) between their personal values and those of
educational authorities; their level of ambition to succeed professionally (A+ for high and
A- for low); and their sensitivity threshold (S+ for sensitive and S- for placid). She
hypothesized that mm, A+, S+ individuals would be the most prone to stress. Bachkirova
invited 97 university lecturers and teachers from a partner school to complete an
anonymous questionnaire. The response rate was quite high (over 80%) resulting in a
sample of 36 lecturers and 36 teachers. Based on the questionnaire responses, 20 lecturers
and 20 teachers were classified as mm, A+, S+. The group of mm, A+, S+ participants
had a significantly higher level of work related stress when compared to all the other
groups combined at the p<.001 level, supporting the original hypothesis.
Role conflict and role ambiguity are also part of the goal congruence strand and
have been studied in numerous settings. Schwab and Iwanicki (1982) investigated the
relationship of role conflict and role ambiguity to teacher burnout using a sample of 469
classroom teachers from the Massachusetts Teachers Association. Participants completed
the Teachers’ Stress Survey which consisted of the MBI and a role questionnaire. The
researchers found that role conflict accounted for the most variance in the emotional
exhaustion component of burnout (20% for frequency and 24% for intensity). Role

31
ambiguity explained a significant amount of the variance in the personal accomplishment
aspect of burnout with 6% for frequency and 3% for intensity. In a study of 339 teachers
from the New Hampshire National Education Association, Schwab, Jackson, and Schuler
(1986) looked at causes of stress as they related to burnout. They found both role conflict
and role ambiguity to be significantly related to burnout.
Role conflict and role ambiguity have also been studied with regard to job
dissatisfaction. Sutton (1984) found role conflict correlated with job dissatisfaction (r=.41,
p<.05) from a sample of 200 classroom teachers from 25 public schools in Michigan.
However, results for role ambiguity have been mixed. Sutton reported a weak correlation
between role ambiguity and job dissatisfaction (r=.25, p<.05) while Conley et al. (1989)
found a strong correlations at both the elementary and secondary level (r=.64 and .74,
p<.001). In fact, role ambiguity explained the most variance in dissatisfaction out of all
independent variables (41% for elementary, 55% for secondary). The findings from
Conley et al. came from questionnaires administered in 42 elementary schools and 45
secondary schools in New York.
Agency
Research on the agency strand highlights the lack of autonomy as a significant
source of stress. Archbald and Porter (1994) surveyed high school mathematics and
social studies teachers from selected urban districts in California, Florida, and New York.
They were interested in whether curriculum control policies affect teachers’ sense of
autonomy and job satisfaction. Their findings indicate that teachers in low-control
districts felt more freedom to decide the content and pedagogy used in their classes than
teachers in high-control districts. Teachers were also asked about influences to their

32
course content. Archbald and Porter reported that teachers in high-control districts felt
state and district tests and curriculum guides had a greater impact on course content then
their peers in low-control districts.
This strong influence of tests was supported by the research of Abrams, Pedulla,
and Madaus (2003) when they examined teachers’ attitudes and opinions about state-
mandated testing programs. The 28 states included in the study were classified as either
high- or low-stakes based on their testing policies. Of the 12,000 teachers who were
mailed surveys, over 4,000 responded. The researchers found striking differences in the
responses of teachers in the two types of settings. For example, 44% of teachers in high-
stakes states compared to 10% of teachers in low-stakes states said they spent more than
30 hours per year preparing students for the state test. Similarly, 41% of teachers in high-
stakes states strongly agreed that the pressure of testing has left them with little time to
teach anything not on the test compared to only 18% of teachers in low-stakes states.
Over half of all teachers surveyed stated that if they teach to the state objectives and
curriculum guide, students will be successful on the state test.
Teacher Efficacy and Respect
Research on teacher efficacy has also been conducted. In general, studies have
shown that job dissatisfaction is related to feelings of diminished efficacy and respect.
Rudd and Wiseman (1962) surveyed 590 teachers in England to determine their main
sources of professional dissatisfaction. Rudd and Wiseman found feelings of inadequacy
as a teacher were among the most frequent responses. In the Archbald and Porter (1994)
study of curriculum control and job satisfaction, no significant differences in self-efficacy
were found between teachers in the high- and low-control settings. Conley et al. (1989)
33
looked at efficacy by considering the impact of interactions with supervisors on job
dissatisfaction. They found a strong correlation between lack of positive feedback from
supervisors and job dissatisfaction at both the elementary and secondary level. The
correlation between negative feedback and job dissatisfaction was not as strong and
lacked statistical significance at the elementary level. Research by Abrams, Pedulla, and
Madaus (2003) also considered feedback from supervisors. In that study, roughly half of
all teachers strongly agreed that they felt pressure by the district superintendent to raise
state test scores. However, at the building level, the pressure from principals to raise
scores was more pervasive in high-stakes areas (41% vs. 17%).
Professional Interaction
There is little research to support the claim that professional interaction can
reduce stress. In fact, Conley et al. (1989) found no correlation between peer contact and
job satisfaction and Sutton (1984) found no correlation between peer support and job
satisfaction. However, isolation is often brought up by teachers as a contributing factor in
job stress.
Role Overload
The research on role overload supports what we often hear teachers say, “There’s
too much to do and too little time.” Research by Conley et al. (1989) looked at class size,
student learning problems, and student behavior problems. At the elementary level, job
dissatisfaction was correlated with unmanageable class sizes, an abundance of student
learning problems, and an abundance of student behavior problems. The same was true of
secondary teachers except there was no correlation regarding class sizes. Schwab,
Jackson, and Schuler (1986) found that teachers in their study experienced feelings of
34
emotional exhaustion every week and became detached from their students several times
a year. In a study conducted in 1990, Campbell and Neill kept a time record of 95
teachers for 14 consecutive days. The participants reported lack of time, large classes,
and poor resources as obstacles to implementing the national curriculum. Over half the
teachers worked more than 50 hours a week and ten teachers reported working over 60
hours a week. These are just some of the reasons why teachers feel overloaded.
Mathematics Education in Maryland – A Brief History
For the past 30 years, Maryland has been involved in a variety of efforts to reform
education in public schools (Maryland State Department of Education, 1996). These
statewide efforts were embedded in reform movements taking place on a national level.
Education Reform at the National Level
In 1965, President Johnson signed the Elementary and Secondary Education Act
(ESEA). This act was significant because it authorized a large amount of funding and it
signaled the beginning of federal involvement in local educational policies (Anderson,
2005). Notable aspects of ESEA included: Title I, which provided additional educational
resources to schools with a high concentration of low-income students; Head Start, a pre-
school program aimed at helping disadvantaged students prepare for first-grade; and the
Eisenhower Professional Development Program, an effort to improve the teaching and
learning of students by expanding the knowledge and skills of teachers. While the
original ESEA was funded through 1970, numerous presidents have reauthorized
modified versions of the act.
In the 1980s, the publication of A Nation at Risk (The National Commission on
Excellence in Education, 1984) brought renewed attention to the issue of education
35
reform. As a result, President George H.W. Bush convened the first Governor’s
Education Summit in 1989 by inviting all state governors to discuss possible solutions to
the problems they saw in education (U.S. Department of Education, 1994). At the summit,
participants established six national education goals to attain within ten years. For
example, by the year 2000 “American students will leave grades four, eight, and twelve
having demonstrated competency in challenging subject matter, including English,
mathematics, science, foreign languages, civics and government, economics, art, history,
and geography” and “U.S. students will be first in the world in science and mathematics
achievement.” These education goals formed the basis of President Bush’s proposed
America 2000: Excellence in Education Act. This act called for the creation of content
standards in math, science, English, history, and geography and voluntary national tests
in these subject areas for grades 4, 8, and 12 (Vinovskis, 2005). Without sufficient
legislative support, America 2000 was never approved.
As Governor of Arkansas, Bill Clinton had attended the Education Summit in
1989 and was a proponent of standards-based reforms. After being elected President, he
submitted to Congress an education reform package called Goals 2000 that was very
similar to Bush’s America 2000. The main premise of Goals 2000 was to raise academic
expectations for students, thereby increasing student achievement (Goals 2000: Educate
America Act, 1994). Part of Goals 2000 was to develop and establish voluntary national
standards in all content areas similar to the Curriculum and Evaluation Standards
(National Council of Teachers of Mathematics, 1989) for mathematics. In 1994, Congress
approved Goals 2000 as well as President Clinton’s reauthorization of ESEA which he
named the Improving America’s Schools Act (IASA). The IASA was a significant

36
amendment from previous reauthorizations because it linked student achievement as
measured by state content standards to federal funding access (Improving America's
Schools Act of 1994, 1994). These education reforms put increasing pressure on states
and local school systems.
Another reauthorization of the ESEA was enacted in 2002 when President Bush
signed the No Child Left Behind Act (NCLB). One of the key features of NCLB is the
strong emphasis on accountability (U.S. Department of Education, 2004). States are
required to test students in mathematics in grades three through eight and high school
annually. Adequate yearly progress (AYP) for individual schools is measured based on
attainment of proficiency goals set by each state. Failure to make AYP can result in
corrective action, restructuring, or even state takeover.
Education Reform in Maryland
The changes occurring on the national level were mirrored at the state level. In the
1970s, there was growing concern at both the local and national levels that high school
graduates were unable to function as productive citizens. To improve the quality of
education, attention was placed on basic skills and minimal competencies. In Maryland,
the result was the creation of functional tests in reading, writing, mathematics, and
citizenship. For mathematics, the functional test was un-timed and consisted of multiple
choice questions covering grade-school content. By 1989, passing all four functional tests
became a requirement for high school graduation.
In the late 1980s, state policy-makers argued that advances in technology had
substantially changed the job skills needed in the workforce. Instead of needing just
minimal competence, the perception was that workers needed analytical and problem-
37
solving skills to handle the increased demands they faced on the job. To address the
changing needs of the workforce, the focus of educational reform in Maryland shifted
from basic skills to an emphasis on higher-level, performance-based education and
assessment (Maryland State Department of Education, 1996). At the same time, the issue
of holding districts and schools accountable for student learning grew increasingly
important.
In 1990, the State Board of Education took the first step towards these goals by
adopting the Maryland Learning Outcomes for grades 3, 5, 8, and 11 in reading,
mathematics, writing/language arts, science, and social studies (Maryland State
Department of Education, 1996). A year later, pilot testing began for the Maryland
School Performance Assessment Program (MSPAP) in grades 3, 5, and 8. The MSPAP, a
criterion-referenced test based on the Learning Outcomes, assessed the application of
skills in authentic contexts, higher-order thinking, and the integration of knowledge
across disciplines. During nine hours of testing time, students worked both individually
and in groups to respond to open-ended and short answer questions. Touted as one of the
most rigorous assessments in the country, the more challenging questions of the MSPAP
were a dramatic departure from previous assessments.
The changes in assessment had a significant impact in schools across the state.
Teachers were under increased pressure to prepare students for the new test. It is likely
that some teachers resorted to switching out of tested grade levels (Sutton, 1984). In that
case, it is often brand new teachers who are relegated to teaching in the tested grade
levels. It is important to note that the design of the MSPAP was intentional. State
officials wanted to alter instructional methods to reflect what they believed good

38
classroom instruction should be (Maryland State Department of Education, 1996).
Knowing that teachers teach to the test, the MSPAP was created to model the desired
pedagogy and content. After being piloted for several years, the State Board outlined
accountability standards for the MSPAP and ramifications for underperforming schools.
Schools which failed to make progress towards the standards were subject to state
intervention or reconstitution. Districts and schools also faced growing public scrutiny as
MSPAP scores were highly publicized by the media.
During the 1990s, significant changes were also underway at the high school level.
Core Learning Goals in English, mathematics, science, and social studies were adopted
by the State Board in 1996 (Maryland State Department of Education, 2003b). The Core
Learning Goals for mathematics outlined the desired skills and knowledge for high
school graduates and were strongly influenced by the NCTM Curriculum and Evaluation
Standards (National Council of Teachers of Mathematics, 1989). Work also began at that
time on the development of end-of-course tests which reflected the Core Learning Goals.
In mathematics, High School Assessments (HSAs) were developed in Algebra/Data
Analysis and in Geometry. Those tests consist of both selected- and constructed-response
items and are administered in three-and-one-half hour sessions.
Stakes for the HSA were phased in gradually (Maryland State Department of
Education, 2003a). In 1998, the State Board made the HSA a requirement for students
graduating in the class of 2005. Then in 2000, the Board delayed linking the HSA to high
school diplomas until the class of 2007. The first field test of the HSA was conducted in
2000 with no scores reported. The following year, field test scores were reported on
transcripts of ninth-graders as a percentile rank. That same year, the State Board made it
39
mandatory for all students enrolled in an HSA course to take the HSA. When the HSA
was implemented in 2002, percentile rank scores were reported on transcripts for ninth-
and tenth-graders. A year later, the State Board established passing scores for the HSA.
That year, mean scores were reported for schools, districts, and the state and pass/fail
results were reported for students. Also, HSA scores were printed on transcripts for ninth-,
tenth-, and eleventh-graders. In June 2004, the Board again delayed the use of the HSA as
a graduation requirement until the class of 2009.
In Maryland, NCLB has altered both testing and curriculum. The MSPAP,
designed to assess schools, not students, did not meet the requirements of NCLB and
therefore was discontinued after 2002. Instead, the state now uses the Maryland School
Assessment (MSA) in grades three through eight. Students are tested in mathematics for
90 minutes each day for two days and the test consists of selected- and constructed-
response items. At the high school level, the Algebra/Data Analysis HSA is used to
measure AYP. Maryland no longer requires students to pass the Maryland Functional
Mathematics Test to graduate from high school although some districts continue to use
the test for placement purposes in middle and high school. In 2004, the State Board
enacted graduation requirements for the class of 2009 which included a passing score on
the Algebra/Data Analysis HSA. The same year, the Board approved a Voluntary State
Curriculum (VSC) for mathematics in grades K-8 and for Algebra/Data Analysis and
Geometry. School districts can either adopt the VSC or ensure that the VSC is included in
the district curriculum.
Over the past forty years, education initiatives at both the state and national level
have had an impact on the job of math teachers. The standardization of curricula

40
diminished teachers’ ability to decide what content to teach and how to teach that content.
Each implementation of a new assessment required teacher training regarding test
material and question formats. The higher stakes associated with the assessments meant
increased time and effort on preparing students for the test. At the same time, each
initiative seemed to indicate that schools were failing. In light of this context, it is
worthwhile to investigate the effect these pressures may have on math teachers.
Summary
The study of working conditions of mathematics teachers is guided by prior work
on stress, burnout, and organizations. While a body of research exists regarding sources
of stress, the current state of education in the United States and Maryland suggests that a
reexamination of the challenges teachers face is warranted.
41
CHAPTER 3: METHODOLOGY
Introduction
The purpose of this study was to describe the working conditions of mathematics
teachers in order to identify and understand the critical challenges and problematic
tensions that arise in the course of fulfilling their responsibilities. The study used mainly
quantitative methods to survey teachers’ views of the systemic and external constraints
that shape their curriculum goals, instructional methods, and assessment techniques and
the tensions caused by conflict between their individual professional judgments and
institutional policy recommendations or mandates.
Data from a questionnaire survey of Maryland mathematics teachers provided a
broad view of teacher perceptions about working conditions for mathematics instruction.
Subsequent interviews with a selected sample of teachers illuminated some of the stories
behind survey responses.
The basic plan of the study had six phases:
1. Create an online survey instrument to probe teacher perceptions of five key
sources of workplace tension.
2. Administer the survey to a sample of mathematics teachers to collect data on
perceived working conditions.
3. Analyze the survey data.
4. Interview selected survey participants to expand on and clarify responses from the
survey.
5. Analyze the interview data in light of the results from the survey data.
6. Summarize descriptive insights gained from the data sources.
42
What follows in this chapter is a description of the sample, instrumentation, data
collection, and data analysis procedures for this study. To support the selection of the
sample, information about the setting is provided. This information details the
demographics of Maryland schools, students, and teachers.
Setting
Maryland is comprised of 24 school districts which range in enrollment from just
over 2,000 students to almost 140,000 students (Maryland State Department of Education,
2004a). Public school enrollment across the state has grown from 698,806 students in
1989 to 865,561 students in 2004. Statewide, approximately 50% of the students are
White, 38% African American, 7% Hispanic, 5% Asian/Pacific Islander, and less than
1% American Indian/Alaskan Native. Nationally, public school enrollment is 60% White,
17% African American, 18% Hispanic, 4% Asian/Pacific Islander, and 1% American
Indian/Alaskan Native (U.S. Department of Education, National Center for Education
Statistics, 2005). Of the public schools in Maryland, there are roughly 800 elementary
schools, 200 middle schools, and 200 high schools.
There are 54,583 public school teachers in Maryland, with a range of educational
background, certification, and experience that is similar to that of the United States as a
whole (U.S. Department of Education, National Center for Education Statistics, 2005).
Almost half of Maryland teachers hold a Master’s degree, slightly higher than the
national figure of 42%. According to data from the 1999-2000 Schools and Staffing
Survey (SASS), 68% of Maryland mathematics teachers in grades 7 to 12 have an
undergraduate or graduate degree in mathematics or mathematics education (Council of
Chief State School Officers, 2003). The national statistic is similar at 67%. In terms of
43
certification, 88% of Maryland mathematics teachers at the secondary level are certified
to teach mathematics. Across the United States, this figure ranges from 65% to 100%
with a national average of 88%. Of the mathematics teachers in Maryland, 64% have both
a teaching certificate in mathematics and a degree in mathematics or mathematics
education, compared to 63% nationally. The SASS reported that 14% of Maryland
teachers had less than 3 years teaching experience, 31% had 3 to 9 years, 25% had 10 to
20 years, and 30% had over 20 years (U.S. Department of Education, National Center for
Education Statistics, 2005). These figures are comparable to the nationwide statistics of
13%, 29%, 28%, and 30%, respectively.
The characteristics of Maryland’s school districts, students, and teachers make the
state a desirable study site. The 24 districts span areas that are urban, suburban, and rural.
The school districts range in size from quite small (2,500 students and 175 teachers) to
quite large (139,000 students and 9,300 teachers). Overall, the state is mid-size in terms
of the number of students and teachers and the student population is fairly diverse. While
certification rates and experience levels in Maryland are on par with teachers in the
United States as a whole, Maryland teachers have slightly more education. The attributes
of Maryland suggest that an investigation of teachers in the state can help shed light on
issues affecting teachers across the country.
Sample
In order to get a clear picture of working conditions of Maryland mathematics
teachers, it was desirable to study teachers in a variety of school districts (small, medium,
and large districts; urban, suburban, and rural settings). However, given that the focus of
this study was on teaching tensions, school districts may have been reluctant to
44
participate due to the possibility that the results of the study could be construed as
negative publicity. To achieve the desired breadth and depth for this study without risk of
stigmatizing any individual school district, my sample consisted mostly of members of
the Maryland Council of Teachers of Mathematics (MCTM), the local affiliate of the
National Council of Teachers of Mathematics (NCTM).
The MCTM membership represents teachers who are interested in improving
education. These teachers are more likely to subscribe to educational journals, attend
educational conferences, and reflect upon their own teaching and issues surrounding
tensions that exist in schools today. As members of a professional organization, these
teachers may be more willing to participate in research that can help advance the
profession. Although their membership in MCTM may exaggerate the findings, the
qualities that make these teachers desirable for this study – their involvement and
dedication to education – are the same qualities that make them vital to the profession.
Therefore, it is important to examine the tensions these teachers face so that we can
identify possible remedies and keep these valuable teachers in the classroom.
Currently, there are approximately 500 members of MCTM. Roughly one-third
are elementary school teachers, one-third are middle school teachers, and one-third are
high school teachers. Study participants were solicited in two ways. First, I distributed
flyers in the exhibit hall of the MCTM annual conference held on October 20, 2006.
Second, MCTM sent an e-mail on October 31, 2006 to the membership asking for their
participation in the study. While the MCTM membership was the target population, non-
member mathematics teachers were not restricted from participating. The flyer and e-mail
may have been shared by MCTM members with other mathematics teachers or non-
45
MCTM members may have attended the MCTM annual conference and picked up a flyer.
Interviewees were selected from the pool of participants who completed the online survey
instrument and indicated interest in being interviewed.
Survey Instrument Development
One way to describe the tensions teachers experience in the workplace is to use a
survey instrument consisting of a broad array of statements and a Likert scale. To create
such an instrument, I adapted items from existing surveys and supplemented them with
new items based on my own teaching experiences and the teaching experiences of my
peers. The statements were all linked to one or more of the tension strands (goal
congruence, agency, teacher efficacy and respect, professional interaction, and load
appropriateness). I alternated between positively- and negatively-worded statements and
then randomized the order of the statements to mask my intent.
In the fall of 2005, I piloted an initial draft of the survey instrument with a group
of four colleagues, all former teachers. From the pilot, I was able to determine how much
time was needed to complete the survey, which statements were ambiguous and
confusing, and if there were tensions not addressed by the statements. Besides these
issues, the participants pointed out that they were tripped up by the random order of the
statements. For the items that were worded similarly but not placed in close proximity,
the participants felt they were rating the same statement twice. The random order also
slowed them down because the statements jumped from topic to topic. As a result of this
feedback, I rearranged the statements and grouped them by context. The first set of
statements revolved around the state, the next set centered on the district, then the school,
and finally the classroom.
46
After modifying the instrument, I shared the new version with the same group of
colleagues. The arrangement of global to local context appealed to the group and seemed
to resolve the issue they had raised. I also shared information about the online survey tool
I had decided to use. During the discussion, it was suggested that the length of the
instrument might seem daunting to teachers and that the presentation of statements was a
factor to consider, particularly for a survey given online. I agreed with these comments
and made formatting changes to limit each page to roughly ten statements.
For the third version of the survey instrument, the group focused on the choices
for each statement. Originally, the choices were ‘Strongly Disagree’, ‘Disagree’,
‘Neutral’, ‘Agree’, and ‘Strongly Agree.’ On the second version, I had also included ‘Not
Applicable because _____’ as a choice for those statements that might not apply to all
teachers. Since my study was investigating teacher perceptions, it was recommended that
I remove the ‘Neutral’ category and force participants to agree or disagree with the
statements. This would also result in more insightful findings. The group also felt that the
‘Not Applicable’ category was unnecessary and would detract from the research by
reducing the number of participants sampled for those statements.
I made modifications and created the fourth version of the instrument. As I looked
over the instrument, I realized that some of my original tension strands were more
represented than others in the statements. I went through the document and labeled each
statement with the appropriate strand(s). I found that I had an overabundance of
statements for Agency and for Teacher Efficacy and Respect. I began to think about
which items to remove. At the same time, I continued to work on formatting the
47
document to make it easier to read. I decided to use bold font or italics to highlight key
words that would distinguish one statement from the next.
I then piloted this revised survey to a different colleague who was teaching at a
middle school. The teacher found the positively- and negatively-worded statements
confusing. He was not sure if what he had selected was in fact what he meant because the
differences between statements seemed subtle. I took this feedback back to the group for
advice. I was concerned that the results might be skewed if I worded all of the statements
in one direction. However, the group pointed out that if I kept the mixed statements and
teachers were not sure what they selected, the results would not be accurate. After some
debate, the consensus was to format similar statements using a parallel structure and to
orient them generally in the same direction. As a result, while many of the statements are
positively-worded, there are some negatively-worded statements scattered throughout the
survey.
The length of the survey continued to be an issue. Many statements were similar
but specific to context (state, district, or school). This was done originally to get detailed
information about sources of tension. However, it could be argued that the benefits of
additional detail did not offset the costs of teacher time and frustration. I also felt that if
necessary, the follow-up interviews could be used to get more information. The final
version of the survey combines statements about the state and district and about the
district and school where appropriate.
Survey Instrument
The survey instrument consisted of two parts. The first part elicited background
information on the participant and the second part was a 77-item questionnaire. For the
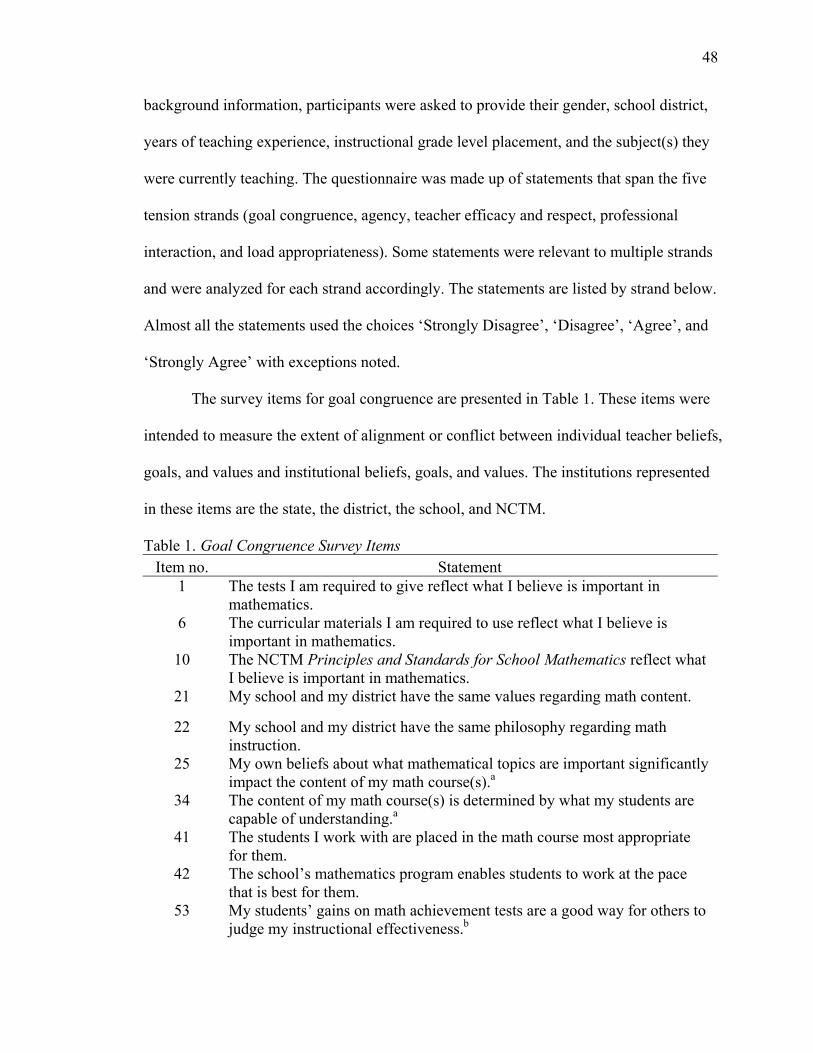
48
background information, participants were asked to provide their gender, school district,
years of teaching experience, instructional grade level placement, and the subject(s) they
were currently teaching. The questionnaire was made up of statements that span the five
tension strands (goal congruence, agency, teacher efficacy and respect, professional
interaction, and load appropriateness). Some statements were relevant to multiple strands
and were analyzed for each strand accordingly. The statements are listed by strand below.
Almost all the statements used the choices ‘Strongly Disagree’, ‘Disagree’, ‘Agree’, and
‘Strongly Agree’ with exceptions noted.
The survey items for goal congruence are presented in Table 1. These items were
intended to measure the extent of alignment or conflict between individual teacher beliefs,
goals, and values and institutional beliefs, goals, and values. The institutions represented
in these items are the state, the district, the school, and NCTM.
Table 1. Goal Congruence Survey Items Item no. Statement
1 The tests I am required to give reflect what I believe is important in mathematics.
6 The curricular materials I am required to use reflect what I believe is important in mathematics.
10 The NCTM Principles and Standards for School Mathematics reflect what I believe is important in mathematics.
21 My school and my district have the same values regarding math content.
22 My school and my district have the same philosophy regarding math instruction.
25 My own beliefs about what mathematical topics are important significantly impact the content of my math course(s).a
34 The content of my math course(s) is determined by what my students are capable of understanding.a
41 The students I work with are placed in the math course most appropriate for them.
42 The school’s mathematics program enables students to work at the pace that is best for them.
53 My students’ gains on math achievement tests are a good way for others to judge my instructional effectiveness.b
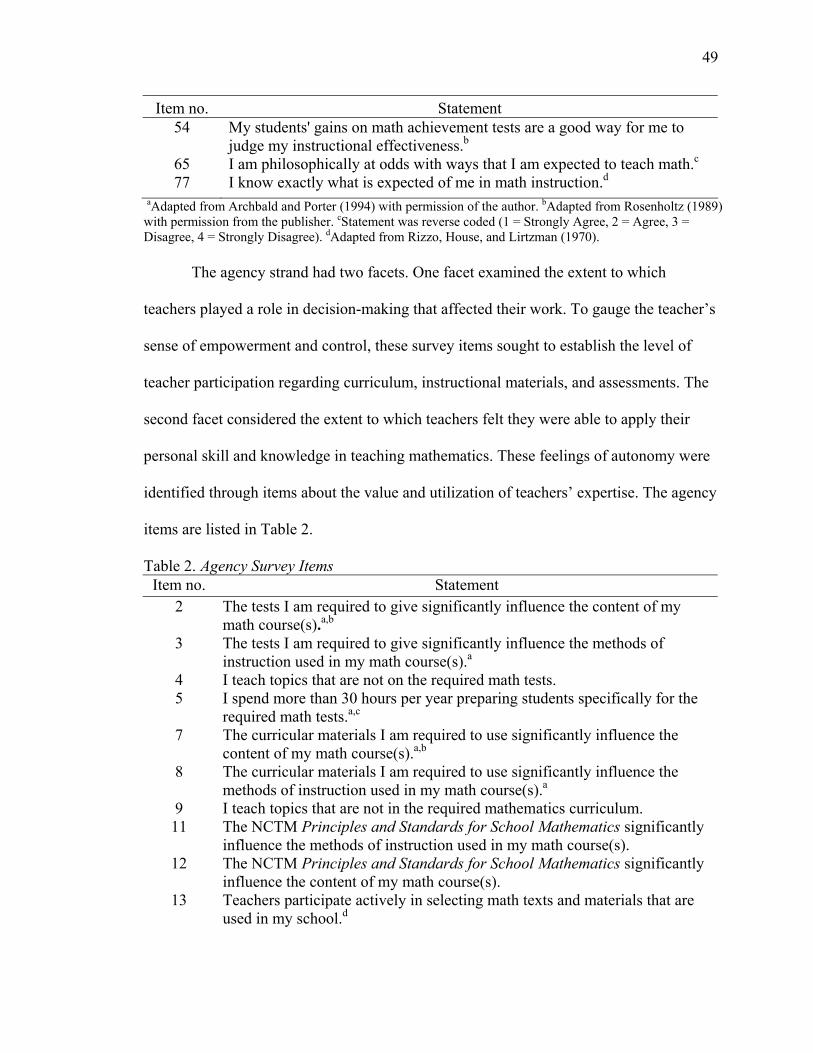
49
Item no. Statement 54 My students' gains on math achievement tests are a good way for me to
judge my instructional effectiveness.b 65 I am philosophically at odds with ways that I am expected to teach math.c
77 I know exactly what is expected of me in math instruction.d aAdapted from Archbald and Porter (1994) with permission of the author. bAdapted from Rosenholtz (1989) with permission from the publisher. cStatement was reverse coded (1 = Strongly Agree, 2 = Agree, 3 = Disagree, 4 = Strongly Disagree). dAdapted from Rizzo, House, and Lirtzman (1970).
The agency strand had two facets. One facet examined the extent to which
teachers played a role in decision-making that affected their work. To gauge the teacher’s
sense of empowerment and control, these survey items sought to establish the level of
teacher participation regarding curriculum, instructional materials, and assessments. The
second facet considered the extent to which teachers felt they were able to apply their
personal skill and knowledge in teaching mathematics. These feelings of autonomy were
identified through items about the value and utilization of teachers’ expertise. The agency
items are listed in Table 2.
Table 2. Agency Survey Items Item no. Statement
2 The tests I am required to give significantly influence the content of my math course(s).a,b
3 The tests I am required to give significantly influence the methods of instruction used in my math course(s).a
4 I teach topics that are not on the required math tests. 5 I spend more than 30 hours per year preparing students specifically for the
required math tests.a,c 7 The curricular materials I am required to use significantly influence the
content of my math course(s).a,b 8 The curricular materials I am required to use significantly influence the
methods of instruction used in my math course(s).a
9 I teach topics that are not in the required mathematics curriculum. 11 The NCTM Principles and Standards for School Mathematics significantly
influence the methods of instruction used in my math course(s). 12 The NCTM Principles and Standards for School Mathematics significantly
influence the content of my math course(s). 13 Teachers participate actively in selecting math texts and materials that are
used in my school.d

50
Item no. Statement 14 Teachers participate actively in making decisions about what will be taught
in math courses. 15 Teachers participate actively in determining what mathematical topics will
be tested. 16 Teachers participate actively in determining appropriate instructional
methods for mathematics.d 17 Uniformity and standardization of instructional methods is important in my
district.a
18 Uniformity and standardization of mathematical content is important in my district.a
24 At my school, I am allowed to teach math in my own style.d 25 My own beliefs about what mathematical topics are important significantly
impact the content of my math course(s).b 26 My own knowledge of mathematical topics significantly impacts the
content of my math course(s).b 27 I can decide which particular topics are taught in my math course(s). 28 I am encouraged to modify the mathematics curriculum to meet my own
students’ needs.d 29 I can decide when particular topics are taught in my math course(s). 30 I have control over setting standards for achievement in my math classes.b
31 The main course textbook significantly influences the methods of instruction used in my math course(s).a
32 The main course textbook significantly influences the content of my math course(s).a,b
33 The content of my math course(s) is determined by what my students need for future study and work.b
40 I feel pressure from parents regarding the math placement of their child.a
47 If I spend the majority of my time helping students develop proficiency in math skills and procedures, then the students will perform well on accountability tests.a
65 I am philosophically at odds with ways that I am expected to teach math.a
73 I often feel frustrated by uncontrollable factors of my job.a
aStatement was reverse coded (1 = Strongly Agree, 2 = Agree, 3 = Disagree, 4 = Strongly Disagree).bAdapted from Archbald and Porter (1994) with permission from the author. cAdapted from Abrams, Pedulla, and Madaus (2003). dAdapted from Rosenholtz (1989) with permission from the publisher. .
The teacher efficacy and respect strand had two components. One component
looked at the extent to which teachers felt they had the power to produce positive results
for students. The second component considered the extent to which others viewed them

51
as competent professionals. These other groups included students, parents, colleagues,
and administrators. The items for this strand are presented in Table 3.
Table 3. Teacher Efficacy and Respect Survey Items Item no. Statement
13 Teachers participate actively in selecting math texts and materials that are used in my school.a
14 Teachers participate actively in making decisions about what will be taught in math courses.
15 Teachers participate actively in determining what mathematical topics will be tested.
16 Teachers participate actively in determining appropriate instructional methods for mathematics.a
17 Uniformity and standardization of instructional methods is important in my district.b
18 Uniformity and standardization of mathematical content is important in my district.b
19 I feel pressure from my district superintendent to raise scores on required math tests.b,c
20 I feel pressure from my principal to raise scores on required math tests.b,c 23 At my school, teachers maintain high standards of performance for
themselves in teaching mathematics.d 24 At my school, I am allowed to teach math in my own style.a 25 My own beliefs about what mathematical topics are important significantly
impacts the content of my math course(s).d 26 My own knowledge of mathematical topics significantly impacts the
content of my math course(s).d 27 I can decide which particular topics are taught in my math course(s). 28 I am encouraged to modify the mathematics curriculum to meet my own
students’ needs.a 29 I can decide when particular topics are taught in my math course(s). 30 I have control over setting standards for achievement in my math classes.d
35 The curriculum for my math course(s) is too difficult for my students.b
36 The curriculum for my math course(s) is not challenging my students.b
37 Uniformity and standardization of mathematics curriculum is important to the parents at my school.b
38 Uniformity and standardization of instructional methods in math is important to the parents at my school.b
39 Most of my students’ parents support the things I do in teaching math.a 40 I feel pressure from parents regarding the math placement of their child.b
41 The students I work with are placed in the math course most appropriate for them.
45 I often feel satisfied with my job in teaching mathematics.
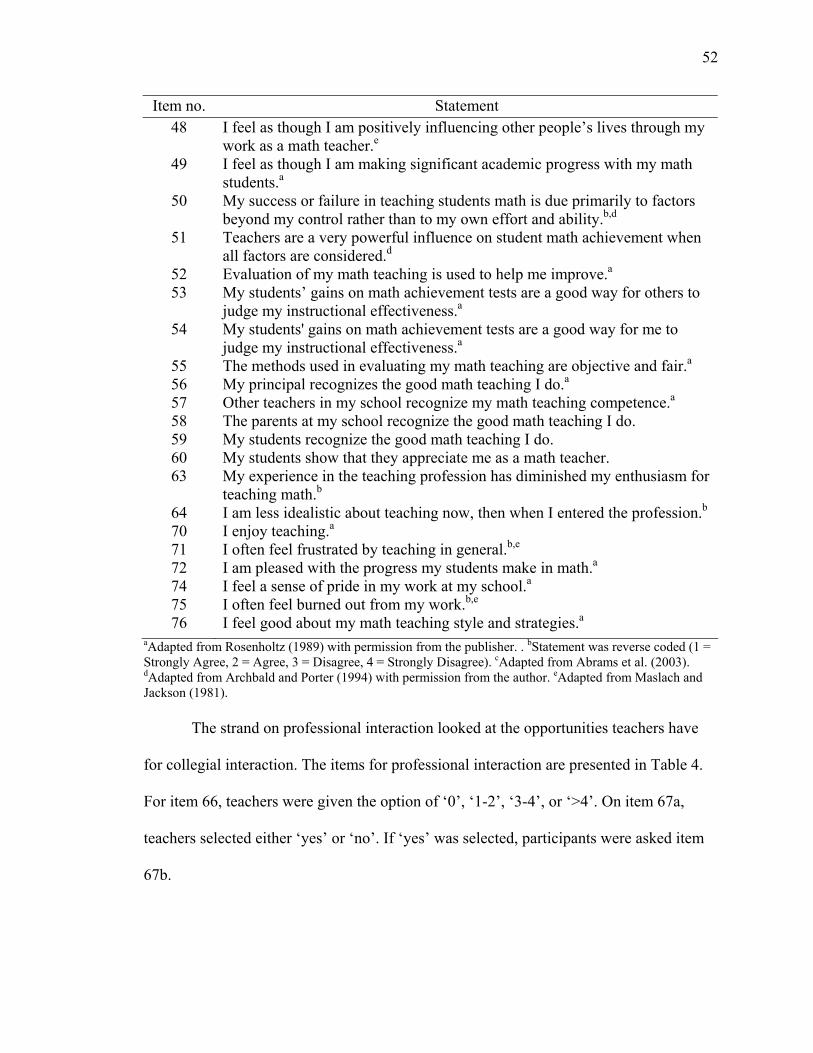
52
Item no. Statement 48 I feel as though I am positively influencing other people’s lives through my
work as a math teacher.e 49 I feel as though I am making significant academic progress with my math
students.a 50 My success or failure in teaching students math is due primarily to factors
beyond my control rather than to my own effort and ability.b,d 51 Teachers are a very powerful influence on student math achievement when
all factors are considered.d 52 Evaluation of my math teaching is used to help me improve.a 53 My students’ gains on math achievement tests are a good way for others to
judge my instructional effectiveness.a 54 My students' gains on math achievement tests are a good way for me to
judge my instructional effectiveness.a 55 The methods used in evaluating my math teaching are objective and fair.a 56 My principal recognizes the good math teaching I do.a 57 Other teachers in my school recognize my math teaching competence.a 58 The parents at my school recognize the good math teaching I do. 59 My students recognize the good math teaching I do. 60 My students show that they appreciate me as a math teacher. 63 My experience in the teaching profession has diminished my enthusiasm for
teaching math.b
64 I am less idealistic about teaching now, then when I entered the profession.b
70 I enjoy teaching.a 71 I often feel frustrated by teaching in general.b,e 72 I am pleased with the progress my students make in math.a 74 I feel a sense of pride in my work at my school.a 75 I often feel burned out from my work.b,e 76 I feel good about my math teaching style and strategies.a
aAdapted from Rosenholtz (1989) with permission from the publisher. . bStatement was reverse coded (1 = Strongly Agree, 2 = Agree, 3 = Disagree, 4 = Strongly Disagree). cAdapted from Abrams et al. (2003). dAdapted from Archbald and Porter (1994) with permission from the author. eAdapted from Maslach and Jackson (1981).
The strand on professional interaction looked at the opportunities teachers have
for collegial interaction. The items for professional interaction are presented in Table 4.
For item 66, teachers were given the option of ‘0’, ‘1-2’, ‘3-4’, or ‘>4’. On item 67a,
teachers selected either ‘yes’ or ‘no’. If ‘yes’ was selected, participants were asked item
67b.
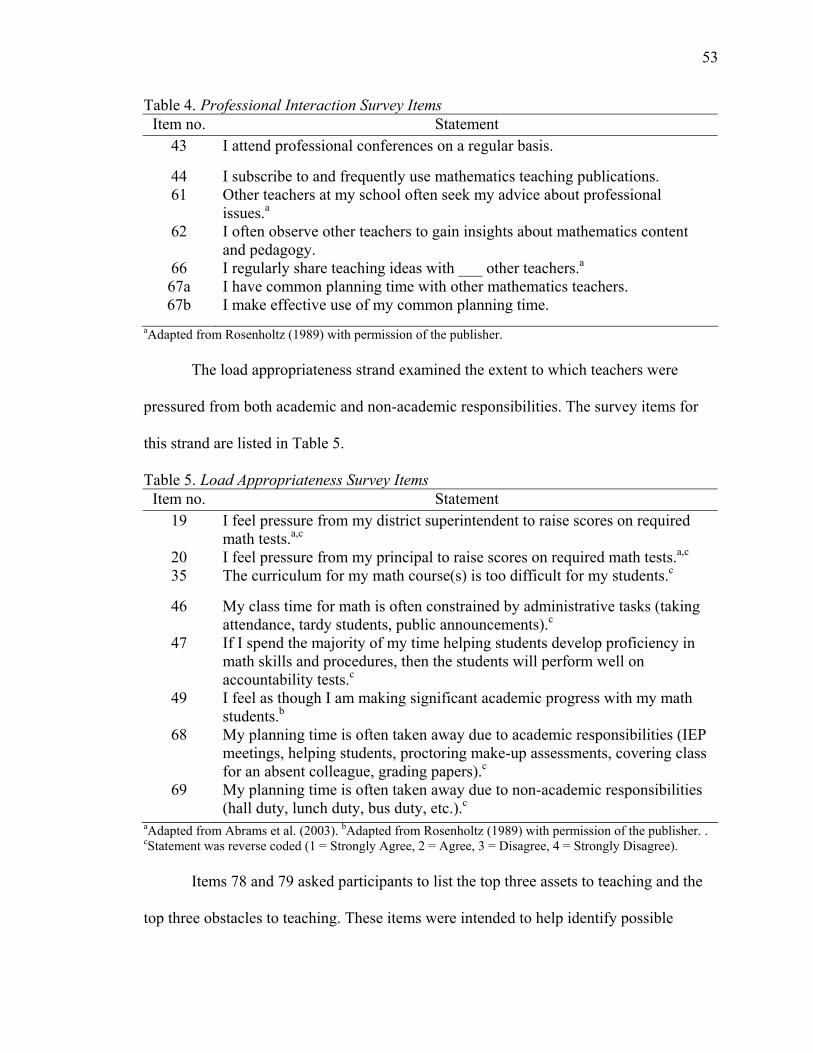
53
Table 4. Professional Interaction Survey Items Item no. Statement
43 I attend professional conferences on a regular basis.
44 I subscribe to and frequently use mathematics teaching publications. 61 Other teachers at my school often seek my advice about professional
issues.a 62 I often observe other teachers to gain insights about mathematics content
and pedagogy. 66 I regularly share teaching ideas with ___ other teachers.a 67a I have common planning time with other mathematics teachers. 67b I make effective use of my common planning time.
aAdapted from Rosenholtz (1989) with permission of the publisher. The load appropriateness strand examined the extent to which teachers were
pressured from both academic and non-academic responsibilities. The survey items for
this strand are listed in Table 5.
Table 5. Load Appropriateness Survey Items Item no. Statement
19 I feel pressure from my district superintendent to raise scores on required math tests.a,c
20 I feel pressure from my principal to raise scores on required math tests.a,c 35 The curriculum for my math course(s) is too difficult for my students.c
46 My class time for math is often constrained by administrative tasks (taking attendance, tardy students, public announcements).c
47 If I spend the majority of my time helping students develop proficiency in math skills and procedures, then the students will perform well on accountability tests.c
49 I feel as though I am making significant academic progress with my math students.b
68 My planning time is often taken away due to academic responsibilities (IEP meetings, helping students, proctoring make-up assessments, covering class for an absent colleague, grading papers).c
69 My planning time is often taken away due to non-academic responsibilities (hall duty, lunch duty, bus duty, etc.).c
aAdapted from Abrams et al. (2003). bAdapted from Rosenholtz (1989) with permission of the publisher. . cStatement was reverse coded (1 = Strongly Agree, 2 = Agree, 3 = Disagree, 4 = Strongly Disagree).
Items 78 and 79 asked participants to list the top three assets to teaching and the
top three obstacles to teaching. These items were intended to help identify possible

54
candidates to interview. On each page of the survey, there was an opportunity for
teachers to elaborate on or clarify any of their earlier responses.
Survey Format
I decided to conduct the survey through a web-based tool for a number of reasons.
Compared to a paper survey, an online survey can be distributed quickly and
administered easily to teachers from a large geographic area. Teachers can access an
online survey at any time of day and from any computer with internet access. Online
surveys are less likely to be lost in transit because they are easy to submit. Once the data
is submitted to a web-based tool, it is immediately accessible and downloadable by the
researcher. The data can be exported directly from the web-based tool to a Microsoft
Excel spreadsheet, thereby avoiding data entry errors. Since the data output is in
spreadsheet form, it is easy to analyze using a statistical program.
There are a few drawbacks to online surveys. Potential participants may be
dissuaded if they are inexperienced web users. Others may choose not to complete the
survey for fear that data transmitted through the web is not secure. Some teachers may
have limited access to computers with internet access or may feel uncomfortable
completing the survey if the computer that is available is in a public location.
Ultimately, I believe that the benefits of online surveys far outweigh the
disadvantages.
Procedures
In the fall of 2005, I submitted a proposal to the MCTM executive board
requesting permission to survey the membership. The proposal was accepted.
The proposal outlined the following plan for data collection:
55
1. MCTM members would be contacted by e-mail requesting their participation in a
survey. To address the board’s concerns about privacy, I would not have access to the
e-mail addresses of MCTM members. Instead, the e-mail to members would be sent
by the MCTM President.
2. The e-mail would include a hyperlink to the survey instrument and a deadline for
completing the survey.
3. As part of the survey, subjects would indicate if they would be willing to participate
in a follow-up interview and if they would like to be sent a copy of the results. In
either case, the subjects would provide their e-mail address. By providing this e-mail
address, the subjects would automatically be entered in a drawing to win a prize.
Initially, I planned for the e-mail to MCTM members to be sent in late September
or early October 2006. However, the MCTM board recommended sending the e-mail
after the annual conference since memberships are established or renewed at that time. I
agreed to this plan and the e-mail was sent on October 31, 2006 (see Appendix A). To
increase survey participation, I also requested permission to staff a table in the exhibit
hall at the annual conference and distribute flyers advertising the survey. The MCTM
board agreed and I distributed 400 flyers during the conference on October 20, 2006 (see
Appendix B).
The survey instrument was maintained by SurveyMonkey
(www.surveymonkey.com), a web-based tool for creating surveys and collecting data.
When participants accessed the SurveyMonkey website using the hyperlink in the e-mail,
they were prompted to complete a consent form (see Appendix C). If they consented to
participate in the research, they were directed to the questionnaire (see Appendix D).

56
Otherwise, they exited the website. The first page of the questionnaire solicited
background information about the participant’s job placement and their teaching
experience. Each subsequent page consisted of approximately ten statements to rate.
Participants were required to rate all the statements shown before moving to the next
page. At the bottom of each page, participants had the opportunity to elaborate on any of
their responses.
The survey was open and available for participants for four weeks from mid-
October to mid-November. Teachers could access the survey from school or home, day
or night. I anticipated that multiple teachers might use the same school computer to
complete the survey and I wanted to allow this to occur. However, allowing multiple
responses from the same computer meant that teachers could not stop part-way through
the survey and come back at a later time with their responses saved. Instead, teachers
would have to start all over again. I believe this restriction did result in the loss of some
data. Of the 323 attempts to access the survey, 71 resulted in premature exits. One teacher
did not consent to participate and 20 teachers consented but did not provide any
identifying information. There were 21 teachers who completed some demographic
information and 29 teachers who completed some of the survey statements. For those
teachers who provided an e-mail address and completed a portion of the survey
statements, I sent an e-mail asking that they take the survey again (see Appendix E).
Two teachers did in fact return and complete the survey.
I used the survey responses to identify five cases to illuminate through individual
interviews. I computed strand scores for each participant by averaging their responses to
items on the hypothesized strands (i.e., goal congruence, agency, teacher efficacy and

57
respect, professional interaction, and load appropriateness). I then calculated the sample
mean for each strand. Finally, I ranked participants based on the square root of the sum of
the squared deviations of their strand scores with the sample means. Teachers with a
small sum of squares were more representative of the sample than teachers with a large
sum of squares. Of the five cases selected, three involved teachers whose survey
responses were representative of the sample and whose teaching experience ranged from
early-career to late-career. The other two cases consisted of an early-career teacher and a
late-career teacher whose survey responses were outliers compared to the rest of the
sample.
Once the cases were identified, I attempted to contact the teachers and arrange the
logistics of the interview. I contacted the selected teachers by e-mail to confirm their
interest in being interviewed (see Appendix F). The late-career outlier case responded
immediately and we agreed to meet at her residence that weekend. Soon afterwards, the
early-career representative case responded. He also wanted to meet that weekend and we
decided to meet at a lounge on the campus of a local university. The early-career outlier
case also responded to my e-mail and we scheduled an interview after school at a local
coffee shop two weeks later. The late-career representative case replied several weeks
later but did express interest in being interviewed. However, subsequent repeated
attempts to contact her and finalize the details of the interview went unanswered. The
mid-career representative case did not respond to the initial e-mail request, possibly
signifying that she was no longer interested in being interviewed.
The purpose of the interview was to understand in detail, how teachers “think and
how they came to develop the perspectives they hold” (Bogdan & Biklen, 1998, p. 3). At
58
the beginning of each interview, participants completed a consent form (see Appendix G).
Each interview lasted approximately 60 minutes and participants were compensated $100
for their time. During the semi-structured interviews (Gall, Borg, & Gall, 1997), I asked
teachers to elaborate or explain selected responses on their survey (see Appendix H for
sample interview protocol). I worked at getting participants to “freely express their
thoughts around particular topics” (Bogdan & Biklen, 1998, p. 3). This approach allowed
“the subjects to answer questions from their own frame of reference” (Bogdan & Biklen,
1998, p. 3). I audio taped and transcribed each interview. The quotes from the interviews
are included in Chapter 5 to provide further insight into some of the working conditions
that math teachers currently face.
Coding of Independent and Dependent Variables
At the conclusion of the survey period, I downloaded the data from
SurveyMonkey into a Microsoft Excel spreadsheet. I separated the data into two files,
one for complete survey responses and one for incomplete survey responses. The
complete responses were further separated into two files, one with item responses and
one with elaborating comments from the participants. I assigned a variable name to each
item and then coded the data for the purpose of analyzing the responses.
Independent Variables
For the demographic items with response choices, SurveyMonkey automatically
assigned codes. For instance, gender was coded ‘1’ for female and ‘2’ for male and
school type was coded ‘1’ for public school and ‘2’ for private school.
I assigned codes to demographic items with participant provided responses, such
as school district name. To ensure participant confidentiality, I grouped districts by size

59
and location and assigned a code to each group. I ranked districts from smallest to largest
by using the Maryland State Department of Education (MSDE) student enrollment data
(2004b). Then, I clustered the districts by size into quartiles. Quartile 1 had 16 districts
with an average enrollment of 11,856 students. Quartile 2 had four districts with an
average enrollment of 50,498 students. Quartiles 3 and 4 each had two districts with
average enrollments of 98,051 and 137,744, respectively. Codes for the school district
size variable were as follows: ‘1’ for quartile 1, ‘2’ for quartile 2, ‘3’ for quartile 3, and
‘4’ for quartile 4.
The districts were also grouped by geographic location according to U.S. Census
categorizations (U.S. Department of Commerce, 2002). The six categories used by the
Census were: Baltimore Region, Suburban Washington, Southern Maryland, Western
Maryland, Upper Eastern Shore, and Lower Eastern Shore. The Baltimore Region
consisted of six counties and Suburban Washington was made up of three counties. The
Southern Maryland districts were three counties bordering the Potomac River and the
Chesapeake Bay. The Western Maryland districts were 3 counties bordering
Pennsylvania and West Virginia. The Upper Eastern Shore and Lower Eastern Shore
classifications were combined for this study and called Eastern Shore. The Eastern Shore
districts were nine counties bordered by the Atlantic Ocean, Delaware, and the
Chesapeake Bay. Codes for the school district location variable were as follows: ‘1’ for
Baltimore region, ‘2’ for suburban Washington, ‘3’ for Southern Maryland, ‘4’ for
Western Maryland, and ‘5’ for Eastern Shore.
Participants also entered information regarding their years of teaching experience.
I created six categories for teaching experience: 0 – 1 year, 2 – 4 years, 5 – 9 years, 10 –
60
19 years, 20 -29 years, and 30+ years. I purposely constructed these delineations to
permit fine-grain analysis such as whether differences exist between first year teachers
and new but not first year teachers. Then, I coded the categories consecutively with ‘1’
for the 0 – 1 year group and ‘6’ for the 30+ group.
For the teaching placement variable, the original categories and codes were
modified as a result of the data collected. Elementary school teachers had been separated
into grades K - 2 and 3 - 5 to capture any differences between grades where high stakes
tests were or were not involved. However, due to the small number of K - 2 teachers who
responded, the two groups were combined for purposes of analysis. The groups were
coded: ‘1’ for grades K - 5, ‘2’ for grades 6 – 8, and ‘3’ for grades 9 – 12.
Dependent Variables
All of the Likert-scale items were automatically coded by SurveyMonkey. On
statements where participants rated their level of agreement, the codes were ‘1’ for
strongly disagree, ‘2’ for disagree, ‘3’ for agree, and ‘4’ for strongly agree. For item 66,
teachers selected the number of teachers they shared teaching with. The codes for the
choices were ‘1’ for zero teachers, ‘2’ for one or two teachers, ‘3’ for three or four
teachers, and ‘4’ for more than four teachers. Item 67 required a yes/no response with yes
coded as ‘1’ and no coded as ‘2’.
Prior to running statistical tests, modifications to the coding system were
necessary for items that did not match the direction of the strands. Strands were defined
such that higher values indicated more alignment with the strand. Thus, any item that
negated the relevant strand was re-coded using the following algorithm: five minus the
original code = the new code. As a result, the codes became 5 – 1 = 4, 5 – 2 = 3, 5 – 3 = 2,

61
and 5 – 4 = 1. To summarize, participants who strongly agree with an item that affirms
the strand or strongly disagree with an item that negates the strand would have their
response coded as a ‘4’. On the other extreme, participants who strongly disagree with an
item that affirms the strand or strongly agrees with an item that negates the strand would
have their response coded as a ‘1.’
A few examples will help clarify this coding scheme. On the goal congruence
items, the more a teacher perceives a match between personal and institutional beliefs,
the higher the score. For example, if a participant strongly agreed with the statement
“The tests I am required to give reflect what I believe is important in mathematics”, a ‘4’
would be recorded. On the other hand, a ‘1’ would be noted if the participant strongly
agreed with the statement “I am philosophically at odds with ways that I am expected to
teach math.” Similarly for the agency items, the more a teacher feels empowered and
autonomous in their position, the higher the score. For instance, strongly agreeing with
the statement “I teach topics that are not on the required math tests” results in a score of
‘4.’
Data Analysis
Descriptive Analyses
I chose to analyze the data with the program Statistical Package for the Social
Sciences (SPSS) Version 15.0 for Windows. I exported the Microsoft Excel data file of
variable names and coded responses into SPSS. I created a profile of the respondents by
tallying frequencies and percentages for each demographic variable (gender, school type,
school district size, school district location, teaching experience, and grade level
placement). From this analysis, I decided to remove the variable ‘school type’ because

62
there were too few cases of private school teachers to conduct any statistical tests. I
generated a distribution of responses for the remaining survey items by computing
frequencies, means, and standard deviations. I supplemented the distribution of responses
with relevant, elaborating comments voluntarily offered by the survey participants.
Although I had not anticipated that many teachers would use the comment boxes, I was
pleasantly surprised with the quantity and quality of the annotations. I believe that the
comments provide a more detailed snapshot of teacher perceptions, so I have included
them in the results.
Analysis using Hypothesized Strands
To test my hypothesized strands of goal congruence, agency, teacher efficacy and
respect, professional interaction, and load appropriateness, I conducted a series of
analyses. First, I evaluated the internal consistency reliability of each strand because
many of the survey items were new and those that had been previously used represented
only selected portions of other surveys. Internal consistency is the likelihood that
participants will respond in a consistent way to all of the questions (e.g., teachers with
low agency in fact score low on all of the agency items). I chose to have SPSS compute
Cronbach’s alpha coefficient as a way to measure internal consistency. This coefficient is
computed by calculating all of the possible split-half reliabilities. For each split-half
reliability, the strand of items is divided in two. Then, scores on each half are correlated.
A high correlation indicates that the two halves are in agreement and that there is good
internal consistency. Cronbach’s alpha can range from a low of 0 (not reliable) to a high
of 1 (completely reliable). Due to the exploratory nature of this study, I used a liberal cut
off of 0.60 for the Cronbach alpha coefficient (Garson, 2006).

63
Then, I created five new variables in the SPSS data file, one for each strand. For
example, I defined the goal congruence variable as the composite score for items in the
goal congruence strand. A participant’s composite score is the mean of their responses for
the items in a strand. Since I reverse coded the negatively worded items, a high
composite score indicates a high level of agreement with the essence of the strand. I used
the composite scores to make histograms to look at trends in the data.
Next, I used one-way ANOVA procedures to compare means between
demographic subgroups to establish if differences in the strand scores existed. For
example, I used ANOVA to determine whether gender of the participant (an independent
variable) seemed to influence the perception of agency as measured by the agency strand
score (a dependent variable). I selected ANOVA rather than t-tests because some of the
independent variables have more than two groups. In order to use t-tests with more than
two groups, multiple t-tests would be necessary and that would inflate the Type I error
rate, the probability that the null hypothesis is rejected when the null hypothesis is true.
ANOVA detects “the systematic treatment variability over and above the noise (random
error variability) in the data” (G. Hancock, personal communication, July 21, 1998).
Before conducting the ANOVA, I verified that all assumptions for the procedure were
met. The assumptions are: (1) the observations are independent of each other; (2) the
scores in populations are normally distributed; and (3) the variances in the populations
are homogeneous (G. Hancock, personal communication, July 23, 1998). If the
assumptions were satisfied for a given strand, I ran an ANOVA using SPSS. The
resulting F ratio reported by SPSS led to a decision about retaining or rejecting the null
hypothesis of equal means.
64
When significant mean differences were detected, further evaluation was needed
to identify exactly where differences existed. In the case of only two groups (such as
male and female), simply looking at the group means could establish the relationship
between the groups (e.g. males have a higher mean than females). With more than two
groups, post hoc multiple comparisons were required to establish precisely which
pairings had statistically significant mean differences. I opted to use the Bonferroni post
hoc procedure because it is robust to unbalanced designs where there are a different
number of participants in each subgroup (Lomax, 1992). To maintain an overall,
experiment-wise alpha level of .05, the Bonferroni procedure conducts each pair-wise
comparison (t-test) at an alpha level of .05 over the number of comparisons. For instance,
there are six pairs of comparisons for four groups (1 vs. 2, 1 vs. 3, 1 vs. 4, 2 vs. 3, 2 vs. 4,
and 3 vs. 4) so the pair-wise alpha would be .05/6 or .0083. To conduct the Bonferroni
procedure in SPSS, the researcher selects an experiment-wise alpha and the program
automatically divides the alpha by the number of comparisons so each pair-wise
comparison is done at the appropriate alpha level. SPSS then adjusts the reported
significance by multiplying by the number of comparisons to make it easier to interpret.
The sign (positive or negative) of the mean difference reported by SPSS indicates the
direction of the relationship between the groups. Thus, if the comparison is group 1 vs.
group 2 and the mean difference is negative, then the mean for group 1 is less than the
mean for group 2.
Factor Analysis
Factor analysis is a set of procedures that can be used to infer “the existence of
underlying ‘latent’ variables as an explanation for the observed relations among

65
measured variables” (G. Hancock, personal communication, September 19, 2002). Latent
variables, such as job satisfaction, are not directly observable. Instead, researchers use
observable measures, such as survey statements which elicit information about job
satisfaction, to make inferences about the latent variables. For the present study, I used
the factor analysis extraction method of principal components analysis (PCA) to
determine how many and what kind of latent factors existed. Ideally, the factors would
represent the five strands derived from the literature (goal congruence, agency, teacher
efficacy and respect, professional interaction, and load appropriateness). Figure 6
illustrates a simple model of PCA. In the diagram, the three measured (observable)
variables are each influenced by a common latent factor and some error. The measured
variables can be used to form a composite factor that is a reflection of what underlies the
data. The composites of interest are those which explain the largest portion of variance in
the original variables.

66
Figure 6. Model of factor analysis using principal component analysis (PCA) as the extraction method (G. Hancock, personal communication, September 19, 2002).
Mathematically, PCA creates orthogonal axes which are linear composites of the
measured variables. The first composite axis is situated such that the perpendicular
distance from the data points to the composite axis is minimized. A graphical example
with two variables is presented in Figure 7. Then the second composite axis is placed so
that it is perpendicular to the first composite axis and the perpendicular distance from the
data points to the second composite axis is minimized. Each subsequent axis is created in
the same manner.
Composite
Factor
Latent Factor
Measured Variable
1
Measured Variable
2
Measured Variable
3
Error Error Error
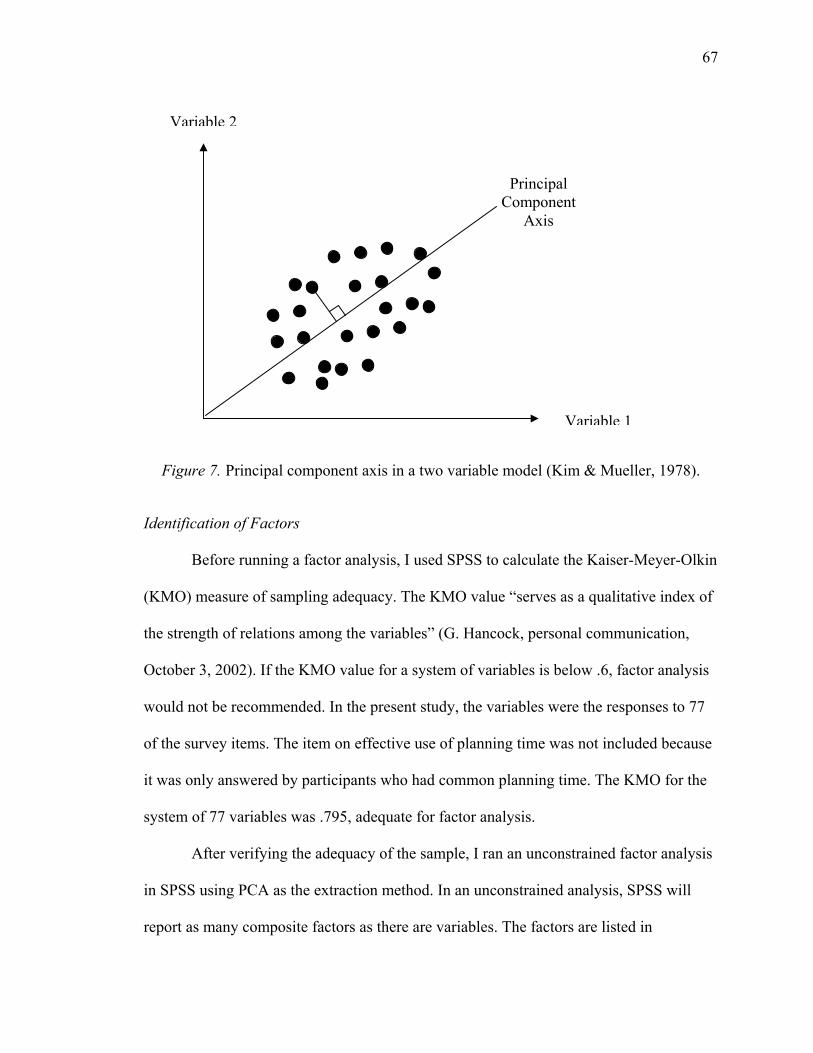
67
Figure 7. Principal component axis in a two variable model (Kim & Mueller, 1978).
Identification of Factors
Before running a factor analysis, I used SPSS to calculate the Kaiser-Meyer-Olkin
(KMO) measure of sampling adequacy. The KMO value “serves as a qualitative index of
the strength of relations among the variables” (G. Hancock, personal communication,
October 3, 2002). If the KMO value for a system of variables is below .6, factor analysis
would not be recommended. In the present study, the variables were the responses to 77
of the survey items. The item on effective use of planning time was not included because
it was only answered by participants who had common planning time. The KMO for the
system of 77 variables was .795, adequate for factor analysis.
After verifying the adequacy of the sample, I ran an unconstrained factor analysis
in SPSS using PCA as the extraction method. In an unconstrained analysis, SPSS will
report as many composite factors as there are variables. The factors are listed in
Variable 1
Variable 2
Principal Component
Axis

68
descending order by the amount of total variance explained. Then I ran Velicer’s
Minimum Average Partial procedure (see Appendix I for program code) to determine
exactly how many factors were salient and therefore worth extracting. Velicer’s
procedure relies on the correlation matrix reported in the initial factor analysis. Based on
the results of Velicer’s procedure, I ran a second factor analysis extracting six factors and
selecting Varimax rotation to make the factors more clear and interpretable. Varimax
rotation is an iterative process that maintains the orthogonal relationship between the
factors while maximizing the variance of squared loadings for each factor. Loadings are
the correlation coefficients between the observed variable and the composite factor. The
Varimax rotation converged in nine iterations and the resulting six factors explained 40%
of the total variance in the 77 variables.
Once factors are identified, the reliability of the factors can be evaluated.
Reliability is based on the strength of the loadings and the sample size. As the number of
variables loading strongly per factor increases, the sample size required decreases (G.
Hancock, personal communication, November 7, 2002). Guadagnoli and Velicer (1988)
created the following criteria for reliability: (1) any factor with at least three loadings
above .80 will be reliable regardless of sample size; (2) factors with four or more
loadings above .60 are reliable regardless of sample size; (3) factors with ten or more low
(.40) loadings are reliable as long as sample size is greater than about 150; and (4) factors
with only a few loadings should not be interpreted unless sample size is at least 300.
Using these criteria, factors 1, 2, and 3 in the present study are considered reliable. A
larger sample size is necessary in order for the remaining three factors to possibly be

69
reliable. For the purposes of this exploratory study, I chose to include all six factors in the
statistical analysis while taking note of the issue of reliability.
Interpretation of Factors
I interpreted the six factors based on the variables whose loadings were the largest
(.50 and above). For the variables with large loadings, I considered the wording of the
original survey item and the coding of the responses when labeling each factor. Table 6
displays the survey statements and loadings used to interpret factor 1. All of the
statements in this group were also part of the teacher efficacy and respect strand.
However, the teacher efficacy and respect strand label seemed too broad for this
collection of statements. Thus, I interpreted factor 1 as “sense of accomplishment”
because the cluster of statements seemed to focus on recognition from others, teaching
effectiveness, and job satisfaction.
Table 6. Survey Statements and Loadings for Factor 1 Statement Loading
My students recognize the good math teaching I do. .739 I feel as though I am positively influencing other people’s lives through my work as a math teacher.
.710
The parents at my school recognize the good math teaching I do. .687 I feel as though I am making significant academic progress with my math students.
.669
I feel a sense of pride in my work at my school. .667 Other teachers in my school recognize my math teaching competence. .664 My students show that they appreciate me as a math teacher. .641 I feel good about my math teaching style and strategies. .627 Most of my students’ parents support the things I do in teaching math. .610 Teachers are a very powerful influence on student math achievement when all factors are considered.
.602
I enjoy teaching. .581 I often feel satisfied with my job in teaching mathematics. .561 I am pleased with the progress my students make in math. .552 Other teachers at my school often seek my advice about professional issues.
.533
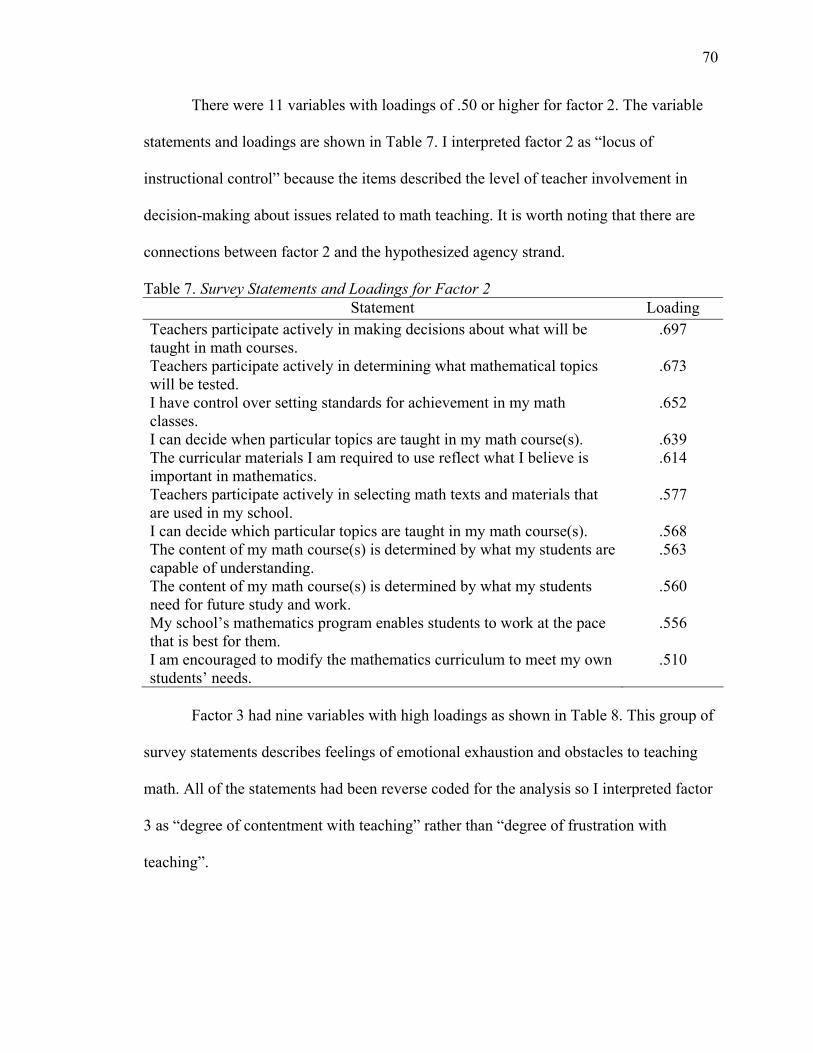
70
There were 11 variables with loadings of .50 or higher for factor 2. The variable
statements and loadings are shown in Table 7. I interpreted factor 2 as “locus of
instructional control” because the items described the level of teacher involvement in
decision-making about issues related to math teaching. It is worth noting that there are
connections between factor 2 and the hypothesized agency strand.
Table 7. Survey Statements and Loadings for Factor 2 Statement Loading
Teachers participate actively in making decisions about what will be taught in math courses.
.697
Teachers participate actively in determining what mathematical topics will be tested.
.673
I have control over setting standards for achievement in my math classes.
.652
I can decide when particular topics are taught in my math course(s). .639 The curricular materials I am required to use reflect what I believe is important in mathematics.
.614
Teachers participate actively in selecting math texts and materials that are used in my school.
.577
I can decide which particular topics are taught in my math course(s). .568 The content of my math course(s) is determined by what my students are capable of understanding.
.563
The content of my math course(s) is determined by what my students need for future study and work.
.560
My school’s mathematics program enables students to work at the pace that is best for them.
.556
I am encouraged to modify the mathematics curriculum to meet my own students’ needs.
.510
Factor 3 had nine variables with high loadings as shown in Table 8. This group of
survey statements describes feelings of emotional exhaustion and obstacles to teaching
math. All of the statements had been reverse coded for the analysis so I interpreted factor
3 as “degree of contentment with teaching” rather than “degree of frustration with
teaching”.
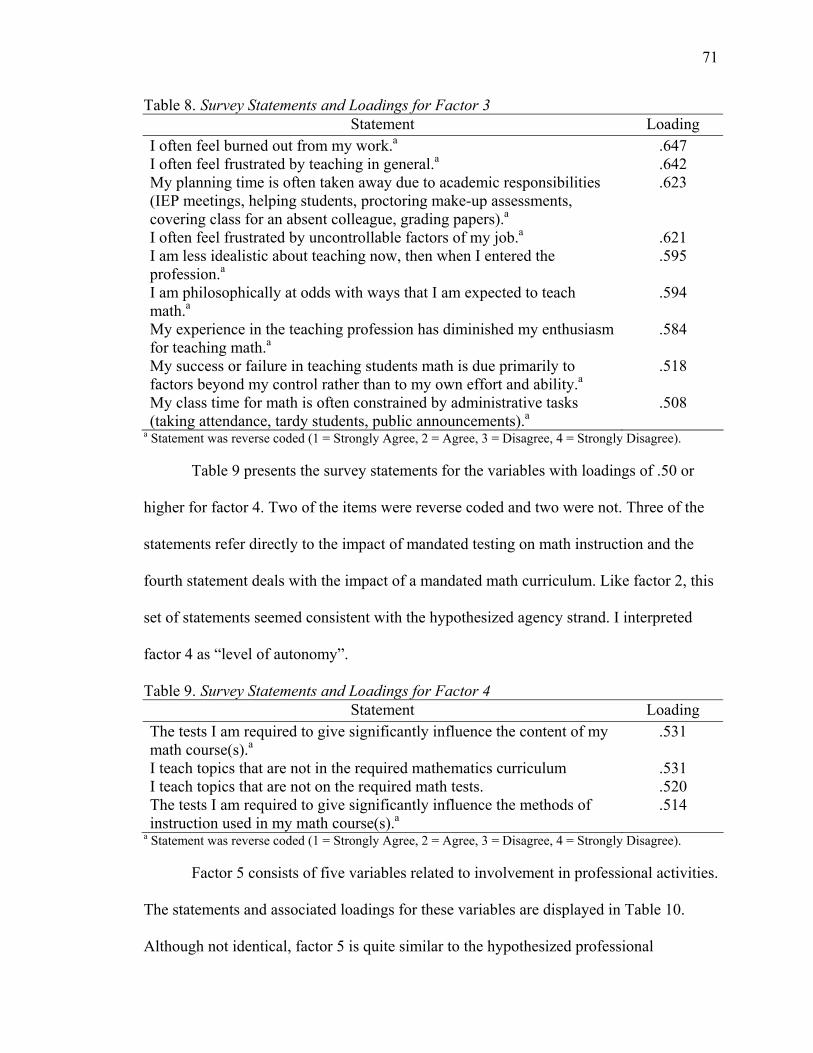
71
Table 8. Survey Statements and Loadings for Factor 3 Statement Loading
I often feel burned out from my work.a .647 I often feel frustrated by teaching in general.a .642 My planning time is often taken away due to academic responsibilities (IEP meetings, helping students, proctoring make-up assessments, covering class for an absent colleague, grading papers).a
.623
I often feel frustrated by uncontrollable factors of my job.a .621 I am less idealistic about teaching now, then when I entered the profession.a
.595
I am philosophically at odds with ways that I am expected to teach math.a
.594
My experience in the teaching profession has diminished my enthusiasm for teaching math.a
.584
My success or failure in teaching students math is due primarily to factors beyond my control rather than to my own effort and ability.a
.518
My class time for math is often constrained by administrative tasks (taking attendance, tardy students, public announcements).a
.508
a Statement was reverse coded (1 = Strongly Agree, 2 = Agree, 3 = Disagree, 4 = Strongly Disagree).
Table 9 presents the survey statements for the variables with loadings of .50 or
higher for factor 4. Two of the items were reverse coded and two were not. Three of the
statements refer directly to the impact of mandated testing on math instruction and the
fourth statement deals with the impact of a mandated math curriculum. Like factor 2, this
set of statements seemed consistent with the hypothesized agency strand. I interpreted
factor 4 as “level of autonomy”.
Table 9. Survey Statements and Loadings for Factor 4 Statement Loading
The tests I am required to give significantly influence the content of my math course(s).a
.531
I teach topics that are not in the required mathematics curriculum .531 I teach topics that are not on the required math tests. .520 The tests I am required to give significantly influence the methods of instruction used in my math course(s).a
.514
a Statement was reverse coded (1 = Strongly Agree, 2 = Agree, 3 = Disagree, 4 = Strongly Disagree).
Factor 5 consists of five variables related to involvement in professional activities.
The statements and associated loadings for these variables are displayed in Table 10.
Although not identical, factor 5 is quite similar to the hypothesized professional
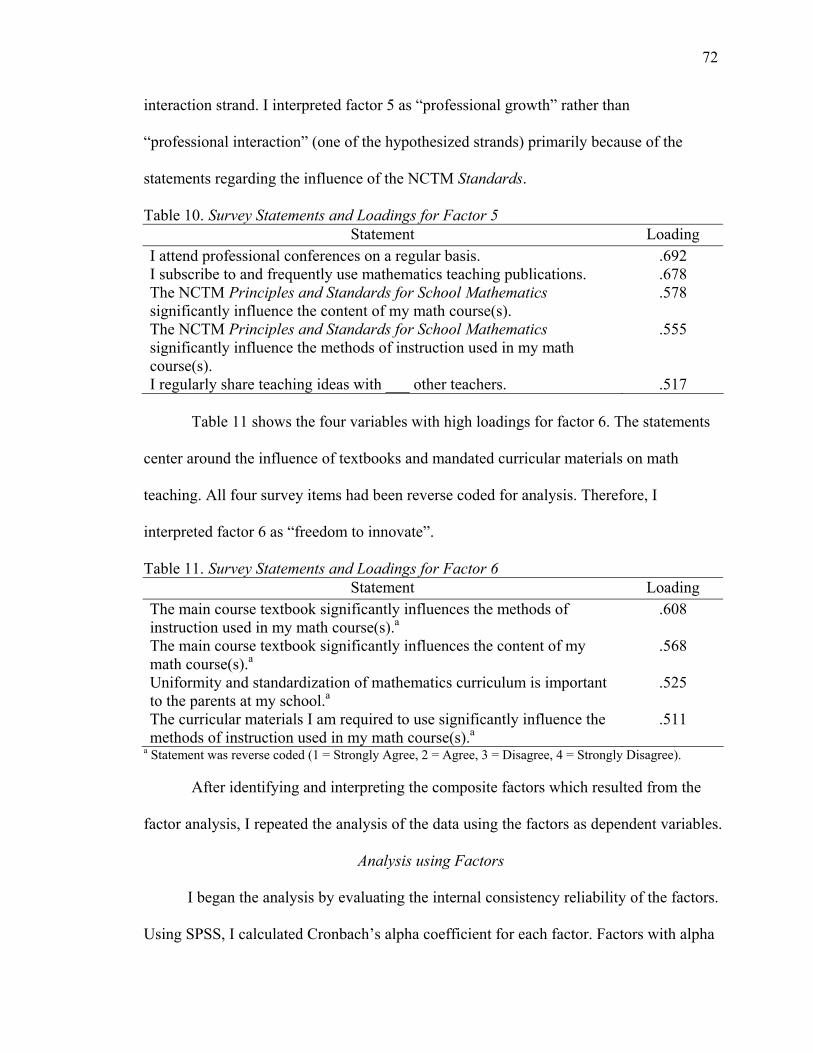
72
interaction strand. I interpreted factor 5 as “professional growth” rather than
“professional interaction” (one of the hypothesized strands) primarily because of the
statements regarding the influence of the NCTM Standards.
Table 10. Survey Statements and Loadings for Factor 5 Statement Loading
I attend professional conferences on a regular basis. .692 I subscribe to and frequently use mathematics teaching publications. .678 The NCTM Principles and Standards for School Mathematics significantly influence the content of my math course(s).
.578
The NCTM Principles and Standards for School Mathematics significantly influence the methods of instruction used in my math course(s).
.555
I regularly share teaching ideas with ___ other teachers. .517 Table 11 shows the four variables with high loadings for factor 6. The statements
center around the influence of textbooks and mandated curricular materials on math
teaching. All four survey items had been reverse coded for analysis. Therefore, I
interpreted factor 6 as “freedom to innovate”.
Table 11. Survey Statements and Loadings for Factor 6 Statement Loading
The main course textbook significantly influences the methods of instruction used in my math course(s).a
.608
The main course textbook significantly influences the content of my math course(s).a
.568
Uniformity and standardization of mathematics curriculum is important to the parents at my school.a
.525
The curricular materials I am required to use significantly influence the methods of instruction used in my math course(s).a
.511
a Statement was reverse coded (1 = Strongly Agree, 2 = Agree, 3 = Disagree, 4 = Strongly Disagree).
After identifying and interpreting the composite factors which resulted from the
factor analysis, I repeated the analysis of the data using the factors as dependent variables.
Analysis using Factors
I began the analysis by evaluating the internal consistency reliability of the factors.
Using SPSS, I calculated Cronbach’s alpha coefficient for each factor. Factors with alpha

73
values of 0.60 and above were considered reliable for this study. Then, I created six new
variables in the SPSS data file to represent the factors. Each variable was defined as the
composite score for the items loading on the factor. For instance, a participant’s
composite score for the freedom to innovate variable is the mean of their responses for
the four items associated with that factor. With these six new dependent variables, I
conducted one-way ANOVAs to compare means between demographic subgroups to
establish if differences in the factor scores existed. When significant differences were
present, I ran post hoc comparisons to determine exactly which pairs were different and
how they were different.
Summary
A summary of the research questions and analysis methods used is presented in
Table 12.
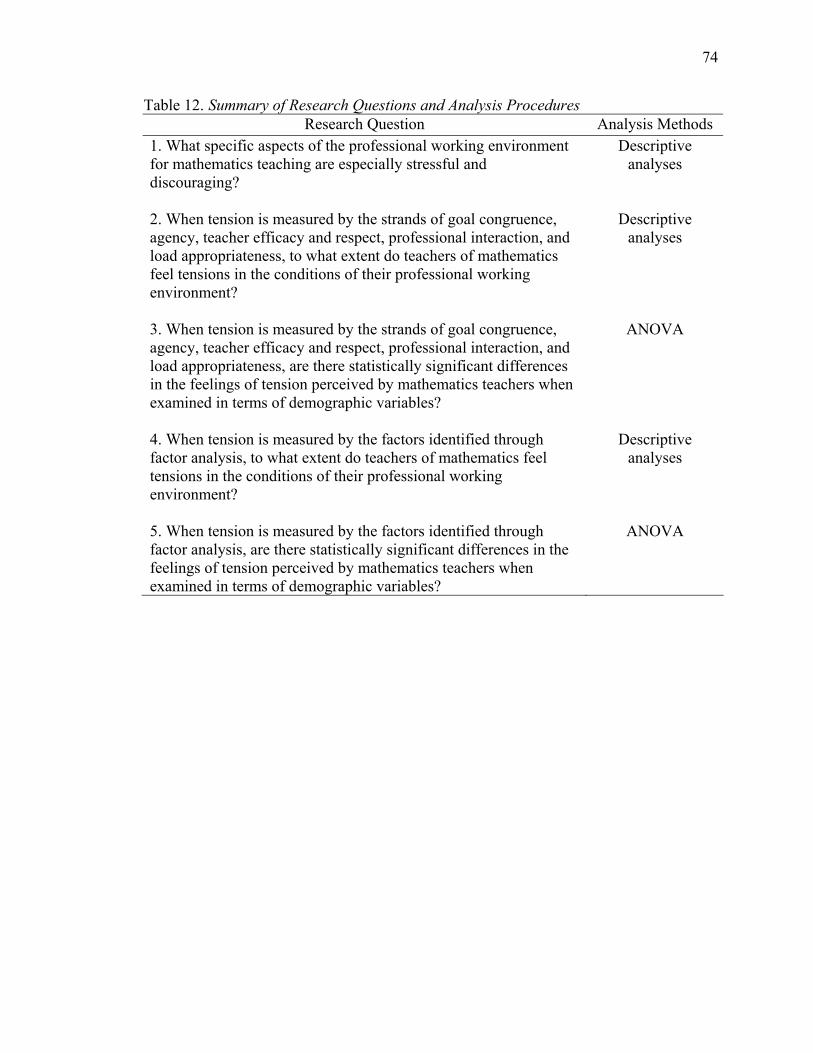
74
Table 12. Summary of Research Questions and Analysis Procedures Research Question Analysis Methods
1. What specific aspects of the professional working environment for mathematics teaching are especially stressful and discouraging?
Descriptive analyses
2. When tension is measured by the strands of goal congruence, agency, teacher efficacy and respect, professional interaction, and load appropriateness, to what extent do teachers of mathematics feel tensions in the conditions of their professional working environment?
Descriptive analyses
3. When tension is measured by the strands of goal congruence, agency, teacher efficacy and respect, professional interaction, and load appropriateness, are there statistically significant differences in the feelings of tension perceived by mathematics teachers when examined in terms of demographic variables?
ANOVA
4. When tension is measured by the factors identified through factor analysis, to what extent do teachers of mathematics feel tensions in the conditions of their professional working environment?
Descriptive analyses
5. When tension is measured by the factors identified through factor analysis, are there statistically significant differences in the feelings of tension perceived by mathematics teachers when examined in terms of demographic variables?
ANOVA
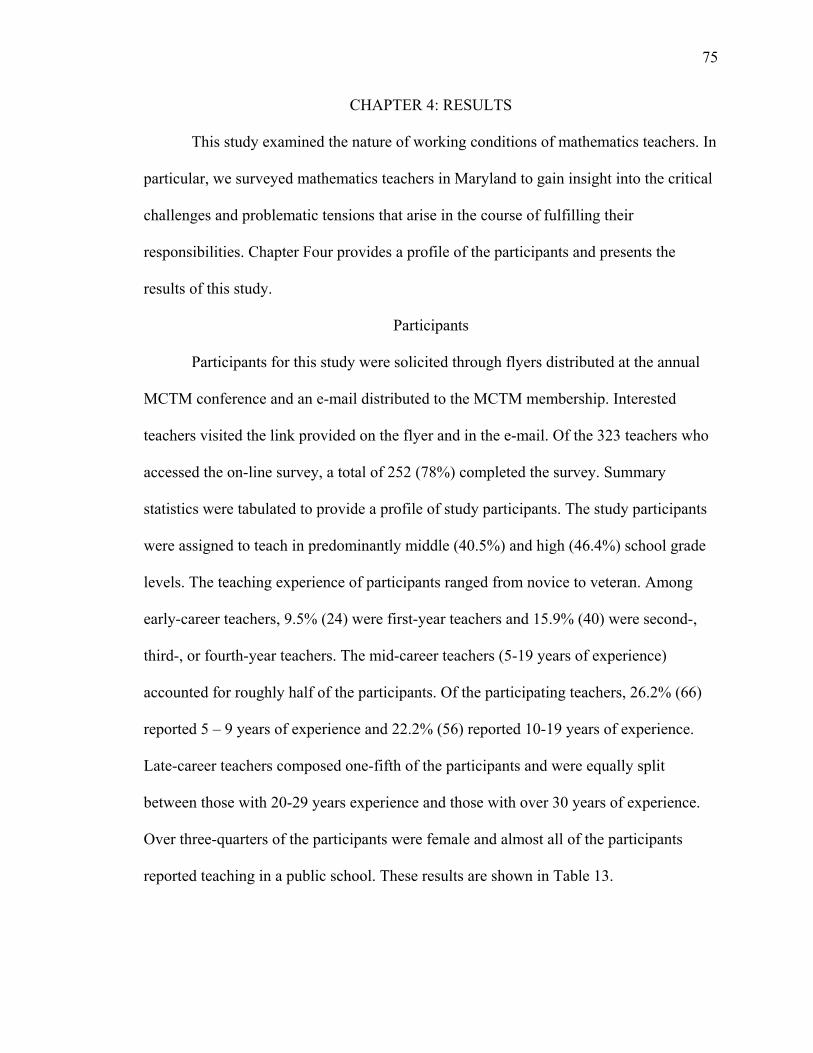
75
CHAPTER 4: RESULTS
This study examined the nature of working conditions of mathematics teachers. In
particular, we surveyed mathematics teachers in Maryland to gain insight into the critical
challenges and problematic tensions that arise in the course of fulfilling their
responsibilities. Chapter Four provides a profile of the participants and presents the
results of this study.
Participants
Participants for this study were solicited through flyers distributed at the annual
MCTM conference and an e-mail distributed to the MCTM membership. Interested
teachers visited the link provided on the flyer and in the e-mail. Of the 323 teachers who
accessed the on-line survey, a total of 252 (78%) completed the survey. Summary
statistics were tabulated to provide a profile of study participants. The study participants
were assigned to teach in predominantly middle (40.5%) and high (46.4%) school grade
levels. The teaching experience of participants ranged from novice to veteran. Among
early-career teachers, 9.5% (24) were first-year teachers and 15.9% (40) were second-,
third-, or fourth-year teachers. The mid-career teachers (5-19 years of experience)
accounted for roughly half of the participants. Of the participating teachers, 26.2% (66)
reported 5 – 9 years of experience and 22.2% (56) reported 10-19 years of experience.
Late-career teachers composed one-fifth of the participants and were equally split
between those with 20-29 years experience and those with over 30 years of experience.
Over three-quarters of the participants were female and almost all of the participants
reported teaching in a public school. These results are shown in Table 13.
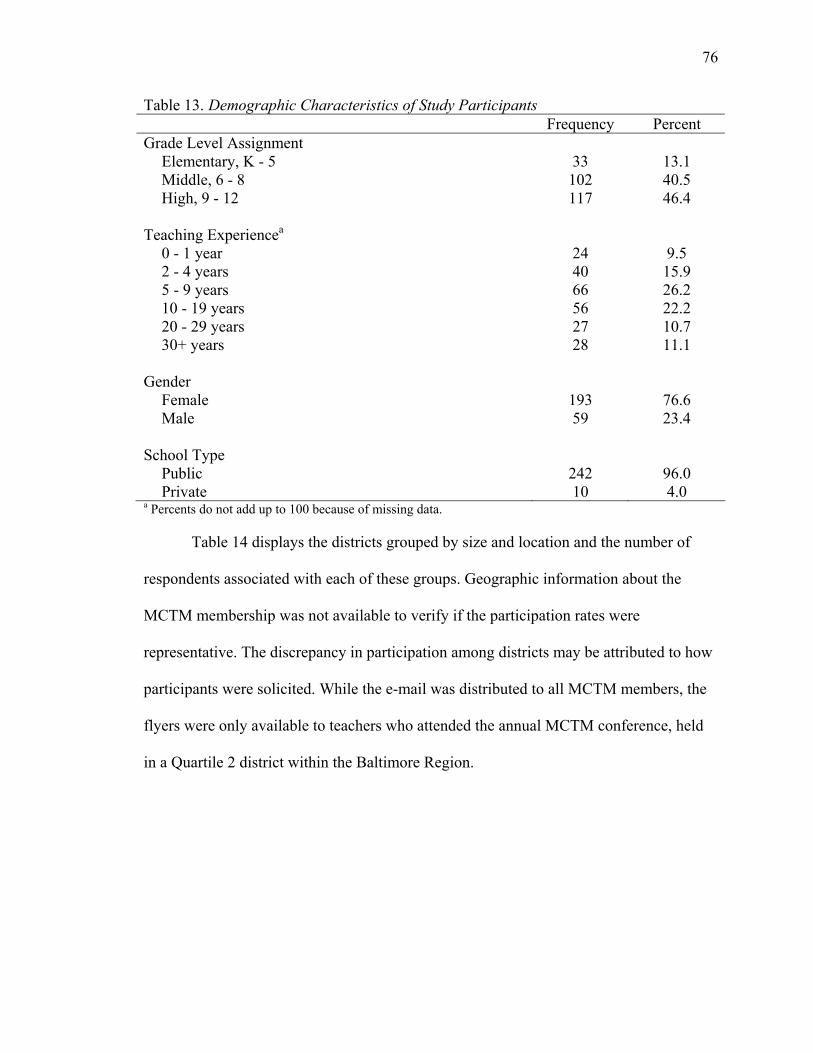
76
Table 13. Demographic Characteristics of Study Participants Frequency Percent Grade Level Assignment
Elementary, K - 5 33 13.1 Middle, 6 - 8 102 40.5 High, 9 - 12 117 46.4
Teaching Experiencea
0 - 1 year 24 9.5 2 - 4 years 40 15.9 5 - 9 years 66 26.2 10 - 19 years 56 22.2 20 - 29 years 27 10.7 30+ years 28 11.1
Gender
Female 193 76.6 Male 59 23.4
School Type
Public 242 96.0 Private 10 4.0
a Percents do not add up to 100 because of missing data.
Table 14 displays the districts grouped by size and location and the number of
respondents associated with each of these groups. Geographic information about the
MCTM membership was not available to verify if the participation rates were
representative. The discrepancy in participation among districts may be attributed to how
participants were solicited. While the e-mail was distributed to all MCTM members, the
flyers were only available to teachers who attended the annual MCTM conference, held
in a Quartile 2 district within the Baltimore Region.
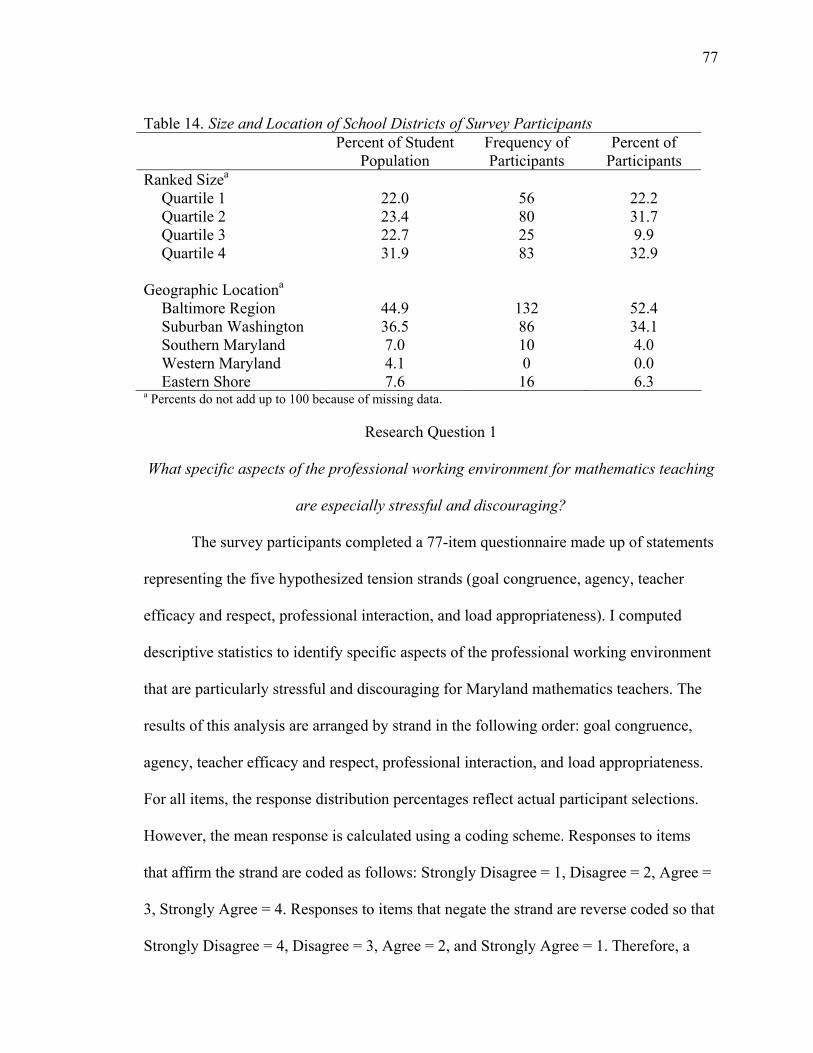
77
Table 14. Size and Location of School Districts of Survey Participants Percent of Student
Population Frequency of Participants
Percent of Participants
Ranked Sizea Quartile 1 22.0 56 22.2 Quartile 2 23.4 80 31.7 Quartile 3 22.7 25 9.9 Quartile 4 31.9 83 32.9
Geographic Locationa Baltimore Region 44.9 132 52.4 Suburban Washington 36.5 86 34.1 Southern Maryland 7.0 10 4.0 Western Maryland 4.1 0 0.0 Eastern Shore 7.6 16 6.3
a Percents do not add up to 100 because of missing data.
Research Question 1
What specific aspects of the professional working environment for mathematics teaching
are especially stressful and discouraging?
The survey participants completed a 77-item questionnaire made up of statements
representing the five hypothesized tension strands (goal congruence, agency, teacher
efficacy and respect, professional interaction, and load appropriateness). I computed
descriptive statistics to identify specific aspects of the professional working environment
that are particularly stressful and discouraging for Maryland mathematics teachers. The
results of this analysis are arranged by strand in the following order: goal congruence,
agency, teacher efficacy and respect, professional interaction, and load appropriateness.
For all items, the response distribution percentages reflect actual participant selections.
However, the mean response is calculated using a coding scheme. Responses to items
that affirm the strand are coded as follows: Strongly Disagree = 1, Disagree = 2, Agree =
3, Strongly Agree = 4. Responses to items that negate the strand are reverse coded so that
Strongly Disagree = 4, Disagree = 3, Agree = 2, and Strongly Agree = 1. Therefore, a

78
high mean occurs in two ways. Either many teachers agree with an item that affirms the
strand or many teachers disagree with an item that negates the strand. Survey statements
with reversed codes are identified in their respective tables.
In presenting response distribution data, I recognize that different readers will
draw somewhat different conclusions. For some, the glass will appear half full while for
others the glass will appear half empty. I relied on and liberally included the comments
that participants added throughout the survey to help interpret the results of the item
analysis.
Goal Congruence
The goal congruence strand consisted of three components: role conflict (when
expectations conflict), person-environment fit (when teachers feel unable to meet
teaching demands), and role ambiguity (when expectations are unclear). The distributions
of responses for items assessing teachers’ sense of goal congruence are presented in
Table 15. These 13 survey items elicited how well teachers’ beliefs, goals, and values
matched the beliefs, goals, and values of the various institutions to which they may
belong (i.e., the school, district, state, and NCTM).
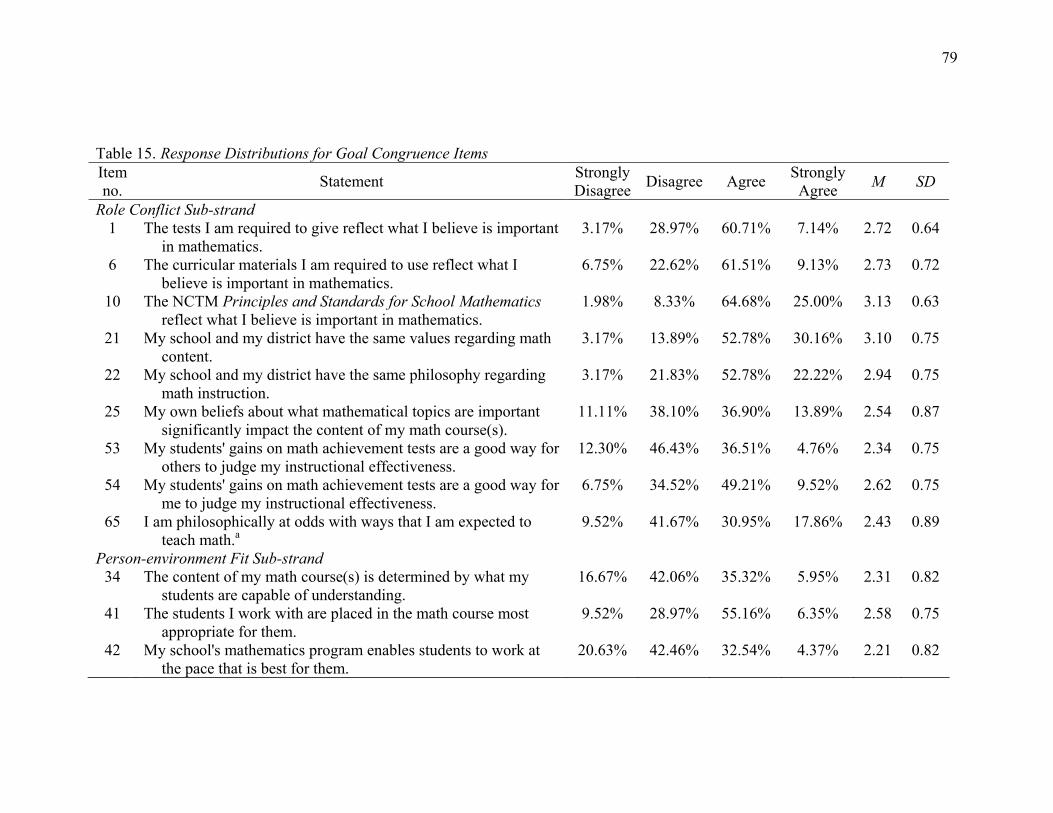
79
Table 15. Response Distributions for Goal Congruence Items Item no. Statement Strongly
Disagree Disagree Agree Strongly Agree M SD
Role Conflict Sub-strand 1 The tests I am required to give reflect what I believe is important
in mathematics. 3.17% 28.97% 60.71% 7.14% 2.72 0.64
6 The curricular materials I am required to use reflect what I believe is important in mathematics.
6.75% 22.62% 61.51% 9.13% 2.73 0.72
10 The NCTM Principles and Standards for School Mathematics reflect what I believe is important in mathematics.
1.98% 8.33% 64.68% 25.00% 3.13 0.63
21 My school and my district have the same values regarding math content.
3.17% 13.89% 52.78% 30.16% 3.10 0.75
22 My school and my district have the same philosophy regarding math instruction.
3.17% 21.83% 52.78% 22.22% 2.94 0.75
25 My own beliefs about what mathematical topics are important significantly impact the content of my math course(s).
11.11% 38.10% 36.90% 13.89% 2.54 0.87
53 My students' gains on math achievement tests are a good way for others to judge my instructional effectiveness.
12.30% 46.43% 36.51% 4.76% 2.34 0.75
54 My students' gains on math achievement tests are a good way for me to judge my instructional effectiveness.
6.75% 34.52% 49.21% 9.52% 2.62 0.75
65 I am philosophically at odds with ways that I am expected to teach math.a
9.52% 41.67% 30.95% 17.86% 2.43 0.89
Person-environment Fit Sub-strand 34 The content of my math course(s) is determined by what my
students are capable of understanding. 16.67% 42.06% 35.32% 5.95% 2.31 0.82
41 The students I work with are placed in the math course most appropriate for them.
9.52% 28.97% 55.16% 6.35% 2.58 0.75
42 My school's mathematics program enables students to work at the pace that is best for them.
20.63% 42.46% 32.54% 4.37% 2.21 0.82

80
Item no. Statement Strongly
Disagree Disagree Agree Strongly Agree M SD
Role Ambiguity Sub-strand 77 I know exactly what is expected of me in math instruction. 1.19% 10.32% 59.52% 28.97% 3.16 0.64
a Statement was reverse coded (1 = Strongly Agree, 2 = Agree, 3 = Disagree, 4 = Strongly Disagree).
81
Role Conflict
Within the goal congruence strand, items 1, 6, 10, 21, 22, 25, 53, 54, and 65
relate to role conflict. Although the unsolicited comments from a number of
participants reflected some conflict, the survey responses tended to show that
participant beliefs were compatible with the beliefs of their school, district, and state
as well as the beliefs of NCTM.
Close to 90% of participants indicated that the NCTM Principles and
Standards for School Mathematics matched their own beliefs (see item 10). This high
level of agreement may be because the participants were mostly MCTM members, a
local chapter of the NCTM. However, some of the comments provided by participants
reflect some role conflict even though they marked “Agree” with the statement. For
instance, one teacher wrote about a perceived conflict with the content of the
Standards: “Although I agree with many of the Standards of NCTM, I believe that
there is a lot of value in having students know their math facts cold” (A female, mid-
career, public high school teacher from a quartile 4, suburban Washington district,
personal communication, October 31, 2006). Another teacher alluded to conflicts
between the Standards and the curriculum pacing guide: “I am intrigued by the
NCTM Principles and Standards, although I am uncertain that they are attainable if
one adheres to the pacing guide” (A female, early-career, public high school teacher
from a quartile 2, Baltimore region district, personal communication, November 3,
2006).
Items on curricular materials and tests also showed little role conflict.
Approximately 7 out of 10 participants agreed that “The curricular materials I am

82
required to use reflect what I believe is important in mathematics” and 2 out of 3
participants agreed that “The tests I am required to give reflect what I believe is
important in mathematics.” The response to these items seems to indicate general
agreement with the mathematical content of both the curriculum and tests. The
similar ratings may stem from the trend among districts to align the curriculum with
the mandated tests. However, the results may have been different if the statement on
testing was separated into two items, one on state tests and one on district tests. For
example, one participant agreed with the item on tests yet commented, “The county
tests do not assess the students fairly” (A male, early-career, public middle school
teacher from a quartile 4, suburban Washington district, personal communication,
November 13, 2006). Even though most teachers held beliefs consistent with the
required tests, only 41% agreed that “My students’ gains on math achievement tests
are a good way for others to judge my instructional effectiveness” and 59% agreed
that “My students’ gains on math achievement tests are a good way for me to judge
my instructional effectiveness.” These responses show that there is some conflict
regarding how test scores are used.
For some participants, responses clearly indicated the presence of role conflict.
One teacher indicated on her survey that the Standards were compatible with her
beliefs and the district curriculum was not. She then explained her response by stating:
There is a direct conflict between NCTM Standards and the [district]
expectations for teaching curriculum. [The district] forces breadth over depth,
a huge problem for our students as they move into higher level course work.
I’m disappointed at the short sightedness of the curriculum planning and lack
83
of depth from [the district]. (A female, mid-career, public middle school
teacher from a quartile 2, Baltimore region district, personal communication,
October 31, 2006)
Again, this type of role conflict may be more prevalent in this sample than in the
general teaching population because the sample consisted of MCTM members.
Role conflict also assessed the harmony between institutions to which the
participants belonged, namely schools and districts. Most of the participants
perceived consistency between school and district values and philosophies as
evidenced by the high levels of agreement. This may be a result of the alignment
between the Maryland Voluntary Curriculum and the individual district learning
objectives as well as an emphasis on uniformity within districts.
One striking result among the role conflict items was the response to the
statement “I am philosophically at odds with ways that I am expected to teach math.”
Almost half of the participants agreed with this statement. In fact, 18% of the
participants marked “Strongly Agree”. The response to this item seems to indicate a
mismatch between teacher beliefs and school and/or district beliefs about how to
teach math. One participant included the following elaborating comment on her
survey: “The statement on this entire survey that I most agree with is the one
indicating that I am philosophically at odds with the ways I am expected to teach
math” (A female, mid-career, public middle school teacher from a quartile 2,
Baltimore region district, personal communication, October 17, 2006). Another
participant also elaborated on her response to this item:
84
When I agree to being 'philosophically at odds with ways that I am expected
to teach math' ---I just mean that sometimes, children do not fall into the
'cookie cutter' expectations. If a child is really behind, I would like to modify
their assignments daily and do some intervention. Realistically, those types of
things can be looked down upon. Philosophically, I have a problem moving on
when I know a student isn't understanding a concept. I would prefer to
continue to work with that student longer. The curriculum frowns on that. We
have a timeline to follow. (A female, early-career, public elementary school
teacher from a quartile 3, Baltimore region district, personal communication,
October 24, 2006)
This comment is consistent with findings by Jeffrey and Woods (1998) that
primary school teachers in England desired flexibility and autonomy in their practice
while they felt constrained by a government controlled, prescribed national
curriculum.
Person-environment Fit
Items 34, 41, and 42 of the goal congruence strand assess person-environment
fit. This fit represents the balance between the demands of teaching and the abilities
of teachers to meet those demands. Teacher responses showed a lack of fit resulting
from course content, student placement, curriculum pacing, and instructional time.
Approximately 61% of teachers agreed that their students were appropriately
placed. However, only 41% of teachers agreed that the course content was suitable
for their students and 37% of teachers agreed with the statement “My school’s
mathematics program enables students to work at the pace that is best for them.” The

85
responses to these items seem to suggest that a large number of teachers face
additional burdens due to the needs of their students. One participant eloquently
expressed her concern about the long term ramifications of inappropriate student
placement, course content, and pacing:
…My greatest concern is that children are being pushed into Algebra I too
soon. Although, a child may be able to handle Algebra I in 7th or 8th grade,
especially with its current emphasis on data analysis instead of the rigor that
used to be in Algebra I (factoring, solving equations, graphical analysis).
Taking Algebra I at this age forces a student to take Precalculus in 10th or 11th
grade and they are definitely not prepared for the rigor of a true mathematics
course such as this. They are lost and feel they are stupid, which just isn’t the
case. Instead, they have been ill prepared by a system that only wants to count
how many heads are in advanced mathematical classes. It is a travesty for
which the student pays in frustration, tears and an overall decrease in
motivation for learning mathematics. (A female, mid-career, public high
school teacher from a quartile 4, suburban Washington district, personal
communication, November 1, 2006)
Although lack of instructional time was not specifically addressed in the
survey, a number of participants alluded to this issue as an environmental factor
hampering their efforts to teach. One teacher wrote: “I cannot possibly cover
everything in my curriculum because there is not enough time in the semester” (A
female, late-career, public high school teacher from a quartile 1, Baltimore region
district, personal communication, November 10, 2006). These time constraints impact

86
what is taught as well as how it is taught as evidenced by the following comment:
“NCTM Standards fall by the wayside because in order to cover everything, a teacher
needs to find the quickest way to present material, not the best way” (A female, late-
career, public middle school teacher from a quartile 2, Baltimore region district,
personal communication, October 19, 2006). Teachers can feel torn between
following the prescribed pacing guide and doing what is best for their students. One
teacher remarked on this dilemma:
… I do not feel the mandatory time allotment given by my county meets my
students’ needs. I am constantly having to move on because the calendar says
so. I am a strong believer in a healthy balance of conceptual and procedural
knowledge and not in teaching a new indicator each day and hope the students
get the procedure as we ‘fly’ by it. (A female, mid-career, public middle
school teacher from a quartile 4, suburban Washington district, personal
communication, November 1, 2006)
These comments seem to suggest that pacing guides play an important role in the fit
between teachers and their environment.
The responses and comments related to person-environment fit show that
teachers perceive that they are often placed in the uncomfortable position of having a
wide-range of student abilities and a challenging, fast-paced curriculum.
Role Ambiguity
The final aspect of the goal congruence strand, role ambiguity, is addressed in
item 77. Role ambiguity did not appear to be a source of stress among participants
with almost 90% agreeing or strongly agreeing with the statement “I know exactly
87
what is expected of me in math instruction.” The high rate of agreement may be a
result of structured curriculum guides, detailed pacing guides, and publicized passing
rates for mandated tests.
Agency
The agency strand consists of 29 survey items designed to gauge how
autonomous, empowered, and utilized teachers feel. Table 16 displays the
distributions of responses for the items measuring teachers’ sense of agency. For ease
of interpretation, the following five categories were established: (1) items related to
individual teacher power, (2) items related to collective teacher power, (3) items on
teacher utilization, (4) items about influences on course content, and (5) items about
influences on course methods.
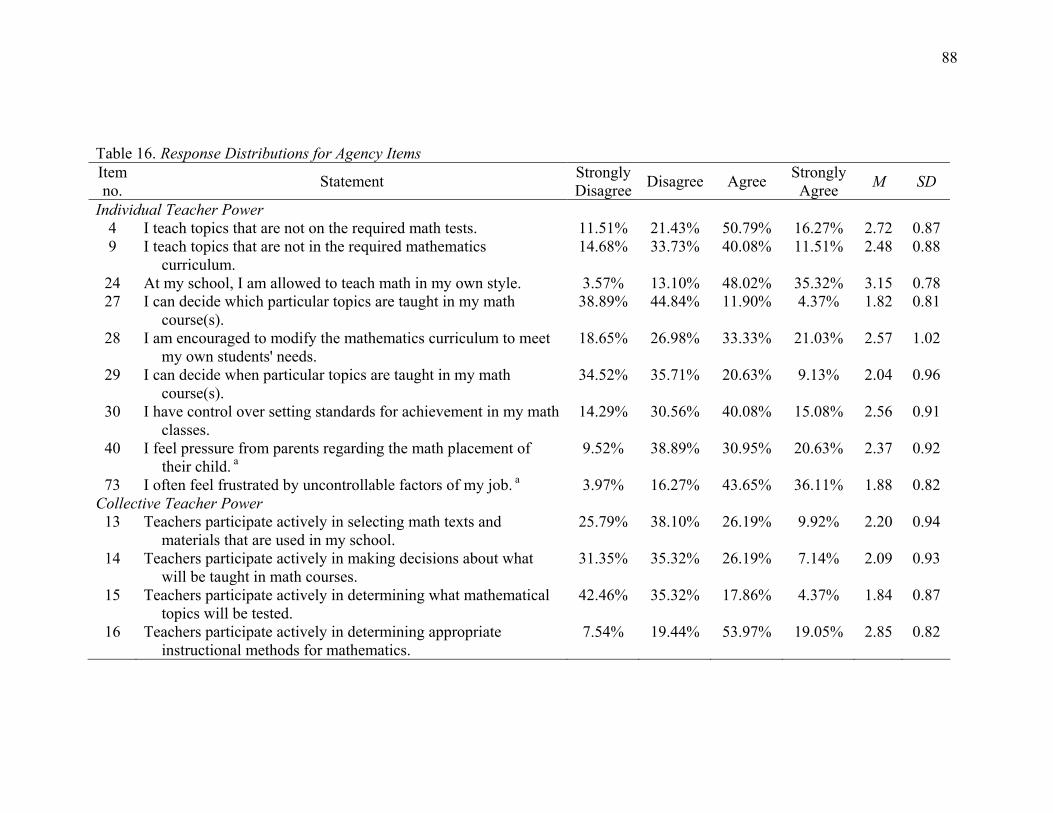
88
Table 16. Response Distributions for Agency Items Item no. Statement Strongly
Disagree Disagree Agree Strongly Agree M SD
Individual Teacher Power 4 I teach topics that are not on the required math tests. 11.51% 21.43% 50.79% 16.27% 2.72 0.87 9 I teach topics that are not in the required mathematics
curriculum. 14.68% 33.73% 40.08% 11.51% 2.48 0.88
24 At my school, I am allowed to teach math in my own style. 3.57% 13.10% 48.02% 35.32% 3.15 0.78 27 I can decide which particular topics are taught in my math
course(s). 38.89% 44.84% 11.90% 4.37% 1.82 0.81
28 I am encouraged to modify the mathematics curriculum to meet my own students' needs.
18.65% 26.98% 33.33% 21.03% 2.57 1.02
29 I can decide when particular topics are taught in my math course(s).
34.52% 35.71% 20.63% 9.13% 2.04 0.96
30 I have control over setting standards for achievement in my math classes.
14.29% 30.56% 40.08% 15.08% 2.56 0.91
40 I feel pressure from parents regarding the math placement of their child. a
9.52% 38.89% 30.95% 20.63% 2.37 0.92
73 I often feel frustrated by uncontrollable factors of my job. a 3.97% 16.27% 43.65% 36.11% 1.88 0.82 Collective Teacher Power
13 Teachers participate actively in selecting math texts and materials that are used in my school.
25.79% 38.10% 26.19% 9.92% 2.20 0.94
14 Teachers participate actively in making decisions about what will be taught in math courses.
31.35% 35.32% 26.19% 7.14% 2.09 0.93
15 Teachers participate actively in determining what mathematical topics will be tested.
42.46% 35.32% 17.86% 4.37% 1.84 0.87
16 Teachers participate actively in determining appropriate instructional methods for mathematics.
7.54% 19.44% 53.97% 19.05% 2.85 0.82

89
Item no. Statement Strongly
Disagree Disagree Agree Strongly Agree M SD
Teacher Utilization 25 My own beliefs about what mathematical topics are important
significantly impact the content of my math course(s). 11.11% 38.10% 36.90% 13.89% 2.54 0.87
26 My own knowledge of mathematical topics significantly impacts the content of my math course(s).
9.92% 21.03% 42.06% 26.98% 2.86 0.93
Influences on Course Content 2 The tests I am required to give significantly influence the
content of my math course(s).a 0.40% 1.98% 31.35% 66.27% 1.37 0.54
5 I spend more than 30 hours per year preparing students specifically for the required math tests. a
1.98% 8.33% 33.33% 56.35% 1.56 0.73
7 The curricular materials I am required to use significantly influence the content of my math course(s). a
2.38% 9.52% 46.03% 42.06% 1.72 0.73
12 The NCTM Principles and Standards for School Mathematics significantly influence the content of my math course(s).
2.78% 22.62% 57.94% 16.67% 2.88 0.70
18 Uniformity and standardization of mathematical content is important in my district. a
0.79% 4.37% 40.08% 54.76% 1.51 0.62
32 The main course textbook significantly influences the content of my math course(s). a
13.89% 35.71% 34.92% 15.48% 2.48 0.92
33 The content of my math course(s) is determined by what my students need for future study and work.
10.32% 29.76% 44.84% 15.08% 2.65 0.86
47 If I spend the majority of my time helping students develop proficiency in math skills and procedures, then the students will perform well on accountability tests. a
3.97% 23.81% 50.40% 21.83% 2.10 0.78

90
Item no. Statement Strongly
Disagree Disagree Agree Strongly Agree M SD
Influences on Course Methods 3 The tests I am required to give significantly influence the
methods of instruction used in my math course(s). a 1.98% 19.84% 45.63% 32.54% 1.91 0.77
8 The curricular materials I am required to use significantly influence the methods of instruction used in my math course(s). a
4.76% 19.84% 52.78% 22.62% 2.07 0.78
11 The NCTM Principles and Standards for School Mathematics significantly influence the methods of instruction used in my math course(s).
3.57% 29.76% 53.17% 13.49% 2.77 0.72
17 Uniformity and standardization of instructional methods in math is important in my district. a
3.57% 29.76% 41.27% 25.40% 2.12 0.83
31 The main course textbook significantly influences the methods of instruction used in my math course(s). a
14.29% 40.48% 32.54% 12.70% 2.56 0.89
a Statement was reverse coded (1 = Strongly Agree, 2 = Agree, 3 = Disagree, 4 = Strongly Disagree).
91
Individual Teacher Power
Items 4, 9, 24, 27-30, 40, and 73 consider the extent of power individual
teachers have. Among these items, participant responses varied. The statement “At
my school, I am allowed to teach math in my own style” garnered the highest level of
agreement at 83%. This strong response seems to reflect a perception by teachers that
they can close their classroom door and teach in a manner that suits them with little
outside interference. For example, one participant commented:
I am able to teach math in my own style only because I have a classroom
where the principal and assistant principal do not go in frequently until right
before the test. As a result I feel more freedom in the beginning of the year to
teach math in my own style, however as the test draws nearer I become more
and more restricted. After the test (April to the beginning of June) I am able to
decide what topics are taught in my math course but not before. (A female,
early-career, public elementary school teacher from a quartile 3, Baltimore
region district, personal communication, October 30, 2006)
Another teacher felt the amount of outside interference was dependent on student test
scores. She wrote:
It has been my experience that if a teacher can deliver good scores on the
MSA, the district, principal, and powers that be will ‘leave the teacher alone’
and allow them to bring in other materials or even modify the curriculum. If
you have not delivered good scores from your students on standardized tests,
you will NOT be allowed to deviate from the curriculum timeline at ALL. (A

92
female, early-career, public elementary school teacher from a quartile 3,
Baltimore region district, personal communication, October 24, 2006)
There was less agreement regarding individual power over the type of topics
taught. Two out of three participants taught topics not on the required tests and about
half of the participants taught topics not in the required curriculum. These responses
seem to indicate that a number of teachers feel free to stray from testing and
curricular mandates. It is possible that the choice of sample (MCTM members)
inflates these values. Just over half of the participants agreed that they could set
standards of achievement in their classes. However, over 14% of the participants
marked “Strongly Disagree” suggesting that for some teachers, they have no say in
how standards are set. Teachers were also split on the statement: “I am encouraged to
modify the mathematics curriculum to meet my own students’ needs.” In fact, this
item had the greatest dispersion of responses of all items on the survey. The fact that
close to half of the respondents disagree seems to imply that for many teachers, the
school culture promotes strict adherence to the curriculum. Participants felt the least
amount of power on the issue of deciding when and what to teach. Only 30% of the
teachers surveyed expressed that they decided when topics were taught and a mere
16% said they decided which particular topics were taught. The prevalence of
detailed curriculum and pacing guides may explain why teachers responded this way.
Lack of power may also contribute to feelings of frustration. Eight out of ten teachers
agreed that they were frequently frustrated by uncontrollable factors of teaching.
Teacher power was also considered with respect to student placement. About
half of the participants agreed with the statement: “I feel pressure from parents
93
regarding the math placement of their child.” Teachers commented that their
recommendations were disregarded when parents intervened. A high school teacher
remarked: “It is obvious though that teacher recommendations are largely ignored”
(A male, mid-career, public school teacher from a quartile 4, suburban Washington
district, personal communication, November 1, 2006). Another high school teacher
noted: “Every parent wants their child in honors classes (I think they know that their
child is not ‘gifted’, they just want their child to interact with gifted students). If they
insist, we must let them” (A female, mid-career, public school teacher from a quartile
1, Baltimore region district, personal communication, November 3, 2006).
Collective Teacher Power
The four items related to collective teacher power (the perceived power of
teachers as a whole) were items 13, 14, 15, and 16. In general, participants expressed
a lack of power regarding the selection of math texts and materials and the
determination of what is taught and tested. The one area where teachers felt they had
input was in deciding what instructional methods to use. Several participants
commented that textbook and curriculum decisions were typically made at the district
level with limited if any teacher involvement. A teacher with 27 years of experience
wrote: “Although I have participated in several textbook selection committees, most
teachers do not have that opportunity. The decisions are made on a county level” (A
female, public high school teacher from a quartile 2, Baltimore region district,
personal communication, November 3, 2006). Another teacher stated: “Textbooks are
chosen by a ‘committee’ of teachers experienced in the course content. Not every
school had a teacher on every course committee” (A female, mid-career, public high
94
school teacher from a quartile 2, Baltimore region district, personal communication,
October 23, 2006). A public middle school teacher described the top-down system of
decision-making in her district as follows: “The curriculum is created by district’s
math department. Materials and textbooks are disseminated and that is what we are to
use” (A mid-career teacher from a quartile 4, suburban Washington district, personal
communication, October 26, 2006). These responses and comments seem to imply a
top-down system where teachers have little input in curricular decisions which impact
instruction.
Teacher Utilization
Another aspect of the agency strand was the utilization of teacher knowledge
and beliefs. Teacher utilization was assessed through items 25 and 26. Approximately
seven out of ten teachers agreed that their own knowledge of mathematical topics
significantly impacted their course content. However, only half of the participants
agreed with the statement: “My own beliefs about what mathematical topics are
important significantly impact the content of my math course(s).” This response
likely reflects the widespread use of prescribed curriculum guides geared towards
mandated tests. In fact, a few teachers expressed strong feelings about the lack of
utilization. One middle school teacher wrote: “All I do is teach to the test because that
is all that is talked about!!” (A female, early-career, public school teacher from a
quartile 2, Baltimore region district, personal communication, November 1, 2006).
Another middle school teacher described her curriculum as ‘scripted’ and mentioned
serious consequences for teachers who disobeyed: “There is no deviation on what is
taught and when. It is all scripted and must be followed or the teacher is reported to
95
the Board of Education by the math text book’s ‘coach’” (A female, mid-career,
public middle school teacher from a quartile 2, Baltimore region district, personal
communication, November 1, 2006). These comments seem to indicate dissatisfaction
due to routinization which is consistent with findings from Conley, Bacharach, and
Bauer (1989).
Influences on Course Content
Items 2, 5, 7, 12, 18, 32, 33, and 47 assessed the influence on course content
of factors other than teacher beliefs and knowledge. Almost all of the participants
agreed that uniformity and standardization of math content was important in their
district. Several participants cited the use of pacing guides to enforce the content and
speed of delivery. For example, one teacher wrote, “We have ‘pacing guides’ that are
used throughout our county. Each teacher should be within 2 days (ahead or behind)
at any given time” (A female, mid-career, public high school teacher from a quartile 2,
Baltimore region district, personal communication, October 23, 2006). Another
teacher commented, “We teach by the Pacing Guide. We have required weekly
meetings to verify that we are all in the same place and using the same assessment
materials when not provided by the board” (A female, early-career, public high
school teacher from a quartile 2, Baltimore region district, personal communication,
November 3, 2006).
Testing appeared to have a strong role in determining course content. There
was close to unanimous agreement that the required tests significantly influence
course content. A middle school teacher lamented, “Course content has become test
driven … I can’t take time to do the creative things that make math fun and
96
interesting and make my class memorable” (A female, mid-career, public school
teacher from a quartile 2, Baltimore region district, personal communication, October
17, 2006). A high school teacher stated, “All of my instruction directly relates to the
required tests” (A female, mid-career, public school teacher from a quartile 4,
suburban Washington district, personal communication, October 18, 2006). Another
teacher went as far as to say, “Tests drive it ALL. Timing, content, and methods” (A
female, mid-career, public middle school teacher from a quartile 2, Baltimore region
district, personal communication, October 31, 2006). Nine out of ten teachers agreed
that they spent over 30 hours per year preparing students for required tests. One
teacher confessed:
I actually spend way more than 30 hours per year preparing students for
required math tests. I spend a minimum of 1 hour 25 min. daily for 5 days per
week preparing students for their tests. All instruction focuses on the required
results. (A female, mid-career, public elementary school teacher from a
quartile 4, suburban Washington district, personal communication, November
7, 2006)
Over 70% of teachers agreed with the statement “If I spend the majority of my time
helping students develop proficiency in math skills and procedures, then the students
will perform well on accountability tests.” Several teachers mentioned that the
emphasis on teaching to the test had increased with time. A teacher from the Eastern
Shore wrote:
I feel as if every year I am required to teach more and more to the Maryland
state test that my students take in March. We spend almost every minute of
97
instruction on the topics that will be on the state test. It isn’t until after the test
that I feel that I can teach some ‘other’ topics. (A female, public middle
school teacher with unknown teaching experience from a quartile 1 district,
personal communication, October 25, 2006)
Another teacher expressed her concern that student learning was being sacrificed for
test scores:
More and more I am forced to teach to the test and given very little time to do
so. It seems every year one more thing is crammed in leaving no time to
elaborate on anything. I feel that I am only skimming the surface and the kids
aren’t truly learning the in depth parts…just how to pass an exam.” (A female,
mid-career, public high school teacher from a quartile 2, Baltimore region
district, personal communication, November 1, 2006)
The survey responses and numerous comments from participants indicate that testing
heavily influences course content.
Besides testing, course content was also shaped by the curriculum, the
Standards, textbooks, and student needs. Close to 90% of participants agreed that the
required curricular materials influenced content. For instance, a late-career teacher
said, “There is no time to teach objectives other than what is on mandated curriculum
and tests. Sometimes there is not enough time to teach what is required” (A female,
public middle school teacher from a quartile 2, Baltimore region district, personal
communication, October 19, 2006). Three out of four teachers agreed that the
Standards influenced the content of their courses and half of the teachers agreed that
the textbook influenced the content of their courses. Six out of ten teachers agreed
98
with the statement “The content of my math course(s) is determined by what my
students need for future study and work.” The responses to this set of items indicate
that pacing, testing, and curriculum play a larger role in shaping course content then
the Standards, textbooks, and student needs.
Influences on Course Methods
Influences on course methods were measured by items 3, 8, 11, 17, and 31.
Overall, there was less influence by tests, curricular materials, textbooks, and the
Standards on instructional methods than there was on course content. About three out
of four participants felt that tests and curricular materials had a considerable impact
on teaching methods. Two out of three teachers cited the Standards and less than half
of the teachers cited their textbook as having an affect on instructional methods. A
majority of teachers reported that uniformity and standardization of teaching methods
was important in their district, however the level of agreement was much lower than
it was for a similar item on content.
The responses to the agency strand items point to a heavy emphasis on testing
and a limited voice for teachers on issues related to instruction. The locus of control
appears to reside with others more than it does with the teacher. Teachers are told
what and when to teach as well as what and when to assess. Teachers felt the most
power in the manner with which they taught. With this backdrop, it is understandable
why close to 50% of the participants stated they were philosophically at odds with the
ways they were expected to teach math.
99
Teacher Efficacy and Respect
The distributions of responses for the items evaluating teachers’ sense of
efficacy and respect are presented in Table 17. Of the 45 items in this strand, 20
measured how effective teachers felt and 25 measured how respected teachers felt.
100
Table 17. Response Distributions for Teacher Efficacy and Respect Items Item no. Statement Strongly
Disagree Disagree Agree Strongly Agree M SD
Efficacy 19 I feel pressure from my district superintendent to raise scores on
required math tests. a 1.98% 11.11% 29.76% 57.14% 1.58 0.77
20 I feel pressure from my principal to raise scores on required math tests. a
1.98% 9.92% 32.14% 55.95% 1.58 0.75
35 The curriculum for my math course(s) is too difficult for my students. a
11.90% 50.79% 28.57% 8.73% 2.66 0.80
36 The curriculum for my math course(s) is not challenging my students. a
23.81% 64.68% 9.92% 1.59% 3.11 0.63
41 The students I work with are placed in the math course most appropriate for them.
9.52% 28.97% 55.16% 6.35% 2.58 0.75
45 I often feel satisfied with my job in teaching mathematics. 2.38% 18.25% 57.14% 22.22% 2.99 0.71 48 I feel as though I am positively influencing other people's lives
through my work as a math teacher. 1.19% 5.56% 52.78% 40.48% 3.33 0.64
49 I feel as though I am making significant academic progress with my math students.
0.79% 16.27% 59.13% 23.81% 3.06 0.66
50 My success or failure in teaching students math is due primarily to factors beyond my control rather than to my own effort and ability. a
10.71% 39.68% 31.35% 18.25% 2.43 0.91
51 Teachers are a very powerful influence on student math achievement when all factors are considered.
0.79% 5.56% 51.98% 41.67% 3.35 0.62
53 My students' gains on math achievement tests are a good way for others to judge my instructional effectiveness.
12.30% 46.43% 36.51% 4.76% 2.34 0.75
54 My students' gains on math achievement tests are a good way for me to judge my instructional effectiveness.
6.75% 34.52% 49.21% 9.52% 2.62 0.75

101
Item no. Statement Strongly
Disagree Disagree Agree Strongly Agree M SD
63 My experience in the teaching profession has diminished my enthusiasm for teaching math. a
23.02% 44.84% 23.81% 8.33% 2.83 0.88
64 I am less idealistic about teaching now, then when I entered the profession. a
13.10% 30.16% 36.51% 20.24% 2.36 0.95
70 I enjoy teaching. 0.40% 4.76% 47.62% 47.22% 3.42 0.60 71 I often feel frustrated by teaching in general. a 9.52% 37.70% 40.48% 12.30% 2.44 0.83 72 I am pleased with the progress my students make in math. 1.19% 18.65% 63.49% 16.67% 2.96 0.63 74 I feel a sense of pride in my work at my school. 0.00% 4.76% 55.56% 39.68% 3.35 0.57 75 I often feel burned out from my work. a 9.13% 30.95% 38.10% 21.83% 2.27 0.91 76 I feel good about my math teaching style and strategies. 0.00% 7.14% 53.97% 38.89% 3.32 0.60
Respect 13 Teachers participate actively in selecting math texts and
materials that are used in my school. 25.79% 38.10% 26.19% 9.92% 2.20 0.94
14 Teachers participate actively in making decisions about what will be taught in math courses.
31.35% 35.32% 26.19% 7.14% 2.09 0.93
15 Teachers participate actively in determining what mathematical topics will be tested.
42.46% 35.32% 17.86% 4.37% 1.84 0.87
16 Teachers participate actively in determining appropriate instructional methods for mathematics.
7.54% 19.44% 53.97% 19.05% 2.85 0.82
17 Uniformity and standardization of instructional methods in math is important in my district. a
3.57% 29.76% 41.27% 25.40% 2.12 0.83
18 Uniformity and standardization of mathematical content is important in my district. a
0.79% 4.37% 40.08% 54.76% 1.51 0.62
23 At my school, teachers maintain high standards of performance for themselves in teaching mathematics.
0.79% 8.73% 44.84% 45.63% 3.35 0.67
24 At my school, I am allowed to teach math in my own style. 3.57% 13.10% 48.02% 35.32% 3.15 0.78
102
Item no. Statement Strongly
Disagree Disagree Agree Strongly Agree M SD
25 My own beliefs about what mathematical topics are important significantly impacts the content of my math course(s).
11.11% 38.10% 36.90% 13.89% 2.54 0.87
26 My own knowledge of mathematical topics significantly impacts the content of my math course(s).
9.92% 21.03% 42.06% 26.98% 2.86 0.93
27 I can decide which particular topics are taught in my math course(s).
38.89% 44.84% 11.90% 4.37% 1.82 0.81
28 I am encouraged to modify the mathematics curriculum to meet my own students' needs.
18.65% 26.98% 33.33% 21.03% 2.57 1.02
29 I can decide when particular topics are taught in my math course(s).
34.52% 35.71% 20.63% 9.13% 2.04 0.96
30 I have control over setting standards for achievement in my math classes.
14.29% 30.56% 40.08% 15.08% 2.56 0.91
37 Uniformity and standardization of mathematics curriculum is important to the parents at my school. a
5.95% 36.11% 50.40% 7.54% 2.40 0.72
38 Uniformity and standardization of instructional methods in math is important to the parents at my school. a
7.54% 47.22% 39.29% 5.95% 2.56 0.72
39 Most of my students' parents support the things I do in teaching math.
1.19% 3.97% 67.46% 27.38% 3.21 0.56
40 I feel pressure from parents regarding the math placement of their child. a
9.52% 38.89% 30.95% 20.63% 2.37 0.92
52 Evaluation of my math teaching is used to help me improve. 1.98% 18.65% 53.17% 26.19% 3.04 0.73 55 The methods used in evaluating my math teaching are objective
and fair. 4.37% 24.60% 56.35% 14.68% 2.81 0.73
56 My principal recognizes the good math teaching I do. 4.37% 10.32% 50.00% 35.32% 3.16 0.78 57 Other teachers in my school recognize my math teaching
competence. 0.79% 4.76% 60.32% 34.13% 3.28 0.59
58 The parents at my school recognize the good math teaching I do. 1.59% 9.92% 61.51% 26.98% 3.14 0.64

103
Item no. Statement Strongly
Disagree Disagree Agree Strongly Agree M SD
59 My students recognize the good math teaching I do. 1.19% 12.30% 57.54% 28.97% 3.14 0.66 60 My students show that they appreciate me as a math teacher. 1.19% 13.10% 56.75% 28.97% 3.13 0.67
a Statement was reverse coded (1 = Strongly Agree, 2 = Agree, 3 = Disagree, 4 = Strongly Disagree).

104
Efficacy
Teacher beliefs about efficacy are reflected in their responses to items 19, 20,
35, 36, 41, 45, 48-51, 53, 54, 63, 64, 70-72, and 74-76. These responses showed that
the majority of participants believed they had the capacity to affect student
performance. Almost all of the participants agreed that teachers were a very powerful
influence on student achievement. Over 90% of the participants felt they were
positively influencing others by teaching math. Eight out of ten teachers felt they
were making significant progress with their students and expressed pleasure with
their students’ progress in math. Nine out of ten teachers agreed with the statement “I
feel good about my math teaching style and strategies” and eight out of ten teachers
agreed with the statement “I often feel satisfied with my job in teaching
mathematics.” In general, most teachers feel effective in their work as math teachers.
However, the participants were evenly split on the statement “My success or failure in
teaching students math is due primarily to factors beyond my control rather than to
my own effort and ability.” A high school teacher who strongly agreed with this
statement added:
We as teachers are the only professionals whose success and failure, and
ultimately how they are judged, is determined by something over which we
have no control. I can be the most brilliant teacher in the world, but if a
student does not care about the results of a standardized test then *I* am a
failure because that child didn't pass. When many of our students don't care
about the state test (for whatever reasons they may be), then the school as a
whole is a failure. Imagine if a public defender's quality was based on how
105
many criminals he got off. Imagine if the quality of a doctor was determined
by the percentage of her patients who never got sick again. Imagine if the
quality of a stock broker was based on him having to pick 38 stocks that
would rise on one specific day in May. (A male, early-career, public school
teacher from a quartile 2, Baltimore region district, personal communication,
October 31, 2006)
These survey responses and comments reveal that while teachers feel efficacious in
their math teaching, some teachers take issue with equating their own success or
failure solely to student test scores. If fact, only four out of ten teachers agreed that
“My students’ gains on math achievement tests are a good way for others to judge my
instructional effectiveness.” There was a higher level of agreement among
participants that these gains on tests were useful for self-evaluation.
Participants expressed mixed feelings about teaching. Nearly all of the
participants indicated that they enjoyed teaching and felt a sense of pride in their
work. However, 60% of the teachers often felt burned out from teaching and 53% of
the teachers often felt frustrated by teaching. These responses seem to suggest that
teachers face a difficult work environment. Teachers with varying levels of
experience provided elaborating comment on their feelings of frustration. An early-
career teacher wrote:
The pressure of teaching a conceptual curriculum in an environment where a
procedural understanding can be obtained faster, easier and result in a positive
outcome is frustrating. Especially when one knows that the positive outcome
is known to be only short term. This conundrum often leaves me unsatisfied.
106
(A female, public high school teacher from a quartile 3, Baltimore region
district, personal communication, October 29, 2006)
A mid-career teacher stated, “Teaching math has become a lesson in frustration” (A
female, public middle school teacher from a quartile 2, Baltimore region district,
personal communication, October 17, 2006) and a late-career teacher explained, “I
often feel frustrated by teaching in that the demands/expectations/responsibilities
continue to increase. Nothing is ever ‘taken off the plate,’ yet no additional time is
given” (A female, late-career, public middle school teacher from a quartile 4,
suburban Washington district, personal communication, November 7, 2006). It seems
that some teachers may have a love-hate relationship with teaching. For example, one
teacher commented, “I often feel burned out and tired, especially after a particularly
bad day. But when I consider working in another field, I can’t come up with a career
that I would love more than teaching” (A female, early-career, public high school
teacher from a quartile 2, Baltimore region district, personal communication,
November 1, 2006).
For some participants, there were changes in beliefs regarding their ability to
positively impact students. About one-third of the teachers agreed that “My
experience in the teaching profession has diminished my enthusiasm for teaching
math” and over half of the teachers agreed that “I am less idealistic about teaching
now, then when I entered the profession.” These responses may be a reflection of the
rigid, inflexible nature of the teaching environment. A middle school teacher even
went as far as to say, “I believe I will retire instead of trying to come to terms with
107
what is happening to education” (A female, mid-career, public school teacher from a
quartile 2, Baltimore region district, personal communication, November 1, 2006).
A portion of the efficacy items considered whether student placement,
curriculum, and testing were problematic, thereby reducing teachers’ effectiveness.
Regarding student placement, 61% of the participants agreed that their students were
in the appropriate math course. Just over 10% of the teachers felt that the curriculum
was not challenging enough for their students and almost 40% felt that the curriculum
was too difficult. Faced with perceptions of inappropriately placed students and a
curriculum that does not match the needs and abilities of students, teachers can feel
unable to provide effective math instruction. Pressure to raise scores can also
negatively impact a teacher’s sense of efficacy. Close to 90% of the participants
responded that they had experienced pressure from their district superintendent and
school principal to raise test scores. In fact, well over 50% strongly agreed with each
of these items. Taken together, pressure to raise scores for students who are not
suitably placed in courses can certainly lead a teacher to feel ineffective.
Respect
Teacher views on respect are represented in their responses to items 13-18,
23-30, 37-40, 52, and 55-60. Several of the respect items overlap with items from the
agency strand. In general, teachers reported low levels of participation in decision-
making activities and widely varying levels of input on what, when, and how topics
were taught. Teachers also indicated that the content and instructional methods used
were highly uniform and standardized. These comments are often viewed as an
apparent lack of respect for teachers by the district and possibly the administration.

108
Teachers were by and large positive about evaluations of their teaching. Over
70% of participants agreed that “The methods used in evaluating my math teaching
are objective and fair.” Close to 80% of participants agreed with the statement
“Evaluation of my math teaching is used to help me improve.”
Survey participants expressed high levels of agreement on items measuring
recognition from their principal, colleagues, parents, and students. Most teachers
agreed that parents were supportive although roughly half had experienced pressure
from parents about the math placement of their child. Participants were fairly split on
whether uniformity and standardization of content and methods was important to
parents.
Professional Interaction
The seven items of the professional interaction strand assessed the degree to
which the school culture encouraged professional growth and interaction. The
distributions of responses for these items are displayed in Table 18.
109
Table 18. Response Distributions for Professional Interaction Items Item no. Statement Strongly
Disagree Disagree Agree Strongly Agree M SD
Teacher Collaboration Within Schools 61 Other teachers at my school often seek my advice about
professional issues. 2.38% 18.25% 54.76% 24.60% 3.02 0.73
62 I often observe other teachers to gain insights about mathematics content and pedagogy.
9.13% 37.70% 38.89% 14.29% 2.58 0.85
0 1-2 3-4 >4 66 I regularly share teaching ideas with ___ other teachers. 1.59% 21.43% 36.51% 40.48% 3.16 0.81
Yes No 67a I have common planning time with other mathematics teachers.a 73.02% 26.98% 2.73 0.45 67b I make effective use of my common planning time.b 1.09% 17.39% 54.89% 26.63% 3.07 0.69
Professional Activities 43 I attend professional conferences on a regular basis. 5.95% 31.35% 46.43% 16.27% 2.73 0.80 44 I subscribe to and frequently use mathematics teaching
publications. 9.52% 44.05% 33.73% 12.70% 2.50 0.83
a “Yes” responses were coded as ‘3’ and “no” responses were coded as ‘2’. b This statement was only given to teachers who responded that they had common planning time (n = 184).

110
Teacher Collaboration Within Schools
Items 61, 62, 66, 67a, and 67b address teacher collaboration within schools.
Most participants expressed that they had opportunities to work with other teachers.
Virtually all of the teachers said that they share teaching ideas with at least one other
teacher and 40% of the teachers share ideas with more than four other teachers.
Several teachers described structured opportunities provided to them. For example,
one teacher wrote, “My school has a schedule that provides time for collaboration. In
my opinion, this is invaluable. We share plans, resources, strategies, etc. We do all we
can to support each other, thus supporting our students” (A female, late-career, public
middle school teacher from a quartile 4, suburban Washington district, personal
communication, November 7, 2006). Another teacher stated, “All 5 8th grade math
teachers meet 2 X a week for 45 minutes. It’s wonderful to brainstorm & share ideas,
projects, etc” (A female, late-career, public middle school teacher from a quartile 1,
Eastern Shore district, personal communication, October 27, 2006). Nearly three-
quarters of the participants had common planning time with other math teachers and
of those, over 80% felt that the time was well-spent. Common planning was so
important to one teacher that she explained, “I make planning time after school with
my teammates…it’s not provided in my ‘work day’” (A female, early-career, public
elementary school teacher from a quartile 4, suburban Washington district, personal
communication, November 17, 2006). Close to 80% of the participants agreed that
“Other teachers at my school often seek my advice about professional issues.” These
responses and comments seem to imply that the school culture generally encourages
collaboration among teachers.
111
Although many teachers shared ideas with others, participants were less likely
to observe their peers. Only 53% of the participants frequently observed other
teachers to gain insights about math content and pedagogy. Some teachers cited a lack
of time. A middle school teacher said, “I don’t feel that I have time to observe or
share ideas with other teachers” (A female, late-career, public school teacher from a
quartile 1, Baltimore region district, personal communication, November 6, 2006). A
high school teacher agreed, “I wish I had the time to observe other teachers!” (A
female, mid-career, public school teacher from a quartile 1, Baltimore region district,
personal communication, November 3, 2006). Teachers from all grade levels cited a
lack of qualified substitutes. An elementary school teacher commented, “I would love
to observe other teachers, but whenever I have asked I was told that I could not be
provided coverage” (A female, early-career, public school teacher from a quartile 3,
Baltimore region district, personal communication, October 30, 2006). A middle
school teacher said, “We have been offered release time to observe others, I just hate
giving up time to a sub. I know it is something I should do” (A female, mid-career,
public school teacher from a quartile 2, Baltimore region district, personal
communication, November 6, 2006). A high school teacher wrote, “Since we do not
have many competent substitute teachers in my district, I am encouraged to be in
class as much as possible and cannot take time away from my students to observe
other teachers unless absolutely necessary” (A female, early-career, public school
teacher from a quartile 2, Baltimore region district, personal communication,
November 1, 2006). It appears that while half of the participants observe other
112
teachers, there are a number of teachers who desire these opportunities or feel unable
to take advantage of these opportunities.
Professional Activities
Attendance at professional conferences and use of math teaching publications
were measured by item numbers 43 and 44. Over 60% of the participants regularly
attended professional conferences. Almost half of the participants subscribe to and
frequently use math teaching publications. Since this survey was aimed at MCTM
members, these responses do not seem unreasonable.
In general, most participants had opportunities to share ideas and plan with
other teachers. Some teachers lacked common planning time and many teachers
expressed a desire to observe other teachers. Rates of attendance at conferences and
subscriptions to publications were neither high nor low.
Load Appropriateness
The last strand, load appropriateness, consisted of seven items. These items
considered the balance between job demands and available time. Table 19 displays
the distributions of responses for items measuring teachers’ sense of load
appropriateness.
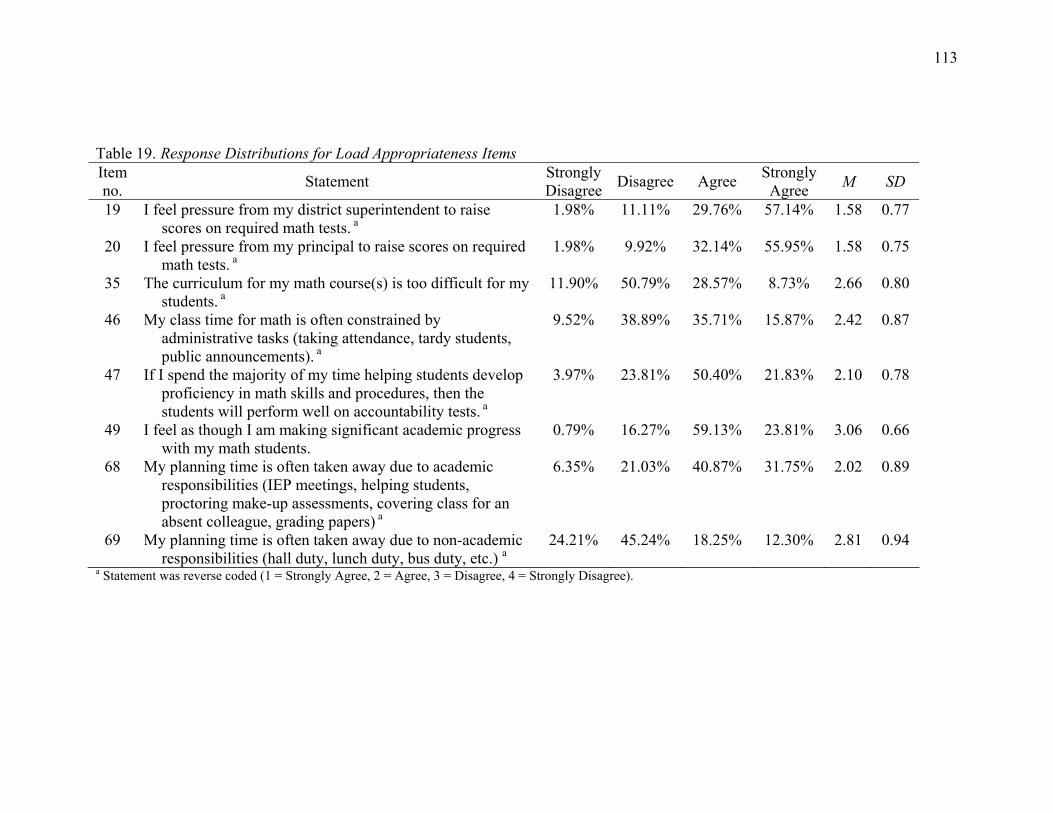
113
Table 19. Response Distributions for Load Appropriateness Items Item no. Statement Strongly
Disagree Disagree Agree Strongly Agree M SD
19 I feel pressure from my district superintendent to raise scores on required math tests. a
1.98% 11.11% 29.76% 57.14% 1.58 0.77
20 I feel pressure from my principal to raise scores on required math tests. a
1.98% 9.92% 32.14% 55.95% 1.58 0.75
35 The curriculum for my math course(s) is too difficult for my students. a
11.90% 50.79% 28.57% 8.73% 2.66 0.80
46 My class time for math is often constrained by administrative tasks (taking attendance, tardy students, public announcements). a
9.52% 38.89% 35.71% 15.87% 2.42 0.87
47 If I spend the majority of my time helping students develop proficiency in math skills and procedures, then the students will perform well on accountability tests. a
3.97% 23.81% 50.40% 21.83% 2.10 0.78
49 I feel as though I am making significant academic progress with my math students.
0.79% 16.27% 59.13% 23.81% 3.06 0.66
68 My planning time is often taken away due to academic responsibilities (IEP meetings, helping students, proctoring make-up assessments, covering class for an absent colleague, grading papers) a
6.35% 21.03% 40.87% 31.75% 2.02 0.89
69 My planning time is often taken away due to non-academic responsibilities (hall duty, lunch duty, bus duty, etc.) a
24.21% 45.24% 18.25% 12.30% 2.81 0.94
a Statement was reverse coded (1 = Strongly Agree, 2 = Agree, 3 = Disagree, 4 = Strongly Disagree).

114
Teachers’ job demands are more complex than simply teaching math content.
From the items in the agency strand, some teachers indicated that they are required to
use a standardized curriculum, follow a strict pacing guide, and prepare students for
assessments. In the load appropriateness strand, responses to items revealed that
teachers face additional challenges. Over a third of the teachers reported teaching
content which they see as too difficult for their students. While this may not seem
alarming, keep in mind that the response represents teacher perceptions of the
majority of their students, not just a select few. When the curriculum is too difficult
for most students in a class, there is an extra burden on teachers to bridge the gap
between the expectations of the curriculum and the achievement level of the students.
Almost 90% of the participants indicated that they felt pressure from their
superintendent and principal to raise test scores. In fact, over 50% of the participants
marked “Strongly Agree.” Evidently, the message to teachers about the importance of
raising test scores is being heard loud and clear.
In conjunction with the increases in responsibility and pressure, teachers
reported having less instructional time and less planning time then schedules might
suggest. Over half of the participants stated that their class time was often constrained
by administrative tasks. Almost one-third of the participants agreed that their
planning time was taken away due to non-academic responsibilities such as hall duty,
lunch duty, and bus duty. Close to three-quarters of the participants agreed that their
planning time was often taken away due to academic responsibilities such as meetings,
helping students, proctoring make-up assessments, covering class for an absent
colleague, and grading papers. Taken together, the responses to the load
115
appropriateness items seem to imply that a considerable portion of participants feel
overloaded by the demands of teaching.
Many participants provided elaborating comments on the pressure they
experienced due to testing. A teacher from the Eastern Shore wrote, “Our school has
not made AYP for three years and are facing major consequences should we fail to
meet the standards this year. The pressure from all angles on the math department is
incredible” (A female, mid-career, public middle school teacher from a quartile 1
district, personal communication, October 25, 2006). A suburban Washington teacher
also described severe consequences and the resulting effect on teaching:
Since the inception of NCLB, states are required to administer standardized
tests and expected to have all students performing at the proficient level by a
certain year. That mandate trickles down to the local school board placing
demands and high stress on the teachers to prepare the students to be
successful on these tests. With the threat of losing a job or going into school
improvement, the only hope is to teach the contents of the tests.” (A female,
mid-career, public middle school teacher from a quartile 4 district, personal
communication, October 26, 2006)
Teachers from high-performing districts also expressed feeling pressure. A teacher
from a Baltimore region district explained, “There is pressure to raise scores…at this
time [my district] ranks [very high] and the principals and superintendent do not want
to lose that prestige…no matter what the cost! Everyone feels the pressure” (A female,
late-career, public middle school teacher from a quartile 2, personal communication,
October 31, 2006). The pressure from testing is both pervasive and intense. A teacher
116
wrote, “It is ALL ABOUT THE SCORES!” (A female, mid-career, public high
school teacher from a quartile 1, Baltimore region district, personal communication,
November 2, 2006) and another wrote, “It’s all about making AYP (adequate yearly
progress) period” (A female, mid-career, public high school teacher from a quartile 2,
Baltimore region district, personal communication, November 1, 2006). Teachers
described receiving clear directives regarding testing. A mid-career teacher
commented, “I have been told on several occasions that the only things we are
looking at is 80% of students successfully completing Algebra I by the end of 8th
grade, and making AYP (adequate yearly progress) on the MSA” (A female, public
middle school teacher from a quartile 4, suburban Washington district, personal
communication, November 1, 2006). Another teacher put it bluntly, “I have been told
to teach to the test.” (A female, late-career, public high school teacher from a quartile
1, Baltimore region district, personal communication, November 10, 2006).
Participants also commented on their planning time. One teacher described
how ‘planning time’ was a misnomer:
Duties are arranged so that planning time still exists each day. However, much
of my planning time is taken up with grading papers, recording grades,
running copies, and the occasional class coverage. I do very little actual
planning during school hours. (A male, early-career, public high school
teacher from a quartile 2, Baltimore region district, personal communication,
October 31, 2006)
Teachers also mentioned how meetings frequently intruded into planning time. One
participant stated, “I feel that many meetings we have take away from a teacher’s

117
time to plan for more successful math instruction” (A female, late-career, public
middle school teacher from a quartile 4, suburban Washington district, personal
communication, November 7, 2006). As a result of lost planning time, teachers must
use additional time to complete their work. For example, one teacher explained, “I
feel I am a good teacher but I am overwhelmed with outside influences such as duties
and the millions of meetings we have to do. I am rarely out of the building by 5” (A
female, early-career, public high school teacher from a quartile 2, Baltimore region
district, personal communication, November 1, 2006).
The issue of load appropriateness seemed to strike a chord with one particular
teacher. He wrote at length about his struggle to manage his responsibilities in the
time allotted:
I've been thinking a lot about these questions lately, so much so that you'll
either be especially interested in my responses, or want to ignore them all
together. Frankly, I do not feel that I am a positive influence in any of my
students' lives at the moment. I feel too tired and overworked to do anything
that might actually get a student back on track. I give up my lunch period (5A),
and my lunchtime planning period (5B), and I stay after school to work with
students who need help and to administer re-assessments, but most of this just
feels like I'm putting my proverbial finger in the proverbial dyke- those same
students are still failing, still needing academic support, and ultimately still
needing to reassess the next quiz instead of finding success in their first
attempt. Those students who do at least raise their grades on a reassessment
bring me no real comfort either, as I just chalk their improvement up to the
118
practice effect and the fact that the new quiz was a carbon copy of the old one.
It doesn't help that they confirm my suspicions only days later by asking the
same questions again. It all just seems like so many hoops to jump through-
I'm finding it hard to see the point anymore. Those students who are
legitimately interested in math are grossly outnumbered by those who hide
their disdain of it poorly, or they have been shipped out my classroom and
into a special program anyway. I recognize that I could be doing more- er,
strike that, not so much more as- different things for my students, but right
now academic support and reassessments are taking all of my time. I do intend
to curtail academic support this quarter, hopefully scale it back to about half
as much, and also set predetermined times for reassessing instead of walk-ins.
This will hopefully buy me some time to get back to what matters more and
could actually have more effect on my students. Things like better planned
and more engaging lessons, more group activities, more time to grade things
and give meaningful feedback. I recognize that these are things I need to be
doing, but I just couldn't find the time this quarter. This is due largely to
county duties, but also other activities I have taken on...” (A male, mid-career,
public high school from a quartile 4, suburban Washington district, personal
communication, November 1, 2006)
The responses and elaborating comments on load appropriateness items support the
notion that teachers have high job demands to meet within difficult time constraints.

119
Research Question 2
When tension is measured by the strands of goal congruence, agency, teacher efficacy
and respect, professional interaction, and load appropriateness, to what extent do
teachers of mathematics feel tensions in the conditions of their professional working
environment?
The five hypothesized strands (goal congruence, agency, teacher efficacy and
respect, professional interaction, and load appropriateness) resulted from a review of
literature. The items assigned to each strand were either adapted from other
instruments or created for the purpose of this study. Therefore, it is necessary to
measure the reliability of the collection of items in each strand before analyzing the
extent to which the tensions represented by the strands exist. I used Cronbach’s alpha
to evaluate the internal reliability for the set of items in each strand. The values
computed using SPSS are displayed in Table 20. All alpha values exceed the
minimum 0.60 used to evaluate exploratory research.
Table 20. Internal Reliability Coefficients of Hypothesized Strands Strand Number of Items Cronbach’s Alpha (α)
Goal Congruence 13 .770 Agency 29 .823 Teacher Efficacy and Respect 45 .894 Professional Interaction 6 .629 Load Appropriateness 8 .610
Upon verifying the internal consistency reliability of each strand, I computed
participant composite scores for the five strands. Responses to items which affirmed a
given strand were coded: Strongly Disagree = 1, Disagree = 2, Agree = 3, Strongly
Agree = 4. Responses to items which negated a given strand were reverse coded:
Strongly Disagree = 4, Disagree = 3, Agree = 2, Strongly Agree = 1. A participant
120
composite score is the participant’s mean response for items in a strand. High
composite scores correspond to high levels of agreement with the strand.
To evaluate the extent of tension experienced by teachers of mathematics, I
created histograms of composite scores for each of the five strands. The composite
scores for the goal congruence strand are symmetrical and have a mean of 2.68 as
shown in Figure 8. The distribution of scores shows that participants generally agree
that their beliefs and goals are consistent with those of the school, district, state, and
NCTM. The composite scores for the agency strand are also symmetrical but much
lower (see Figure 9). With a mean of 2.25, the agency scores represent a perceived
lack of decision-making power. The histogram for teacher efficacy and respect is
presented in Figure 10. The scores show that by and large, participants feel they are
teaching effectively and are well-respected by administrators, colleagues, parents, and
students. The scores for the professional interaction strand had both the highest mean
(2.81) and the largest spread (0.44). As shown in Figure 11, the scores indicate that
most participants have adequate opportunities to interact professionally with
colleagues. Composite scores for the load appropriateness strand have a mean of 2.28
which suggests that teachers are faced with an overwhelming workload (see Figure
12). The shape of the load appropriateness histogram is quite normal with a single
outlier on the high end of the scale. Taken together, the five histograms point to
agency and load appropriateness as areas in the working environment that are sources
of tension for teachers.

121
0
10
20
30
40
50
60
1.00
1.13
1.25
1.38
1.50
1.63
1.75
1.88
2.00
2.13
2.25
2.38
2.50
2.63
2.75
2.88
3.00
3.13
3.25
3.38
3.50
3.63
3.75
3.88
4.00
Strand Score
Freq
uenc
y
M = 2.68SD = .39n = 252
Figure 8. Participant composite scores for the goal congruence strand. Scores represent the mean response to the goal congruence
items for a given participant. Lower scores indicate less goal congruence and higher scores represent more goal congruence.
122
Figure 9. Participant composite scores for the agency strand. Scores represent the mean response to the agency items for a given participant. Lower scores indicate less agency and higher scores indicate more agency.
0
10
20
30
40
50
60
1.00
1.13
1.25
1.38
1.50
1.63
1.75
1.88
2.00
2.13
2.25
2.38
2.50
2.63
2.75
2.88
3.00
3.13
3.25
3.38
3.50
3.63
3.75
3.88
4.00
Strand Score
Freq
uenc
y M = 2.25SD = .33n = 252
123
0
10
20
30
40
50
60
1.00
1.13
1.25
1.38
1.50
1.63
1.75
1.88
2.00
2.13
2.25
2.38
2.50
2.63
2.75
2.88
3.00
3.13
3.25
3.38
3.50
3.63
3.75
3.88
4.00
Strand Score
Freq
uenc
y
M = 2.67SD = .33n = 252
Figure 10. Participant composite scores for the teacher efficacy and respect strand. Scores represent the mean response to the teacher
efficacy and respect items for a given participant. Lower scores indicate less efficacy and respect and higher scores indicate more efficacy and respect.

124
0
10
20
30
40
50
60
1.00
1.13
1.25
1.38
1.50
1.63
1.75
1.88
2.00
2.13
2.25
2.38
2.50
2.63
2.75
2.88
3.00
3.13
3.25
3.38
3.50
3.63
3.75
3.88
4.00
Strand Score
Freq
uenc
y
M = 2.81SD = .44n = 252
Figure 11. Participant composite scores for the professional interaction strand. Scores represent the mean response to the professional
interaction items for a given participant. Lower scores indicate fewer professional interactions and higher scores indicate more professional interactions.

125
0
10
20
30
40
50
60
1.00
1.13
1.25
1.38
1.50
1.63
1.75
1.88
2.00
2.13
2.25
2.38
2.50
2.63
2.75
2.88
3.00
3.13
3.25
3.38
3.50
3.63
3.75
3.88
4.00
Strand Score
Freq
uenc
y M = 2.28SD = .42n = 252
Figure 12. Participant composite scores for the load appropriateness strand. Scores represent the mean response to the load
appropriateness items for a given participant. Lower scores indicate an inappropriate load and higher scores indicate an appropriate load.
126
Research Question 3
When tension is measured by the strands of goal congruence, agency, teacher efficacy
and respect, professional interaction, and load appropriateness, are there statistically
significant differences in the feelings of tension perceived by mathematics teachers
when examined in terms of demographic variables?
I used ANOVA analyses to answer the third research question. The ANOVA
testing sought to determine if the mean strand scores differed among demographic
groups.
ANOVA using Strand Scores
Before conducting the ANOVAs, I evaluated the sample to verify that all of
the assumptions of ANOVA (i.e., independent observations, normally distributed
populations, and homogeneous variances) were satisfied. In all cases, the
observations were independent as a result of the design of the survey. Teachers
individually responded to the items through an online survey instrument. Therefore,
how one participant responded had no bearing on how other participants in the same
group responded. I then calculated the skewness and kurtosis statistics to detect
violations of the normality assumption. For the five strands, skewness ranged from
-0.315 to 0.058 and kurtosis ranged from -0.070 to 0.683. These skewness and
kurtosis values are within the expected range of chance fluctuations so the normality
assumption is satisfied. The final assumption, homogeneity of variance, was
determined using Levene’s test. I conducted Levene’s test at the .05 level with a null
hypothesis that the variances were equal. The results from SPSS 15.0 are reported by
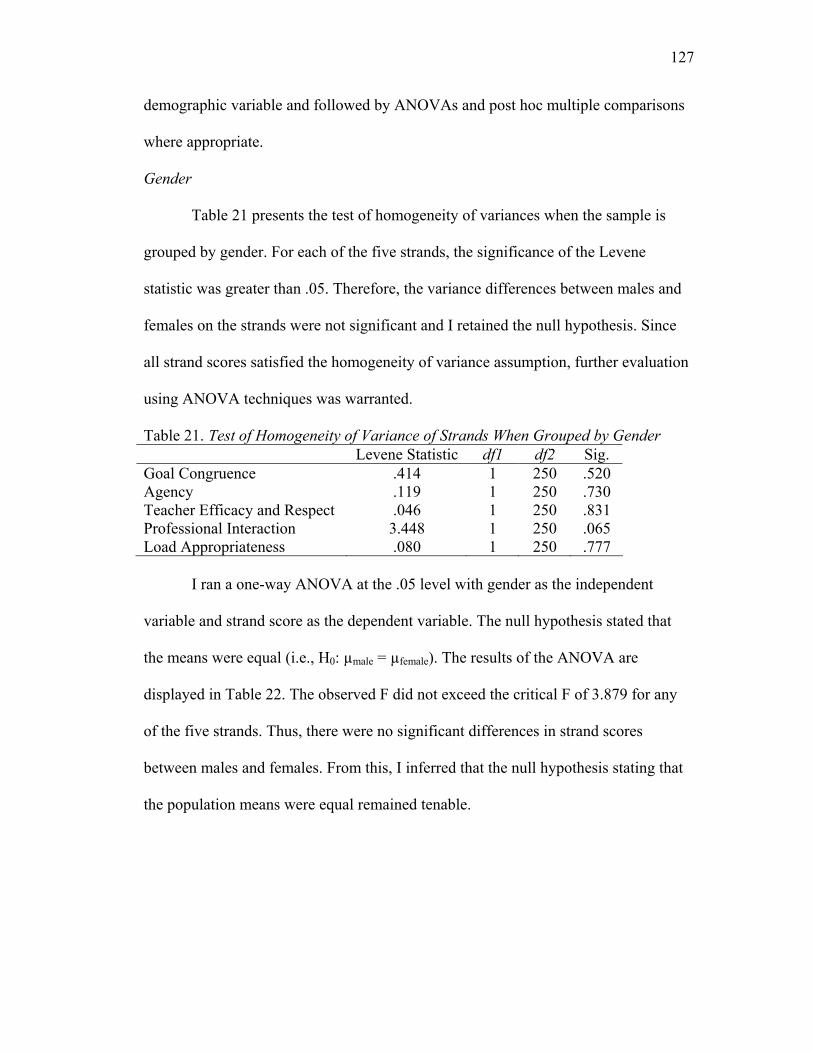
127
demographic variable and followed by ANOVAs and post hoc multiple comparisons
where appropriate.
Gender
Table 21 presents the test of homogeneity of variances when the sample is
grouped by gender. For each of the five strands, the significance of the Levene
statistic was greater than .05. Therefore, the variance differences between males and
females on the strands were not significant and I retained the null hypothesis. Since
all strand scores satisfied the homogeneity of variance assumption, further evaluation
using ANOVA techniques was warranted.
Table 21. Test of Homogeneity of Variance of Strands When Grouped by Gender Levene Statistic df1 df2 Sig.
Goal Congruence .414 1 250 .520 Agency .119 1 250 .730 Teacher Efficacy and Respect .046 1 250 .831 Professional Interaction 3.448 1 250 .065 Load Appropriateness .080 1 250 .777
I ran a one-way ANOVA at the .05 level with gender as the independent
variable and strand score as the dependent variable. The null hypothesis stated that
the means were equal (i.e., H0: µmale = µfemale). The results of the ANOVA are
displayed in Table 22. The observed F did not exceed the critical F of 3.879 for any
of the five strands. Thus, there were no significant differences in strand scores
between males and females. From this, I inferred that the null hypothesis stating that
the population means were equal remained tenable.

128
Table 22. ANOVA of Strands When Grouped by Gender Source SS df MS F Sig.
Between Groups .320 1 .320 Within Groups 37.928 250 .152
Goal Congruence
Total 38.248 251
2.107 .148
Between Groups .363 1 .363 Within Groups 29.088 250 .116
Agency
Total 29.450 251
3.116 .079
Between Groups .262 1 .262 Within Groups 26.273 250 .105
Teacher Efficacy and Respect
Total 26.534 251
2.490 .116
Between Groups .202 1 .202 Within Groups 52.282 250 .209
Professional Interaction
Total 52.484 251
.968 .326
Between Groups .279 1 .279 Within Groups 43.950 250 .176
Load Appropriateness
Total 44.229 251
1.589 .209
School District Size
I also ran Levene’s test with participants grouped by school district size (i.e.,
quartile 1, quartile 2, quartile 3, and quartile 4). I retained the null hypothesis that
variances were equal because the significance values were all greater than .05, as
shown in Table 23. In other words, there were no significant differences in variance
between participants from districts of varying sizes on any of the five strands.
Table 23. Test of Homogeneity of Variance of Strands When Grouped by School District Size
Levene Statistic df1 df2 Sig. Goal Congruence .718 3 240 .542 Agency 1.876 3 240 .134 Teacher Efficacy and Respect 2.134 3 240 .097 Professional Interaction .813 3 240 .488 Load Appropriateness .520 3 240 .669
With the homogeneity of variance requirement met, I ran a one-way ANOVA
at the .05 level with school district size as the independent variable and strand scores
as the dependent variable. The ANOVA results when participants were grouped by
school district size are presented in Table 24. The observed F did not exceed the
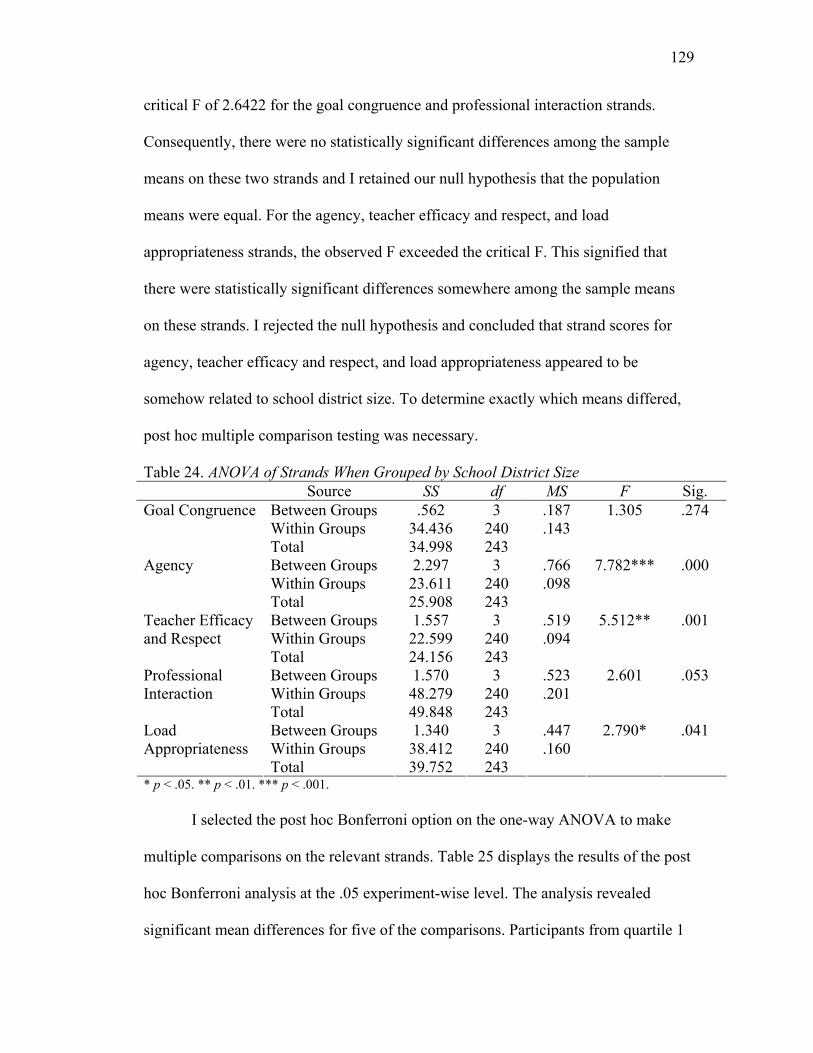
129
critical F of 2.6422 for the goal congruence and professional interaction strands.
Consequently, there were no statistically significant differences among the sample
means on these two strands and I retained our null hypothesis that the population
means were equal. For the agency, teacher efficacy and respect, and load
appropriateness strands, the observed F exceeded the critical F. This signified that
there were statistically significant differences somewhere among the sample means
on these strands. I rejected the null hypothesis and concluded that strand scores for
agency, teacher efficacy and respect, and load appropriateness appeared to be
somehow related to school district size. To determine exactly which means differed,
post hoc multiple comparison testing was necessary.
Table 24. ANOVA of Strands When Grouped by School District Size Source SS df MS F Sig.
Between Groups .562 3 .187 Within Groups 34.436 240 .143
Goal Congruence
Total 34.998 243
1.305 .274
Between Groups 2.297 3 .766 Within Groups 23.611 240 .098
Agency
Total 25.908 243
7.782*** .000
Between Groups 1.557 3 .519 Within Groups 22.599 240 .094
Teacher Efficacy and Respect
Total 24.156 243
5.512** .001
Between Groups 1.570 3 .523 Within Groups 48.279 240 .201
Professional Interaction
Total 49.848 243
2.601 .053
Between Groups 1.340 3 .447 Within Groups 38.412 240 .160
Load Appropriateness
Total 39.752 243
2.790* .041
* p < .05. ** p < .01. *** p < .001.
I selected the post hoc Bonferroni option on the one-way ANOVA to make
multiple comparisons on the relevant strands. Table 25 displays the results of the post
hoc Bonferroni analysis at the .05 experiment-wise level. The analysis revealed
significant mean differences for five of the comparisons. Participants from quartile 1

130
districts had significantly higher mean agency scores (M = 2.43) than participants
from quartile 2 districts (M = 2.18) and participants from quartile 4 districts (M =
2.22). I concluded that on average, teachers in the smallest districts feel more
empowered and able to make decisions than teachers in the small/medium districts
and the largest districts. Teacher efficacy and respect scores from participants in
quartile 1 districts (M = 2.80) were significantly higher than scores from participants
in quartile 2 districts (M = 2.60) and in quartile 4 districts (M = 2.61). Thus, I inferred
that teachers in the smallest districts feel more effective at teaching math and more
respected by administrators, colleagues, parents, and students than teachers in the
small/medium districts and the largest districts. On the load appropriateness strand,
participants from quartile 1 districts had significantly higher scores (M = 2.39) than
participants from quartile 2 districts (M = 2.19). Therefore, teachers in the smallest
districts feel a more appropriate balance between job demands and their ability to
meet those job demands than their peers in slightly larger districts. None of the other
contrasts revealed significant mean differences.
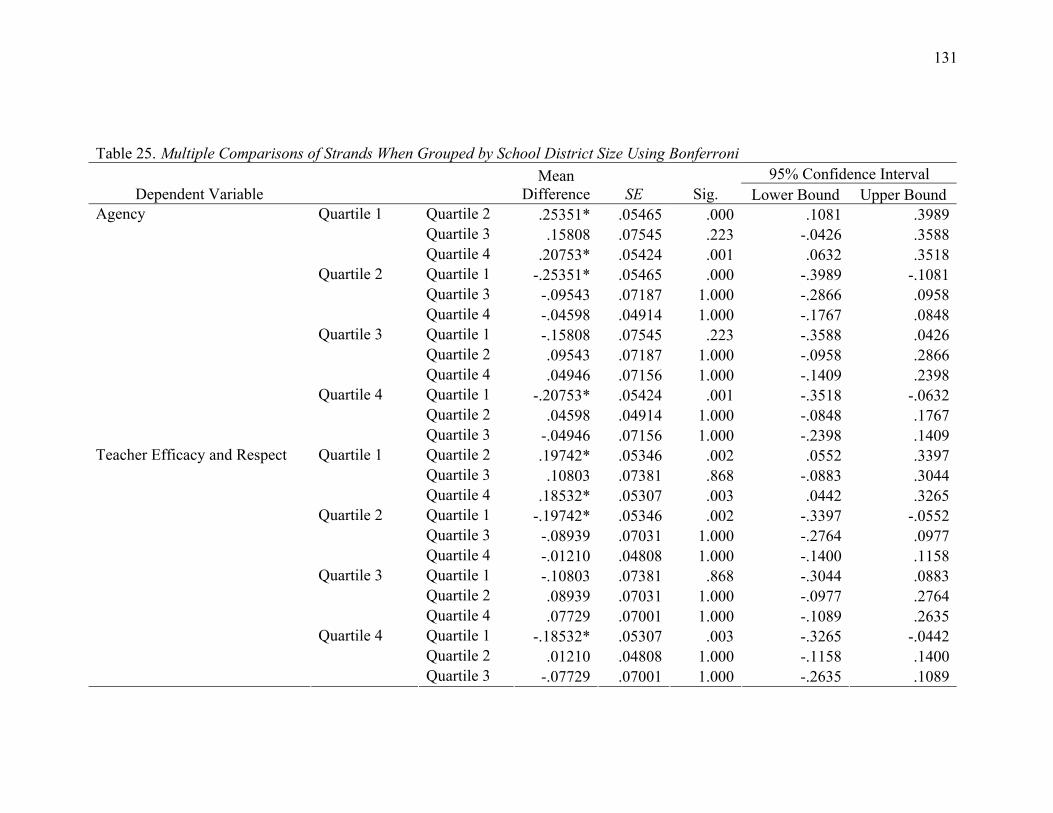
131
Table 25. Multiple Comparisons of Strands When Grouped by School District Size Using Bonferroni 95% Confidence Interval
Dependent Variable Mean
Difference SE Sig. Lower Bound Upper Bound Quartile 2 .25351* .05465 .000 .1081 .3989Quartile 3 .15808 .07545 .223 -.0426 .3588
Quartile 1
Quartile 4 .20753* .05424 .001 .0632 .3518Quartile 1 -.25351* .05465 .000 -.3989 -.1081Quartile 3 -.09543 .07187 1.000 -.2866 .0958
Quartile 2
Quartile 4 -.04598 .04914 1.000 -.1767 .0848Quartile 1 -.15808 .07545 .223 -.3588 .0426Quartile 2 .09543 .07187 1.000 -.0958 .2866
Quartile 3
Quartile 4 .04946 .07156 1.000 -.1409 .2398Quartile 1 -.20753* .05424 .001 -.3518 -.0632Quartile 2 .04598 .04914 1.000 -.0848 .1767
Agency
Quartile 4
Quartile 3 -.04946 .07156 1.000 -.2398 .1409Quartile 2 .19742* .05346 .002 .0552 .3397Quartile 3 .10803 .07381 .868 -.0883 .3044
Quartile 1
Quartile 4 .18532* .05307 .003 .0442 .3265Quartile 1 -.19742* .05346 .002 -.3397 -.0552Quartile 3 -.08939 .07031 1.000 -.2764 .0977
Quartile 2
Quartile 4 -.01210 .04808 1.000 -.1400 .1158Quartile 1 -.10803 .07381 .868 -.3044 .0883Quartile 2 .08939 .07031 1.000 -.0977 .2764
Quartile 3
Quartile 4 .07729 .07001 1.000 -.1089 .2635Quartile 1 -.18532* .05307 .003 -.3265 -.0442Quartile 2 .01210 .04808 1.000 -.1158 .1400
Teacher Efficacy and Respect
Quartile 4
Quartile 3 -.07729 .07001 1.000 -.2635 .1089
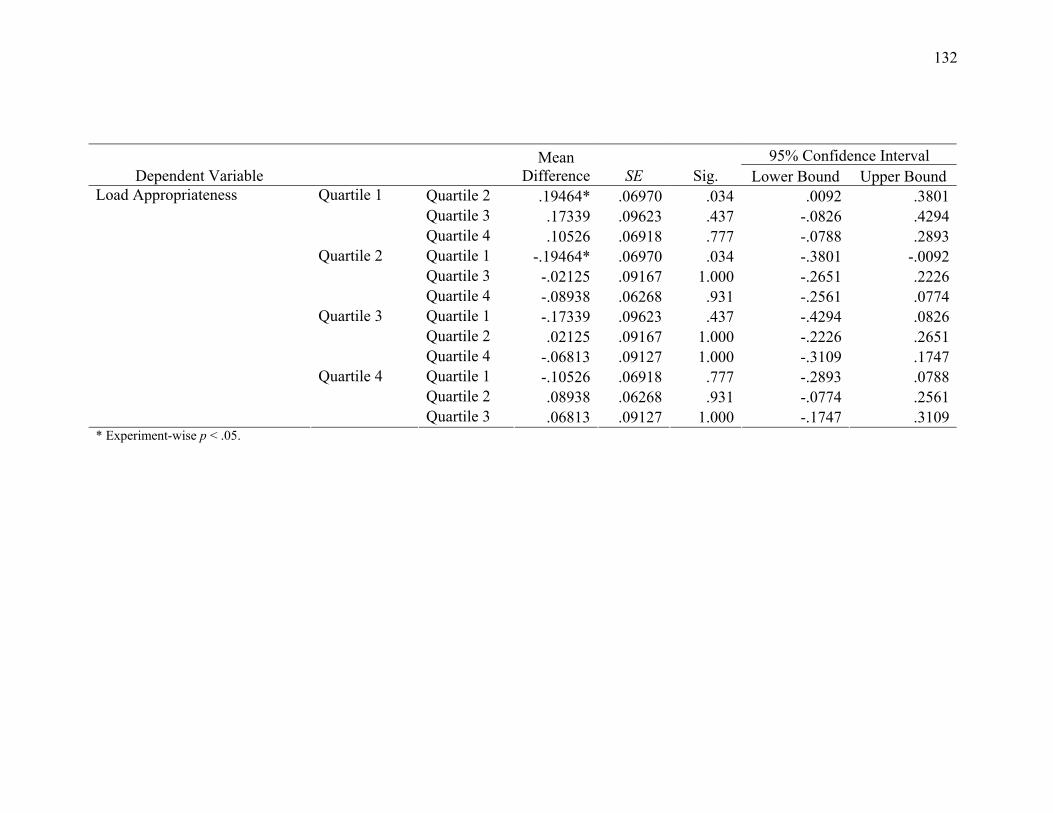
132
95% Confidence Interval Dependent Variable
Mean Difference SE Sig. Lower Bound Upper Bound
Quartile 2 .19464* .06970 .034 .0092 .3801Quartile 3 .17339 .09623 .437 -.0826 .4294
Quartile 1
Quartile 4 .10526 .06918 .777 -.0788 .2893Quartile 1 -.19464* .06970 .034 -.3801 -.0092Quartile 3 -.02125 .09167 1.000 -.2651 .2226
Quartile 2
Quartile 4 -.08938 .06268 .931 -.2561 .0774Quartile 1 -.17339 .09623 .437 -.4294 .0826Quartile 2 .02125 .09167 1.000 -.2226 .2651
Quartile 3
Quartile 4 -.06813 .09127 1.000 -.3109 .1747Quartile 1 -.10526 .06918 .777 -.2893 .0788Quartile 2 .08938 .06268 .931 -.0774 .2561
Load Appropriateness
Quartile 4
Quartile 3 .06813 .09127 1.000 -.1747 .3109* Experiment-wise p < .05.

133
School District Location
When the sample was grouped by school district location (i.e., Baltimore
region, suburban Washington, Southern Maryland, Western Maryland, and Eastern
Shore), the Levene statistic was not significant for any of the strands (see Table 26).
Hence, the variances were homogeneous and further analysis using ANOVA was
appropriate.
Table 26. Test of Homogeneity of Variance of Strands When Grouped by School District Location
Levene Statistic df1 df2 Sig. Goal Congruence .947 3 240 .418 Agency 1.760 3 240 .155 Teacher Efficacy and Respect .697 3 240 .555 Professional Interaction 1.088 3 240 .355 Load Appropriateness .525 3 240 .665
Table 27 presents the results of the one-way ANOVA with school district
location as the independent variable and strand score as the dependent variable. At
the .05 level, the observed F for goal congruence, agency, professional interaction,
and load appropriateness failed to exceed the critical F of 2.6422. I retained the null
hypothesis that the means were equal for these strands. For the teacher efficacy and
respect strand, the observed F did exceed the critical F leading us to reject the null
hypothesis. I concluded that there were statistically significant differences among the
sample means and that teacher efficacy and respect was somehow related to school
district location. To identify which exact locations had mean differences on the
teacher efficacy and respect strand, I ran post hoc multiple comparison tests.

134
Table 27. ANOVA of Strands When Grouped by School District Location Source SS df MS F Sig.
Between Groups .613 3 .204 Within Groups 34.385 240 .143
Goal Congruence
Total 34.998 243
1.426 .236
Between Groups .654 3 .218 Within Groups 25.254 240 .105
Agency
Total 25.908 243
2.071 .105
Between Groups .919 3 .306 Within Groups 23.237 240 .097
Teacher Efficacy and Respect
Total 24.156 243
3.162* .025
Between Groups .287 3 .096 Within Groups 49.561 240 .207
Professional Interaction
Total 49.848 243
.464 .708
Between Groups .942 3 .314 Within Groups 38.810 240 .162
Load Appropriateness
Total 39.752 243
1.941 .124
* p < .05.
The results of the post hoc Bonferroni are displayed in Table 28. Using an
experiment-wise alpha of .05, the post hoc Bonferroni test detected one significant
contrast. Participants from Southern Maryland districts had significantly higher
teacher efficacy and respect scores (M = 2.92) than participants from suburban
Washington districts (M = 2.62). I concluded that Southern Maryland teachers feel
more respected and efficacious than their suburban Washington counterparts. It is
important to note that all of the Southern Maryland districts are quartile 1 districts and
the suburban Washington districts are quartile 2 and quartile 4 districts. I found
similar significant differences when the districts were grouped by size. Therefore, it is
unclear whether the differences are due to size, location, or a combination of those
attributes. The remaining contrasts did not prove to be significant.
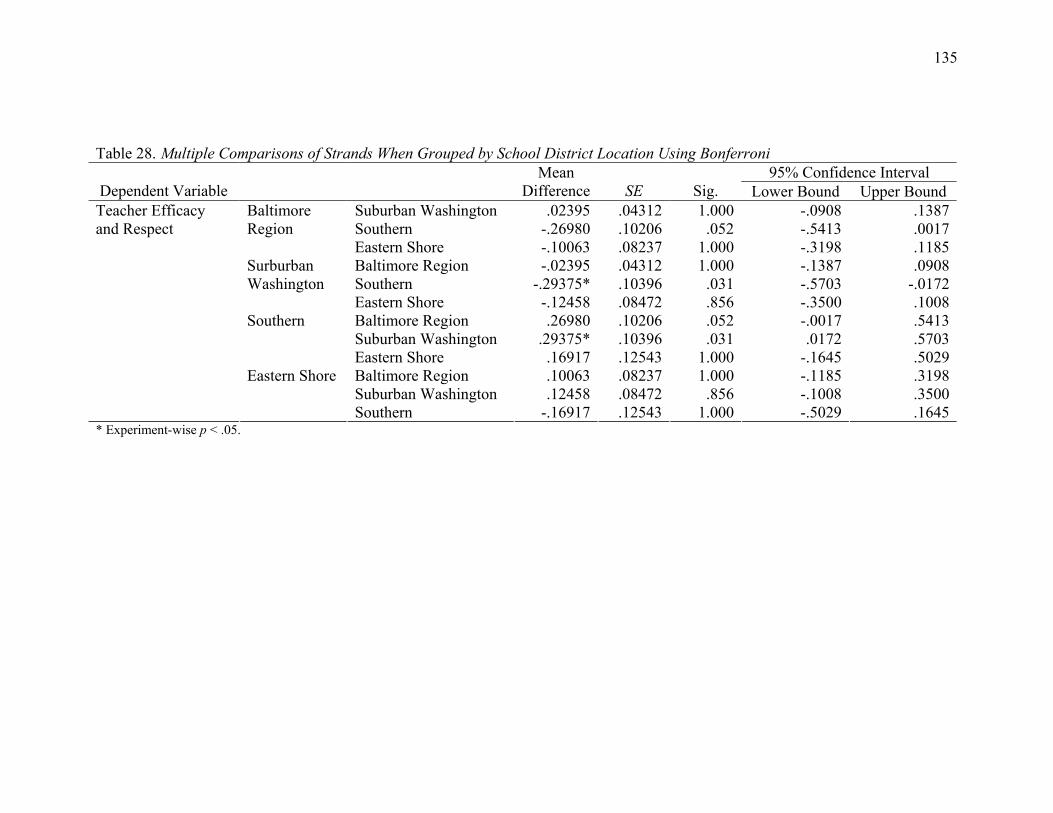
135
Table 28. Multiple Comparisons of Strands When Grouped by School District Location Using Bonferroni 95% Confidence Interval
Dependent Variable Mean
Difference SE Sig. Lower Bound Upper Bound Suburban Washington .02395 .04312 1.000 -.0908 .1387Southern -.26980 .10206 .052 -.5413 .0017
Baltimore Region
Eastern Shore -.10063 .08237 1.000 -.3198 .1185Baltimore Region -.02395 .04312 1.000 -.1387 .0908Southern -.29375* .10396 .031 -.5703 -.0172
Surburban Washington
Eastern Shore -.12458 .08472 .856 -.3500 .1008Baltimore Region .26980 .10206 .052 -.0017 .5413Suburban Washington .29375* .10396 .031 .0172 .5703
Southern
Eastern Shore .16917 .12543 1.000 -.1645 .5029Baltimore Region .10063 .08237 1.000 -.1185 .3198Suburban Washington .12458 .08472 .856 -.1008 .3500
Teacher Efficacy and Respect
Eastern Shore
Southern -.16917 .12543 1.000 -.5029 .1645* Experiment-wise p < .05.
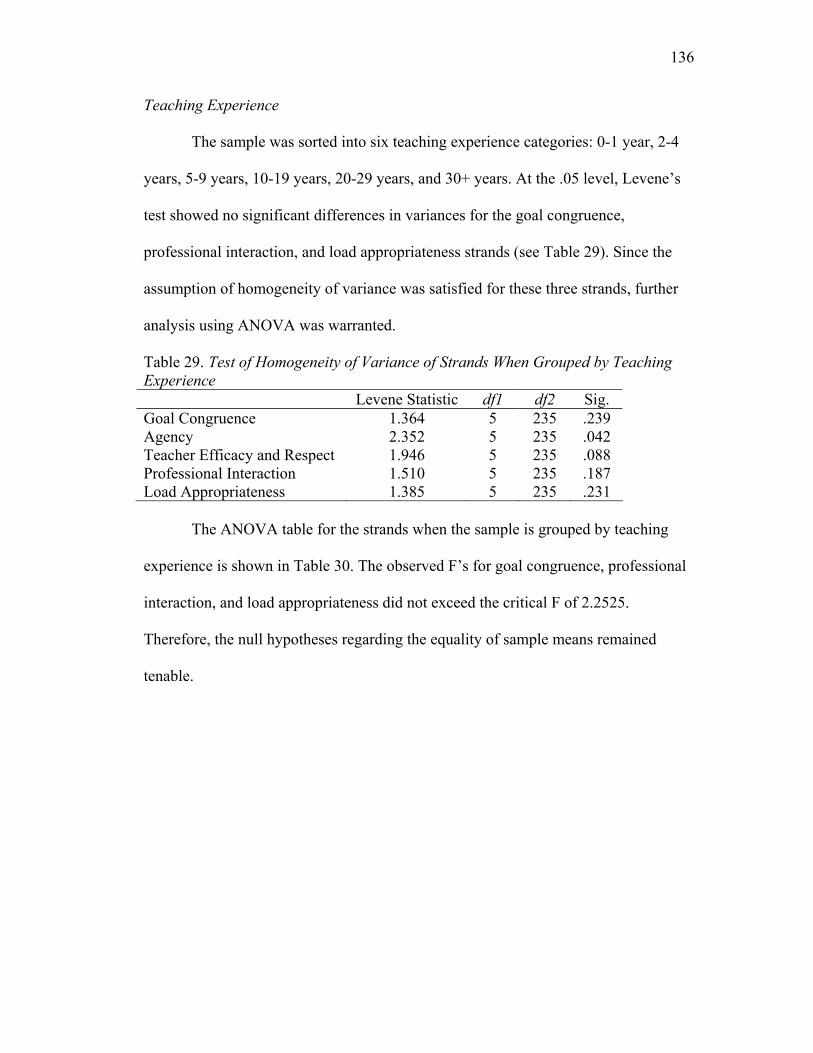
136
Teaching Experience
The sample was sorted into six teaching experience categories: 0-1 year, 2-4
years, 5-9 years, 10-19 years, 20-29 years, and 30+ years. At the .05 level, Levene’s
test showed no significant differences in variances for the goal congruence,
professional interaction, and load appropriateness strands (see Table 29). Since the
assumption of homogeneity of variance was satisfied for these three strands, further
analysis using ANOVA was warranted.
Table 29. Test of Homogeneity of Variance of Strands When Grouped by Teaching Experience
Levene Statistic df1 df2 Sig. Goal Congruence 1.364 5 235 .239 Agency 2.352 5 235 .042 Teacher Efficacy and Respect 1.946 5 235 .088 Professional Interaction 1.510 5 235 .187 Load Appropriateness 1.385 5 235 .231
The ANOVA table for the strands when the sample is grouped by teaching
experience is shown in Table 30. The observed F’s for goal congruence, professional
interaction, and load appropriateness did not exceed the critical F of 2.2525.
Therefore, the null hypotheses regarding the equality of sample means remained
tenable.
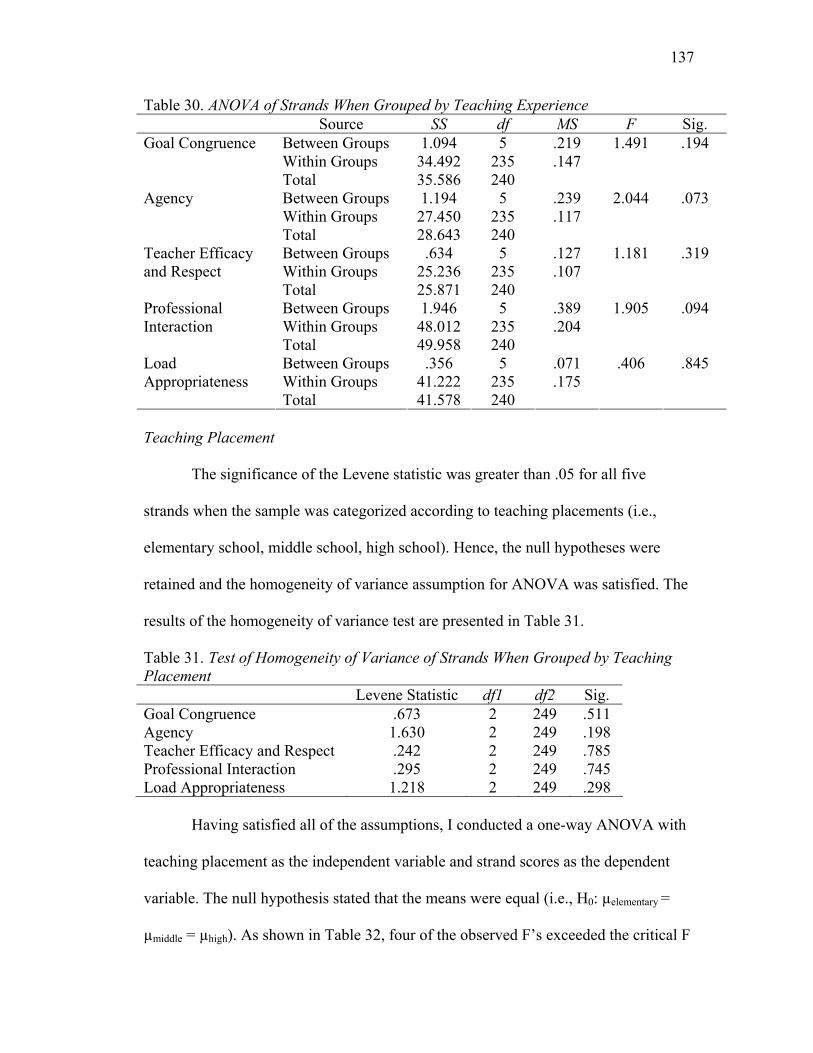
137
Table 30. ANOVA of Strands When Grouped by Teaching Experience Source SS df MS F Sig.
Between Groups 1.094 5 .219 Within Groups 34.492 235 .147
Goal Congruence
Total 35.586 240
1.491 .194
Between Groups 1.194 5 .239 Within Groups 27.450 235 .117
Agency
Total 28.643 240
2.044 .073
Between Groups .634 5 .127 Within Groups 25.236 235 .107
Teacher Efficacy and Respect
Total 25.871 240
1.181 .319
Between Groups 1.946 5 .389 Within Groups 48.012 235 .204
Professional Interaction
Total 49.958 240
1.905 .094
Between Groups .356 5 .071 Within Groups 41.222 235 .175
Load Appropriateness
Total 41.578 240
.406 .845
Teaching Placement
The significance of the Levene statistic was greater than .05 for all five
strands when the sample was categorized according to teaching placements (i.e.,
elementary school, middle school, high school). Hence, the null hypotheses were
retained and the homogeneity of variance assumption for ANOVA was satisfied. The
results of the homogeneity of variance test are presented in Table 31.
Table 31. Test of Homogeneity of Variance of Strands When Grouped by Teaching Placement
Levene Statistic df1 df2 Sig. Goal Congruence .673 2 249 .511 Agency 1.630 2 249 .198 Teacher Efficacy and Respect .242 2 249 .785 Professional Interaction .295 2 249 .745 Load Appropriateness 1.218 2 249 .298
Having satisfied all of the assumptions, I conducted a one-way ANOVA with
teaching placement as the independent variable and strand scores as the dependent
variable. The null hypothesis stated that the means were equal (i.e., H0: µelementary =
µmiddle = µhigh). As shown in Table 32, four of the observed F’s exceeded the critical F
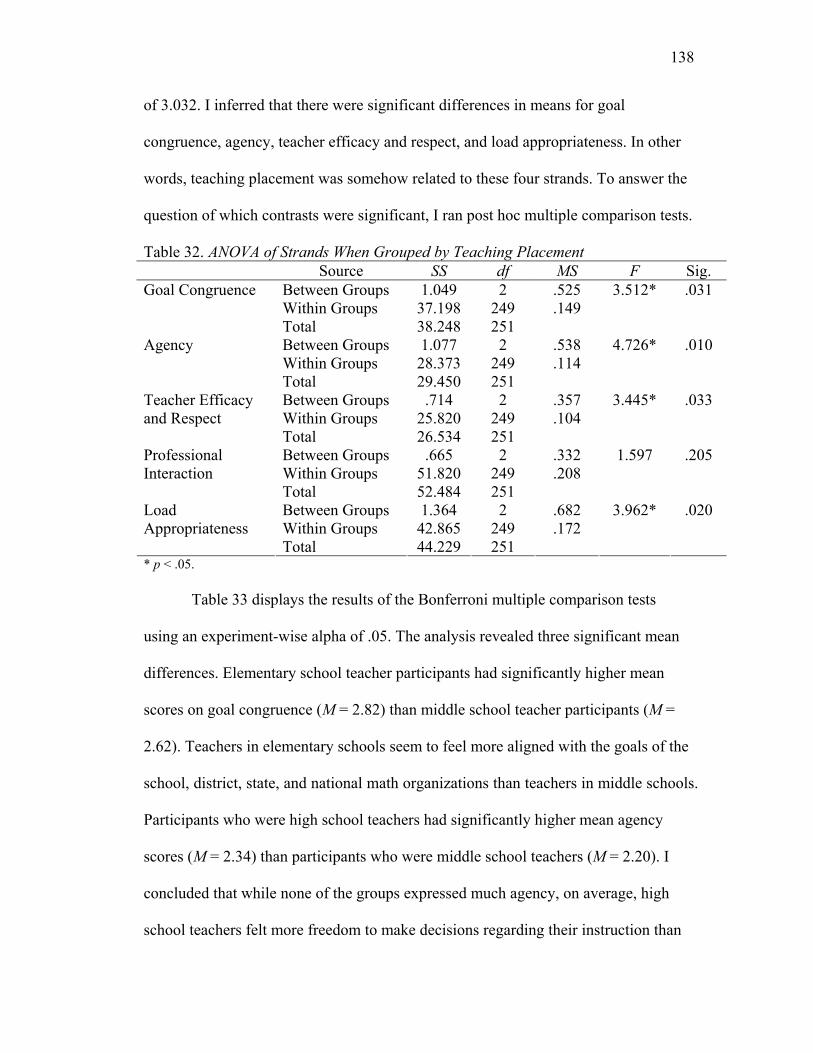
138
of 3.032. I inferred that there were significant differences in means for goal
congruence, agency, teacher efficacy and respect, and load appropriateness. In other
words, teaching placement was somehow related to these four strands. To answer the
question of which contrasts were significant, I ran post hoc multiple comparison tests.
Table 32. ANOVA of Strands When Grouped by Teaching Placement Source SS df MS F Sig.
Between Groups 1.049 2 .525 Within Groups 37.198 249 .149
Goal Congruence
Total 38.248 251
3.512* .031
Between Groups 1.077 2 .538 Within Groups 28.373 249 .114
Agency
Total 29.450 251
4.726* .010
Between Groups .714 2 .357 Within Groups 25.820 249 .104
Teacher Efficacy and Respect
Total 26.534 251
3.445* .033
Between Groups .665 2 .332 Within Groups 51.820 249 .208
Professional Interaction
Total 52.484 251
1.597 .205
Between Groups 1.364 2 .682 Within Groups 42.865 249 .172
Load Appropriateness
Total 44.229 251
3.962* .020
* p < .05.
Table 33 displays the results of the Bonferroni multiple comparison tests
using an experiment-wise alpha of .05. The analysis revealed three significant mean
differences. Elementary school teacher participants had significantly higher mean
scores on goal congruence (M = 2.82) than middle school teacher participants (M =
2.62). Teachers in elementary schools seem to feel more aligned with the goals of the
school, district, state, and national math organizations than teachers in middle schools.
Participants who were high school teachers had significantly higher mean agency
scores (M = 2.34) than participants who were middle school teachers (M = 2.20). I
concluded that while none of the groups expressed much agency, on average, high
school teachers felt more freedom to make decisions regarding their instruction than

139
middle school teachers. This result may be due to the large number of high school
courses that are not subject to high-stakes assessments. On the load appropriateness
strand, participants from elementary schools had significantly higher mean scores (M
= 2.45) than participants from middle schools (M = 2.21). I inferred that elementary
school teachers sense a better fit between job responsibilities and job resources than
middle school teachers even though both groups fall on the low side of the scale. No
other significant mean differences were found.
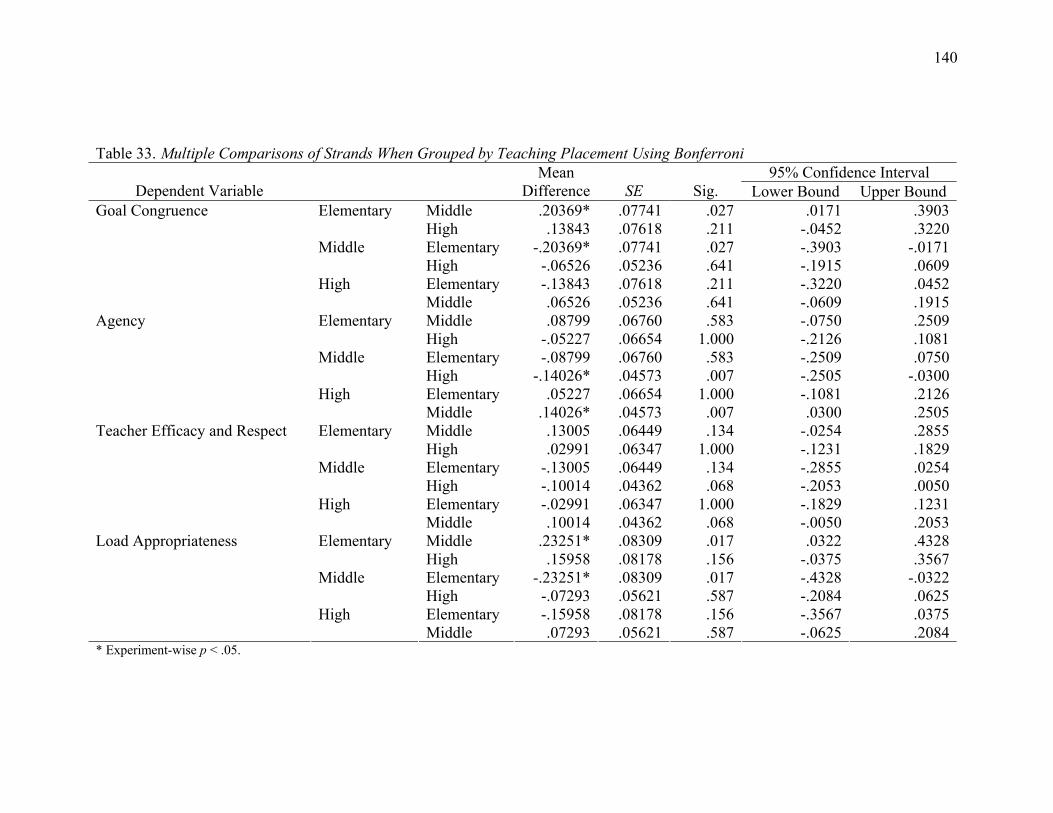
140
Table 33. Multiple Comparisons of Strands When Grouped by Teaching Placement Using Bonferroni 95% Confidence Interval
Dependent Variable Mean
Difference SE Sig. Lower Bound Upper Bound Middle .20369* .07741 .027 .0171 .3903Elementary High .13843 .07618 .211 -.0452 .3220Elementary -.20369* .07741 .027 -.3903 -.0171Middle High -.06526 .05236 .641 -.1915 .0609Elementary -.13843 .07618 .211 -.3220 .0452
Goal Congruence
High Middle .06526 .05236 .641 -.0609 .1915Middle .08799 .06760 .583 -.0750 .2509Elementary High -.05227 .06654 1.000 -.2126 .1081Elementary -.08799 .06760 .583 -.2509 .0750Middle High -.14026* .04573 .007 -.2505 -.0300Elementary .05227 .06654 1.000 -.1081 .2126
Agency
High Middle .14026* .04573 .007 .0300 .2505Middle .13005 .06449 .134 -.0254 .2855Elementary High .02991 .06347 1.000 -.1231 .1829Elementary -.13005 .06449 .134 -.2855 .0254Middle High -.10014 .04362 .068 -.2053 .0050Elementary -.02991 .06347 1.000 -.1829 .1231
Teacher Efficacy and Respect
High Middle .10014 .04362 .068 -.0050 .2053Middle .23251* .08309 .017 .0322 .4328Elementary High .15958 .08178 .156 -.0375 .3567Elementary -.23251* .08309 .017 -.4328 -.0322Middle High -.07293 .05621 .587 -.2084 .0625Elementary -.15958 .08178 .156 -.3567 .0375
Load Appropriateness
High Middle .07293 .05621 .587 -.0625 .2084
* Experiment-wise p < .05.
141
Up to this point, the data has been analyzed using my initial theory that
working conditions of mathematics teachers could be represented in five dimensions
(strands). To explore whether these five dimensions adequately describe working
conditions of mathematics teachers, I conducted a factor analysis. The six factors
which resulted were in fact conceptually quite similar to the hypothesized strands. For
instance, the locus of instructional control and level of autonomy factors share key
attributes with the agency strand. The benefit of using the six factors is that they
appear to provide a clearer perspective on the working conditions of mathematics
teachers. What follows then is an analysis of the survey data using the six factors
derived from factor analysis.
Research Question 4
When tension is measured by the factors identified through factor analysis, to what
extent do teachers of mathematics feel tensions in the conditions of their professional
working environment?
Factor analysis, using principal components analysis as the method of
extraction, produced six composite factors. Before conducting statistical analysis with
these factors as dependent variables, I assessed the internal consistency reliability of
the set of items in each factor. Table 34 contains Cronbach’s alpha coefficients for the
six factors. The items in the first three factors are highly reliable and the items in the
last three factors are sufficiently reliable for the purposes of this study.
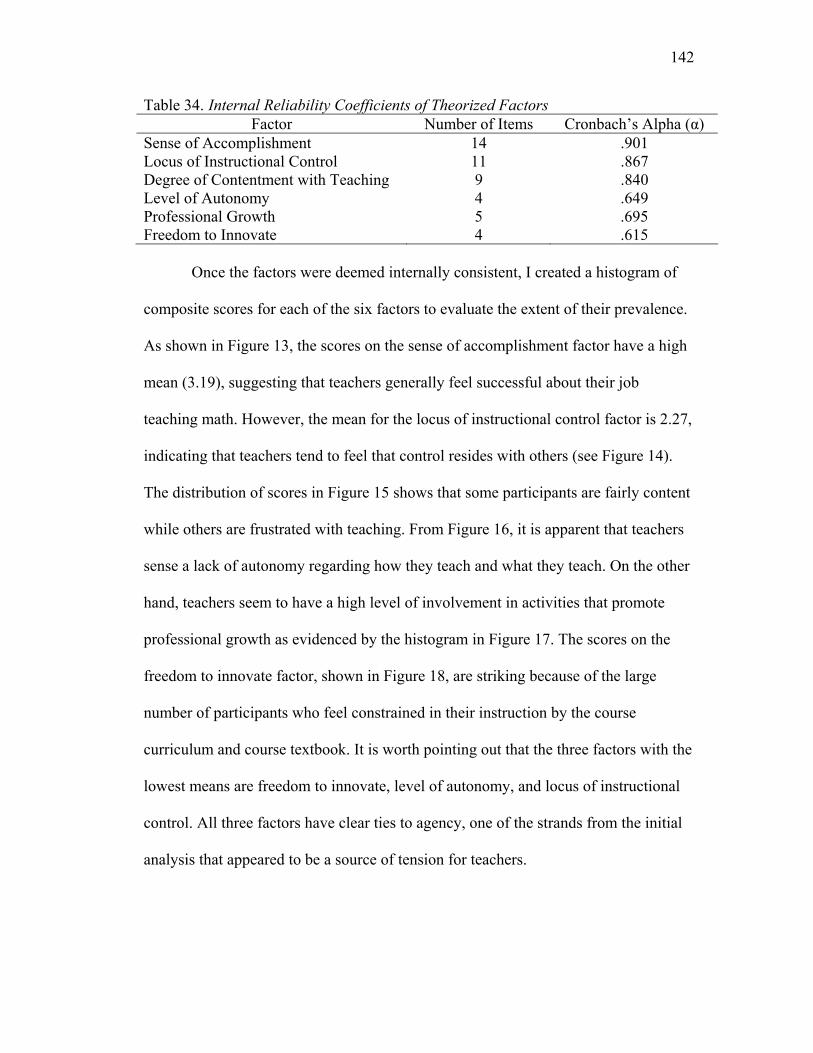
142
Table 34. Internal Reliability Coefficients of Theorized Factors Factor Number of Items Cronbach’s Alpha (α)
Sense of Accomplishment 14 .901 Locus of Instructional Control 11 .867 Degree of Contentment with Teaching 9 .840 Level of Autonomy 4 .649 Professional Growth 5 .695 Freedom to Innovate 4 .615
Once the factors were deemed internally consistent, I created a histogram of
composite scores for each of the six factors to evaluate the extent of their prevalence.
As shown in Figure 13, the scores on the sense of accomplishment factor have a high
mean (3.19), suggesting that teachers generally feel successful about their job
teaching math. However, the mean for the locus of instructional control factor is 2.27,
indicating that teachers tend to feel that control resides with others (see Figure 14).
The distribution of scores in Figure 15 shows that some participants are fairly content
while others are frustrated with teaching. From Figure 16, it is apparent that teachers
sense a lack of autonomy regarding how they teach and what they teach. On the other
hand, teachers seem to have a high level of involvement in activities that promote
professional growth as evidenced by the histogram in Figure 17. The scores on the
freedom to innovate factor, shown in Figure 18, are striking because of the large
number of participants who feel constrained in their instruction by the course
curriculum and course textbook. It is worth pointing out that the three factors with the
lowest means are freedom to innovate, level of autonomy, and locus of instructional
control. All three factors have clear ties to agency, one of the strands from the initial
analysis that appeared to be a source of tension for teachers.
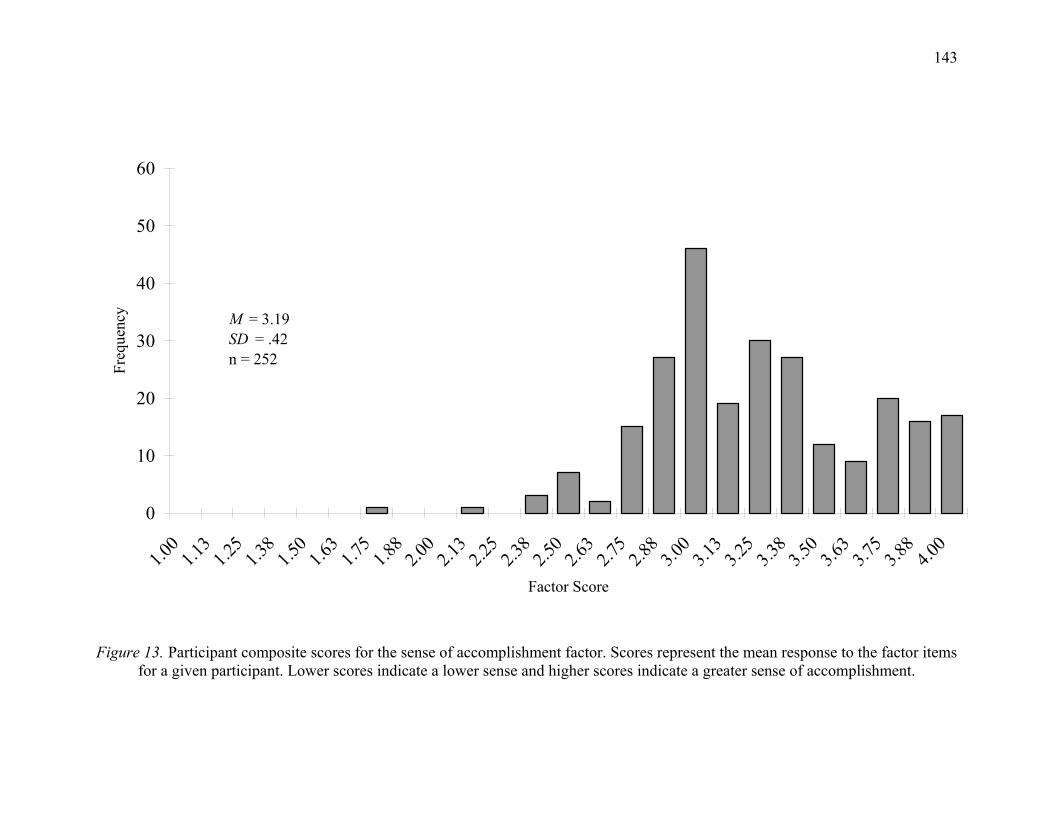
143
0
10
20
30
40
50
60
1.00
1.13
1.25
1.38
1.50
1.63
1.75
1.88
2.00
2.13
2.25
2.38
2.50
2.63
2.75
2.88
3.00
3.13
3.25
3.38
3.50
3.63
3.75
3.88
4.00
Factor Score
Freq
uenc
y M = 3.19SD = .42n = 252
Figure 13. Participant composite scores for the sense of accomplishment factor. Scores represent the mean response to the factor items
for a given participant. Lower scores indicate a lower sense and higher scores indicate a greater sense of accomplishment.

144
Figure 14. Participant composite scores for the locus of instructional control factor. Scores represent the mean response to the factor items for a given participant. Lower scores indicate an external locus of control and higher scores indicate an internal locus of control.
0
10
20
30
40
50
60
1.00
1.13
1.25
1.38
1.50
1.63
1.75
1.88
2.00
2.13
2.25
2.38
2.50
2.63
2.75
2.88
3.00
3.13
3.25
3.38
3.50
3.63
3.75
3.88
4.00
Factor Score
Freq
uenc
y M = 2.27SD = .58n = 252
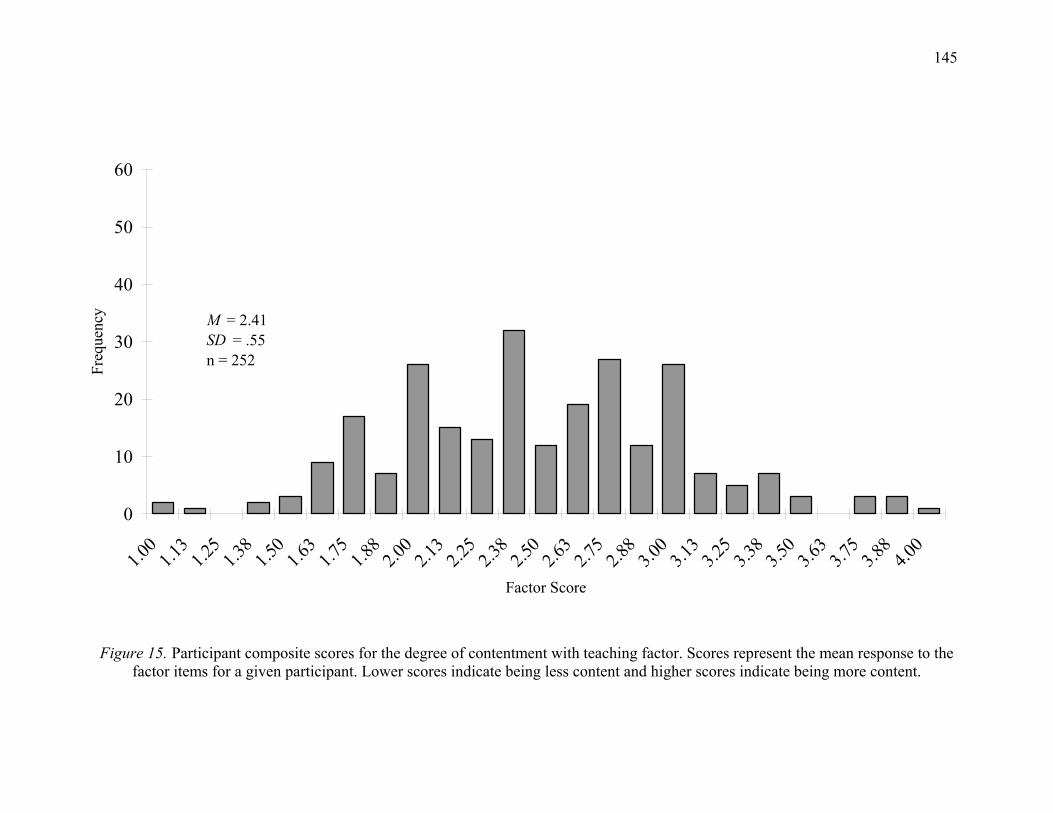
145
Figure 15. Participant composite scores for the degree of contentment with teaching factor. Scores represent the mean response to the factor items for a given participant. Lower scores indicate being less content and higher scores indicate being more content.
0
10
20
30
40
50
60
1.00
1.13
1.25
1.38
1.50
1.63
1.75
1.88
2.00
2.13
2.25
2.38
2.50
2.63
2.75
2.88
3.00
3.13
3.25
3.38
3.50
3.63
3.75
3.88
4.00
Factor Score
Freq
uenc
y M = 2.41SD = .55n = 252
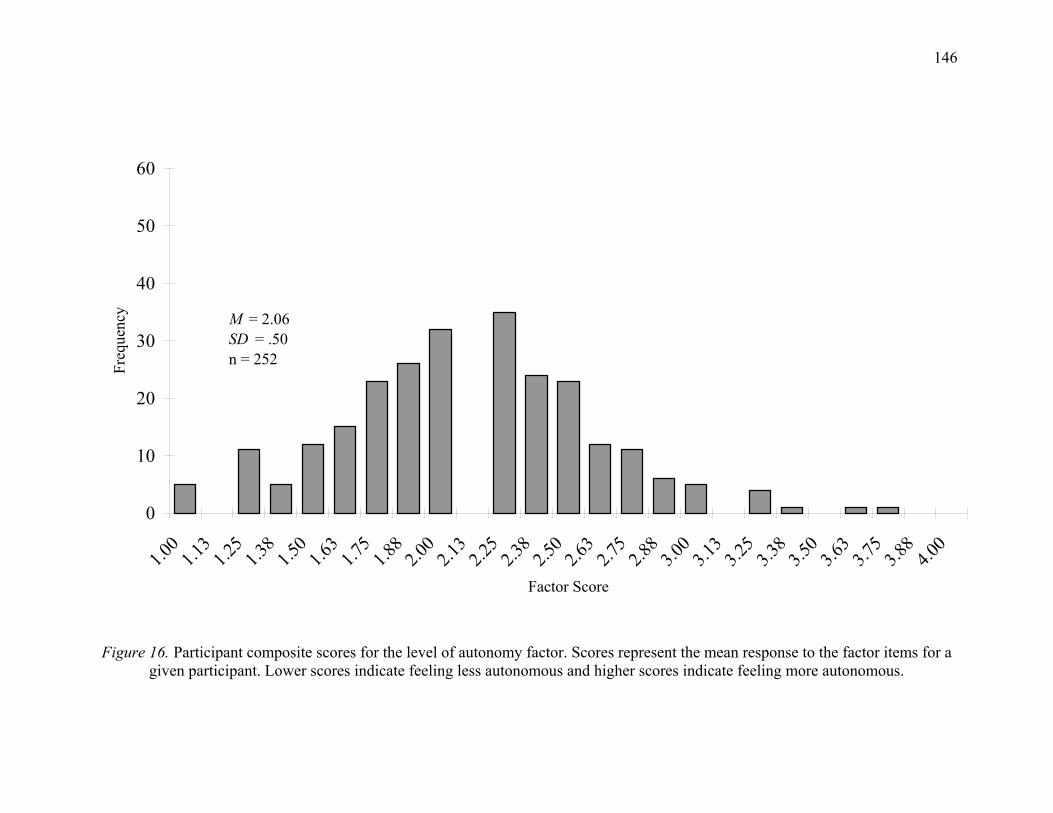
146
0
10
20
30
40
50
60
1.00
1.13
1.25
1.38
1.50
1.63
1.75
1.88
2.00
2.13
2.25
2.38
2.50
2.63
2.75
2.88
3.00
3.13
3.25
3.38
3.50
3.63
3.75
3.88
4.00
Factor Score
Freq
uenc
y M = 2.06SD = .50n = 252
Figure 16. Participant composite scores for the level of autonomy factor. Scores represent the mean response to the factor items for a
given participant. Lower scores indicate feeling less autonomous and higher scores indicate feeling more autonomous.
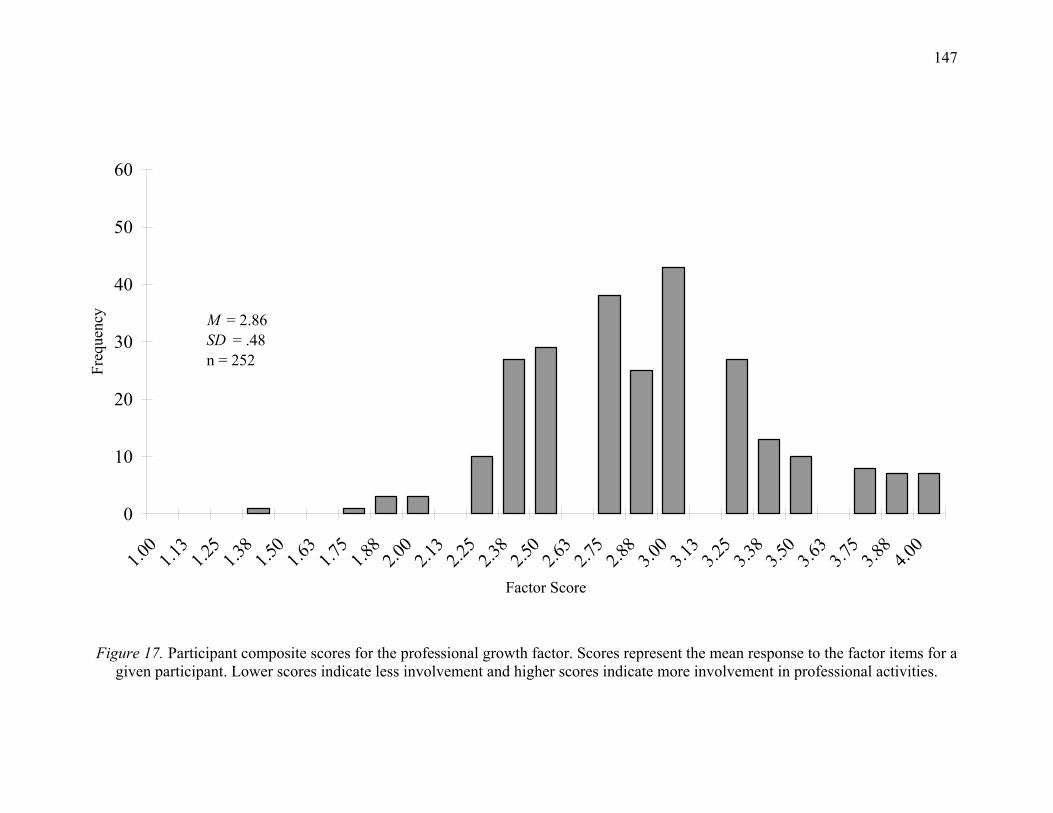
147
Figure 17. Participant composite scores for the professional growth factor. Scores represent the mean response to the factor items for a given participant. Lower scores indicate less involvement and higher scores indicate more involvement in professional activities.
0
10
20
30
40
50
60
1.00
1.13
1.25
1.38
1.50
1.63
1.75
1.88
2.00
2.13
2.25
2.38
2.50
2.63
2.75
2.88
3.00
3.13
3.25
3.38
3.50
3.63
3.75
3.88
4.00
Factor Score
Freq
uenc
y M = 2.86SD = .48n = 252
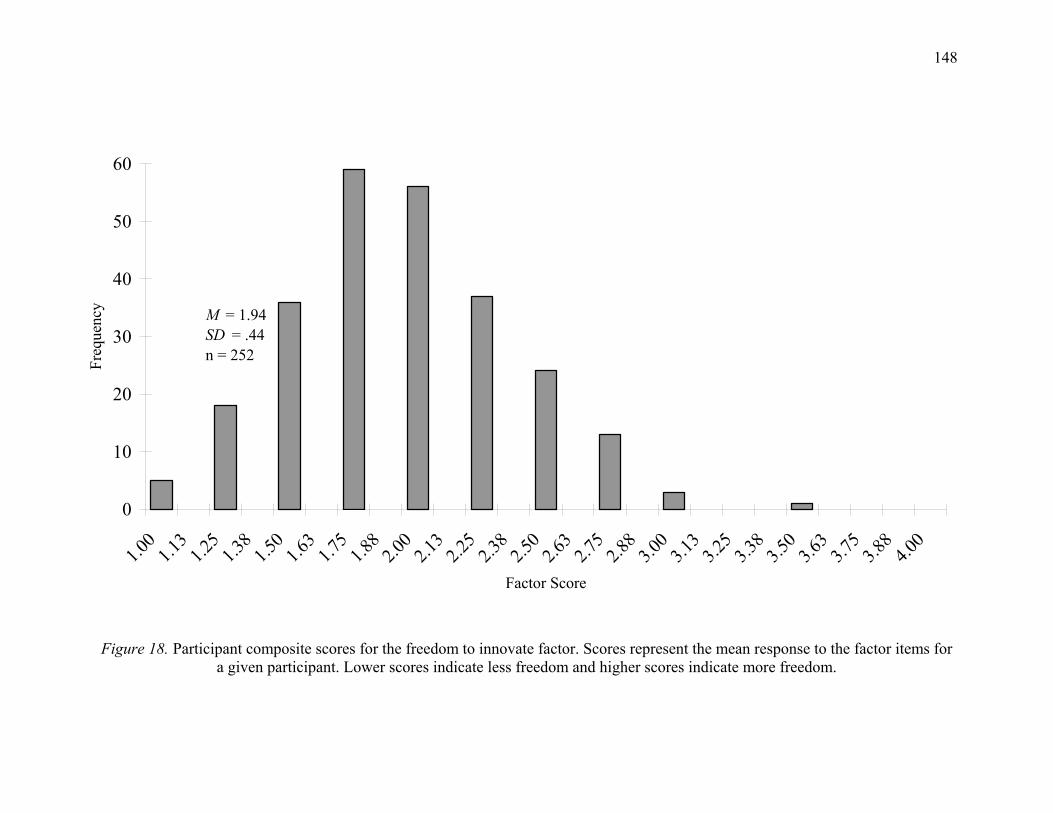
148
Figure 18. Participant composite scores for the freedom to innovate factor. Scores represent the mean response to the factor items for a given participant. Lower scores indicate less freedom and higher scores indicate more freedom.
0
10
20
30
40
50
60
1.00
1.13
1.25
1.38
1.50
1.63
1.75
1.88
2.00
2.13
2.25
2.38
2.50
2.63
2.75
2.88
3.00
3.13
3.25
3.38
3.50
3.63
3.75
3.88
4.00
Factor Score
Freq
uenc
y M = 1.94SD = .44n = 252

149
Research Question 5
When tension is measured by the factors identified through factor analysis, are there
statistically significant differences in the feelings of tension perceived by mathematics
teachers when examined in terms of demographic variables?
I used ANOVA analyses to answer the fifth research question. The ANOVA
testing sought to determine if the mean factor scores differed among demographic
groups.
ANOVA using Factor Scores
I began by evaluating the sample to verify that all of the assumptions of
ANOVA (i.e., independent observations, normally distributed populations, and
homogeneous variances) were met. Participants completed the surveys individually
meaning that how one participant responded had no bearing on how other participants
responded. As a result, the observations were independent. To detect violations of the
normality assumption, I computed the skewness and kurtosis statistics. Skewness
ranged from 0.004 to 0.312 and kurtosis ranged from -0.158 to 0.252 for the six
factors. These skewness and kurtosis values are within the expected range of chance
fluctuations so the normality assumption is satisfied. I used Levene’s test to verify
that the variances were homogeneous. For each of the demographic variables, I
conducted the test at the .05 level with a null hypothesis that the variances of the
factor scores were equal. The results from SPSS 15.0 are reported by demographic
variable and followed by ANOVAs and post hoc multiple comparisons where
appropriate.
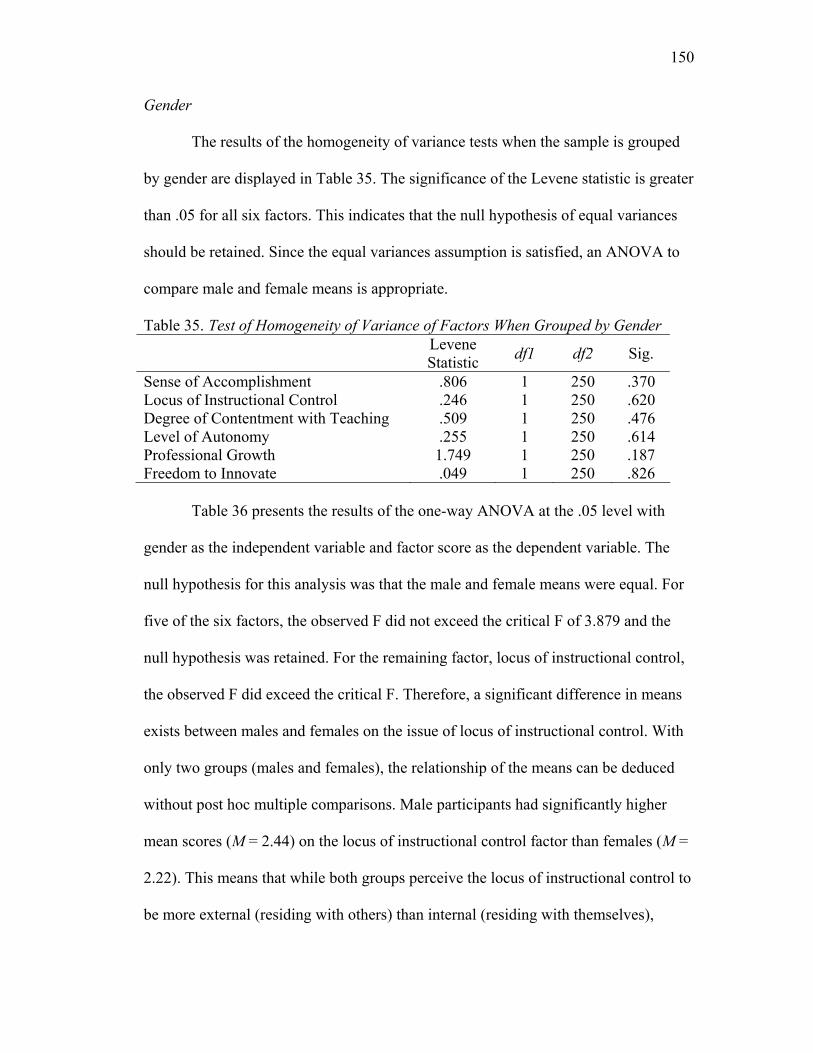
150
Gender
The results of the homogeneity of variance tests when the sample is grouped
by gender are displayed in Table 35. The significance of the Levene statistic is greater
than .05 for all six factors. This indicates that the null hypothesis of equal variances
should be retained. Since the equal variances assumption is satisfied, an ANOVA to
compare male and female means is appropriate.
Table 35. Test of Homogeneity of Variance of Factors When Grouped by Gender
Levene Statistic df1 df2 Sig.
Sense of Accomplishment .806 1 250 .370 Locus of Instructional Control .246 1 250 .620 Degree of Contentment with Teaching .509 1 250 .476 Level of Autonomy .255 1 250 .614 Professional Growth 1.749 1 250 .187 Freedom to Innovate .049 1 250 .826 Table 36 presents the results of the one-way ANOVA at the .05 level with
gender as the independent variable and factor score as the dependent variable. The
null hypothesis for this analysis was that the male and female means were equal. For
five of the six factors, the observed F did not exceed the critical F of 3.879 and the
null hypothesis was retained. For the remaining factor, locus of instructional control,
the observed F did exceed the critical F. Therefore, a significant difference in means
exists between males and females on the issue of locus of instructional control. With
only two groups (males and females), the relationship of the means can be deduced
without post hoc multiple comparisons. Male participants had significantly higher
mean scores (M = 2.44) on the locus of instructional control factor than females (M =
2.22). This means that while both groups perceive the locus of instructional control to
be more external (residing with others) than internal (residing with themselves),
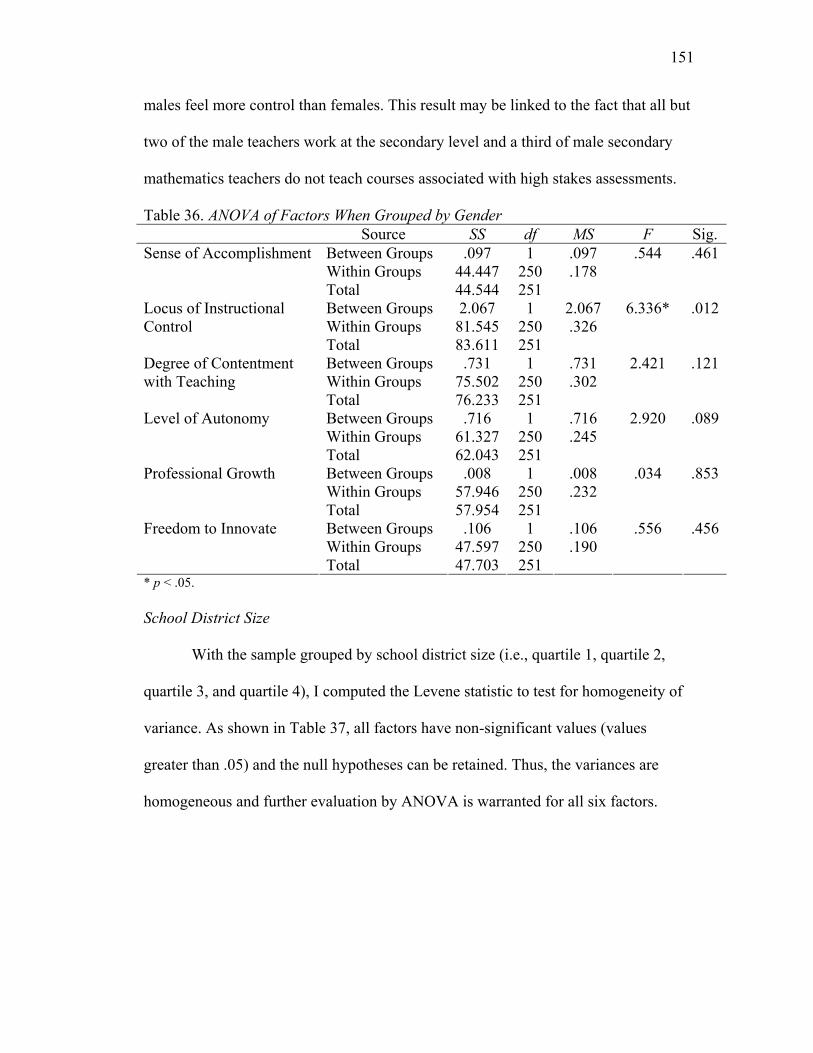
151
males feel more control than females. This result may be linked to the fact that all but
two of the male teachers work at the secondary level and a third of male secondary
mathematics teachers do not teach courses associated with high stakes assessments.
Table 36. ANOVA of Factors When Grouped by Gender Source SS df MS F Sig.
Between Groups .097 1 .097 Within Groups 44.447 250 .178
Sense of Accomplishment
Total 44.544 251
.544 .461
Between Groups 2.067 1 2.067 Within Groups 81.545 250 .326
Locus of Instructional Control
Total 83.611 251
6.336* .012
Between Groups .731 1 .731 Within Groups 75.502 250 .302
Degree of Contentment with Teaching
Total 76.233 251
2.421 .121
Between Groups .716 1 .716 Within Groups 61.327 250 .245
Level of Autonomy
Total 62.043 251
2.920 .089
Between Groups .008 1 .008 Within Groups 57.946 250 .232
Professional Growth
Total 57.954 251
.034 .853
Between Groups .106 1 .106 Within Groups 47.597 250 .190
Freedom to Innovate
Total 47.703 251
.556 .456
* p < .05. School District Size
With the sample grouped by school district size (i.e., quartile 1, quartile 2,
quartile 3, and quartile 4), I computed the Levene statistic to test for homogeneity of
variance. As shown in Table 37, all factors have non-significant values (values
greater than .05) and the null hypotheses can be retained. Thus, the variances are
homogeneous and further evaluation by ANOVA is warranted for all six factors.
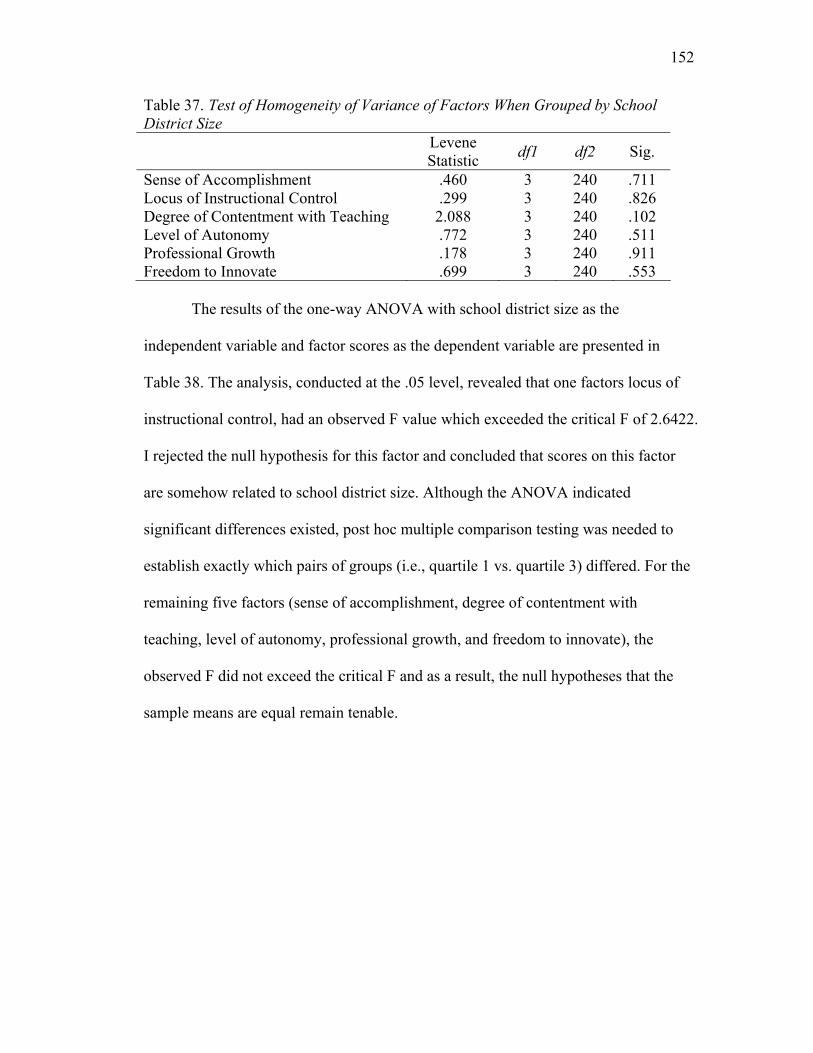
152
Table 37. Test of Homogeneity of Variance of Factors When Grouped by School District Size
Levene Statistic df1 df2 Sig.
Sense of Accomplishment .460 3 240 .711 Locus of Instructional Control .299 3 240 .826 Degree of Contentment with Teaching 2.088 3 240 .102 Level of Autonomy .772 3 240 .511 Professional Growth .178 3 240 .911 Freedom to Innovate .699 3 240 .553 The results of the one-way ANOVA with school district size as the
independent variable and factor scores as the dependent variable are presented in
Table 38. The analysis, conducted at the .05 level, revealed that one factors locus of
instructional control, had an observed F value which exceeded the critical F of 2.6422.
I rejected the null hypothesis for this factor and concluded that scores on this factor
are somehow related to school district size. Although the ANOVA indicated
significant differences existed, post hoc multiple comparison testing was needed to
establish exactly which pairs of groups (i.e., quartile 1 vs. quartile 3) differed. For the
remaining five factors (sense of accomplishment, degree of contentment with
teaching, level of autonomy, professional growth, and freedom to innovate), the
observed F did not exceed the critical F and as a result, the null hypotheses that the
sample means are equal remain tenable.
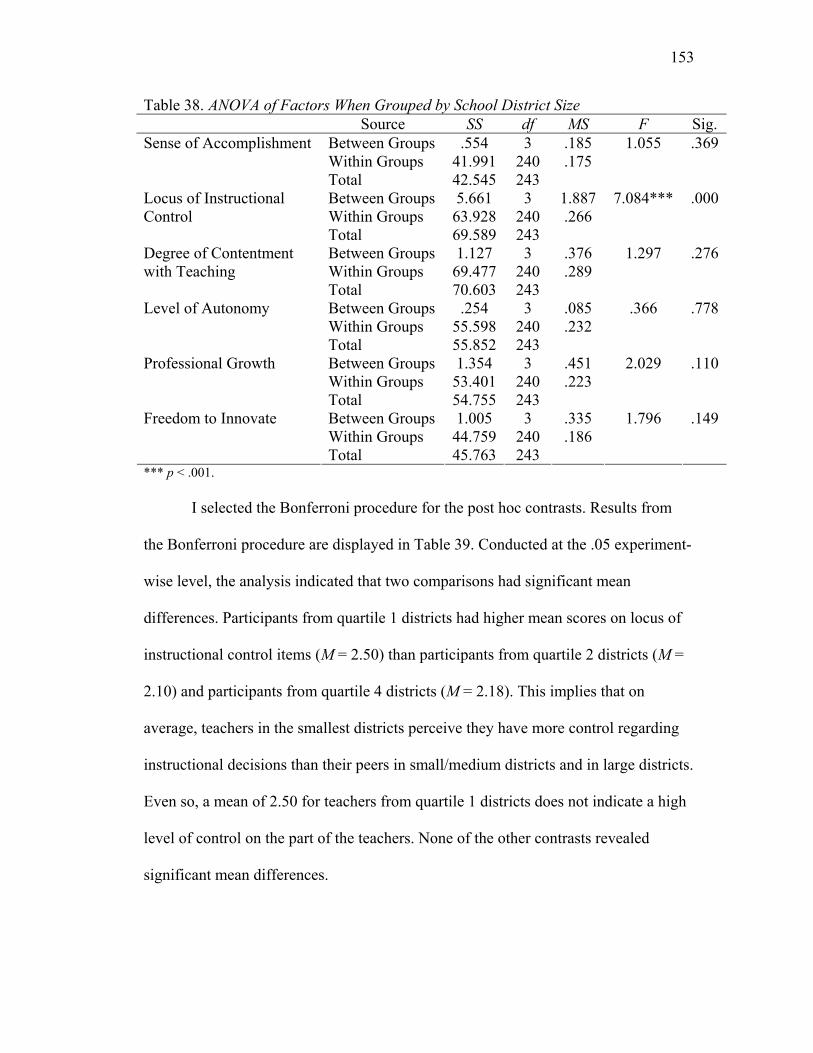
153
Table 38. ANOVA of Factors When Grouped by School District Size Source SS df MS F Sig.
Between Groups .554 3 .185 Within Groups 41.991 240 .175
Sense of Accomplishment
Total 42.545 243
1.055 .369
Between Groups 5.661 3 1.887 Within Groups 63.928 240 .266
Locus of Instructional Control
Total 69.589 243
7.084*** .000
Between Groups 1.127 3 .376 Within Groups 69.477 240 .289
Degree of Contentment with Teaching
Total 70.603 243
1.297 .276
Between Groups .254 3 .085 Within Groups 55.598 240 .232
Level of Autonomy
Total 55.852 243
.366 .778
Between Groups 1.354 3 .451 Within Groups 53.401 240 .223
Professional Growth
Total 54.755 243
2.029 .110
Between Groups 1.005 3 .335 Within Groups 44.759 240 .186
Freedom to Innovate
Total 45.763 243
1.796 .149
*** p < .001. I selected the Bonferroni procedure for the post hoc contrasts. Results from
the Bonferroni procedure are displayed in Table 39. Conducted at the .05 experiment-
wise level, the analysis indicated that two comparisons had significant mean
differences. Participants from quartile 1 districts had higher mean scores on locus of
instructional control items (M = 2.50) than participants from quartile 2 districts (M =
2.10) and participants from quartile 4 districts (M = 2.18). This implies that on
average, teachers in the smallest districts perceive they have more control regarding
instructional decisions than their peers in small/medium districts and in large districts.
Even so, a mean of 2.50 for teachers from quartile 1 districts does not indicate a high
level of control on the part of the teachers. None of the other contrasts revealed
significant mean differences.
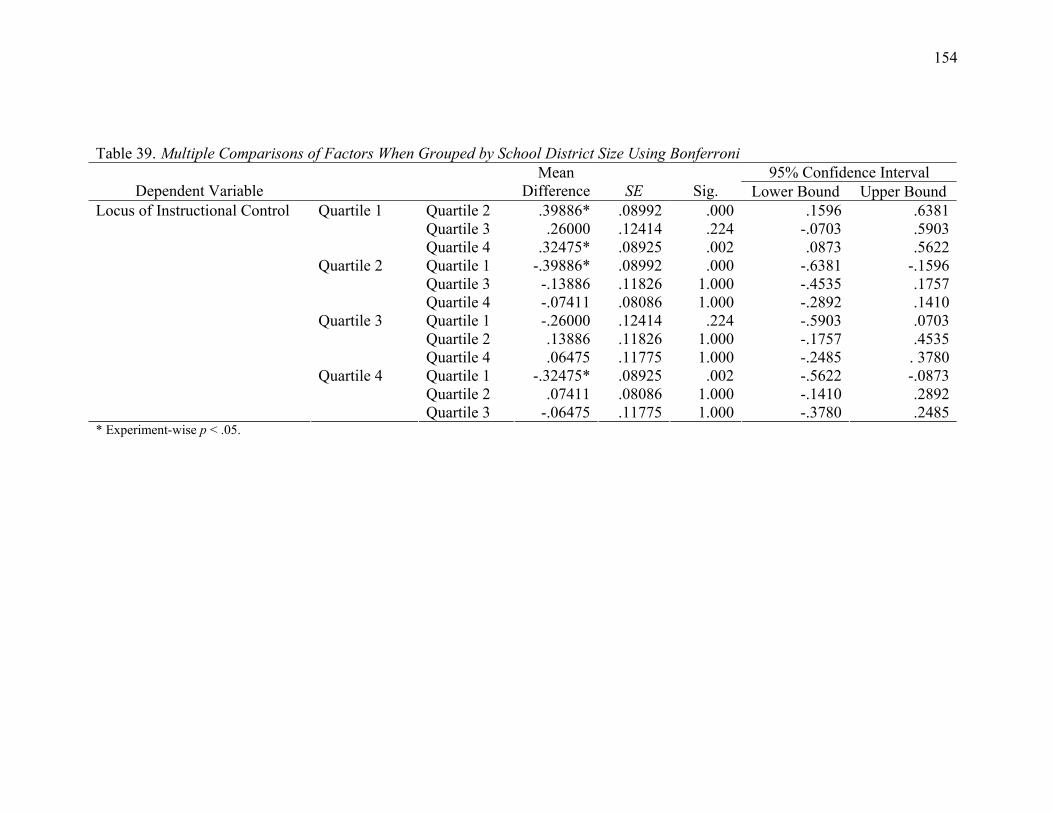
154
Table 39. Multiple Comparisons of Factors When Grouped by School District Size Using Bonferroni 95% Confidence Interval
Dependent Variable Mean
Difference SE Sig. Lower Bound Upper Bound Quartile 2 .39886* .08992 .000 .1596 .6381Quartile 3 .26000 .12414 .224 -.0703 .5903
Quartile 1
Quartile 4 .32475* .08925 .002 .0873 .5622Quartile 1 -.39886* .08992 .000 -.6381 -.1596Quartile 3 -.13886 .11826 1.000 -.4535 .1757
Quartile 2
Quartile 4 -.07411 .08086 1.000 -.2892 .1410Quartile 1 -.26000 .12414 .224 -.5903 .0703Quartile 2 .13886 .11826 1.000 -.1757 .4535
Quartile 3
Quartile 4 .06475 .11775 1.000 -.2485 . 3780Quartile 1 -.32475* .08925 .002 -.5622 -.0873Quartile 2 .07411 .08086 1.000 -.1410 .2892
Locus of Instructional Control
Quartile 4
Quartile 3 -.06475 .11775 1.000 -.3780 .2485* Experiment-wise p < .05.

155
School District Location
Table 40 shows the results of the test of homogeneity of variance when the
sample was grouped by school district location (i.e., Baltimore region, suburban
Washington, Southern Maryland, Western Maryland, and Eastern Shore). Using
Levene’s test, none of the factors was significant indicating that the groups of school
districts had equal variances. Therefore, subsequent analysis using ANOVA was
appropriate.
Table 40. Test of Homogeneity of Variance of Factors When Grouped by School District Location
Levene Statistic df1 df2 Sig.
Sense of Accomplishment .210 3 240 .889 Locus of Instructional Control .712 3 240 .545 Degree of Contentment with Teaching .843 3 240 .471 Level of Autonomy .548 3 240 .650 Professional Growth 2.390 3 240 .069 Freedom to Innovate .353 3 240 .787 With all assumptions satisfied, I ran a one-way ANOVA at the .05 level with
school district location as the independent variable and factor score as the dependent
variable. The results from this analysis are presented in Table 41. For all but the sense
of accomplishment factor, the observed F did not exceed the critical F of 2.6422 and
as a result, I retained the null hypotheses that the means were equal. Since the
observed F did exceed the critical F for the sense of accomplishment factor, I rejected
the null hypothesis and concluded that the factor was somehow related to school
district location. To more precisely define the relationship, I conducted post hoc
multiple comparison testing.
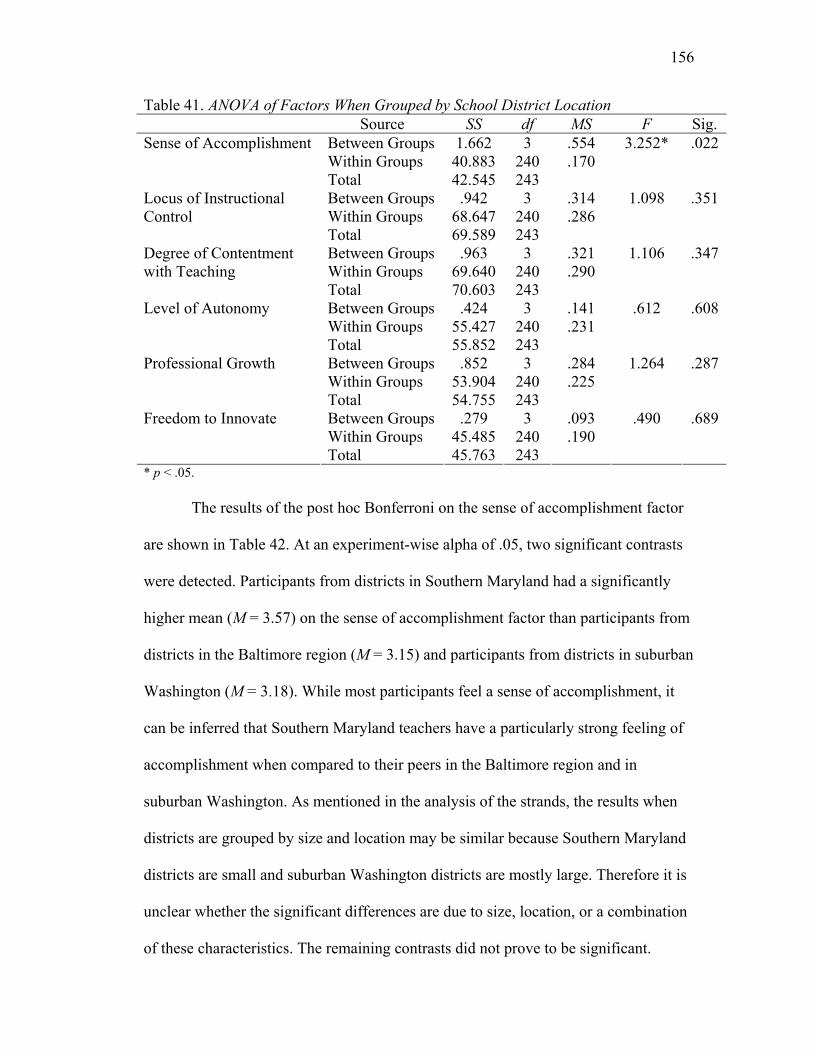
156
Table 41. ANOVA of Factors When Grouped by School District Location Source SS df MS F Sig.
Between Groups 1.662 3 .554 Within Groups 40.883 240 .170
Sense of Accomplishment
Total 42.545 243
3.252* .022
Between Groups .942 3 .314 Within Groups 68.647 240 .286
Locus of Instructional Control
Total 69.589 243
1.098 .351
Between Groups .963 3 .321 Within Groups 69.640 240 .290
Degree of Contentment with Teaching
Total 70.603 243
1.106 .347
Between Groups .424 3 .141 Within Groups 55.427 240 .231
Level of Autonomy
Total 55.852 243
.612 .608
Between Groups .852 3 .284 Within Groups 53.904 240 .225
Professional Growth
Total 54.755 243
1.264 .287
Between Groups .279 3 .093 Within Groups 45.485 240 .190
Freedom to Innovate
Total 45.763 243
.490 .689
* p < .05. The results of the post hoc Bonferroni on the sense of accomplishment factor
are shown in Table 42. At an experiment-wise alpha of .05, two significant contrasts
were detected. Participants from districts in Southern Maryland had a significantly
higher mean (M = 3.57) on the sense of accomplishment factor than participants from
districts in the Baltimore region (M = 3.15) and participants from districts in suburban
Washington (M = 3.18). While most participants feel a sense of accomplishment, it
can be inferred that Southern Maryland teachers have a particularly strong feeling of
accomplishment when compared to their peers in the Baltimore region and in
suburban Washington. As mentioned in the analysis of the strands, the results when
districts are grouped by size and location may be similar because Southern Maryland
districts are small and suburban Washington districts are mostly large. Therefore it is
unclear whether the significant differences are due to size, location, or a combination
of these characteristics. The remaining contrasts did not prove to be significant.
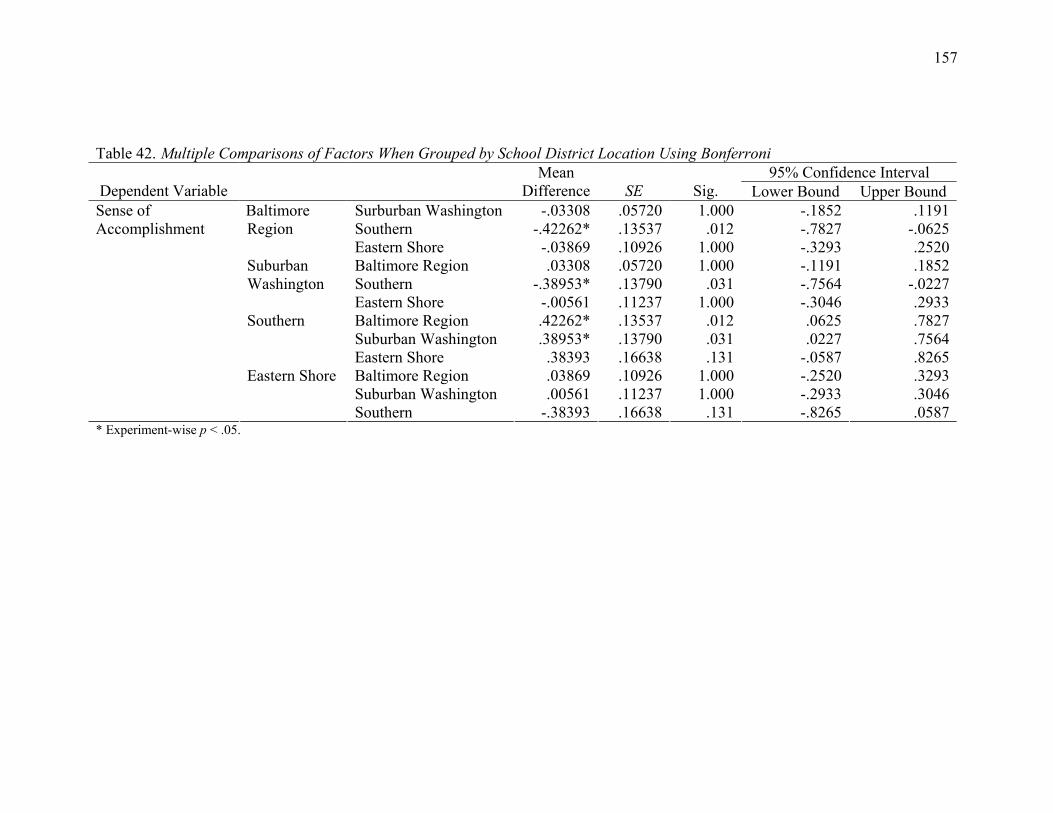
157
Table 42. Multiple Comparisons of Factors When Grouped by School District Location Using Bonferroni 95% Confidence Interval
Dependent Variable Mean
Difference SE Sig. Lower Bound Upper Bound Surburban Washington -.03308 .05720 1.000 -.1852 .1191Southern -.42262* .13537 .012 -.7827 -.0625
Baltimore Region
Eastern Shore -.03869 .10926 1.000 -.3293 .2520Baltimore Region .03308 .05720 1.000 -.1191 .1852Southern -.38953* .13790 .031 -.7564 -.0227
Suburban Washington
Eastern Shore -.00561 .11237 1.000 -.3046 .2933Baltimore Region .42262* .13537 .012 .0625 .7827Suburban Washington .38953* .13790 .031 .0227 .7564
Southern
Eastern Shore .38393 .16638 .131 -.0587 .8265Baltimore Region .03869 .10926 1.000 -.2520 .3293Suburban Washington .00561 .11237 1.000 -.2933 .3046
Sense of Accomplishment
Eastern Shore
Southern -.38393 .16638 .131 -.8265 .0587* Experiment-wise p < .05.

158
Teaching Experience
Table 43 displays the results of the test for homogeneity of variance when the
sample is grouped by teaching experience. The sense of accomplishment, locus of
instructional control, degree of contentment with teaching, professional growth, and
freedom to innovate factors showed no significant differences in variances and
therefore warranted further evaluation by ANOVA.
Table 43. Test of Homogeneity of Variance of Factors When Grouped by Teaching Experience
Levene Statistic df1 df2 Sig.
Sense of Accomplishment 2.120 5 235 .064 Locus of Instructional Control 2.150 5 235 .060 Degree of Contentment with Teaching 2.170 5 235 .058 Level of Autonomy 2.299 5 235 .046 Professional Growth 1.492 5 235 .193 Freedom to Innovate .788 5 235 .559
The ANOVA table for the factors when the sample is grouped by teaching
experience is shown in Table 44. For the factors that met the assumptions of ANOVA,
only the observed F for sense of accomplishment exceeded the critical F of 2.2525.
Hence, post hoc tests for the sense of accomplishment factor were necessary. The null
hypotheses for the other factors regarding the equality of sample means remained
tenable.
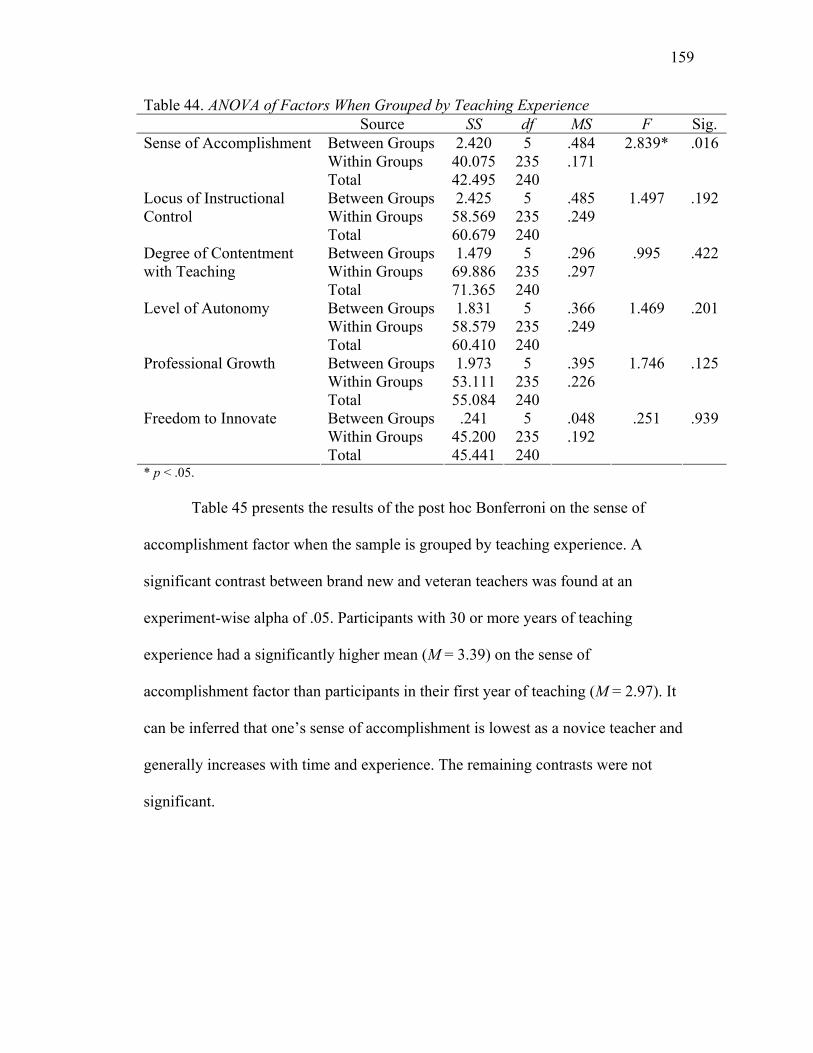
159
Table 44. ANOVA of Factors When Grouped by Teaching Experience Source SS df MS F Sig.
Between Groups 2.420 5 .484 Within Groups 40.075 235 .171
Sense of Accomplishment
Total 42.495 240
2.839* .016
Between Groups 2.425 5 .485 Within Groups 58.569 235 .249
Locus of Instructional Control
Total 60.679 240
1.497 .192
Between Groups 1.479 5 .296 Within Groups 69.886 235 .297
Degree of Contentment with Teaching
Total 71.365 240
.995 .422
Between Groups 1.831 5 .366 Within Groups 58.579 235 .249
Level of Autonomy
Total 60.410 240
1.469 .201
Between Groups 1.973 5 .395 Within Groups 53.111 235 .226
Professional Growth
Total 55.084 240
1.746 .125
Between Groups .241 5 .048 Within Groups 45.200 235 .192
Freedom to Innovate
Total 45.441 240
.251 .939
* p < .05. Table 45 presents the results of the post hoc Bonferroni on the sense of
accomplishment factor when the sample is grouped by teaching experience. A
significant contrast between brand new and veteran teachers was found at an
experiment-wise alpha of .05. Participants with 30 or more years of teaching
experience had a significantly higher mean (M = 3.39) on the sense of
accomplishment factor than participants in their first year of teaching (M = 2.97). It
can be inferred that one’s sense of accomplishment is lowest as a novice teacher and
generally increases with time and experience. The remaining contrasts were not
significant.

160
Table 45. Multiple Comparisons of Factors When Grouped by Teaching Experience Using Bonferroni 95% Confidence Interval
Dependent Variable Mean
Difference SE Sig. Lower Bound Upper Bound 2 – 4 years -.15714 .10662 1.000 -.4733 .15915 – 9 years -.22700 .09843 .330 -.5189 .064910 – 19 years -.24617 .10075 .229 -.5450 .052620 – 29 years -.21462 .11585 .978 -.5582 .1289
0 – 1 year
30+ years -.41454* .11487 .006 -.7552 -.07390 – 1 year .15714 .10662 1.000 -.1591 .47335 – 9 years -.06986 .08275 1.000 -.3152 .175510 – 19 years -.08903 .08549 1.000 -.3426 .164520 – 29 years -.05747 .10286 1.000 -.3625 .2475
2 – 4 years
30+ years -.25740 .10175 .181 -.5591 .04440 – 1 year .22700 .09843 .330 -.0649 .51892 – 4 years .06986 .08275 1.000 -.1755 .315210 – 19 years -.01917 .07503 1.000 -.2417 .203320 – 29 years .01239 .09434 1.000 -.2674 .2921
5 – 9 years
30+ years -.18754 .09314 .678 -.4637 .08870 -1 year .24617 .10075 .229 -.0526 .54502 – 4 years .08903 .08549 1.000 -.1645 .34265 – 9 years .01917 .07503 1.000 -.2033 .241720 – 29 years .03156 .09675 1.000 -.2554 .3185
10 – 19 years
30+ years -.16837 .09558 1.000 -.4518 .11510 – 1 year .21462 .11585 .978 -.1289 .55822 – 4 years .05747 .10286 1.000 -.2475 .36255 – 9 years -.01239 .09434 1.000 -.2921 .267410 – 19 years 0.03156 .09675 1.000 -.3185 .2554
Sense of Accomplishment
20 – 29 years
30+ years -.19992 .11138 1.000 -.5302 .1304
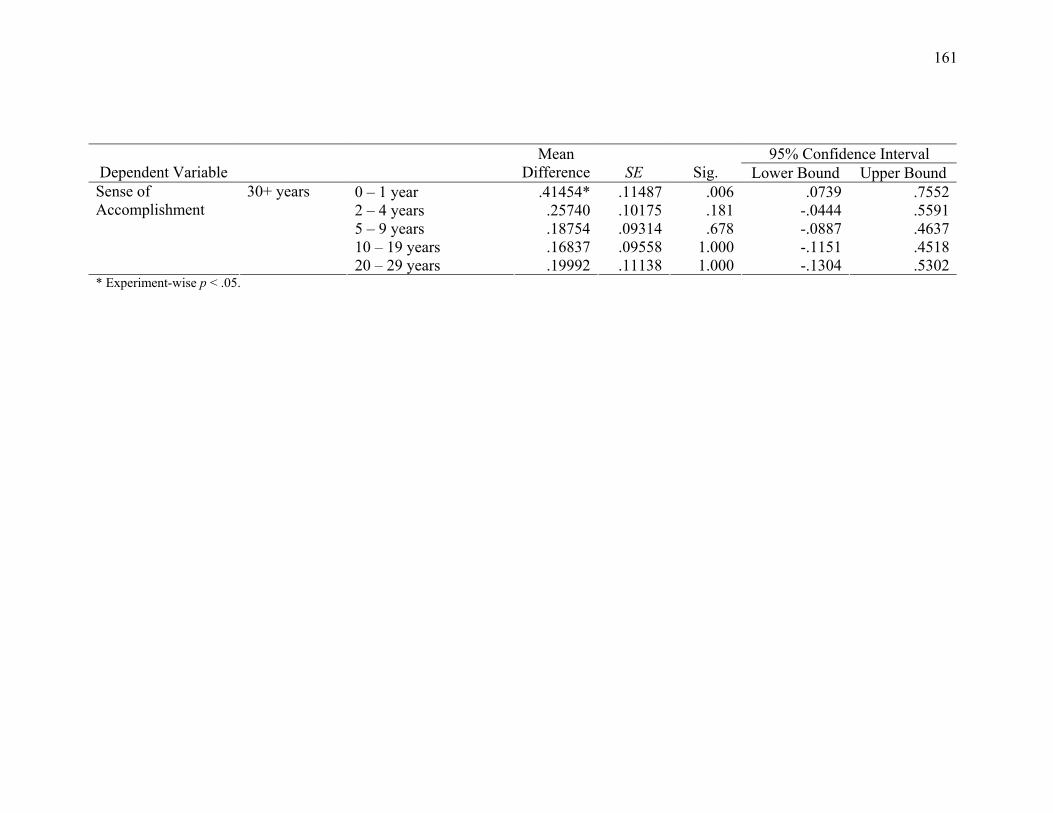
161
95% Confidence Interval Dependent Variable
Mean Difference SE Sig. Lower Bound Upper Bound
0 – 1 year .41454* .11487 .006 .0739 .75522 – 4 years .25740 .10175 .181 -.0444 .55915 – 9 years .18754 .09314 .678 -.0887 .463710 – 19 years .16837 .09558 1.000 -.1151 .4518
Sense of Accomplishment
30+ years
20 – 29 years .19992 .11138 1.000 -.1304 .5302* Experiment-wise p < .05.
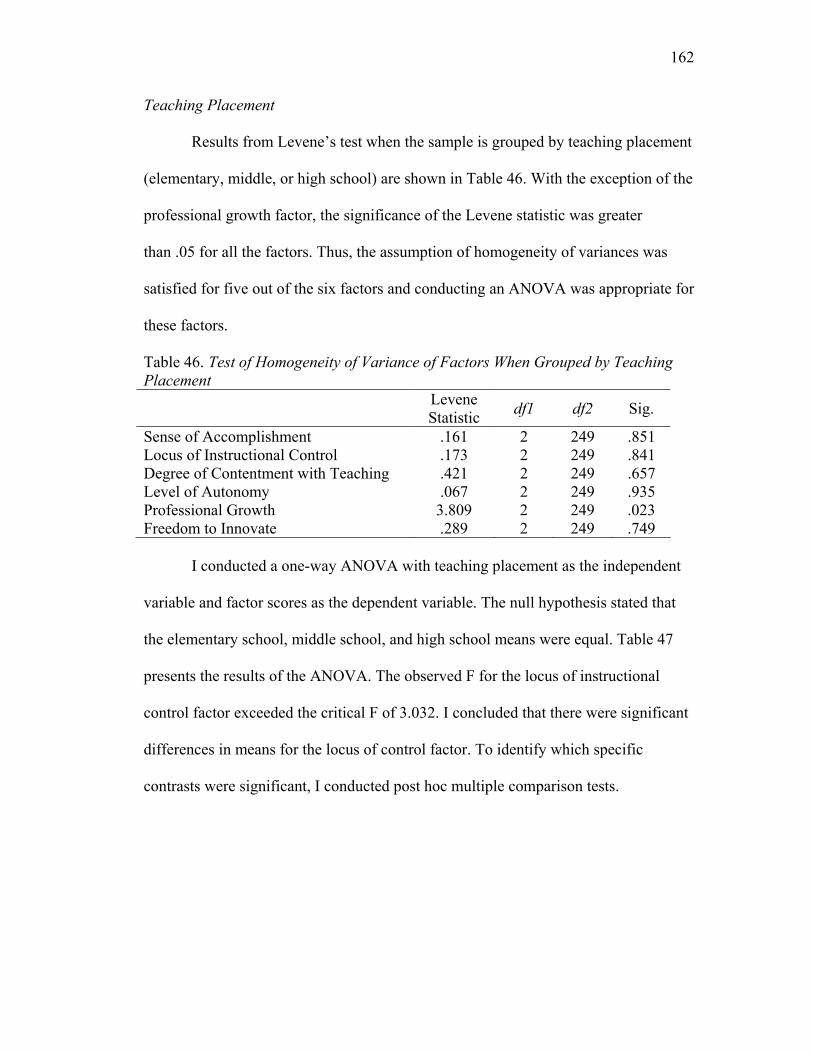
162
Teaching Placement
Results from Levene’s test when the sample is grouped by teaching placement
(elementary, middle, or high school) are shown in Table 46. With the exception of the
professional growth factor, the significance of the Levene statistic was greater
than .05 for all the factors. Thus, the assumption of homogeneity of variances was
satisfied for five out of the six factors and conducting an ANOVA was appropriate for
these factors.
Table 46. Test of Homogeneity of Variance of Factors When Grouped by Teaching Placement
Levene Statistic df1 df2 Sig.
Sense of Accomplishment .161 2 249 .851 Locus of Instructional Control .173 2 249 .841 Degree of Contentment with Teaching .421 2 249 .657 Level of Autonomy .067 2 249 .935 Professional Growth 3.809 2 249 .023 Freedom to Innovate .289 2 249 .749
I conducted a one-way ANOVA with teaching placement as the independent
variable and factor scores as the dependent variable. The null hypothesis stated that
the elementary school, middle school, and high school means were equal. Table 47
presents the results of the ANOVA. The observed F for the locus of instructional
control factor exceeded the critical F of 3.032. I concluded that there were significant
differences in means for the locus of control factor. To identify which specific
contrasts were significant, I conducted post hoc multiple comparison tests.
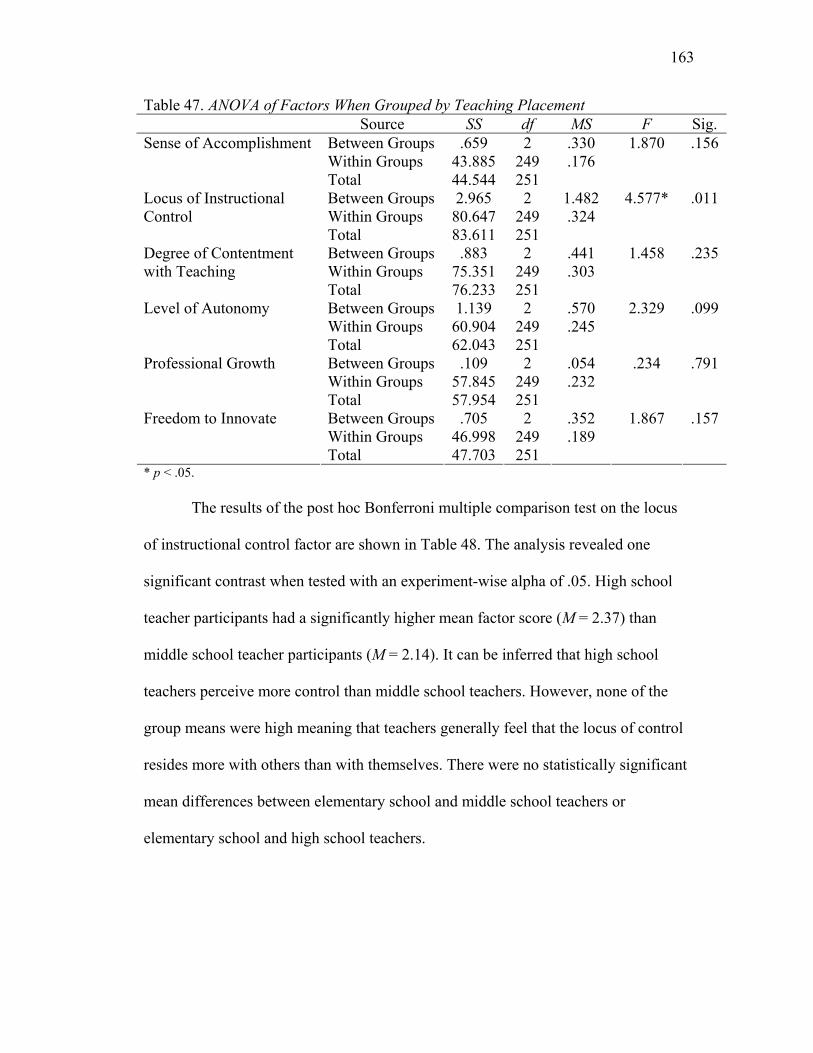
163
Table 47. ANOVA of Factors When Grouped by Teaching Placement Source SS df MS F Sig.
Between Groups .659 2 .330 Within Groups 43.885 249 .176
Sense of Accomplishment
Total 44.544 251
1.870 .156
Between Groups 2.965 2 1.482 Within Groups 80.647 249 .324
Locus of Instructional Control
Total 83.611 251
4.577* .011
Between Groups .883 2 .441 Within Groups 75.351 249 .303
Degree of Contentment with Teaching
Total 76.233 251
1.458 .235
Between Groups 1.139 2 .570 Within Groups 60.904 249 .245
Level of Autonomy
Total 62.043 251
2.329 .099
Between Groups .109 2 .054 Within Groups 57.845 249 .232
Professional Growth
Total 57.954 251
.234 .791
Between Groups .705 2 .352 Within Groups 46.998 249 .189
Freedom to Innovate
Total 47.703 251
1.867 .157
* p < .05. The results of the post hoc Bonferroni multiple comparison test on the locus
of instructional control factor are shown in Table 48. The analysis revealed one
significant contrast when tested with an experiment-wise alpha of .05. High school
teacher participants had a significantly higher mean factor score (M = 2.37) than
middle school teacher participants (M = 2.14). It can be inferred that high school
teachers perceive more control than middle school teachers. However, none of the
group means were high meaning that teachers generally feel that the locus of control
resides more with others than with themselves. There were no statistically significant
mean differences between elementary school and middle school teachers or
elementary school and high school teachers.

164
Table 48. Multiple Comparisons of Factors When Grouped by Teaching Placement Using Bonferroni 95% Confidence Interval
Dependent Variable Mean
Difference SE Sig. Lower Bound Upper Bound Middle .20175 .11397 .234 -.0730 .4765Elementary High -.02395 .11217 1.000 -.2943 .2464Elementary -.20175 .11397 .234 -.4765 .0730Middle High -.22570* .07709 .011 -.4115 -.0399Elementary .02395 .11217 1.000 -.2464 .2943
Locus of Instructional Control
High Middle .22570* .07709 .011 .0399 .4115
165
Summary
Analysis of the survey data using the five hypothesized strands yielded a
number of findings. First, item analysis of participant responses revealed generally
low levels of agency. The results from subsequent statistical tests using ANOVA
identified that teachers in the smallest districts feel significantly more agency than
teachers in both small/medium districts and large districts. ANOVA tests also showed
that high school teachers feel significantly more agency than middle school teachers.
Second, participants reported feeling overloaded by their job responsibilities.
ANOVA tests on the load appropriateness strand scores indicated that teachers in the
small/medium districts feel significantly more overloaded than teachers in the
smallest districts. ANOVA testing also showed that middle school teachers are
significantly more overloaded than elementary school teachers. Third, statistically
significant mean differences in teacher efficacy and respect scores were noted from
ANOVA tests. Specifically, teachers from the smallest districts feel more effective
and more respected than their counterparts in small/medium districts and large
districts. It was also determined that teachers from Southern Maryland districts feel
more efficacious and respected than teachers from suburban Washington districts.
Finally, ANOVA tests showed that elementary school teachers feel more goal
congruence than middle school teachers.
Factor analysis of the survey data resulted in the identification of six factors.
The data was re-analyzed using these factors, which yielded additional findings. First,
participants have a strong sense of accomplishment. Not surprisingly, ANOVA tests
revealed that teachers with 30 or more years of teaching experience have a

166
significantly greater sense of accomplishment than first year teachers. The tests also
indicated that Southern Maryland teachers feel a greater sense of accomplishment
than Baltimore region teachers and suburban Washington teachers. Second,
participants generally feel a low level of instructional control. ANOVA tests showed
that middle school teachers have significantly less control than high school teachers.
Also, teachers in small/medium and large districts have significantly less instructional
control than teachers in the smallest districts.
Whether the data is analyzed using the five strands or the six factors, there
appears to be some consistent relationships. For one, teachers from the smallest
districts seem to feel less tension and stress than teachers in larger districts. Another
is that middle school teachers seem to feel more tension and stress than their peers in
elementary and high schools. There also seems to be more tension and stress reported
by teachers in districts located near urban centers when compared to their more rural
counterparts.
167
CHAPTER 5: CONCLUSIONS
The purpose of this study was to describe the quality of work life of mathematics
teachers, in an effort to help the mathematics teaching profession and the broader
education community improve both the effectiveness and satisfaction of K-12 teachers of
mathematics. This study utilized research from social-psychology and organizational
behavior to investigate the interplay between mathematics teachers and the educational
institution in which they reside. In particular, this study investigated five potential
sources of stress and tension: the congruence of individual and organizational goals,
teachers’ sense of agency, teachers’ sense of efficacy and respect, the level of
professional interactions between teachers, and the appropriateness of teachers’ work
load.
This concluding chapter describes the nature and extent of mathematics teachers’
perceived sense of tension and stress and discusses the relationship of their perceptions to
the predictions of social-psychological and organizational research. The main findings
from the quantitative analysis are presented along with excerpts from follow-up
interviews with a few selected teachers. Pseudonyms have been used to protect the
identity of the teachers. While comments from the interviews are not meant to represent
the beliefs of all mathematics teachers, they do provide some interesting insights and help
to shed light on the survey responses of these particular individuals. Finally, comments
from survey participants on the top assets and obstacles to teaching are included when
relevant because I felt the tone and language used was quite powerful and meaningful.
168
Summary of Findings
Low Agency
Mathematics teachers reported having low levels of agency where agency referred
to their participation in decision-making and utilization of their skills and knowledge.
This finding is consistent with results from a recent survey by a Maryland school district
where teachers expressed a lack of decision-making opportunities (Surface, 2005).
Perceptions of low agency have previously been linked to increases in teacher stress, job
pressure, and job dissatisfaction (Bacharach, Bauer, & Conley, 1986; Kyriacou &
Sutcliffe, 1979; Travers & Cooper, 1996). However, Conley, Bacharach, and Bauer
found mixed results regarding agency when they concluded that routinization, but not
powerlessness, was associated with career dissatisfaction (1989).
Comments from the teachers I interviewed also reflect a sense of low agency. The
use of descriptors such as ‘prescribed’ curriculum and ‘filtered down’ decisions by Jane,
a late-career teacher who had a lower than average agency score, is quite telling:
I don’t know about who makes those decisions any more. For years and years I
used to write curriculum in the summer and I used to write assessments so I
would be on that group. But it was always prescribed from supervisors or resource
teachers that had connections with the state department. So our curriculum and
our decisions are made from the state level and filtered down to us and I don’t see
us having an awful lot of say because there is a national agenda. (Jane, a late-
career outlier, personal communication, March 17, 2007)
169
Samantha, an early-career teacher who also had an agency score below the mean, echoed
Jane’s sentiment that teachers lack input and that there is just a small group of decision-
makers:
I know there’s the [regional] math coordinator. I don’t know if there’s more than
one of them but I know that within the region, they write tests together, the
chapter test and then within the county someone writes the county benchmarks
because the benchmarks aren’t written by the same people as the MSAs. As far as
the curriculum…there’s like 10 or 12 names on there of people who worked on
the curriculum. (Samantha, an early-career outlier, personal communication,
March 29, 2007)
Several survey participants communicated similar feelings when they listed the top three
obstacles to teaching. Teachers reported being ‘micromanaged’ and having ‘very little
influence’ on what, how, and when topics are taught. A number of teachers mentioned a
‘top-down approach’ from administrators and the superintendent.
The interviewed teachers also shared experiences where they felt their
professional knowledge was not appreciated or valued. In Jane’s case, a principal’s
actions left her feeling frustrated and insulted:
He moved a child up that was failing my class. And I’m on the on grade level
class. And this is an African American child and he moved him up to GT so he
didn’t just move him up one level, he moved him up two – with no input from me.
And I never went to him and I never asked him why but other people did because
it wasn’t just math. He was put in GT everything. And I think that’s why we got
the blue ribbon because we had some subgroups that had African Americans in it
170
and that one child made all the difference. And I thought – that’s not right. That’s
not right to the child, that’s manipulating the numbers, that kid is failing GT. His
reasoning was, “Well, he’s got the ability, let’s let him fail at a higher level”. And
I don’t know if I bought into that. And then I had parents calling me and saying
“How do I get my child moved up?” And of course you can’t say, “This was the
decision that the principal did.” You just say, “Well I look at the child’s
performance in April and then I make a decision in April and I sure really want
your child to move up if they’re ready to move up.” But in that particular class, I
got 5 parent calls. Because they’re all saying, “How did Monty move up? How
did he move up? He was failing this class.” And what do you say? What is your
answer? And that’s where you feel like – my input didn’t count. If I’m a physician
and I’m diagnosing a medical condition – would they have done that to me? No.
Part of it is … my career, and I’m coming to the end of it because I’ll probably
teach for 5 or 6 more years – but you feel like “Gee, I’m a professional that’s got
a lot of education – why is it that my expertise is not called on. Why are my
feelings on this not validated?” (Jane, a late-career outlier, personal
communication, March 17, 2007)
Although this incident occurred early in the school year, the hurt Jane suffered was still
fresh and painful when she described it to me nearly five months later. For Samantha,
feeling underutilized was a result of the rigid structure of the assessments and the
mandatory grading system:
I hate the county tests because I can’t assess what I want to assess. I would
definitely like to make my own tests and quizzes. And then by county standards

171
we’re supposed to make the tests worth 70% of the grade so that’s another thing.
We have these really hard tests and then they affect the grade so much. I try to
balance that out by making quizzes. I’ll give one test and one quiz per chapter that
kind of balance each other out because I make my quizzes intentionally easier to
try and help the grades. The testing is awful. (Samantha, an early-career outlier,
personal communication, March 29, 2007)
While the district assessment system promotes standardization, teachers can be left
feeling out of the loop. Furthermore, teachers can feel that they are not trusted by the
district to create meaningful assessments or to set appropriate standards of achievement.
The impact of testing and curriculum guides was also frequently listed as an
obstacle to teaching. Teachers expressed that they felt ‘constricted by state tests’, that
there was ‘too much emphasis on scoring high on state tests rather than looking at
individual improvement’, and that the state tests ‘dictate what is taught’. One teacher
went as far as to state that teaching is shut down in February to ‘teach to the MSA’. In
terms of curriculum, teachers were just as critical. Teachers explained that having a
‘standard curriculum’ meant a ‘loss of creativity’ and a ‘loss of control’ regarding what is
taught each day. Not only is the curriculum ‘inflexible’, but the pacing guides force
teachers to feel as though they ‘can’t slow down to review or show alternate ways of
doing problems’ and the result is that ‘1 day = 1 objective’. Mathison and Freeman found
this same sense of resentment and frustration in teachers when the implementation of
state tests reduced the decision-making control of teachers (2006).
172
Overloaded
Survey responses indicated that participants felt overloaded by their job
responsibilities. One teacher put it succinctly – ‘too much to do, too little time’. Teachers
reported being held more accountable for student learning while having less time to plan,
less time to teach, larger class sizes, and less prepared students. Many teachers remarked
that ‘planning time is being taken by meetings’ and one teacher even pleaded ‘just leave
me along to do what I was hired to do…teach!’ Lack of time has long been a concern
raised by teachers (Campbell & Neill, 1990; Lortie, 2002; Travers & Cooper, 1996) and
class size has frequently been cited as a source of pressure (Campbell & Neill, 1990;
Conley et al., 1989; Travers & Cooper, 1996). Although individually these issues may
not be cause for alarm, it is the compounding effect which can result in feelings of role
overload.
Having been a teacher myself, I thought I had a good sense of the burden teachers
were reporting. It was my interview with Samantha that truly opened my eyes to what
some teachers now face. Samantha detailed her planning time as follows:
Ok, a typical planning period I have a meeting almost, I guess out of the five days
a week, I have a meeting three days a week during planning. During the two that
I don’t have meetings, I do actually plan. The first fifteen minutes I usually clean
up my room a little, erase the boards, put up what I want for the next day. Then
I’ll work on anything that I need to work on for the next day if I haven’t done it or
later in the week. The other days, Tuesdays we have collaborative planning. So
all the 8th grade math teachers get together and we’re supposed to plan lessons
together. But because we’re all at different stages, sometimes we plan some things,

173
we talk about games that we could use, but usually not much gets done. We just
complain about how the kids aren’t learning anything. Then Wednesdays we
have team meetings just to go over general school information. Then Thursdays
sometimes we have a technology meeting, sometimes we have a triple ST which I
don’t even know what that is. But it’s basically to talk about students who we
think are having problems at school. Bring up any new students, talk about how
the old students who we’ve tried to intervene see if they’re doing better or not.
Monday and Friday we have to plan. On Mondays and Fridays, I usually get
almost everything done that I want to get done unless I have a lot of grading to do
then I have to do some at home. But I think that if I had every day, if I had an
hour and a half of planning, I think that I would probably get most of it done.
Because of the meetings, I do have to do work outside of school. (Samantha, an
early-career outlier, personal communication, March 29, 2007)
While the lack of planning time is not enough to drive someone out of teaching,
Samantha faced other obstacles which did ultimately lead to her quitting at the end of the
year. She had been assigned classes with the lowest-ability students in a school that
consistently failed to meet adequate yearly progress. She was criticized by the principal
as needing to work on classroom management. When the regional math coordinator
visited, she was chastised for falling behind the pacing guide. As a mathematics educator,
it was disheartening to find out about Samantha’s decision. I had been her teacher in a
university course a year earlier and knew what a loss this was for the profession.
174
However, I know the losses are not just with novice teachers. Veteran teachers are
also being driven out of teaching. Jane shared the following example of how the intense
pressure from testing is impacting her personally:
My principal said, “Boy, those test scores had better go up or someone will have
it.” But that’s kind of a threatening thing to say “Those test scores had better go
up.” So you feel…as a person who has worked really, really hard “Oh my gosh,
what am I doing wrong? I better be doing a better job than what I’ve been doing
in the past.” So you’re pressured to get those kids to pass. Whether the kids like
the math or not, those tests scores have got to go up. So I had the kids buy MSA
prep books this year. And not that we went through every little lesson, but we had
sample practice for the MSA and I thought “Boy, this is not how I used to teach.”
That was my answer to his “Those test scores had better go up.” I sent a little
letter home and had him approve it. And I said - we’re going to get this, and it
was lovely, it was a nice MSA coach book. $10 a child and we just practiced.
That’s like practicing for the SAT. That’s like, every day in your math class,
practicing for the SAT. Not discovering math, and not exploring concepts in
math, and not gee, why is math important? (Jane, a late-career outlier, personal
communication, March 17, 2007)
The same sense of pressure was mentioned by countless other survey participants in their
list of obstacles to teaching. They described ‘pressure from above’, ‘pressure to teach to
the test’, ‘assessment stress’, and ‘being judged by the value of one test’. The recent shift
towards increased accountability has certainly impacted the work load of teachers.

175
Strong Sense of Accomplishment
If mathematics teachers are overloaded with responsibilities and deprived of
decision-making power, what makes them continue to teach? Based on participant
responses to the survey items, I believe the overwhelming sense of accomplishment is a
key factor. A number of participants cited ‘making a lasting impact on students’ and
‘positively influencing students’ as key assets to teaching. Mathematics teachers seemed
particularly proud of ‘seeing students gain confidence in their abilities’ and ‘watching
students brighten when they comprehend something for the first time’. One teacher
remarked that it was ‘rewarding to see students who come into my classroom afraid of
math suddenly start to enjoy math’. There appeared to be a common theme among
participants of finding ‘satisfaction in helping others’ and ‘feeling good about helping the
future of society’. What draws people to be mathematics teachers seems to also sustain
many of them during difficult circumstances.
Comparison of Findings with Prior Research
In some ways, my findings regarding the working conditions of mathematics
teachers confirm the general pattern of findings from other research. The lack of agency
that I identified is consistent with Archbald and Porter’s conclusion that the more control
districts assert (in terms of curriculum guides, centralized textbook adoptions, and
standardized student testing), the less influence teachers have and the more influence
state and district tests have on course content (Archbald & Porter, 1994). Work by Jeffrey
and Woods determined that where instructional control resides was a source of tension
(1998). As was the case with my participants, the researchers found that teachers desire
flexibility and autonomy in their practice instead of a controlled and prescribed

176
curriculum pushed by the institution (school, district, state, or federal agency). The
teachers I surveyed indicated that they would prefer creating their own assessments for
students rather than using standardized ones. This belief was also shared by the teachers
in the study by Jeffrey and Woods. In addition, the fact that teachers in my study felt
more agency in instructional methods matches similar findings by Archbald and Porter.
The feeling of being overloaded was more prevalent in my study than in previous
research. Almost 90% of my participants indicated that they felt pressure from the
superintendent and the principal to raise test scores. In a similar survey of 4,000 teachers
from 28 states, researchers found roughly half of teachers felt pressure from the
superintendent and 40% felt pressure from the principal (Abrams et al., 2003). One
ramification of increased accountability is the tendency to spend more time preparing for
the test. Close to 90% of the teachers in my study reported spending more than 30 hours
per year preparing students for the mandated tests. In comparison, fewer than half of the
teachers surveyed by Abrams et al. responded similarly. Besides pressure from testing,
teachers also face interruptions during class time and planning time which contribute to
feelings of overload. More than half of my participants stated that their class time was
reduced and over 70% stated that their planning time was often taken away. My findings
on lack of time are consistent with results from numerous studies (Campbell & Neill,
1990; Lortie, 2002; McLaughlin & Shea, 1960; Rudd & Wiseman, 1962).
The finding which appears to be least compatible with previous research is the
strong sense of accomplishment. Work by Maslach and her colleagues resulted in a
definition of burnout consisting of emotional exhaustion, depersonalization, and reduced
personal accomplishment (Maslach & Jackson, 1981, 1984; Maslach et al., 1997).
177
Although 60% of my participants reported feeling burned out, their responses do not
completely fit Maslach’s definition. For instance, depersonalization should appear as
negative feelings toward clients if one is burned out (in the case of teachers, the clients
are students). However, the teachers I surveyed expressed negative feelings directed at
supervisors, not students. According to Maslach, teachers who are burned out would have
a reduced sense of personal accomplishment indicated by dissatisfaction with their work.
This was not the case for teachers in my study. Rather, almost 95% said they enjoyed
teaching, over 90% felt they were a positive influence, and over 80% felt they were
making significant progress with their students. The difference in findings may indicate
that Maslach’s Burnout Inventory is not entirely appropriate for teachers since it was
created from data from people in a variety of service occupations and not specific to
educators.
Implications
In just about any occupation, employees face a certain amount of pressure and
stress. While a moderate degree of pressure can be effective, excessive pressure tends to
be detrimental and possibly even debilitating (Hebb, 1972). Consequently, it is no
wonder that many scholars have investigated issues of job stress and burnout. However,
much has changed in society and in the field of education since Lortie published his
classic work and Maslach created her well-known burnout inventory. What sets the
present study apart from prior research is the focus on mathematics teachers within the
current climate of accountability.
178
This study set out to describe the quality of work life of mathematics teachers. So
what is the verdict? It is mixed - there are aspects which should be praised and continued
and then there are aspects which are concerning and need action.
The Good News
A number of promising findings give me hope for the future of our mathematics
teacher corps. First, mathematics teachers feel a strong sense of accomplishment. They
thrive on seeing students learn, grow, and succeed in mathematics. Second, previous calls
for increased professional interaction appear to be making a difference. Almost 75% of
participants reported have common planning time with other mathematics teachers.
Mathematics teachers are working with their peers to plan lessons, seek advice, and share
ideas. These interactions provide teachers with a vital support system and should
therefore continue to be maintained if not expanded.
Third, teachers generally agree with the mathematical content of the required tests
and curriculum. Teachers believe that the content represents important concepts in
mathematics. However, some teachers expressed concern that the content may not
adequately prepare students for future work in mathematics. This seems to be a valid
concern and one that should be investigated further. Finally, mathematics teachers feel
good about the level of respect they receive from colleagues and parents. The sense of
respect from colleagues is probably due to the interactions teachers reported having with
their peers. For parents, respect for mathematics teachers seems to stem from the
common perception of mathematics as both a challenging subject to learn and a difficult
subject to teach.
179
The Bad News
Other findings are not quite so rosy and many appear linked in some manner to
the push for accountability in mathematics. First, mathematics teachers do not feel that
they are viewed as professionals by school and district administrators. This stance is
conveyed by the dummy-proofing of teaching. For instance, more and more districts are
removing teachers from the process of making assessments, creating curriculum, and
even designing lessons. Instead, a select group of individuals dictates what, when, and
how topics are taught and tested. Some mathematics teachers view this as a reduction of
their role to simply delivering a set curriculum. Not only do teachers feel disempowered,
they are also strongly opposed to what they see as exclusively teaching to the test. To
address this source of tension, it is imperative that districts restructure the way curricula
and assessments are designed. In particular, any new arrangement should provide
teachers with more of a voice and more freedom to utilize their skills and knowledge in
the classroom.
Second, lack of time surfaced as a serious problem. Planning time was taken up
by mandatory meetings and instructional time was plagued by interruptions. at the same
time, the amount of paperwork and the number of students needing extra support
increased. If the situation is not remedied, the current shortage of mathematics teachers
could reach a dire state. We must work to protect planning time so teachers are able to
prepare quality lessons that address the diverse needs of their students. By reclaiming
planning time, teachers can be free to improve their practice by observing and
collaborating with peers. We must also take a firm stance against interruptions to
180
instruction. It is unreasonable to raise expectations while hindering teachers’ ability to do
their job.
Third, we must rethink how we hold mathematics teachers accountable for student
learning. If we continue to focus solely on outcomes, we will erode teachers’ sense of
efficacy. Over and over again, participants decried that looking at outcomes was only half
the picture. To teachers, progress is measured by where students start and how much they
have grown. So rather than penalize teachers for the deficiencies of students, we should
recognize and reward teachers’ accomplishments. In this way, mathematics teachers will
truly feel like effective practitioners.
Finally, we need to improve the support system for novice mathematics teachers.
Samantha’s first-year teaching experiences are not uncommon. In many schools, new
teachers are assigned the most challenging students. The fortunate teachers are quickly
taken under someone’s wing, mentored, and looked after. However, many are left to fend
for themselves. Even in schools where mentoring programs exist, new teachers may find
that mentors are too busy to offer any help. During the critical first years of a teacher’s
career, we need full-time mentors who can offer suggestions, provide assistance, and give
guidance. As teachers develop, the level of support can be gradually reduced. With
proper support, it is likely that we can reduce the number of new teachers who quickly
leave the profession.
Suggestions for Future Research
I can envision a number of valuable and interesting extensions of the current
study. Due to the small proportion of elementary teachers in my sample, I believe it
would be worthwhile to design and conduct a similar survey targeted specifically at

181
elementary teachers in order to more accurately assess their perception of tension. It
would also make sense to expand the participant pool to include teachers from states
across the nation. Such a study could provide a broader view of the impact of the No
Child Left Behind Act. Likewise, I believe that a longitudinal study, measuring teacher
working conditions over the course of a school year, could offer insights about sources of
stress that a one-time survey cannot determine. In addition, the upcoming implementation
of high-stakes testing in science education provides a unique opportunity to study the
influence of the No Child Left Behind Act. A modified version of the survey could be
created and administered to science teachers before and after mandated testing is
implemented. No matter what direction any future research takes, I think it’s important to
consider what Jane said to me at the conclusion of her interview: “This is probably a
really good study. This is not a typical math study, though. This is more of a - people’s
feelings and their attitudes. And it’s nice that someone’s doing a study like this” (Jane, a
late-career, public middle school teacher, from a quartile 2, Baltimore region district,
personal communication, March 17, 2007). Ultimately, it is important to give teachers a
voice and essential to listen to what they have to say.
182
APPENDIX A: E-MAIL TO MCTM MEMBERSHIP
From: Sent: Tuesday, October 31, 2006 12:34 PM To: Subject: Survey Dear MCTM Member, Teaching students mathematics is not an easy job. We deal with curriculum and pacing guides, standardized tests, parents, and administrators, just to name a few. While there is often media attention on policies and test scores, we rarely hear mention of the impact these and other issues have on teachers. This is your chance to share your perspective. I value your thoughts and I want to know more about what it feels like to teach math in an era of accountability and reform. Please fill out a brief survey about your perspectives. To participate, visit the following website now or at a more convenient time www.surveymonkey.com/s.asp?u=807472067978 By completing the survey, you could win a prize! One $50 Target gift card Twenty $20 Target gift cards Many of the statements in this survey come from my own experiences teaching mathematics in Maryland. Your responses will be summarized and the findings shared with the MCTM executive board so that they can better serve as a voice for Maryland mathematics teachers. The results of this survey will also be used for my dissertation research. In all cases, your responses will remain confidential. Responses will be accepted until November 17, 2006. If you have any questions about the survey, please contact me at [email protected] Thank you in advance for your support in this effort. To participate, visit the following website now or at a more convenient time www.surveymonkey.com/s.asp?u=807472067978 Sincerely, Ming Tomayko College of Education University of Maryland, College Park
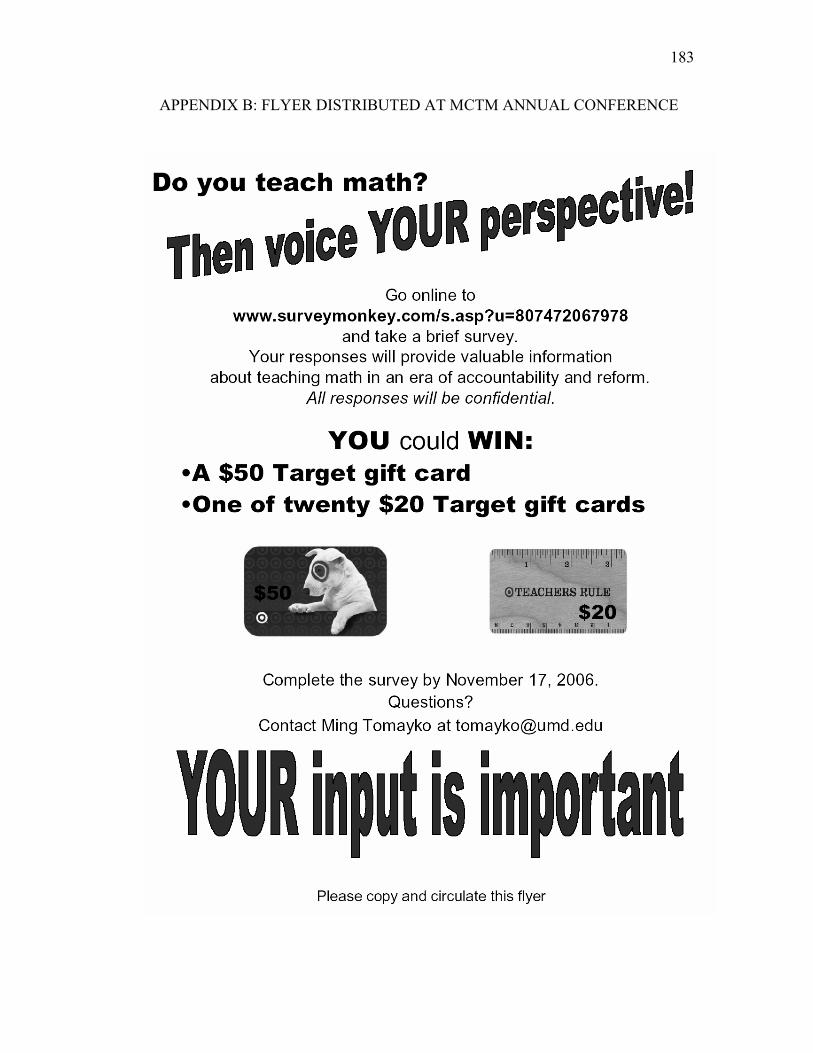
183
APPENDIX B: FLYER DISTRIBUTED AT MCTM ANNUAL CONFERENCE

184
APPENDIC C: CONSENT FORM FOR ONLINE SURVEY

185

186
APPENDIX D: ONLINE SURVEY INSTRUMENT

187
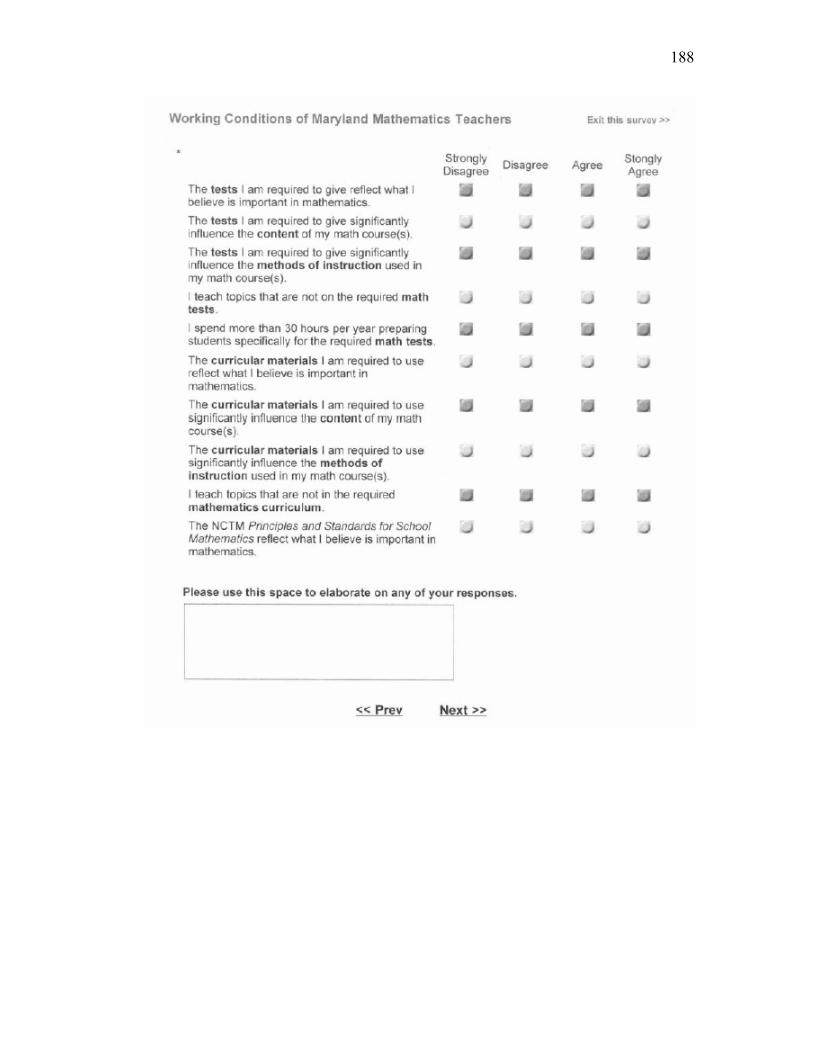
188

189

190

191
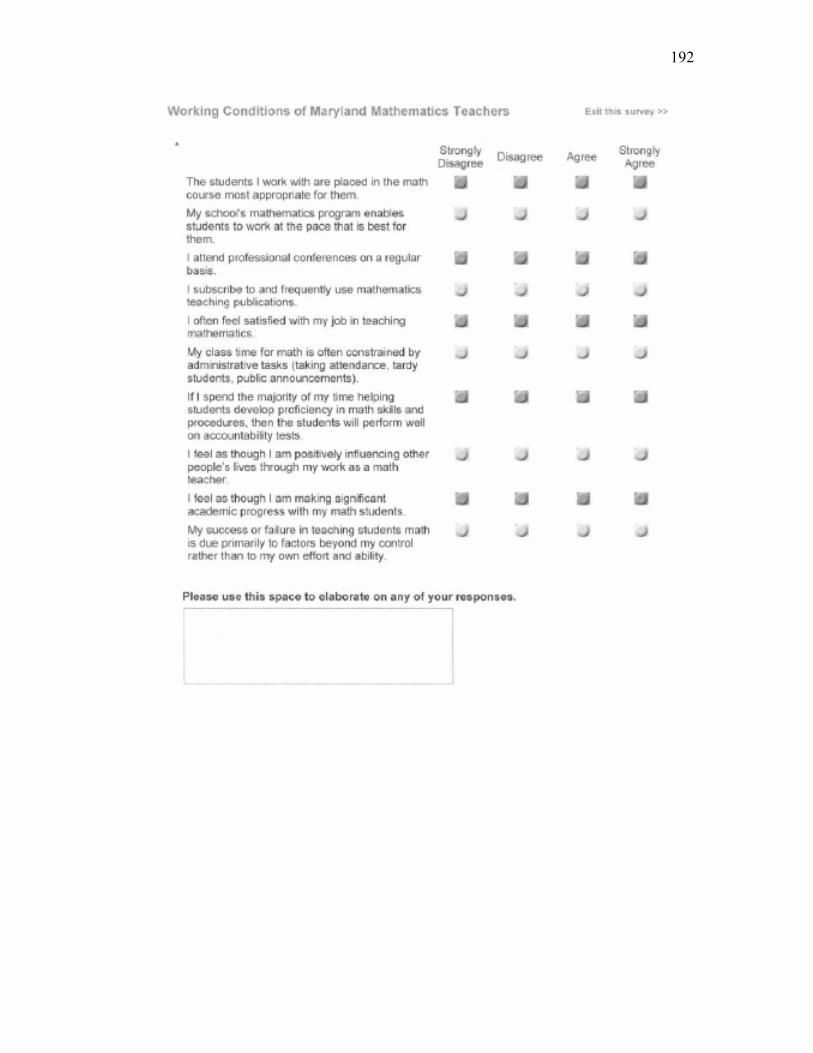
192
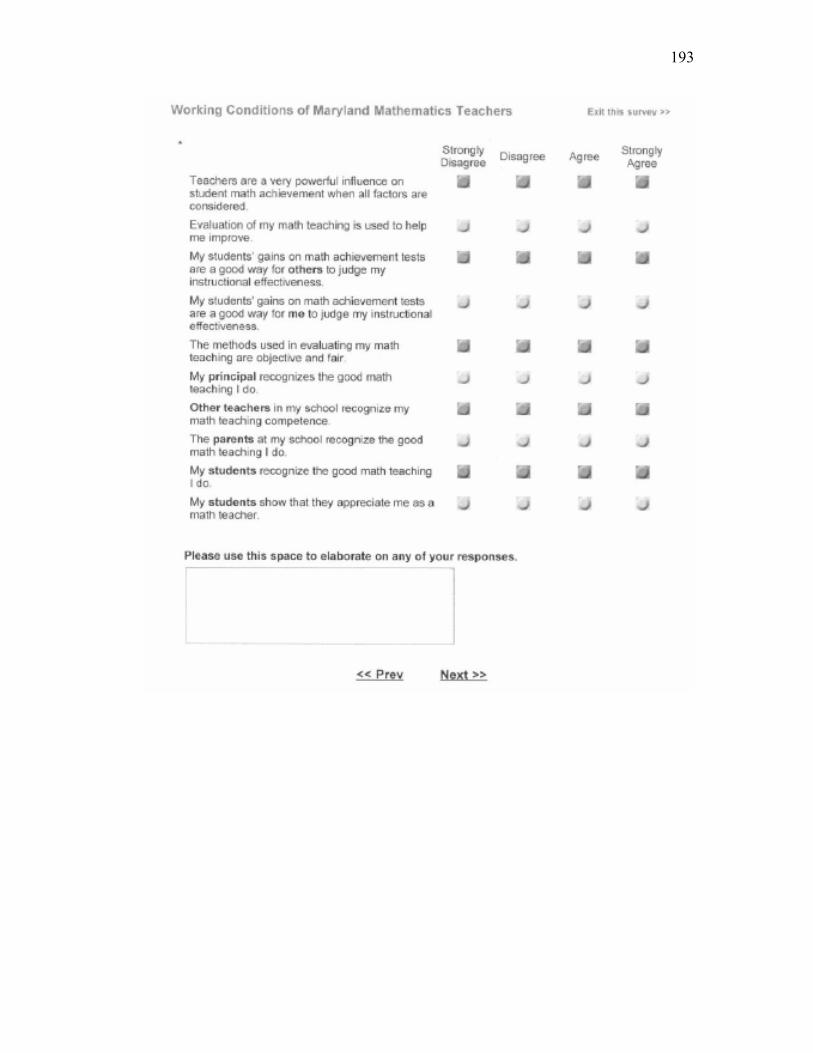
193

194

195

196
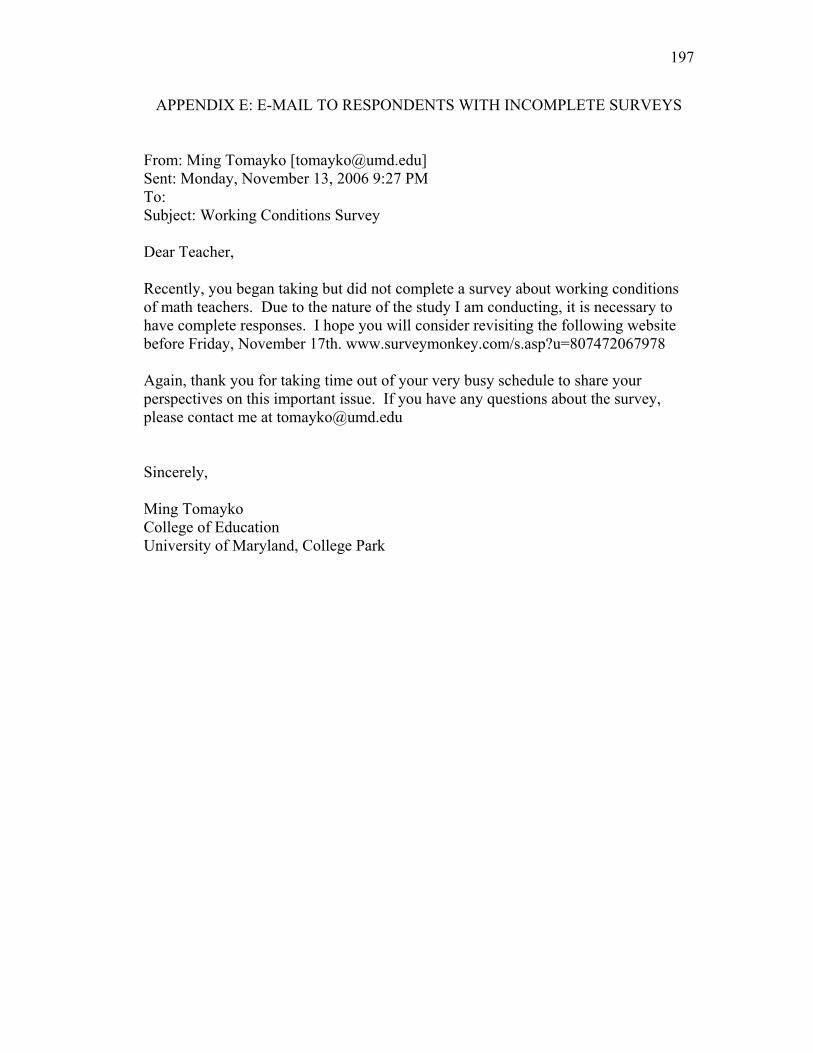
197
APPENDIX E: E-MAIL TO RESPONDENTS WITH INCOMPLETE SURVEYS
From: Ming Tomayko [[email protected]] Sent: Monday, November 13, 2006 9:27 PM To: Subject: Working Conditions Survey Dear Teacher, Recently, you began taking but did not complete a survey about working conditions of math teachers. Due to the nature of the study I am conducting, it is necessary to have complete responses. I hope you will consider revisiting the following website before Friday, November 17th. www.surveymonkey.com/s.asp?u=807472067978 Again, thank you for taking time out of your very busy schedule to share your perspectives on this important issue. If you have any questions about the survey, please contact me at [email protected] Sincerely, Ming Tomayko College of Education University of Maryland, College Park

198
APPENDIX F: E-MAIL TO TEACHERS SELECTED FOR AN INTERVIEW
From: Ming Tomayko [[email protected]] Sent: Monday, March 05, 2007 4:26 PM To: Subject: Math Teacher Survey Interview Request Dear Math Teacher: Last fall, you participated in an online survey of Maryland Math teachers. You indicated your willingness to participate in a follow-up interview about your survey responses. I am writing because you have been selected as one of the teachers I would like to interview. The interview can be scheduled at a time and place convenient to you and will last approximately one hour. Your responses will remain confidential and you will be compensated with a $100 stipend for your time. Please contact me by Monday March 12th at [email protected] if you are still willing to participate or if you have any questions about the interview. Thank you, Ming Tomayko [email protected] College of Education University of Maryland, College Park
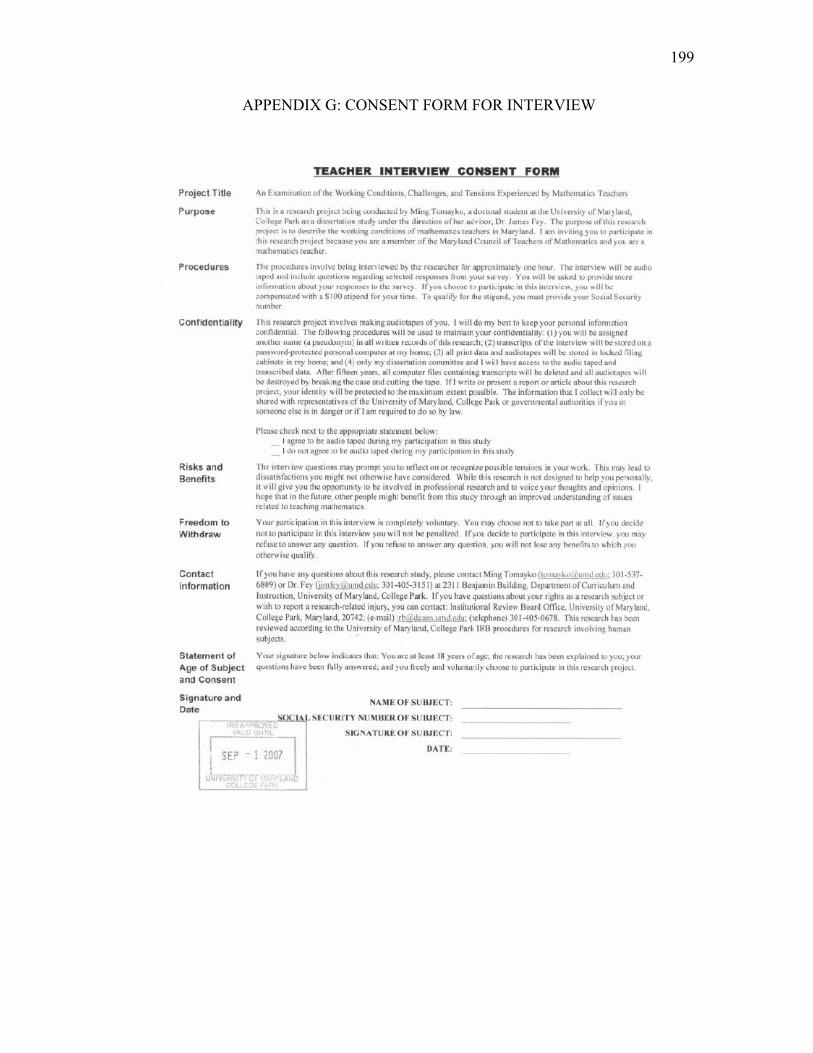
199
APPENDIX G: CONSENT FORM FOR INTERVIEW
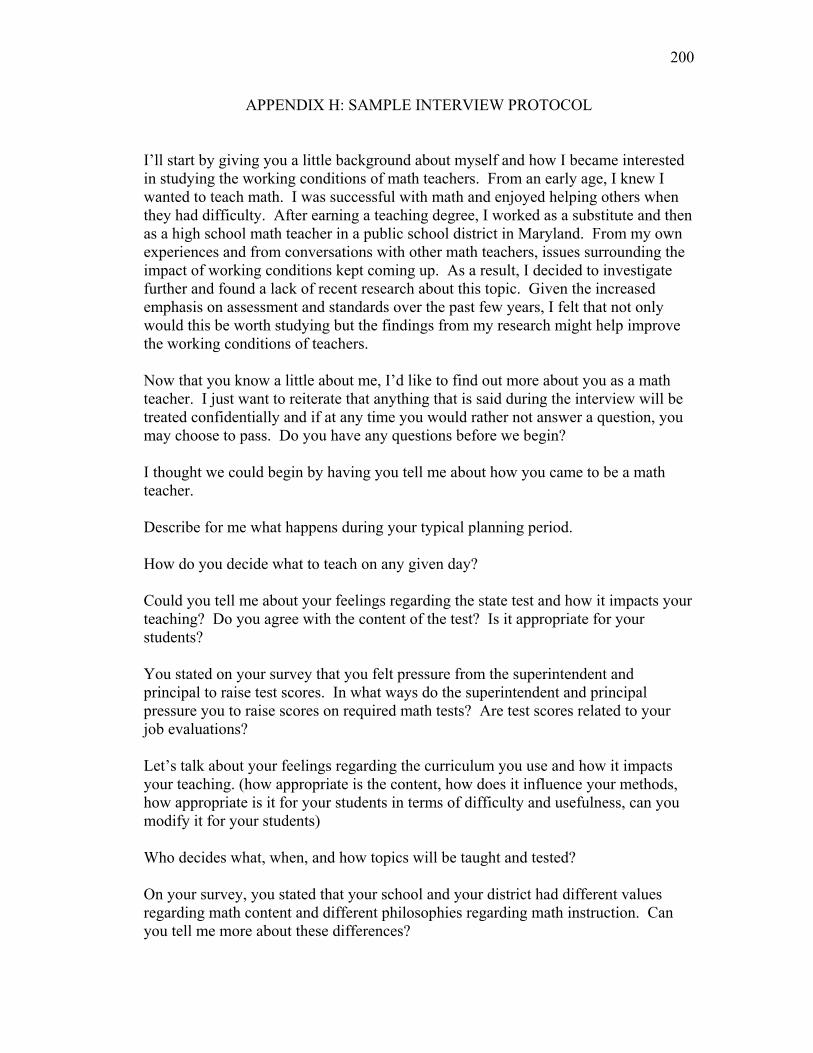
200
APPENDIX H: SAMPLE INTERVIEW PROTOCOL
I’ll start by giving you a little background about myself and how I became interested in studying the working conditions of math teachers. From an early age, I knew I wanted to teach math. I was successful with math and enjoyed helping others when they had difficulty. After earning a teaching degree, I worked as a substitute and then as a high school math teacher in a public school district in Maryland. From my own experiences and from conversations with other math teachers, issues surrounding the impact of working conditions kept coming up. As a result, I decided to investigate further and found a lack of recent research about this topic. Given the increased emphasis on assessment and standards over the past few years, I felt that not only would this be worth studying but the findings from my research might help improve the working conditions of teachers. Now that you know a little about me, I’d like to find out more about you as a math teacher. I just want to reiterate that anything that is said during the interview will be treated confidentially and if at any time you would rather not answer a question, you may choose to pass. Do you have any questions before we begin? I thought we could begin by having you tell me about how you came to be a math teacher. Describe for me what happens during your typical planning period. How do you decide what to teach on any given day? Could you tell me about your feelings regarding the state test and how it impacts your teaching? Do you agree with the content of the test? Is it appropriate for your students? You stated on your survey that you felt pressure from the superintendent and principal to raise test scores. In what ways do the superintendent and principal pressure you to raise scores on required math tests? Are test scores related to your job evaluations? Let’s talk about your feelings regarding the curriculum you use and how it impacts your teaching. (how appropriate is the content, how does it influence your methods, how appropriate is it for your students in terms of difficulty and usefulness, can you modify it for your students) Who decides what, when, and how topics will be taught and tested? On your survey, you stated that your school and your district had different values regarding math content and different philosophies regarding math instruction. Can you tell me more about these differences?
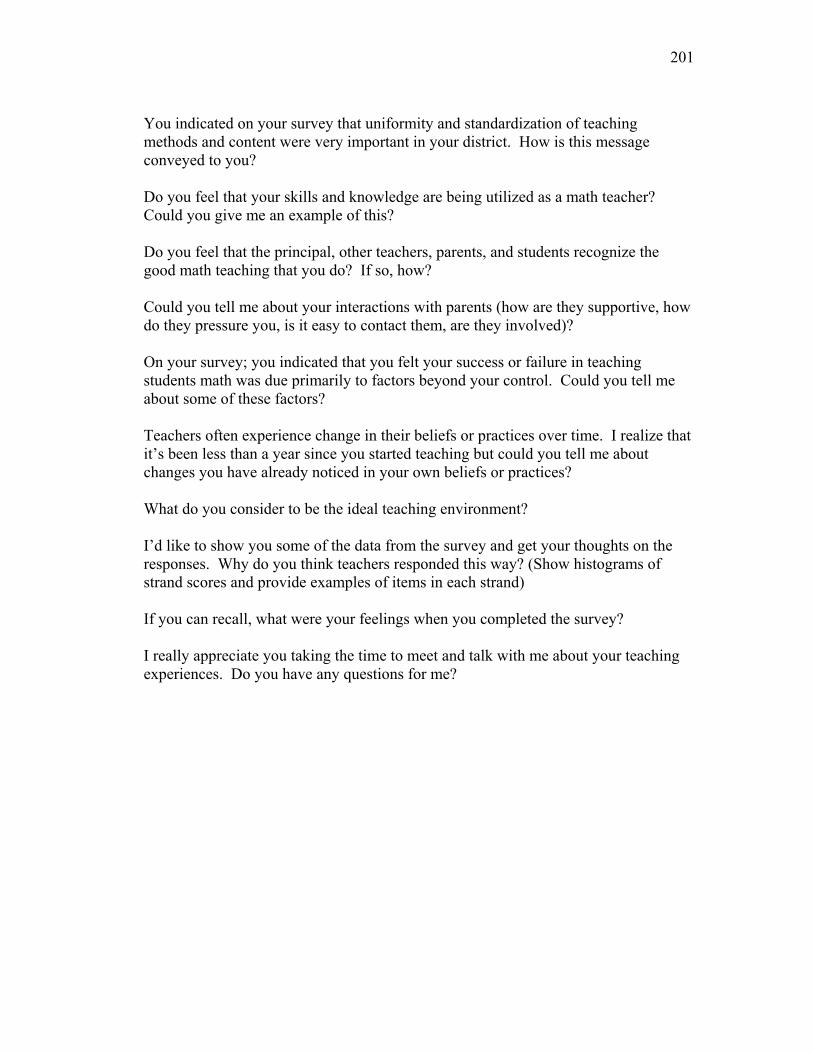
201
You indicated on your survey that uniformity and standardization of teaching methods and content were very important in your district. How is this message conveyed to you? Do you feel that your skills and knowledge are being utilized as a math teacher? Could you give me an example of this? Do you feel that the principal, other teachers, parents, and students recognize the good math teaching that you do? If so, how? Could you tell me about your interactions with parents (how are they supportive, how do they pressure you, is it easy to contact them, are they involved)? On your survey; you indicated that you felt your success or failure in teaching students math was due primarily to factors beyond your control. Could you tell me about some of these factors? Teachers often experience change in their beliefs or practices over time. I realize that it’s been less than a year since you started teaching but could you tell me about changes you have already noticed in your own beliefs or practices? What do you consider to be the ideal teaching environment? I’d like to show you some of the data from the survey and get your thoughts on the responses. Why do you think teachers responded this way? (Show histograms of strand scores and provide examples of items in each strand) If you can recall, what were your feelings when you completed the survey? I really appreciate you taking the time to meet and talk with me about your teaching experiences. Do you have any questions for me?

202
APPENDIX I: PROGRAM CODE FOR VELICER’S MINIMUM AVERAGE
PARTIAL PROCEDURE
O'Connor, B. P. (2000). SPSS and SAS programs for determining the number of
components using parallel analysis and Velicer's MAP test. Behavior Research Methods, Instrumentation, and Computers, 32, 396-402.
set printback=none width=80 seed = 1953125 mxloops=9000. compute cr = {due to the large number of variables in the data set, the correlation matrix is not included here}. call eigen (cr,eigvect,eigval). compute loadings = eigvect * sqrt(mdiag(eigval)). compute fm = make(nrow(cr),2,-9999). compute fm(1,2) = (mssq(cr)-ncol(cr))/(ncol(cr)*(ncol(cr)-1)). loop #m = 1 to ncol(cr) - 1. compute a = loadings(:,1:#m). compute partcov = cr - (a * t(a)). compute d = mdiag( 1 / (sqrt(diag(partcov))) ). compute pr = d * partcov * d. compute fm(#m+1,2) = (mssq(pr)-ncol(cr))/(ncol(cr)*(ncol(cr)-1)). end loop. * identifying the smallest fm value & its location (= # factors). compute minfm = fm(1,2). compute nfactors = 0. loop #s = 1 to nrow(fm). compute fm(#s,1) = #s -1. do if ( fm(#s,2) < minfm ). compute minfm = fm(#s,2). compute nfactors = #s - 1. end if. end loop. print /title="Velicer's Minimum Average Partial (MAP) Test:". print eigval /title="Eigenvalues" /format "f12.6". print fm /title="Velicer's Average Squared Correlations"/format "f12.6". print minfm/title="The smallest average squared correlation is"/format "f12.6". print nfactors /title="The number of components is". end matrix.

203
REFERENCES
Abrams, L. M., Pedulla, J. J., & Madaus, G. F. (2003). Views from the classroom:
Teachers' opinions of statewide testing programs. Theory into Practice, 42(1), 18-
29.
Anderson, L. W. (2005). The No Child Left Behind Act and the legacy of federal aid to
education. Education Policy Analysis Archives, 13(24), 1-20.
Archbald, D. A., & Porter, A. C. (1994). Curriculum control and teachers' perceptions of
autonomy and satisfaction. Educational Evaluation and Policy Analysis, 16(1),
21-39.
Armor, D. J., Conroy-Oseguera, P., Cox, M., King, N. J., McDonnell, L. M., Pascal, A.
H., et al. (1976). Analysis of the school preferred reading programs in selected
Los Angeles minority schools. Retrieved July 18, 2006, from
http://www.rand.org/pubs/reports/R2007
Ashton, P. T. (1985). Motivation and the teacher's sense of efficacy. In C. Ames & R.
Ames (Eds.), Research on motivation in education (Vol. 2, pp. 141-171). Orlando,
FL: Academic Press.
Bacharach, S. B., Bauer, S., & Conley, S. C. (1986). Organizational analysis of stress:
The case of elementary and secondary schools. Work and Occupations, 13(1), 7-
32.
Bachkirova, T. (2003). Role of values in teacher stress. Retrieved June 7, 2006, from
http://www.brookes.ac.uk/schools/education/rescon/Stress.pdf
Bandura, A. (1986). Social foundations of thought and action: A social cognitive theory.
Englewood Cliffs, NJ: Prentice-Hall.
204
Berman, P., McLaughlin, M. W., Bass-Golod, G. V., Pauly, E., & Zellman, G. L. (1977).
Federal programs supporting educational change Vol. VII: Factors affecting
implementation and continuation. Retrieved July 18, 2006, from
http://www.rand.org/pubs/reports/R1589.7/
Bogdan, R. C., & Biklen, S. K. (1998). Qualitative research for education: An
introduction to theory and methods (3rd ed.). Boston: Allyn and Bacon.
Brissie, J. S., Hoover-Dempsey, K. V., & Bassler, O. C. (1988). Individual and
situational contributors to teacher burnout. Journal of Educational Research, 82,
106-112.
Byrne, B. M. (1994). Burnout: Testing for the validity, replication, and invariance of
casual structure across elementary, intermediate, and secondary teachers.
American Educational Research Journal, 31, 645-673.
Byrne, B. M. (1999). The nomological network of teacher burnout: A literature review
and empirically validated model. In R. Vandenberghe & A. M. Huberman (Eds.),
Understanding and preventing teacher burnout: A sourcebook of international
research and practice (pp. 15-37). Cambridge: Cambridge University Press.
Campbell, R. J., & Neill, S. S. J. (1990). Thirteen hundred and thirty days: A pilot study
of teacher time in key stage 1. Coventry, England: Warwick University.
Conley, S. C., Bacharach, S. B., & Bauer, S. (1989). The school work environment and
teacher career dissatisfaction. Educational Administration Quarterly, 25(11), 58-
81.

205
Council of Chief State School Officers. (2003). Meeting NCLB goals for highly qualified
teachers: Estimates by state from survey data. Retrieved March 23, 2006, from
http://www.ccsso.org/publications/details.cfm?PublicationID=224
Dunham, J. (1992). Stress in teaching (2nd ed.). New York: Routledge.
Edwards, J. R., & Cooper, C. L. (1990). The person-environment fit approach to stress:
Recurring problems and some suggested solutions. Journal of Organizational
Behavior, 11, 293-307.
Farber, B. A. (1991). Crisis in education: Stress and burnout in the American teacher.
San Francisco: Jossey-Bass Publishers.
Feiman-Nemser, S., & Floden, R. E. (1986). The cultures of teaching. In M. C. Wittrock
(Ed.), Handbook of research on teaching (3rd ed., pp. 505-526). New York:
Macmillan.
French, J. R. P., Jr., Rodgers, W., & Cobb, S. (1974). Adjustment as person-environment
fit. In G. V. Coelho, D. A. Hamburg & J. E. Adams (Eds.), Coping and
Adaptation. New York: Basic Books.
Friedman, I. A. (1991). High- and low-burnout schools: School culture aspects of teacher
burnout. Journal of Educational Research, 84, 325-333.
Garson, D. G. (2006). Reliability analysis. Retrieved March 16, 2006, from
www2.chass.ncsu.edu/garson/pa765/reliab.htm
Goals 2000: Educate America Act, 103rd Congress, 2nd Sess.(1994).
Gold, Y., & Roth, R. A. (1993). Teachers managing stress and preventing burnout: The
professional health solution. London: The Falmer Press.
206
Guadagnoli, E., & Velicer, W. F. (1988). Relation of sample size to the stability of
component patterns. Psychological Bulletin, 103(2), 265-275.
Hebb, D. (1972). Textbooks of psychology. Philadelphia: Saunders.
Hemmings, A., & Metz, M. H. (1990). Real teaching: How high school teachers negotiate
societal, local, community, and student pressures when they define their work. In
R. Page & L. Valli (Eds.), Curriculum differentiation: Interpretative studies in U.
S. secondary schools (pp. 91-111). Albany, NY: State University of New York
Press.
Improving America's schools act of 1994, 103rd Congress, 2nd Sess.(1994).
Ingersoll, R. M. (2003). Who controls teachers' work? Cambridge, MA: Harvard
University Press.
Jeffrey, B., & Woods, P. (1998). Testing teachers: The effect of school inspections on
primary teachers. London: Falmer Press.
Kahn, R. L., & Byosiere, P. (1992). Stress in organizations. In M. D. Dunnette & L. M.
Hough (Eds.), Handbook of industrial and organizational psychology (2nd ed.,
Vol. 2, pp. 571-650). Palo Alto, CA: Consulting Psychologists Press.
Kahn, R. L., Wolfe, D. M., Quinn, R. P., Snoek, J. D., & Rosenthal, R. A. (1964).
Organizational stress: Studies in role conflict and ambiguity. New York: Wiley.
Katz, D., & Kahn, R. L. (1978). The social psychology of organizations (2nd ed.). New
York: Wiley.
Kim, J.-O., & Mueller, C. W. (1978). Factor analysis: Statistical methods and practical
issues. Newbury Park, CA: Sage.

207
Kyriacou, C., & Sutcliffe, J. (1977). Teacher stress: A review. Educational Review, 29(4),
299-306.
Kyriacou, C., & Sutcliffe, J. (1978). A model of teacher stress. Educational Studies, 4, 1-
6.
Kyriacou, C., & Sutcliffe, J. (1979). A note on teacher stress and locus of control.
Journal of Occupational Psychology, 52, 227-228.
Landy, F. J. (1992). Work design and stress. In G. P. Keita & S. L. Sauter (Eds.), Work
and well-being: An agenda for the 1990s (pp. 119-158). Washington, DC:
American Psychological Association.
Lazarus, R. S., & Folkman, S. (1984). Stress, appraisal and coping. New York: Springer.
Lomax, R. G. (1992). Statistical concepts: A second course for education and the
behavioral sciences. New York: Longman.
Lortie, D. C. (2002). Schoolteacher: A sociological study (Second ed.). Chicago:
University of Chicago Press.
Louis, K. S., & Smith, B. (1990). Teacher working conditions. In P. Reyes (Ed.),
Teachers and their workplace: Commitment, performance, and productivity (pp.
23-47). Newbury Park, CA: Sage.
Maryland State Department of Education. (1996). Education reform in Maryland 1977-
1996. Retrieved March 8, 2006, from
http://www.mdk12.org/mspp/reform/index.html

208
Maryland State Department of Education. (2003a). Planning, transition, and
implementation summary. Retrieved April 4, 2006, from
http://www.marylandpublicschools.org/NR/rdonlyres/64C18AB5-2426-4BC5-
9EF4-9D5FC284294C/2367/15PlanningTransitionandImplemenation
Summary.pdf
Maryland State Department of Education. (2003b). Technical documentation for the
Maryland High School Assessment program. Retrieved March 8, 2006, from
http://www.marylandpublicschools.org/MSDE/divisions/planningresultstest/hsa_t
ech_report.htm
Maryland State Department of Education. (2004a). The fact book 2003-2004: A statistical
handbook. Retrieved February 26, 2006, from
http://www.marylandpublicschools.org/NR/rdonlyres/FCB60C1D-6CC2-4270-
BDAA-153D67247324/5617/FactBookII.pdf
Maryland State Department of Education. (2004b). Maryland public school enrollment by
race/ethnicity and gender and number of schools. Retrieved January 15, 2007,
from http://www.marylandpublicschools.org/NR/rdonlyres/A4F036D6-551E-
496A-951B-99B5476A463A/4932/enroll04.pdf
Maslach, C., & Jackson, S. (1981). The measurement of experienced burnout. Journal of
Occupational Behavior, 2, 99-113.
Maslach, C., & Jackson, S. (1984). Burnout in organizational settings. In S. Oskamp
(Ed.), Applied social psychology annual (Vol. 5, pp. 133-153). Beverly Hills, CA:
Sage.

209
Maslach, C., Jackson, S., & Leiter, M. (1997). Maslach burnout inventory. In C. P.
Zalaquett & R. J. Wood (Eds.), Evaluating stress: A book of resources (pp. 191-
218). Lanham, MD: The Scarecrow Press.
Mathison, S., & Freeman, M. (2006). Teacher stress and high stakes testing. In R.
Lambert & C. McCarthy (Eds.), Understanding Teacher Stress in an Age of
Accountability (pp. 43-63). Greenwich, CT: Information Age Publishing.
McLaughlin, J. W., & Shea, J. T. (1960). California teachers' job dissatisfactions.
California Journal of Educational Research, 11, 216-224.
Millar, J. D. (1992). Public enlightenment and mental health in the workplace. In G. P.
Keita & S. L. Sauter (Eds.), Work and well-being: An agenda for the 1990s (pp.
5-8). Washington, DC: American Psychological Association.
National Council of Teachers of Mathematics. (1989). Curriculum and evaluation
standards for school mathematics. Reston, VA: National Council of Teachers of
Mathematics.
Nelson, D. L., & Quick, J. C. (2000). Organizational behavior: Foundations, realities,
and challenges (3rd ed.). Cincinnati: South-Western College Publishing.
Rizzo, J., House, R., & Lirtzman, S. (1970). Role conflict and role ambiguity in complex
organizations. Administrative Science Quarterly, 15, 150-163.
Rosenholtz, S. J. (Ed.). (1989). Teachers' workplace: The social organization of schools.
New York, NY: Longman.
Rudd, W. G. A., & Wiseman, S. (1962). Sources of dissatisfaction among a group of
teachers. British Journal of Educational Psychology, 32, 275-291.

210
Schwab, R. L., & Iwanicki, E. F. (1982). Perceived role conflict, role ambiguity, and
teacher burnout. Educational Administration Quarterly, 18(1), 60-74.
Schwab, R. L., Jackson, S., & Schuler, R. S. (1986). Educator burnout: Sources and
consequences. Educational Research Quarterly, 10(3), 14-30.
Seeman, M. (1972). Alienation and engagement. In A. Campbell & P. E. Converse (Eds.),
The human meaning of social change (pp. 467-527). New York: Russell Sage
Foundation.
Selye, H. (1978). The stress of life. New York: McGraw-Hill.
Stiegelbauer, S. (1992, April). Why we want to be teachers: New teachers talk about their
reasons for entering the profession. Paper presented at the Annual Meeting of the
American Educational Research Association, San Francisco, CA.
Surface, J. (2005, October 27). Teachers to principals: Talk to us. The Howard County
Times, pp. 30-31.
Sutton, R. I. (1984). Job stress among primary and secondary schoolteachers: Its
relationship to ill-being. Work and Occupations, 11(1), 7-28.
The National Commission on Excellence in Education. (1984). A nation at risk: The full
account. Cambridge, MA: USA Research.
Travers, C. J., & Cooper, C. L. (1996). Teachers under pressure: Stress in the teaching
profession. New York: Routledge.
U.S. Department of Commerce. (2002). Maryland urban and rural population 2000 and
1990. Retrieved January 15, 2007, from
http://www.mdp.state.md.us/msdc/census/cen2000/Urban_rural/ua_rural2k_cnty.

211
U.S. Department of Education. (1994). Progress of education in the United States of
America: 1990 through 1994 (No. ED 376 550). Washington, DC.
U.S. Department of Education. (2004). No Child Left Behind executive summary.
Retrieved March 8, 2006, from
http://www.ed.gov/nclb/overview/intro/execsumm.html
U.S. Department of Education, National Center for Education Statistics,. (2005). Digest
of education statistics 2004 (NCES 2005-079). Retrieved March 23, 2006, from
http://nces.ed.gov/programs/digest/d04/index.asp
Vinovskis, M. (2005). From a Nation at Risk to No Child Left Behind: Federal
compensatory education policies from Ronald Reagan to George W. Bush.
Retrieved April 11, 2006, from
http://www.nationalhistorycenter.org/documents/Vinovskislecture21.pdf
Webster's ninth new collegiate dictionary. (1990). Springfield, MA: Merriam-Webster.