accountable care organizations: success factors, provider
TRANSCRIPT

Rapid Review 12
Accountable Care Organizations: Success
Factors, Provider Perspectives and an
Appraisal of the Evidence
Peckham A, Rudoler D, Allin S, Bhatia D, Abdelhalim R, Kavelaars RA, Marchildon, G
March 2019

Rapid Review No. 12
2
This report was produced by the North American Observatory on Health Systems and Policies. The views expressed by the authors are not intended to represent the views of reviewers or partners of the North American Observatory on Health Systems and Policies. Suggested citation: Peckham, A., Rudoler, D., Allin, A., Bhatia, D., Abdelhalim, R., Kavelaars, RA., & Marchildon G. (2019). Accountable Care Organizations: Success factors, Provider Perspectives and an appraisal of the evidence. Toronto: North American Observatory on Health Systems and Policies. Rapid Review (No. 12). Acknowledgements: We would like to gratefully acknowledge the support of Patrick Farrell for copyediting and production support. Please address requests about the publication to: North American Observatory on Health Systems and Policies 155 College Street, Suite 425 Toronto, ON M5T 3M6 © North American Observatory on Health Systems and Policies 2019

North American Observatory on Health Systems and Policies
3
Table of Contents Introduction and Background .................................................................................................................. 4
Methods.................................................................................................................................................. 5
Limitations........................................................................................................................................... 6
Analytic Overview.................................................................................................................................... 7
Factors Associated with High-Performing ACO Models ........................................................................ 7
Provider Experience ........................................................................................................................... 11
Critical Appraisal of ACO Evaluative Literature ................................................................................... 14
Conclusion ............................................................................................................................................. 17
References ............................................................................................................................................ 39

Rapid Review No. 12
4
Introduction and Background There is considerable interest among policy makers and providers in improving care integration with new delivery and funding models. Integrated health care models aim to enable seamless care journeys across sectors to improve an otherwise fragmented and costly approach to care (Embuldeniya, Kirst, Walker, & Wodchis, 2018). The need to improve integration across hospitals and community services is widely recognised both within Canada and internationally (Canada, 2004; Lazar, Lavis, Forest, & Church, 2013; Peckham, Morton-Chang, Williams, & Miller, 2018; Romanow, 2002; Tenbensel et al., 2017). The Ontario government has expressed interest in the potential of Accountable Care Organizations (ACOs) to integrate care across its healthcare systems (Ontario Ministry of Health and Long-Term Care, 2019). ACO models in the United States (U.S.) bring together, on a voluntary basis, groups of providers (physician practices and other health care professionals), community organizations, and hospitals to deliver and coordinate care for patients (Peckham, et al., 2018b). In most cases, hospitals or physician practices act as the ACO lead. ACOs are viewed as mechanisms for improving quality, reducing costs and improving care outcomes (Comfort, Shortell, Rodriguez, & Colla, 2018; D'Aunno et al., 2018; Peckham et al., 2018b). However, the evidence of the impact of ACOs on these outcomes is mixed (Peckham et al., 2018b). In particular, the existing evaluations of ACOs rarely include measures of patient/caregiver experience or population health outcomes (Peckham, et al., 2018b). Moreover, there is a limited understanding of the key drivers of success among studies that have demonstrated some positive impact on either costs, quality, or outcomes. Understanding the factors that contribute to successful design and implementation of ACO models would be instructive for policy makers as they seek to transfer policy lessons to other jurisdictions. Peckham et al. (2018b) identified key characteristics of public ACO models in the U.S. (e.g., Medicare Shared Saving Program) and reviewed the scholarly literature to summarize the evidence of their impact. This present rapid review updates our previous study of the scholarly literature, provides an appraisal of the quality of those identified evaluations, and highlights key factors that distinguish higher performing ACO models. Specifically, we address the following three broad objectives:
1. To identify the key factors and mechanisms involved in ACOs that have demonstrated success. 2. To consider lessons learned from the perspectives of providers working in ACOs. 3. To conduct an appraisal of the evaluative literature.

North American Observatory on Health Systems and Policies
5
Methods Literature Search Strategy This rapid review updates the search strategy used in our previous rapid review on ACO characteristics (Peckham et al. 2018b) and supplements it with hand searching. Briefly, our previous review involved a Medline (Ovid) search using the exploded MeSH term ‘Accountable Care Organizations/’, ran in September 2018, as well as hand searching of key retrieved published literature reviews, such a 2016 rapid review (McMaster Health Forum, 2016) and a 2017 systematic review (Kaufman et al., 2017). As this earlier rapid review considered only studies published between 2015-2018, we re-ran the Medline search in December 2018 to obtain any newly published sources. In addition, we performed an open Google Scholar search using “accountable care organizations” and “predictors of success” or “indicators of success” search terms. We also hand searched the Kaufman et al. (2017) systematic review to obtain evidence published between 2011 (the time of ACO implementation) and 2015. A similar hand search of the McMaster Health Forum (2016) rapid review did not result in any new sources, suggesting that we reached literature saturation. Eligibility criteria: We included quantitative, qualitative, and mixed-methods scholarly sources. Specifically, studies were included in the present rapid review if, 1) they evaluated the impact of ACOs on outcomes, and 2) if they demonstrated that ACOs resulted in improvements in at least one of their pre-specified outcomes. Outcome measures were categorized into quality or process indicators, such as care coordination and safety, preventive healthcare, and chronic disease management; as well as impact or outcome indicators, such as patient experience of care, population health, and healthcare costs.
Success Factors To understand the factors associated with the positive impacts of ACOs, we conducted a thematic analysis of findings from 29 articles retrieved using the literature search described above. From the articles, a researcher (RA) extracted data indicating demonstrated success, as per objective one. Using an extraction form the researcher identified all possible mechanisms or factors that were found or perceived to be associated with positive results. Two other researchers (AP and RA) reviewed the extracted data to find key themes and factors associated with ACO success, such as those demonstrating improvement with respect to cost, quality, and population health, etc. If two or more articles mentioned the factor as a possible reason for success it was documented. This process was inductive and iterative and resulted in the identification of two primary themes—structural and procedural—to describe most of the success factors. These findings should be interpreted cautiously. First, given the quality of evidence, while reasonably the most reliable given the complexity of policy interventions being assessed, findings cannot be interpreted as causal. Second, many of the identified factors were based on interpretations and assumptions made by the authors of the published studies and could not be empirically confirmed. Therefore, there is likely an element of bias that comes into the perceived factors of success. Third, the studies included in the review, did not offer predictions about the longer-term impact of ACOs, and thus

Rapid Review No. 12
6
all of the factors identified reflect aspects of the program’s first three years of implementation. Lastly, our sources were all specific to the U.S. context, which may limit the transferability of these factors to ACO-like models elsewhere.
Provider Perspectives To gain insight into the perspectives of providers working in ACOs, we drew on the literature obtained through the search described above, expanded our search with new search terms, and conducted a thematic analysis of key findings. Specifically, one researcher (DB) extracted provider-related information from each of the 29 articles identified through the literature review noted above. Provider-related information included both direct measures (e.g., surveys or qualitative interviews conducted with ACO leadership and/or staff) and indirect measures (e.g., patient assessments of provider care and changes in spending associated with provider factors, among others). Very few findings were drawn from the literature pulled from the original search. Therefore, we conducted an additional literature search of Medline using the exploded MeSH term “Accountable Care Organizations/” AND “provider/” for the period 2014-2019 and included those that contained provider experiences within an ACO. This search yielded 75 studies. AP conducted a title and abstract screening to identify studies between 2014 and 2019 published in English, with a full-text, and included information on the perspectives of providers involved with an ACO. After this process, the 21 articles were included in the thematic analysis.
Critical Appraisal Our literature search method (described above) yielded 29 papers that used quantitative methods to evaluate an ACO or shared savings program. The vast majority of these studies relied on a quasi-experimental design to estimate the impact of interventions on savings, spending and the quality-of-care delivery across a variety of domains. While our previous review revealed the findings of these studies to be mixed (Peckham et al., 2018b), in this report we draw particular attention to the findings from studies that overcame some of the key methodological challenges with this type of quasi-experimental design use in quantitative analyses (as highlighted in Appendix 1). We applied the consolidated criteria for reporting qualitative research (COREQ) framework and checklist to assess the qualitative studies of ACO performance (Tong, Sainsbury, & Craig, 2007), of which our literature search yielded two. Appendix 3 applies the 32-point COREQ checklist to these two qualitative studies.
Limitations This review was completed over the course of five weeks and therefore is not a comprehensive assessment. Rather, it is a rapid synthesis of recent evaluations of ACOs across the U.S. and provides an analysis of the factors that appear to impact successful implementation of ACO models.

North American Observatory on Health Systems and Policies
7
Analytic Overview Factors Associated with High-Performing ACO Models Our review highlighted several contextual factors that are consistently associated with high-performance in the ACO and shared-savings programs. In the sections below, we present six key contextual factors and discuss some of the reasons why they may be associated with high-performing ACOs. Table 2 summarizes these success factors distilled from the relevant studies that we included in our thematic analysis. Global Budgets, Accountable Quality Contracts and Incentives Many studies highlighted that a shift away from fee-for-service (FFS) reimbursement to population based global budget models was a contributing factor to successful ACO outcomes. Although, it was cautioned that if the funding arrangements do not target specific care processes and outcomes to clinically relevant indicators, then both quality and cost management may not improve for certain patient groups who have higher care needs from the average (Chien et al., 2014; Song et al., 2011). The studies also spoke to the importance of having sufficiently large quality indicators that are clinically relevant and focus on both outcomes and processes in order to improve quality, reduce “stinting of care” control health care spending, and support disadvantaged populations (Christensen & Payne, 2016b; Huskamp et al., 2016; Song et al., 2011; Song et al., 2012; Stuart et al., 2017). One critique of global payment models is a potential reduction in the use of behavioural health services (e.g., spending for children with ADHD). Several of the articles identified in this survey discredited this assumption (Joyce et al., 2017; McWilliams, Landon, & Chernew, 2013). For example, Joyce et al. (2017) found no evidence to suggest there was a reduction in behavioural health service use or spending within the first three years using Accountable Quality Contracts (AQCs). Even with no quality incentives embedded within AQCs directly targeting ADHD support, the study found that the implementation of an AQC was associated with small increases in behavioural health outpatient service use (Joyce et al., 2017). Global payment models in comparison to pay-for-performance programs were thought to “unlock” the benefits of ACOs (Christensen & Payne, 2016a). Huskamp et al. (2016) suggested that global budgets for five-year AQCs (as opposed to traditional annual contracts) provide physicians with the flexibility to coordinate care in a way that traditional FFS models do not encourage by allowing for longer-term preventative approaches aimed at reducing the burden of disease. For example, they studied the effects of an AQC smoking cessation service and found that overtime cessation service use increased, which suggests that the longer the model is in place, the larger the potential outcome may be.
These findings suggest that global payments may offer “spill over” effects. Eliciting responses from participating providers and organizations that target patient care efforts beyond what they are contractually incentivised to do. McWilliams et al. (2013) highlighted AQC participant engagement in several activities that may have influenced patient care, beyond what they were financially responsible

Rapid Review No. 12
8
for (i.e., coordinated care for non-ACO beneficiaries), including changing referral processes, focusing on high-risk case management across multiple payers, and redesigned care patterns to reduce waste. Independent Physician Group ACOs Three articles spoke to the specific value that physician-led ACO models may bring to cost savings (McWilliams, Hatfield, Chernew, Landon, & Schwartz, 2016; McWilliams, Hatfield, Landon, Hamed, & Chernew, 2018; Song, Rose, Chernew, & Safran, 2017). Here we refer to physician groups that are independent from hospitals and not those integrated within them. The McWilliams et al. (2016) study also noted that in 2012 and 2013 ACO cohorts, independent primary care groups were consistently demonstrating greater cost savings than among vertically integrated organizations. Additionally, Medicare Shared Savings Program (MSSP) ACOs led by physician groups were similarly associated with increasing cost savings for Medicare over the study period. In contrast, hospital-led integrated ACOs on average did not produce similar savings (McWilliams et al., 2018). Physician-led ACOs involved in one-sided shared saving contracts improved quality of care metrics, but seemed to have a difficult time lowering spending (Song et al., 2012). ACO models led by independent physician groups were correlated with opportunities for ACO success. This was often attributed to stronger incentives for physician group practices to lower inpatient and hospital outpatient spending than there are for physician groups integrated with hospitals. For example, hospitals’ shared-savings bonuses are not offset by forgone profits from reductions in hospital use (McWilliams et al., 2016; McWilliams et al., 2018). On a related note, the population-based global budget model found in a alternative quality contract (a two-sided population-based payment model) incorporates process-related quality incentives that could provide physician groups the resources necessary to support efforts around improving quality of care for disadvantaged populations (Song et al., 2017). Hospital-led ACOs Another group of three articles highlighted the value of having larger organizations (i.e., hospitals) lead the integration efforts (Geyer et al., 2016; Kelleher et al., 2015; Ryan et al., 2017). However, unlike the studies that assessed physician-led ACOs, the success factors associated with hospital-led ACOs related to their capacity to navigate broader health system structures rather than their ability to achieve cost savings or efficiencies (Geyer et al., 2016; Kelleher et al., 2015; Ryan et al., 2017). We identified three themes that explain the success of hospital-led ACOs: information tracking and sharing (Geyer et al., 2016; Kelleher et al., 2015; Ryan et al., 2017); guideline and procedure usage across a larger community of actors (Kelleher et al., 2015), and; integration of a networks of physicians (Kelleher et al., 2015). Conversely, there were three additional articles that found that the hospital led ACO model may not be a necessary factor for ACO success (Christensen & Payne, 2016b; McWilliams, Chernew, Landon, & Schwartz, 2015; McWilliams et al., 2016). Individual physician groups, patient-centered medical homes and insurers themselves, without any formal integration with hospitals, were seen to be limited in their abilities to track health care use across systems of care (Kelleher et al., 2015). For example, Geyer et al. (2016) found that individuals transferred from referring institutions within the same ACO had lower total hospitalization and imaging

North American Observatory on Health Systems and Policies
9
costs than those who were transferred from outside the ACO. This finding was attributed to an ACO’s ability to share information and imaging results between integrated hospitals. It appears that the non-hospital ACO models are unable to as effectively share information with hospitals. Kelleher et al. (2015) noticed similar outcomes with the “Partners for Kids,” a pediatric ACO that serves an Ohio Medicaid population, and describe the value of using a unified approach, including guidelines for common conditions, collaborative activities for clinicians, and care coordination efforts with pediatric specialty teams. Compared to other children-focused Ohio Medicaid enterprises, Partners for Kids maintained quality and reduced growth in the cost of care. These findings were associated with the capacity for the hospital-led ACO model to bridge coordination gaps and use digital reporting and communications. Similarly, Ryan et al. (2017) highlighted that ACOs increased hospital incentives to reduce readmissions, which may have prompted hospitals to enhance their care coordination and increase the adoption of specific protocols in an attempt to reduce readmissions. These protocols could include estimates of the risk of readmission, discharging patients with follow-up appointments, and using electronic medication reconciliation. The study additionally suggested that hospitals’ voluntary participation in multiple reform programs (e.g., Meaningful Use of Electronic Health Records; the Bundled Payments for Care Improvement [BPCI] initiative’s episode-based payment program) was associated with better outcomes. However, others argue that addressing readmission rates requires much more than just improving discharge processes. Christensen and Payne (2016b) show that in order for an ACO to be effective it needs to concentrate on developing relationships with and care for the patient in the community, beyond the care offered within the ACO hospital itself. While Kelleher et al. (2015) emphasized the value of partnering with community physicians and specialty practice groups, McWilliams et al. (2016) note how financial integration between physicians and hospitals may actually increase commercial health care prices (and increase bargaining power) and thus that such integration is not a necessary factor contributing to ACO success. Estimated savings were similar in ACOs with financial integration between hospitals and physician groups in comparison to those without such financial integration. A Focus on Higher-risk and Lower SES Populations TThe baseline link between beneficiaries and spending seem to impact overall success at year one and two. This “baseline” theme identified that ACOs with different starting points (e.g., FFS versus risk contracting) would find cost savings by targeting various populations (e.g., higher-risk populations) (McWilliams et al., 2015; Song et al., 2012). Similarly, ACOs would target different baseline levels of patients (e.g., high-cost patients) and would see varying degrees of cost savings as a result. These reported outcomes may not be sustainable beyond the first few years of ACO implementation, and as noted above, may reflect a regression to the mean. Song et al. (2012) found that changes in utilization are possible in the early years of a global payment contract for providers entering from FFS models. Whereas providers with risk-contracting experience were more likely to achieve cost savings from referrals to less costly providers. McWilliams et al. (2015) highlighted that ACOs with higher-baseline spending were initially better able to reduce spending than ACOs with lower-baseline spending.

Rapid Review No. 12
10
Additionally, many studies stressed that much of the cost savings found in ACOs for year one and two were attributed to an initial focus on case management for high-cost, high-risk, clinically vulnerable, and medically complex patients (Colla et al., 2016; McWilliams, Landon, Chernew, & Zaslavsky, 2014; Nyweide et al., 2015; Song et al., 2011). McWilliams et al. (2014) also noted that quality of care improved in particular for clinically complex patients who were a primary focus of the ACO. Physician Turnover Turnover rates of physicians participating in ACOs was associated with a reduction in cost savings in follow-up years (Nyweide et al., 2015). Similarly, attribution length for physicians of two-or-more years, was associated with a decrease in the number of inpatient days (Christensen & Payne, 2016a). This attribution length was also associated with a reduction in readmission rates to hospitals that was not the previous discharging hospital (Christensen & Payne, 2016b). However, this attribution rate was also due to an increase in the number of physician visits. Interestingly, attribution of 13-18 months was related to a decrease in cost, yet this decrease diminished with extended attribution (Christensen & Payne, 2016a). Shifting Care to Outpatient Providers Some studies identified that a reduction in spending resulted from a decline in inpatient utilization among ACO-aligned beneficiaries (Kelleher et al., 2015; Nyweide et al., 2015). These types of results were assumed to be due to referrals to care settings that have contracted lower prices (Nyweide et al., 2015). This benefited costs for ACOs who shifted care to outpatient providers who charged lower fees for high-risk enrollees (Barry et al., 2015; Song et al., 2011). One implication for Medicare-based ACOs, which regulate prices, is that they may only be able to achieve savings through changes in utilization (Song et al., 2012).

North American Observatory on Health Systems and Policies
11
Table 2: ACO Factors of Success
Global
Budgets and AQC
Independent Physician Groups
Hospital-led ACO Models & Integrated
Physician Groups
Baseline Level and Initial outcomes
Length of Attribution
Shifting Care to Outpatient Providers
Assume 100% Risk
Barry, 2015 ✓ Chien, 2014 ✓ Christensen, 2016a ✓ ✓
Christensen, 2016b ✓ ✗ ✓
Colla, 2016 ✓ Geyer, 2016 ✓ ✓ Huskamp, 2016 ✓
Joyce, 2017 ✓ Kelleher, 2015 ✓ ✓ ✓
Lowell, 2018 ✗ ✗*
McWilliams, 2013 ✓
McWilliams, 2014 ✓
McWilliams, 2015
✗ ✓
McWilliams, 2016 ✓ ✗
McWilliams, 2018
✓
Nyweide, 2015 ✓ ✓ ✓
Ryan, 2017 ✓ ✓ Song, 2011 ✓ ✓ ✓ Song, 2012 ✓ ✓ ✓ ✓ Song, 2017 ✓ Stuart, 2017 ✓
* As noted in the table above whether ACO models that assumed a 100% risk were able to reduce spending remained unclear since very few ACOs assumed 100% risk in the first year. However, of those that did there was significantly lower Medicare spending.
Provider Experience Below we discuss the themes that emerged from an analysis of provider perspectives within the ACO experience. Physician Support for Non-FFS Payment The studies we reviewed found that physician support for changing payment mechanisms away from FFS was mixed. On the one hand, there was some indication that the professional goals of physicians and the manner in which physicians practice medicine is more compatible with quality-based payment approaches than through FFS alone (Schur & Sutton, 2017). Similar to the “spill over” effects noted above (McWilliams et al., 2013), ne study suggested that advanced-payment ACO providers were likely to provide higher-quality care for non-ACO patients, to lower treatment costs for non-ACO patients, and to change how physicians care for patients regardless of ACO enrollment (Schur & Sutton, 2017). On the other hand, it was noted that the underlying familiarity and confidence with FFS models could

Rapid Review No. 12
12
counteract physician motivations for engaging in ACO models. Some physicians might not be willing to take the risks involved with embracing the vision of the ACO, which would reduce their FFS income in the short term and defer the possibility of shared savings to a later date (Phipps-Taylor & Shortell, 2016). Expanded Scope of Practice and Team Composition There was consistency across many of the studies that a lack of meaningful engagement and formalized team composition deterred some non-physician providers from participating in ACO models. More specifically, the studies spoke to the value of involving nurses, pharmacists, and surgeons in ACOs. Expanding the scope of practice and ensuring team composition was used optimally were seen as key success factors in six studies (Bagwell, Bushy, & Ortiz, 2017; Gittell, Beswick, Goldmann, & Wallack, 2015; Joseph et al., 2017; Stapleton, Chang, Rattner, & Ferris, 2018; Traynor, 2016; Wright, 2017). here was agreement that this required clear communication of formalized team roles was an important component to the successful development of ACOs(Bagwell et al., 2017; Gittell et al., 2015; Joseph et al., 2017; Traynor, 2016; Wright, 2017). A formalized approach to broaden scope of practice was seen to offset some of the burden associated with new care approaches and reporting requirements. Such an approach was also seen as an opportunity to reduce workplace stress and employee turnover (Phipps-Taylor & Shortell, 2016). Medicare ACO regulations stipulate that patients managed by nurse practitioners (NPs—who tend to be in more rural settings, and often frail and with a lower socioeconomic status) are unable to participate in ACO models unless first seen by a qualified physician (Wright, 2017). Nurses are described as making valuable contribution to ACO models, particularly in rural settings (Bagwell et al., 2017). New Hampshire has over 10 NP-led practices and the results are promising. NPs in that state have demonstrated attainment of 29 quality metrics while maintaining a low cost of care delivery. During the program’s second year, no NP-managed patients were hospitalized and their hospital admission rates were among the lowest in New Hampshire (Wright, 2017). Similarly, several studies suggest there are grounds for including pharmacists more formally within ACO models (Joseph et al., 2017; Traynor, 2016). A current deterrent for pharmacists relates to a revenue generation issue where they are unable to bill for pharmacy services (Traynor, 2016). While current ACO benchmark measures do not include medication adherence and costs, there is likely a role for pharmacists to play with the another 20 patient safety, chronic disease management, and preventive health-related metrics (Joseph et al., 2017). Formally including pharmacist services within an ACO was seen to offer value with respect to readmission rates and face-to-face consultations with patients. In the assessment of one study, if pharmacists are expected to take on financial risks they “need to collaborate with other members of the health care team” (Joseph et al., 2017). Surgeons and specialists are also rarely considered regarding their involvement in ACOs despite surgery representing 50% of hospital expenditures. Similar to pharmacists, ACO indicators do not directly include those relevant to surgery. Indicators relevant to surgery are also not always considered as important. For example, when ACO leads were asked the importance of reducing unnecessary surgery, they rated it as ‘medium’, ‘low’ or ‘very low’. Interviews with ACO leadership highlighted that surgical

North American Observatory on Health Systems and Policies
13
care was not a part of the strategic plans (Dupree et al., 2014). Another article highlighted that development of strategic plans and inclusion of teams in the plan has a direct effect on providers willingness to participate in ACOs (Wan, Demachkie Masri, Ortiz, & Lin, 2014). Another article described a validated teamwork intervention based on findings from a relational coordination survey (Valentine, Nembhard, & Edmondson, 2015). Gittell et al. (2015) notes that supporting relational coordination across health sectors is critical for team success. This can be done by developing opportunities to learn about team members and understand scopes of practice. This approach was said to lead to improved goal alignment and create more respectful interactions, which appear to be helpful for successful ACO development. Clinically Relevant and Transparent Quality Metrics ACO quality metrics are not always seen to be clinically relevant. FFor example, thresholds for meeting a metric might be absolute and therefore exclude from consideration the patient’s starting point. Providers urge that the earliest stages of the patient’s path through the care system needs to be considered since improvements to them are clinically relevant and positive for patients. Yet, there value remains in the current indicator approach as it offers a consistent way to understand the impact of ACO initiatives (Phipps-Taylor & Shortell, 2016). The increasing use of ACOs are encouraging a movement toward clear and transparent reporting (Dupree et al., 2014; Phipps-Taylor & Shortell, 2016). Since surgeons are expected to participate in local, regional, or national outcome registries and as reported above, their degree of involvement varies. Surgeons believe they should be consulted when defining the future of surgical care and the metrics that will be developed to ensure they are clinically relevant and foster surgeon trust and buy-in (Stapleton et al., 2018). The use of consistent and transparent reporting of metrics is found to lead to care practitioner mastery and self-improvement as well as to self-reflection and friendly competition. However, transparent metrics also triggered a fear of failure among some providers, and certain administrators were concerned about their role in demotivating others (Phipps-Taylor & Shortell, 2016). Motivation for Joining an ACO and Influencing change Our findings have shown the importance of having physician involvement in ACOs either as physician-led or financially integrated under hospital-led. One interesting motivating factor demonstrated byPhipps-Taylor and Shortell (2016) as to offer physicians the choice of participating in an ACO or not. h They highlight that motivating physician behaviour seemed to be most effective when relying on nonfinancial incentives. For example, they suggested there may be additional mechanisms to enable physicians to develop their self-mastery and have a greater impact on patients (i.e., use of transparent metrics). The authors also noted that despite these motivational elements, most ACOs are not deploying the full range of such opportunities (i.e., for self-mastery, supporting social purpose, etc.). Closing this gap offers ACOs an opportunity for development. As noted above, ACO metrics do not specifically target the concerns and domains of surgeons. This coupled with the prospect that shared savings likely will not motivate surgeons, creates a situation
Rapid Review No. 12
14
where the primary strategy is to rely on the direct referrals of primary care physicians to influence surgeons, so they do not lose patient referral streams due to poor performance (Dupree et al., 2014). Surgeons most likely to participate include those who are already in group practices (1.6x or 60% greater odds of joining an ACO), and those practicing in integrated health systems (nearly 5x or 500% greater odds of joining an ACO) (Resnick, Graves, Buntin, Richards, & Penson, 2018). Other providers highlighted that ACOs that have support for coordination was a “very important” factor in their decision for joining an ACO (L&M Policy Research, 2016). Additionally, advanced payment funds supported the initiation of many provider ACOs where providers believe they would not have been able to financially support the development of their ACOs on their own without the advanced payments (L&M Policy Research, 2016). There were eight barriers to ACO participation identified in Wan et al. (2014): 1) lack of leadership support or commitment, 2) inadequate financial incentives, 3) legal and regulatory barriers, 4) fear of losing autonomy, 5) lack of adequate capital for health information technology and infrastructure development, 6) inadequate number of primary care providers and specialists available, 7) inadequate number of patient population served by the facility, and 8) no affiliation with any health care network. Those who perceived their organizations as lacking leadership support or commitment and adequate financial incentives, and facing legal and regulatory barriers to ACO adoption were less likely to participate in ACOs in the future (Wan et al., 2014). If strategic plans and strong commitment from senior leadership didn’t exist together with a lack of IT and investment in capacity building, these factors directly affected one’s willingness to participate in an ACO (Wan et al., 2014)
Critical Appraisal of ACO Evaluative Literature Quantitative Appraisal In this section, we summarize the findings from the quantitative studies that were higher quality, following our critical appraisal. We found seven studies that achieved a number of our assessment criteria. However, it is important to note that no quasi-experimental study is able to address all possible sources of confounding, much of which is unobserved by the researcher. Thus, it is important to interpret the results of these studies as associations, rather than unbiased estimates of the strength of causal relationships. Based on these criteria (described in Appendix 2), we identified seven higher quality studies. The findings of these seven studies are summarized in Table 1.

North American Observatory on Health Systems and Policies
15
Table 1. Summary of findings from 7 Higher Quality Papers Evaluating ACOs Study Summary of Findings
Song et al., 2011 The implementation of the Blue Cross Blue Shield of Massachusetts ACQ was associated with “modest slowing of spending growth and improved quality.” While a higher-quality study based on our criteria, the authors only observed one year of outcomes post-implementation.
McWilliams et al., 2013
Studied the impact of the ACQ observing two years of implementation (2009 and 2010) and two years post-implementation. The authors found that the implementation of the ACQ was associated with lower spending after the second year, particularly in outpatient care, procedures, imaging, and tests. They also found associations with improvements in some quality of process measures for diabetes and cardiovascular disease, but not with hospitalization, readmission, or cancer screening.
McWilliams et al., 2016
Evaluated the performance of MSSP ACOs, and compared primary care groups to hospital-integrated groups. The authors found that the introduction of the MSSP ACOs was associated with reduced Medicare spending by the ACOs that entered the MSSP in 2012, but not those that entered in 2013. Generally, savings were greater among primary care groups than hospital-integrated groups. The authors found mixed results on measures of quality.
McWilliams et al., 2017
This study evaluated the impact of the MSSP on post-acute care spending and utilization. The authors found that participation in an MSSP was associated with reductions in post-acute care spending without any reduction in care quality.
Song et al., 2017
Studied the impact of the ACQ on spending and quality of process and outcome measures comparing enrollees with both lower- and higher socioeconomic statuses. The Difference-in-difference-in-difference approach was used to compare enrollees to non-enrollees across these socioeconomic strata. Their findings suggested that the implementation of the ACQ was generally associated with improvements in quality of process measures, and that the magnitude of the improvement was higher among those of lower socioeconomic status. However, the authors found no difference in outcome measures or spending across SES strata.
McWilliams et al., 2018
This study evaluated the impact of the MSSP after three years of operation. In particular, the authors studied whether the savings achieved by early adopters were replicated by newer ACOs. The authors found that participation in the MSSP was associated with reductions in Medicare spending among physician-led groups, but not among hospital-integrated ACOs.
Resnick et al., 2018
This study evaluated the impact of MSSP ACO enrollment on changes in appropriate cancer screening rates. Appropriateness was determined based on patient age and predicted survival. If screening increased for those who would most benefit and decreased for those who would not, then appropriateness was improved. The authors found that enrollment in an MSSP ACO was associated with “modest” improvements in appropriate breast and colorectal cancer screening. MSSP ACO enrollment was also associated with decreased prostate cancer screening regardless of age or predicted survival.
We found consistent themes across the seven higher-quality studies selected. The Accountable Quality Contract (ACQ) program was found to achieve cost savings (Song et al. 2011; McWilliams 2013), but had mixed results with respect to quality improvements. The studies by Song et al. (2013; 2017) were more favourable in terms of quality measures, but did not find any impact on patient outcomes (e.g., hospitalization and readmission). Studies of the Medicare Shared Savings Program (MSSP) ACOs found evidence of at least modest savings that were maintained over time (McWilliams et al., 2016; 2017; 2018). However, these savings seemed to be sustained only for physician-led groups, not hospital-integrated ACOs (McWilliams 2016; 2018). Evidence regarding improvements in quality of process measures were found (McWilliams et al. 2016; Resnick et al. 2018), but evidence for improvements in overall quality and patient outcomes was mixed (McWilliams 2016). These studies were not able to identify statistically the factors that were associated with the impacts described above, with two exceptions. First physician-led ACOs on average achieved longer-term cost-savings than hospital-led ACOs. Second, ACOs that focused on higher-risk populations and those with lower socio-economic status (SES) tended to achieve greater improvements in savings and quality of

Rapid Review No. 12
16
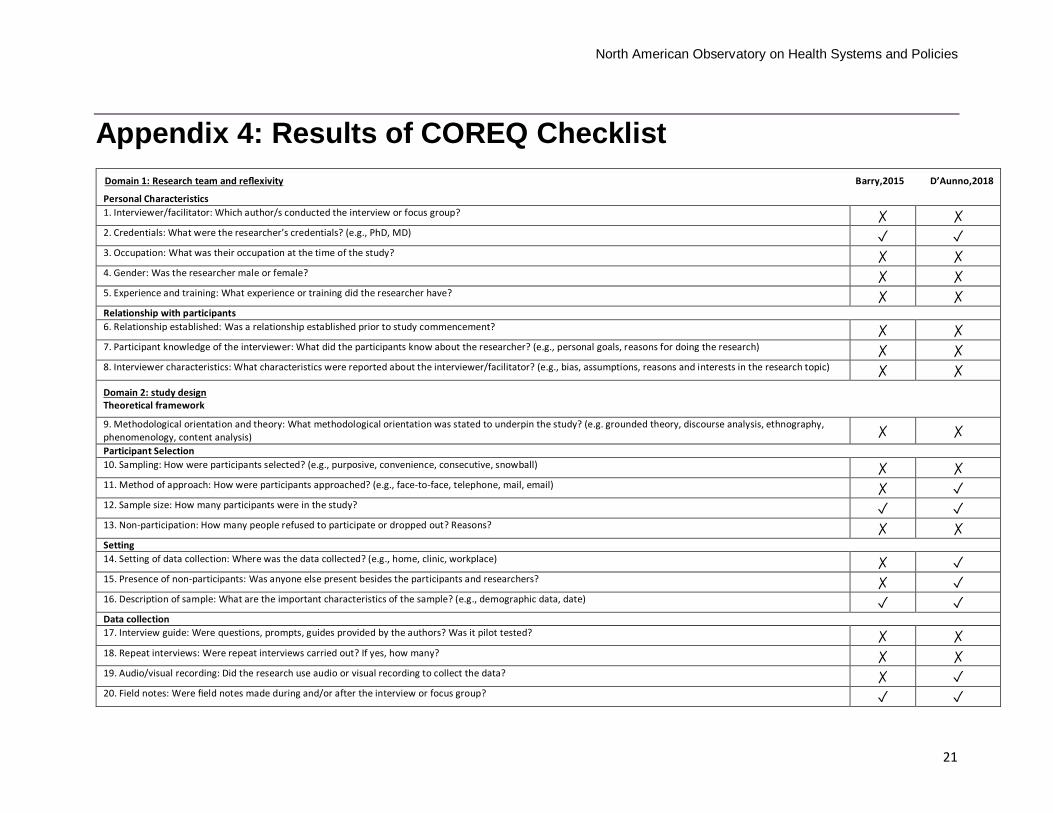
process measures than ACOs that focused on lower-risk and higher-SES populations. However, this latter finding may reflect a regression to the mean as opposed to a true impact of the ACO. Qualitative Appraisal We identified two qualitative studies highlighting ACO impact (Barry et al., 2015; D'Aunno et al., 2018). Note that Barry et al. (2015) used mixed methods; therefore, interpreting the critical appraisal in this manner may be unbalanced. Similarly, D'Aunno et al. (2018) c conducted a sequential design where the quantitative component informed the collection of qualitative data. Appendix 3 describes 32 criteria for reporting qualitative methods and results as applied to the two studies: Barry et al. (2015) met a total of four and D'Aunno et al. (2018) met a total of 16. Box two summarizes the main findings from this appraisal.
Box 2. Appraisal of Qualitative Studies Reflexivity Reflexivity refers to the understanding and recognition of the influence that a study may bring to the research process (e.g., how they select and/or engage with participants). Reflexivity also acknowledges how key characteristics of the researcher (e.g., age, gender, ethnicity, profession, etc.) may influence their design of the research project. Both articles made note of the researchers’ credentials. However, these were not described in a manner that would allow a reader to understand their potential influence on the research process or the power dynamics involved. Research Question, Sample, and Study Design The research question guides the type of people chosen to interview, observe, and/or the text to by analyzed. Within qualitative research, sampling and data collection continues until a comprehensive understanding of the phenomena under study has been achieved. Researchers will often speak of the “saturation,” which occurs when new participants are not identifying new trends and themes. Neither article referred to saturation or described the process of data collection as reaching the point where no new information could be collected. Neither article highlighted an overarching theoretical orientation or framework. However, D'Aunno et al. (2018) did imply that they were employing a case-study approach. The two articles under assessment did not provide significant details in terms of sampling techniques but did provide some detail about those interviewed. Overall the participants selected seemed appropriate to the research questions. Data collection and appropriateness of using interviews for the specific aim and objectives of the study seemed justified. Interview questions were presented more clearly in Barry et al. (2015) than in D'Aunno et al. (2018). However, what specific questions were asked, if a framework informed the development of the questions, whether the interview process was iterative (e.g., if interview questions were adapted based on earlier interviews), and if different questions were asked of different participants, were not noted. Analysis and Reporting Neither study provided a clear description of a systematic form of analysis. Quotes were not used in (Barry et al., 2015) but were used in (D'Aunno et al., 2018). However, even in D'Aunno et al. (2018) not every theme made use of a quote and not all quotes spoke clearly to the larger theme in which they were presented. Both studies would be difficult to be replicated. However, they both attempt to draw broader conclusions using prior literature and experiences in order for the findings to be relevant and transferable to different settings. The findings presented offer little “truth value” in the sense that it is difficult to determine how accurately the researchers interpreted the experiences of the participants. There was also limited description of how credibility was achieved (e.g., through member checking, or researcher reflexivity and understanding characteristics that may have influenced the research process). Overall, neither of the studies provided detailed descriptions of the design approach and analysis. This limits the trustworthiness of the findings and the “fittingness” or the applicability of these findings to other settings.

North American Observatory on Health Systems and Policies
17
Conclusion Based on this rapid review, we have been able to isolate three elements that appear to be crucial to the success of ACOs.
1. Physician involvement: physician-led ACOs appear to hold the most promise in terms of quality and cost outcomes. For hospital-led ACOs, financial integration with physicians is associated with increased chance of success.
2. Global budgets and Accountable Quality Contracts: global budgets encourage the development of processes that include estimating the risk of readmission, discharging patients with follow-up, and the use of electronic medication reconciliation. This approach allows for flexibility, and encourages the use of more preventative strategies.
3. Team-based approaches: Interdisciplinary teams were associated with improved mediation reconciliation, reduced service utilization, stronger provider buy-in, meeting the needs of the most vulnerable populations from rural locations, and reduced workplace stress. The deliberate inclusion of and supports for interdisciplinary teams were valued by providers and impacted their decision to join an ACO.
Given the evidence supporting physician-led ACOs, Ontario can build on its existing team based-based care (e.g., Family Health Teams, Community Health Centres, and Nurse-Practitioner led-clinics) approaches to leverage ACO-like models. Many of Ontario’s team-based models informally partner with community support service agencies, a key factor for ACOs to reduce readmission rates. Thus, formalizing partnerships or strengthening existing networks may similarly lead to positive impacts on care quality and cost. With the closure of the Community Care Access Centres and possibly some of the Local Health Integration Networks, consideration will have to be given towards how best to access and leverage the various existing community support service agencies. The role of Ontario’s independent hospitals will need to be reconsidered. Based on the evidence, they could serve as a partner in physician- or community-led integrated care models. Alternatively, hospitals could act as ACO leads but should do so only if they hire salaried or contracted physicians. Where savings were achieved, they were largely attributed to the reduction in the utilization of outpatient and diagnostic services, without corresponding reductions in quality or patient outcomes. One predictor of success may be the extent to which ACOs can identify and avoid lower-value or inappropriate outpatient and diagnostic services. Of particular relevance to Ontario is that Medicare-based ACOs (which regulate prices—like Ontario) will only be able to achieve savings through changes in utilization. Lastly, any ACO-like model should have a built-in process and outcome performance measurement framework with regular and formalized collection, monitoring, evaluation, and reporting back mechanisms. There is agreement in the literature that these measures should be developed with providers to be sure they are of clinical relevance.

Rapid Review No. 12
18
Appendix 1: Methodological Challenges Associated with Quasi-Experimental Design Randomized experiments are the gold-standard for estimating the strength of causal relationships between any exposure and any outcome. This is because the process of randomization can balance other exposures (known as confounders) across exposed and non-exposed study participants. If randomization is successful, researchers can be confident that any differences in the outcome between groups could only be explained by the exposure of interest. Randomization is often not possible for studies of policy change. This is certainly the case for ACOs and shared savings programs, where enrollment is voluntary. In contexts where randomization is not possible, researchers often turn to quasi-experimental designs. One such common approach used to evaluate policy change is the difference-in-differences (DD) method. The DD method relies on a longitudinal study design, where individuals can be observed before and after a policy change. It also involves a comparison group that is not exposed to the policy change. The DD method relies on two core assumptions: 1) exchangeability, and 2) no time-varying confounding. Exchangeability ensures that if the comparison group was miraculously swapped with the intervention group in the pre-policy change period, the results of the study would not change. Experimental designs achieve exchangeability through randomization. DD studies must rely on the structure of the data, statistical methods and an in-depth knowledge of the policy context. To determine if the exchangeability assumption is satisfied, researchers must ensure that the pre-policy trends for the outcomes of interest are parallel. Only then can the trend for the outcome in the comparison group provide a reliable counterfactual for the intervention group in the post-policy period. The assumption of no time-varying confounding ensures that there are no changes over time that differentially impact the intervention and comparison groups in ways that could affect the outcome. An example of this would be a contemporaneous policy change that impacts one group and not the other and that also impacts on the outcome of interest. Appendix 1 summarizes the criteria by which we assessed the literature, including the use of appropriate modelling techniques and robustness checks recommended in the literature.

North American Observatory on Health Systems and Policies
19
Appendix 2: Criteria for Quality Assessment of Quantitative Studies
Criteria Description Exchangeability 1. More than one pre-period
To assess whether trends for the outcome in the pre-policy period are parallel, there is more than one pre-period time point (Strumpf, Harper, & Kaufman, 2017; Imbens & Wooldridge, 2009).
2. Graphical and/or statistical evaluation of parallel trends
The trends are evaluated graphically and/or statistically to determine if they are comparable (Strumpf, Harper, & Kaufman, 2017; Ionescu-Ittu et al., 2015).
3. Weighted/matched regression
Use propensity score matching or weighting to balance intervention and comparison groups on observable baseline characteristics (Stuart et al., 2014).
4. Comparison of trends for observable characteristics
Assess changes over time in the composition of the intervention and comparison groups (Strumpf, Harper, & Kaufman, 2017).
5. Fixed effects
Use fixed effects at the regional, organizational, or practice-level to control for any differences between intervention and comparison groups that do not change over time (Allison, 2009).
No Time-Varying Confounding 1. Test whether pre-policy trend
predicts policy change Use statistical tests to determine whether the trend for the outcome in the pre-policy period predicts the policy change (Strumpf, Harper & Kaufman 2017).
2. Control for or discuss potential sources of time-varying confounding
Provide a discussion of sources of potential time-varying confounding (e.g., contemporaneous policy changes) and control for them where possible.
3. Uses difference-in-difference-in-differences model
Employ a difference-in-difference-in-differences model to control for potential time-varying confounding (Wooldridge, 2010).
Modelling 1. Difference functional forms are
considered
If the outcome is non-linear, consider alternative functional forms (Williams, 2000).
2. Standard errors are adjusted for clustering and serial correlation
Adjust standard errors and inferential statistics for correlation between individuals in a practice/group and within individuals over time (Bertrand et al., 2004).
3. Large number of groups (organizations, regions, practices)
Include a large number of groups (e.g., ACOs) to improve the power of inferential statistics (Bertrand et al., 2004).
4. Placebo testing Test the robustness of estimates by determining whether the statistical models find an effect in places they should not (e.g., outcomes not affected by policy change, time-periods before policy change) (Strumpf, Harper, & Kaufman 2017; Lipsitch et al., 2010).

Rapid Review No. 12
20
Appendix 3: COREQ 32-Point Checklist Domain 1: Research team and reflexivity Personal Characteristics 1. Interviewer/facilitator: Which author/s conducted the interview or focus group? 2. Credentials: What were the researcher’s credentials? (e.g., PhD, MD) 3. Occupation: What was their occupation at the time of the study? 4. Gender: Was the researcher male or female? 5. Experience and training: What experience or training did the researcher have? Relationship with participants 6. Relationship established: Was a relationship established prior to study commencement? 7. Participant knowledge of the interviewer: What did the participants know about the researcher? (e.g., personal goals, reasons for doing the research) 8. Interviewer characteristics: What characteristics were reported about the interviewer/facilitator? (e.g., bias, assumptions, reasons and interests in the research topic) Domain 2: study design Theoretical framework 9. Methodological orientation and theory: What methodological orientation was stated to underpin the study? (e.g., grounded theory, discourse analysis, ethnography, phenomenology, content analysis, participant selection) 10. Sampling: How were participants selected? (e.g., purposive, convenience, consecutive, snowball) 11. Method of approach: How were participants approached? (e.g., face-to-face, telephone, mail, email) 12. Sample size: How many participants were in the study? 13. Non-participation: How many people refused to participate or dropped out? Reasons? Setting 14. Setting of data collection: Where was the data collected? (e.g., home, clinic, workplace) 15. Presence of non-participants: Was anyone else present besides the participants and researchers? 16. Description of sample: What are the important characteristics of the sample? (e.g., demographic data, date) Data collection 17. Interview guide: Were questions, prompts, guides provided by the authors? Was it pilot tested? 18. Repeat interviews: Were repeat interviews carried out? If yes, how many? 19. Audio/visual recording: Did the research use audio or visual recording to collect the data? 20. Field notes: Were field notes made during and/or after the interview or focus group? 21. Duration: What was the duration of the interviews or focus group? 22. Data saturation: Was data saturation discussed? 23. Transcripts returned: Were transcripts returned to participants for comment and/or correction? Domain 3: analysis and findings Data analysis 24. Number of data coders: How many data coders coded the data? 25. Description of the coding tree: Did authors provide a description of the coding tree? 26. Derivation of themes: Were themes identified in advance or derived from the data? 27. Software: What software, if applicable, was used to manage the data? 28. Participant checking: Did participants provide feedback on the findings? Reporting 29. Quotations presented: Were participant quotations presented to illustrate the themes/findings? Was each quotation identified? (e.g., participant number) 30. Data and findings consistent: Was there consistency between the data presented and the findings? 31. Clarity of major themes: Were major themes clearly presented in the findings? 32. Clarity of minor themes: Is there a description of diverse cases or discussion of minor themes?
North American Observatory on Health Systems and Policies
21
Appendix 4: Results of COREQ Checklist Domain 1: Research team and reflexivity Barry,2015 D’Aunno,2018
Personal Characteristics 1. Interviewer/facilitator: Which author/s conducted the interview or focus group? ✗ ✗ 2. Credentials: What were the researcher’s credentials? (e.g., PhD, MD) ✓ ✓ 3. Occupation: What was their occupation at the time of the study? ✗ ✗ 4. Gender: Was the researcher male or female? ✗ ✗ 5. Experience and training: What experience or training did the researcher have? ✗ ✗ Relationship with participants 6. Relationship established: Was a relationship established prior to study commencement? ✗ ✗ 7. Participant knowledge of the interviewer: What did the participants know about the researcher? (e.g., personal goals, reasons for doing the research) ✗ ✗ 8. Interviewer characteristics: What characteristics were reported about the interviewer/facilitator? (e.g., bias, assumptions, reasons and interests in the research topic) ✗ ✗ Domain 2: study design Theoretical framework
9. Methodological orientation and theory: What methodological orientation was stated to underpin the study? (e.g. grounded theory, discourse analysis, ethnography, phenomenology, content analysis) ✗ ✗ Participant Selection 10. Sampling: How were participants selected? (e.g., purposive, convenience, consecutive, snowball) ✗ ✗ 11. Method of approach: How were participants approached? (e.g., face-to-face, telephone, mail, email) ✗ ✓ 12. Sample size: How many participants were in the study? ✓ ✓ 13. Non-participation: How many people refused to participate or dropped out? Reasons? ✗ ✗ Setting 14. Setting of data collection: Where was the data collected? (e.g., home, clinic, workplace) ✗ ✓ 15. Presence of non-participants: Was anyone else present besides the participants and researchers? ✗ ✓ 16. Description of sample: What are the important characteristics of the sample? (e.g., demographic data, date) ✓ ✓ Data collection 17. Interview guide: Were questions, prompts, guides provided by the authors? Was it pilot tested? ✗ ✗ 18. Repeat interviews: Were repeat interviews carried out? If yes, how many? ✗ ✗ 19. Audio/visual recording: Did the research use audio or visual recording to collect the data? ✗ ✓ 20. Field notes: Were field notes made during and/or after the interview or focus group? ✓ ✓

Rapid Review No. 12
22
21. Duration: What was the duration of the interviews or focus group? ✗ ✓ 22. Data saturation: Was data saturation discussed? ✗ ✗ 23. Transcripts returned: Were transcripts returned to participants for comment and/or correction? ✗ ✗ Domain 3: analysis and findings
Data analysis
24. Number of data coders: How many data coders coded the data? ✗ ✗ 25. Description of the coding tree: Did authors provide a description of the coding tree? ✗ ✓ 26. Derivation of themes: Were themes identified in advance or derived from the data? ✗ ✓ 27. Software: What software, if applicable, was used to manage the data? ✗ ✓ 28. Participant checking: Did participants provide feedback on the findings? ✗ ✗
Reporting 29. Quotations presented: Were participant quotations presented to illustrate the themes / findings? Was each quotation identified? (e.g., participant number) ✗ ✓ 30. Data and findings consistent: Was there consistency between the data presented and the findings? ✗ ✓ 31. Clarity of major themes: Were major themes clearly presented in the findings? ✗ ✓ 32. Clarity of minor themes: Is there a description of diverse cases or discussion of minor themes? ✗ ✓

North American Observatory on Health Systems and Policies
23
Appendix 5: ACO Evaluation Studies (2011-2018) Study Methods ACO Model Main Findings
ASCP 20141 Design: Brief report.
Data sources: Key informant interviews.
Study period: 2014.
Population: Clinical pharmacists.
ACOs (model not specified).
Comparison: None.
Two key areas where pharmacists have an opportunity to get involved are medication reconciliation and transition of care. Other areas may include patient education and reducing readmission rates. Adequate integration of pharmacists in ACOs will involve focusing on team-based care within ACOs and informing physicians of the pharmacy scope of practice.
Bagwell 20172 Design: Qualitative study.
Data sources: Telephone interviews.
Study period: 2012-2013.
Population: ACO administrators.
ACO, Rural Health Clinics (RHC).
Comparison: None.
Predominant themes: 1) ACOs are growing in size and number and have various organizational structures; 2) there is an expanding emphasis on preventive primary care and chronic disease management for patients; and 3) there is a need for improved information technology integration with clinical services and financial systems.
Busch 20163
Design: Quasi-experimental difference-in-differences model.
Data sources: Medicare claims.
Study period: 2008-2013.
Population: Medicare beneficiaries with a mental health diagnosis.
Medicare Shared Savings Program (MSSP) and Pioneer ACO.
Comparison: Medicare beneficiaries not assigned to a Medicare ACO.
Reduced spending on mental health hospital admissions. No changes in total mental health spending. No changes in hospital readmissions, outpatient follow-up after a mental health admission, rates of depression diagnosis, number of enrollees with a mental health diagnosis.
1 American Society of Consultant Pharmacists (ASCP). (2014). A new opportunity for pharmacists: Accountable care organizations. ASCP Reports. The Consultant Pharmacist, 29(9), 570. doi: 10.4140/TCP.n.2014.570. 2 Bagwell, M.T., Bushy, A., & Ortiz, J. (2017). Accountable care organization implementation experiences and rural participation. Journal of Nursing Administration, 47(1), 30-34. 3 Busch, A. B., Huskamp, H. A., & McWilliams, M. (2016). Early efforts by Medicare accountable care organizations have limited effect on mental illness care and management. Health Affairs, 35(7), 1247-1256.

Rapid Review No. 12
24
Castle 20164 Design: Description of implementation of the Accountable Care Units within the Emory Healthcare system.
Data sources: Not applicable.
Study period: 2009.
Population: Not applicable.
Accountable Care Units (ACU).
Comparison: Not applicable.
The ACU is a “disruptive innovation” that radically reconfigures the way care is delivered on inpatient acute care units. The model dissolves the barriers to interprofessional collaborative, team-based, patient-centered care that confront nurses, physicians, and other health care providers on traditional units.
Chien 20145 Design: Quasi-experimental difference-in-differences model.
Data sources: Blue Cross Blue Shield Massachusetts (BCBMA) claims.
Study period: 2006-2010.
Population: Pediatric (0-21 y.o.) enrolees.
Alternative Quality Contract (AQC) (pediatric services).
Comparison: Enrollees whose designated PCP was not affiliated with AQC.
Increase in pediatric care quality composite measure in AQC, relative to non-AQC patients during the first two years of the contract.
Christensen 2016a6 Design: Retrospective cohort.
Data sources: Medicaid claims.
Study period: 2013-2015.
Population: Pediatric Medicaid enrollees at Children’s Hospitals and Clinics (CHC) of Minnesota.
Integrated Health Partnership (Pediatric Medicaid ACO).
Comparison: None.
Continuous receipt of pediatric primary care services from ACO for two years associated with reduced inpatient days, but increase in office visits, emergency department visits, and use of pharmaceuticals. Changes in health service utilization were mirrored by cost reductions.
4 Castle, B. W., & Shapiro, S. E. (2016). Accountable care units: A disruptive innovation in acute care delivery. Journal of Nursing Administration , 40(1), 14-23. 5 Chien, A. T., Song, Z., Chernew, M. E., Landon, B. E., McNeil, B. J., Safran, D. G., & Schuster, M. A. (2014). Two-year impact of the Alternative Quality Contract on pediatric health care quality and spending. Pediatrics, 133(1), 96-104. 6 Christensen, E. W., & Payne, N. R. (2016a). Effect of attribution length on the use and cost of health care for a pediatric Medicaid accountable care organization. JAMA Pediatrics, 170(2), 148-154.

North American Observatory on Health Systems and Policies
25
Christensen 2016b7 Design: Retrospective cohort.
Data sources: Medicaid claims.
Study period: 2013-2015.
Population: Pediatric Medicaid enrollees at Children’s Hospitals and Clinics (CHC) of Minnesota (< 20 years of age).
Integrated Health Partnership (Pediatric Medicaid ACO).
Comparison: None.
Continuous receipt of pediatric primary care services from ACO for two years associated with reduced 30-day readmission rate at hospitals other than the discharging hospital, but not the discharging hospital. Reduction in the cost per inpatient episode of care for all patients.
Chukmaitov 20198 Design: Quasi-experimental difference-in-differences model.
Data sources: Medicare claims.
Study period: 2010-2013.
Population: Medicare ACO-affiliated and non-affiliated hospitals.
Medicare Shared Savings Program (MSSP) and Pioneer ACO.
Comparison: Hospitals not participating in ACOs, propensity score-matched to ACO practices.
A decrease was found in preventable hospitalizations for COPD and asthma and for diabetes complications for ACO participating hospitals, but no significant differences for preventable CHF hospitalizations and 30-day readmissions.
Colla 20169 Design: Quasi-experimental difference-in-differences model.
Data sources: Medicare claims.
Study period: 2009-2013.
Population: Medicare beneficiaries (general) and clinically-vulnerable subgroup (at least 3 hierarchical condition categories, HCC).
Medicare Shared Savings Program (MSSP).
Comparison: Medicare beneficiaries not assigned to a Medicare ACO.
Reduction in beneficiary-level spending in ACO Medicare beneficiaries and clinically vulnerable subgroup. Reduction in hospitalizations, emergency department visits in both general and clinically-vulnerable ACO groups.
7 Christensen, E. W., & Payne, N. R. (2016b). Pediatric inpatient readmissions in an accountable care organization. The Journal of Pediatrics, 170, 113-119. 8 Chukmaitov, A., Harless, D. W., Bazzoli, G. J., & Muhlestein, D. B. (2019). Preventable hospital admissions and 30-day all-cause readmissions: does hospital participation in accountable care organizations improve quality of care? American Journal of Medical Quality, 34(1), 14-22. 9 Colla, C. H., Lewis, V. A., Kao, L. S., O’Malley, J., Chang, C. H., & Fisher, E. S. (2016). Association between Medicare accountable care organization implementation and spending among clinically vulnerable beneficiaries. JAMA Internal Medicine, 176(8), 1167-1175.

Rapid Review No. 12
26
Comfort 201810 Design: Descriptive study.
Data sources: National Survey of ACO, Medicare claims, S&K Office Based Physicians Database from QuintilesIMS.
Study period: 2017.
Population: ACO practices.
Medicare Shared Savings Program (MSSP).
Comparison: None.
There is greater heterogeneity within ACO types than between ACO types. There were no consistent differences on core quality indicators by ACO type, nor were there differences in likelihood of achieving savings or overall spending per-person-year. There was evidence for higher spending on physician services for physician-led ACOs.
D’Aunno 201811 Design: Mixed methods study.
Data sources: Qualitative interviews and Medicare claims.
Study period: 2011-2012.
Population: ACO leadership.
Medicare Shared Savings Program (MSSP).
Comparison: None.
Factors that distinguish high- from low-performing ACOs: 1) collaboration with hospitals; 2) effective physician group practice prior to ACO engagement; 3) trusted, long-standing physician leaders focused on improving performance; 4) sophisticated use of information systems; 5) effective feed-back to physicians; and 6) embedded care coordinators.
Dupree 201412 Design: Mixed methods study.
Data sources: Case studies and surveys.
Study period: 2012.
Population: ACO leadership.
Medicare Shared Savings Program (MSSP) and Pioneer ACO.
Comparison: None.
ACOs have so far devoted little attention to surgical care. Instead, they have emphasized coordinating care for patients with chronic conditions and reducing unnecessary hospital readmissions and ED visits. In the years to come, ACOs will likely focus more on surgical care. Some ACOs are able to affect surgical practice patterns through referral pressures, but local market conditions may limit ACOs’ abilities to alter surgeons’ behavior.
10 Comfort, L. N, Shortell, S. M., Rodriguez, H. P., & Colla, C. H. (2018). Medicare accountable care organizations of diverse structures achieve comparable quality and cost performance. Health Services Research Educational Trust. doi: 10.1111/1475-6773.12829. 11 D’Aunno, T., Broffman, L., Sparer, M., & Kumar, S. R. (2018). Factors that distinguish high-performing accountable care organizations in the Medicare Shared Savings Program. Health Services Research Educational Trust, 53(1), 120-137. doi: 10.1111/1475-6773.12642. 12 Dupree, J. M., Patel, K., Singer, S. J., West, M., Zinner, M. J., & Weissman, J. S. (2014). Attention to surgeons and surgical care is largely missing from early Medicare Accountable Care Organizations. Health Affairs, 33(6), 972-979.

North American Observatory on Health Systems and Policies
27
Green 201613 Design: Quasi-experimental difference-in-differences model, key informant interviews, and physician surveys.
Data sources: Medicare claims.
Study period: 2012-2014.
Population: Medicare beneficiaries.
Advance Payment (AP) ACO (20 practices in 2012, 36 in 2013).
Comparison: Medicare beneficiaries in the AP ACO market, not assigned to any Medicare ACO.
No significant change in quality indicators or Medicare spending. More AP ACO physicians were involved in decision to participate in ACO, agreed that the ACO model is effective at providing high-quality cost-effective care, and that remaining competitive in the local market is important than physicians in other ACO.
Gittel 201514 Design: Literature review.
Data sources: Literature review by Valentine, Nembhard, and Edmondson (2013).
Study period: 2013.
Population: Studies on measures of teamwork that meet all criteria for psychometric validation (internal consistency, interrater reliability, structural validity, and content validity).
Not applicable. Health care systems and change agents seeking to respond to the challenges of accountable care can use TeamSTEPPS as a validated multilevel teamwork intervention methodology, enhanced by relational coordination as a validated multilevel teamwork measure with diagnostic capacity to pinpoint opportunities for improving teamwork along specific dimensions (e.g., shared knowledge, timely communication) and in specific role relationships (e.g., nurse/medical assistant, emergency unit/medical unit, primary care/specialty care).
Hofler 201615 Design: Descriptive study.
Data sources: Medicare claims.
Study period: 2012-2013.
Population: Rural Health Clinics.
ACO, Rural Health Clinics (RHC).
Comparison: RHCs that did not join an ACO.
Joining an ACO raises cost/visit. The jump in cost can be substantial, with point estimates ranging from 14% to nearly 21%. This increase lasts at least two years. The rise seems to be less in the second year.
13 Green, L. on behalf of L&M Policy Research. (2016). Evaluation of CMMI accountable care organization Initiatives: Advance payment aco final report. Available at: https://innovation.cms.gov/files/reports/advpayaco-fnevalrpt.pdf 14 Gittel, J. H., Beswick, J., Goldmann, D., & Wallack, S. S. (2015). Teamwork methods for accountable care: Relational coordination and TeamSTEPPS. Health Care Management Review, 40(2), 116-125. 15 Hofler, R. A., & Ortiz, J. (2016). Costs of accountable care organization participation for primary care providers: Early stage results. BMC Health Services Research, 16(315). doi: 10.1186/s12913-016-1556-6.

Rapid Review No. 12
28
Hsu 201716 Design: Descriptive study.
Data sources: Partners HealthCare (Massachusetts) claims.
Study period: 2012-2014.
Population: ACO physicians and affiliated patients.
Pioneer ACO.
Comparison: None.
Few beneficiaries per physician in ACOs (<5% of a typical panel). Substantial physician turnover, with more than half either joining or leaving the contract during the study period. When physicians left the ACO, most of their attributed beneficiaries did also. Conversely, about half of the growth in the beneficiary population was because of new physicians affiliating with the ACO; the remainder joined after switching physicians.
Joseph 201717 Design: Literature review.
Data sources: EBSCOhost and MEDLINE.
Study period: 2009-2016.
Population: Studies on pharmacist-driven service within ACO.
ACOs (model not specified).
Comparison: None.
Barriers to integrating pharmacists in primary care ACOs: lack of awareness of pharmacist roles in primary care; complex laws and regulations surrounding clinical protocols, such as collaborative practice agreements; provider status that allows compensation for pharmacist services; and limited access to medical records. By understanding and maximizing the role of pharmacists, several opportunities exist to better manage the medication-use process in value-based care settings.
Kelleher 201518 Design: Quasi-experimental difference-in-differences model.
Data sources: Medicaid fee-for-service (FFS) and managed care claims, 15 Agency for Healthcare Research and Quality (AHRQ) Pediatric Quality Indicators, and four Partners for Kids (PFK) quality indicators.
PFK Pediatric Medicaid ACO 2011-2013.
Comparison: Same population 2008-2010.
Reduced growth in costs over time per beneficiary. Increase in quality of care on five quality measures (including two composite measures), decline on three quality measures, and no difference on remaining eight quality indicators.
16 Hsu, J., Vogeli, C., Price, M., Brand, R., Chernew, M. E., Mohta, N., & Chaguturu, S. K. (2017). Substantial physician turnover and beneficiary 'churn' in a large Medicare pioneer ACO. Health Affairs, 36(4), 640-648. 17 Joseph, T., Hale, G. M, Eltaki, S. M., Prados, Y., Jones, R., Seamon, M. J., Moreau, C., & Gernant, S. A. (2017). Integration strategies of pharmacists in primary care-based accountable care organizations: A report from the accountable care organization research network, services, and education. Journal of Managed Care & Specialty Pharmacy, 23(5), 541-48. 18 Kelleher, K. J., Cooper, J., Deans, K., Carr, P., Brilli, R. J., Allen, S., & Gardner, W. (2015). Cost saving and quality of care in a pediatric accountable care organization. Pediatrics, 135(3), e582-e589.

North American Observatory on Health Systems and Policies
29
Study period: 2008-2013.
Population: Pediatric Medicaid recipients at Nationwide Children’s Hospital in Ohio.
Kleiner 201719 Design: Retrospective study.
Data sources: Medicare claims.
Study period: 2009.
Population: Physicians.
Medicare Shared Savings Program (MSSP).
Comparison: None.
While most physician practices would fall below the threshold that could raise anticompetitive concerns, this varies considerably by market and specialty. Furthermore, the largest physician practice in most markets potentially remains at risk for antitrust review under the existing criteria.
Lowell 201820
Design: Retrospective cohort.
Data sources: Medicare claims.
Study period: 2013-2017.
Population: Medicare beneficiaries.
New Generation ACO Model (NGACO) (18 practices launched in 2016).
Comparison: Medicare beneficiaries not aligned with NGACO.
Decrease in hospital length of stay and number of outpatient and wellness visits. Reduction in Medicare spending (reduction in post-acute care spending was the most important contributor). Value of preventive care, comprehensive care management, and provider partnerships emphasized in interviews.
McWilliams 201321 Design: Quasi-experimental difference-in-differences model.
Data sources: Medicare claims.
Study period: 2007-2010.
Population: Medicare beneficiaries.
Alternative Quality Contract (AQC).
Comparison: Enrollees whose designated PCP was not affiliated with AQC.
Lower spending per beneficiary following exposure to the AQC. This was largely driven by lower spending on outpatient care in year two, particularly for beneficiaries with five or more conditions. Annual rates of low-density lipoprotein cholesterol testing among beneficiaries with diabetes and cardiovascular disease improved; no significant changes on other quality metrics.
19 Kleiner, S. A., Ludwinski, D., & White, D. W. (2017). Antitrust and accountable care organizations: Observations for the physician market. Medical Care Research and Review, 74(1), 97-108. 20 NORC at the University of Chicago. (2018). Next Generation Accountable Care Organization (NGACO) Model Evaluation: First Annual Report (Report prepared for Centers for Medicare & Medicaid Services). Retrieved from https://innovation.cms.gov/Files/reports/nextgenaco-firstannrpt.pdf 21 McWilliams, J. M., Landon, B. E., & Chernew, M. E. (2013). Changes in health care spending and quality for Medicare beneficiaries associated with a commercial ACO contract. JAMA, 310(8), 829-836.

Rapid Review No. 12
30
McWilliams 201422 Design: Quasi-experimental difference-in-differences model.
Data sources: Medicare claims, Consumer Assessment of Healthcare Providers and Systems (CAHPS) survey.
Study period: 2009-2013.
Population: Medicare beneficiaries.
Medicare ACOs (Shared Savings Program, MSSP, Pioneer, and Advanced Payment, AP).
Comparison: Medicare beneficiaries not aligned with ACO.
After ACO contracts began, patients’ reports of timely access to care and their primary physicians’ being informed about specialty care differentially improved in the ACO group. Patients’ ratings of physicians, interactions with physicians, and overall care did not differentially change. Among patients with multiple chronic conditions and high predicted Medicare spending, overall ratings of care differentially improved in the ACO group as compared with the control group.
McWilliams 201623 Design: Quasi-experimental difference-in-differences model.
Data sources: Medicare claims.
Study period: 2009-2013.
Population: Medicare beneficiaries.
Medicare Shared Savings Program (MSSP).
Comparison: Medicare beneficiaries not aligned with ACO.
Increased total and per beneficiary savings; savings consistently greater in independent primary care groups than in hospital-integrated groups among 2012 and 2013 MSSP entrants. No difference on the use of low-value services. But Improvement on some quality indicators.
McWilliams 201724 Design: Descriptive analysis.
Data sources: Medicare claims.
Study period: 2009-2014.
Population: Medicare beneficiaries.
Medicare Shared Savings Program (MSSP).
Comparison: Medicare beneficiaries not aligned with ACO.
Reduction in post-acute spending driven by reductions in acute inpatient care, discharges to facilities other than home, and length of skilled nursing facility (SNF) stays. No difference in 30-day readmissions, use of highly rated SNF, or mortality.
22 McWilliams, J. M., Landon, B. E., Chernew, M., & Zaslavsky, A. M. (2014). Changes in patients’ experiences in Medicare accountable care organizations. New England Journal of Medicine, 371, 1715-1724. 23 McWilliams, J. M., Hatfield, L. A., Chernew, M. E., Landon, B. E., & Schwartz, A. L. (2016). Early performance of accountable care organizations in Medicare. New England Journal of Medicine, 374(24), 2357-2366. 24McWilliams, J. M., Gilstrap, L. G., Stevenson, D. G., Chernew, M. E., Huskamp, H. A., & Grabowski, D. C. (2017). Changes in postacute care in the Medicare Shared Savings Program. JAMA Internal Medicine, 177(4), 518-526.
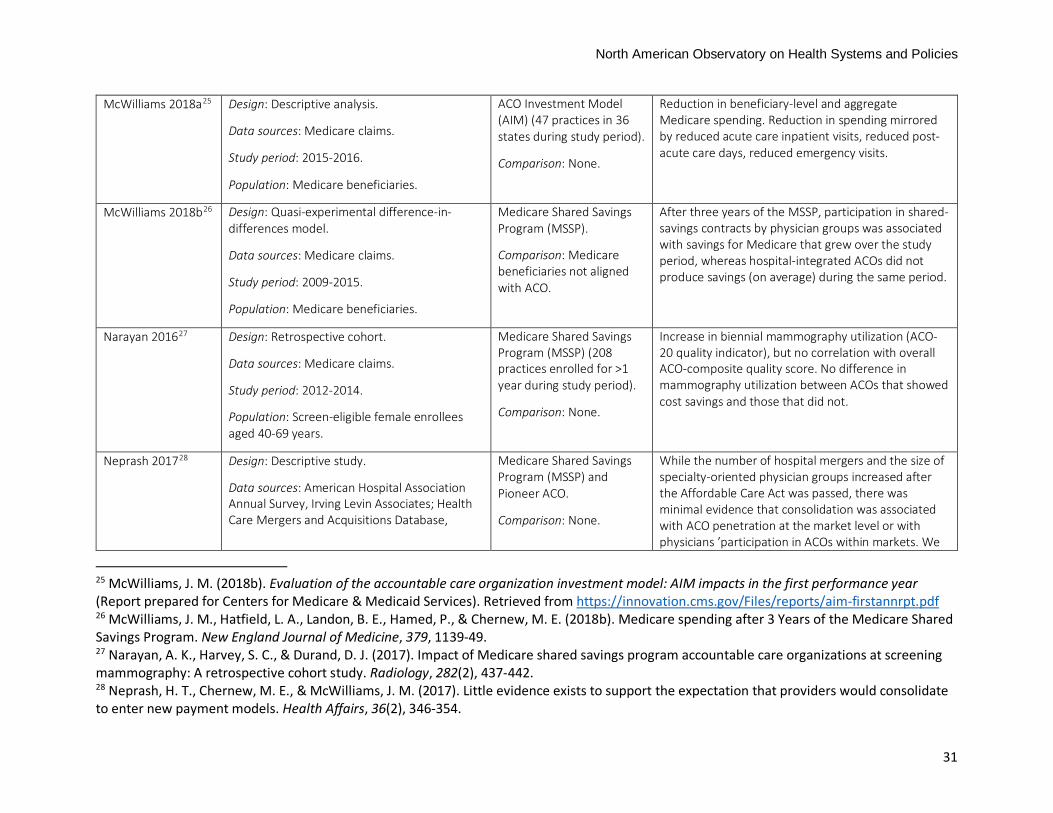
North American Observatory on Health Systems and Policies
31
McWilliams 2018a25
Design: Descriptive analysis.
Data sources: Medicare claims.
Study period: 2015-2016.
Population: Medicare beneficiaries.
ACO Investment Model (AIM) (47 practices in 36 states during study period).
Comparison: None.
Reduction in beneficiary-level and aggregate Medicare spending. Reduction in spending mirrored by reduced acute care inpatient visits, reduced post-acute care days, reduced emergency visits.
McWilliams 2018b26 Design: Quasi-experimental difference-in-differences model.
Data sources: Medicare claims.
Study period: 2009-2015.
Population: Medicare beneficiaries.
Medicare Shared Savings Program (MSSP).
Comparison: Medicare beneficiaries not aligned with ACO.
After three years of the MSSP, participation in shared-savings contracts by physician groups was associated with savings for Medicare that grew over the study period, whereas hospital-integrated ACOs did not produce savings (on average) during the same period.
Narayan 201627
Design: Retrospective cohort.
Data sources: Medicare claims.
Study period: 2012-2014.
Population: Screen-eligible female enrollees aged 40-69 years.
Medicare Shared Savings Program (MSSP) (208 practices enrolled for >1 year during study period).
Comparison: None.
Increase in biennial mammography utilization (ACO-20 quality indicator), but no correlation with overall ACO-composite quality score. No difference in mammography utilization between ACOs that showed cost savings and those that did not.
Neprash 201728 Design: Descriptive study.
Data sources: American Hospital Association Annual Survey, Irving Levin Associates; Health Care Mergers and Acquisitions Database,
Medicare Shared Savings Program (MSSP) and Pioneer ACO.
Comparison: None.
While the number of hospital mergers and the size of specialty-oriented physician groups increased after the Affordable Care Act was passed, there was minimal evidence that consolidation was associated with ACO penetration at the market level or with physicians ’participation in ACOs within markets. We
25 McWilliams, J. M. (2018b). Evaluation of the accountable care organization investment model: AIM impacts in the first performance year (Report prepared for Centers for Medicare & Medicaid Services). Retrieved from https://innovation.cms.gov/Files/reports/aim-firstannrpt.pdf 26 McWilliams, J. M., Hatfield, L. A., Landon, B. E., Hamed, P., & Chernew, M. E. (2018b). Medicare spending after 3 Years of the Medicare Shared Savings Program. New England Journal of Medicine, 379, 1139-49. 27 Narayan, A. K., Harvey, S. C., & Durand, D. J. (2017). Impact of Medicare shared savings program accountable care organizations at screening mammography: A retrospective cohort study. Radiology, 282(2), 437-442. 28 Neprash, H. T., Chernew, M. E., & McWilliams, J. M. (2017). Little evidence exists to support the expectation that providers would consolidate to enter new payment models. Health Affairs, 36(2), 346-354.

Rapid Review No. 12
32
Medicare claims, Truven Health MarketScan Commercial Database.
Study period: 2008-2014.
Population: Physicians.
conclude that payment reform has been associated with little acceleration in consolidation in addition to trends already under way, but there is evidence of potential defensive consolidation in response to new payment models.
Noble 201429 Design: Qualitative study.
Data sources: Interviews with individuals working at ACOs and those working at public health or similar agencies.
Study period: 2013.
Population: Purposive sample of 29 individuals at 4 ACOs and 10 individuals at 6 public health units.
ACOs (model not specified).
Comparison: Public health units.
Interviewees working for ACOs most often viewed “population health” as referring to a defined group of their organisation’s patients, though a few applied the phrase to people living in a geographical area. In contrast, interviewees working for public health agencies were more likely to consider “population health” from a geographical perspective.
Nyweide 201530
Design: Quasi-experimental difference-in-differences model.
Data sources: Medicare claims.
Study period: 2010-2013.
Population: Medicare beneficiaries with full Part A and B coverage.
Pioneer ACO.
Comparison: Medicare beneficiaries in the same markets, eligible but not assigned to Pioneer ACO.
Reduced utilization of physician services, emergency department, and post-acute care. Lower rate of spending increase (per beneficiary and aggregate). Higher mean score for timely care and clinician communication.
Ortiz 201531 Design: Descriptive study. ACO, Rural Health Clinics (RHC).
Comparison: None.
Several characteristics about RHCs indicate that they may be slow to participate in ACOs. However, other characteristics, including their perception that ACOs may improve the quality of care and health outcomes of their patients and communities, may facilitate the
29 Noble, D. J., Greenhalgh, T., & Casalino, L. P. (2014). Improving population health one person at a time? Accountable care organisations: perceptions of population health—a qualitative interview study. BMJ Open, 4:e004665. doi: 10.1136/bmjopen-2013-004665 30 Nyweide, D. J, Lee, W., Cuerdon, T. T., Pham, H. H., Cox, M., Rajkumar, R., & Conway, P.H. (2015). Association of pioneer accountable care organizations vs traditional Medicare fee for service with spending, utilization, and patient experience. JAMA, 213(21), 2152-2161. 31 Ortiz, J., Hofler, R. A., Lin, Y. L., & Berzon, R. (2015). Participation of rural health care providers in accountable care organizations: Early indications. The Health Care Manager, 34(3), 255-264.

North American Observatory on Health Systems and Policies
33
Data sources: Centre for Medicare & Medicaid Services (CMS) OSCAR (Online Survey, Certification, and Reporting).
Study period: 2007-2011.
Population: Rural Health Clinics operating during 2006-2012.
process of RHCs joining ACOs, should they choose to do so. Addressing the health care needs and health care quality of rural populations must be part of the design, development, and performance monitoring of ACOs of the future.
Phipps 201632 Design: Conceptual framework.
Data sources: 9 well-established and empirically tested theories of motivation.
Study period: Not applicable.
Population: Not applicable.
ACOs (model not specified).
Comparison: Not applicable.
Motivating behavior change within ACOs goes beyond financial incentives. ACOs are using a broad range of motivators, including creating ways to make a greater impact on patients and opportunities to be a more effective physician, such as mastery and social purpose.
Resnick 2018a33 Design: Quasi-experimental difference-in-differences model.
Data sources: Medicare claims.
Study period: 2007-2010.
Population: Medicare beneficiaries.
Medicare Shared Savings Program (MSSP).
Comparison: Medicare beneficiaries not aligned with ACO.
Breast cancer screening rates declined in both ACO and non-ACO groups in the post period, with the most pronounced decline among elderly women; the decline in younger women was minimal. Slight increase in colorectal cancer screening overall in both groups, particularly among younger individuals; absolute rates remained below those for breast cancer screening. Prostate cancer screening declined in both ACO and non-ACO groups, with larger decline in the ACO group. Overall, ACO enrollment was associated with more appropriate breast and colorectal screening, although the magnitude of the observed ACO effect is modest in the early ACO experience.
32 Phipps-Taylor, M., & Shortell, S. (2016). More than money: Motivating physician behavior change in accountable care organizations. The Milbank Quarterly, 94(4), 832-861. 33 Resnick, M. J., Graves, A. J., Thapa, S., Gambrel, R., Tyson, M. D., Lee, D., Buntin, M. B., & Penson, D.F. (2018a). Medicare Accountable Care Organization Enrollment and Appropriateness of Cancer Screening. JAMA Internal Medicine, 178(5), 648-654.

Rapid Review No. 12
34
Resnick 2018b34 Design: Retrospective study.
Data sources: SK&A physician survey.
Study period: 2015.
Population: Surgeons.
ACOs (model not specified).
Comparison: None.
Few surgeons participate in ACOs and considerable variation exists across practices. Factors associated with participation include surgeon specialty, practicing within a group practice or an integrated system.
Richards 201835 Design: Retrospective study.
Data sources: SK&A physician survey.
Study period: 2015.
Population: Physicians.
ACOs (model not specified).
Comparison: None.
Horizontal and vertical integration strongly influences measures of physician concentration; however, ACOs have limited impact overall. ACOs are often present in competitive markets, and only in a minority of these markets do ACOs substantively increase physician concentration.
Ryan 201836 Design: Quasi-experimental difference-in-differences model.
Data sources: Hospital Compare (publicly-available national data on hospital readmissions).
Study period: 2008-2015.
Population: Hospitals participating and not participating in Medicare’s Hospital Readmission Reduction Program (HRRP).
Medicare Shared Savings Program (MSSP) and Pioneer ACO.
Comparison: Hospitals not participating in HRRP.
Significant reductions in 30-day readmissions for patients with acute myocardial infarction, heart failure, and pneumonia.
34 Resnick, M. J., Graves, A. J., Buntin, M. B., Richards, M. R., & Penson, D.F. (2018b). Surgeon participation in early accountable care organizations. Annals of Surgery, 267(3), 401-407. 35 Richards, M. R., Smith, C. T., Graves, A. J., Buntin, M. B., & Resnick, M. J. (2018). Physician competition in the era of accountable care organizations. Health Services Research, 53(2), 1272-1285. doi: 0.1111/1475-6773.12690. 36 Ryan, A. M., Krinsky, S., Adler-Milstein, J., Damberg, C. L., Maurer, K. A., & Hollingworth, J.M. (2017). Association between hospitals’ engagement in value-based reforms and readmission reduction in the hospital readmission reduction program. JAMA Internal Medicine, 177(6), 862-868.

North American Observatory on Health Systems and Policies
35
Song 201137 Design: Quasi-experimental difference-in-differences model.
Data sources: Blue Cross Blue Shield Massachusetts BCBMA) claims.
Study period: 2006-2009.
Population: BCBMA enrollees.
Alternative Quality Contract (AQC)
Comparison: Enrollees whose designated PCP was not affiliated with AQC.
Modest slowing of spending growth in AQC system. Savings driven by shifts in outpatient care toward facilities with lower fees; from lower expenditures for procedures, imaging, and testing; and from a reduction in spending for enrollees with the highest expected spending. Improvement in chronic disease management and pediatric care quality indicators, but not adult preventive care.
Song 201238 Design: Quasi-experimental difference-in-differences model.
Data sources: Blue Cross Blue Shield Massachusetts BCBMA) claims.
Study period: 2006-2010.
Population: BCBMA enrollees.
Alternative Quality Contract (AQC)
Comparison: Enrollees whose designated PCP was not affiliated with AQC.
Slowing in the rate of spending in the AQC group. Savings were accounted for by lower prices achieved through shifting procedures, imaging, and tests to facilities with lower fees, as well as reduced utilization among some groups. Quality of care also improved compared to control organizations, with chronic care management, adult preventive care, and pediatric care within the contracting groups improving more in the first than the second year.
Stapleton 201839 Design: Brief report.
Data sources: Not applicable.
Study period: Not applicable.
Population: Surgeons.
ACOs (model not specified).
Comparison: None.
Surgeons have an active role to play in ACOs, particularly in terms of controlling costs. They should be involved in setting quality standards for ACOs, determining appropriateness of care, and adjusting for patient risk.
Schwartz 201540
Design: Quasi-experimental difference-in-differences model.
Pioneer ACO.
Comparison: Medicare beneficiaries attributed to
Reduced utilization of low-value services (low to no clinical benefit). Reduced spending on low-value services.
37 He, Y., Ellis, R. P., Mechanic, R. E., Day, M. P., & Chernew, M. E. (2011). Health care spending and quality in year 1 of the Alternative Quality Contract. New England Journal of Medicine, 365, 909-18. 38 Song, Z., Safran, D. G., Landon, B. E., Landrum, M. B., He, Y., Mechanic, R.E., Day, M. P., & Chernew, M. E. (2012). The ‘Alternative Quality Contract,’ based on a global budget, lowered medical spending and improved quality. Health Affairs, 31(8), 1885-1894. 39 Stapleton, S. M., Chang, D. C., Rattner, D. W., & Ferris, T. G. (2018). Along for the ride? Surgeon participation in accountable care organizations. Annals of Surgery, 267(3),408-410. 40 Schawrtz, A. L., Chernew, M. E., Landon, B. E., & McWilliams, J. M. (2015). Changes in low-value services in year 1 of the Medicare

Rapid Review No. 12
36
Data sources: Medicare claims.
Study period: 2009-2012.
Population: Medicare beneficiaries with full Part A and B coverage.
other health care providers.
Schur 201741 Design: Descriptive study.
Data sources: National physicians survey.
Study period: 2014-2015.
Population: Physicians.
Medicare ACOs (Shared Savings Program, MSSP, Pioneer, Advanced Payment, AP).
Comparison: None.
Many participating physicians’ views are not aligned with ACO goals. Physicians are divided as to whether the ACO model is effective. Most of them view the local health care environment as moving away from fee-for-service payment alone. However, these physicians seem largely comfortable with their own ability to adapt to the shift toward value-based payment and may not view the ACO model as necessary to their success in doing so.
Trainor 201642 Design: Brief report.
Data sources: Key informant interviews.
Study period: 2016.
Population: Clinical pharmacists.
Pioneer ACO.
Comparison: None.
Few ACO practices directly involve or contract pharmacists. Pharmacists perform medication therapy management, education of patients about proper medication use, polypharmacy management, transitional care, and medication adherence and reminder programs. This may be especially helpful for high-cost patients. Next Generation ACO models are seeking to more formally integrate pharmacists in their teams. Barriers may include lack of explicit incentives for involving pharmacists in ACOs.
Wan 201443 Design: Quasi-experimental study.
Data sources: Survey.
Medicare ACOs (Shared Savings Program, MSSP,
When the number of perceived benefits is greater than the number of perceived barriers, health care managers are more likely to reveal a stronger commitment to develop a strategic plan for ACO
Pioneer accountable care organization program. JAMA Internal Medicine, 175(11), 1815-1825. 41 Schur, C. L., & Sutton, J.P. (2017). Physicians in Medicare ACOs offer mixed views of model for healthcare cost and quality. Health Affairs, 36(4), 649-654. 42 Trainor, K. (2016). Pharmacists’ participation in ACO has room to grow. American Journal of Health-System Pharmacy, 73(9), e118-e119. 43 Wan, T. H., Demachkie Mastri, M., Ortiz, J., & Blosson, Y. (2014). Willingness to participate in accountable care organizations: Health care managers’ perspective. The Health Care Manager, 33(1), 64-74.

North American Observatory on Health Systems and Policies
37
Study period: 2012.
Population: Healthcare managers.
Pioneer, Advanced Payment, AP).
Comparison: Non-ACO practices.
adoption. Health care managers who perceived their organizations as lacking leadership support or commitment, financial incentives, and legal and regulatory support to ACO adoption were less willing to participate in ACOs in the future.
Winblad 201744 Design: Quasi-experimental difference-in-differences model.
Data sources: Medicare claims.
Study period: 2007-2013.
Population: Medicare beneficiaries discharged from hospitals to post-acute care skilled nursing facilities (SNFs).
Medicare Shared Savings Program (MSSP) (162 hospitals) and Pioneer ACO (64 hospitals).
Comparison: General metropolitan hospitals not participating in MSSP or Pioneer ACO (1,844 hospitals).
Reduction in 30-day, 1-3-day (premature-discharge indicator), and 4-30-day (SNF-quality indicator) rehospitalization.
Wright 201745 Design: Descriptive study.
Data sources: Blue Cross Blue Shield claims.
Study period: 2012-2014.
Population: Nurse practitioners.
Anthem Blue Cross Blue Shield Patient-Centered Shared Savings Program (PCSSP).
Comparison: None.
Nurse practitioners in PCSSP have met or exceeded the minimum scores for 29 quality metrics along with a demonstrated cost-savings in the first 2 years of the program. Hospitalization rates for NP-managed patients are among the lowest in the state. Cost of care for NP-managed patients is $66.85 less per member per month than the participating physician-managed patients.
Zhang 201746
Design: Quasi-experimental difference-in-differences model.
Data sources: Medicare claims.
Pioneer ACO.
Comparison: Medicare beneficiaries eligible for but not aligned with Pioneer or Medicare
Savings in overall Medicare Part A and B spending. No difference in Part D (drug) spending, total prescriptions filled, and proportion of brand-name drugs.
44 Winblad, U., Mor, V., McHugh, J. P., & Rahman, M. (2017). ACO-affiliated hospitals reduced rehospitalizations from skilled nursing facilities faster than other hospitals. Health Affairs, 36(1), 67-73. 45 Wright, W.L. (2017). New Hampshire nurse practitioners take the lead in forming an accountable care organization. Nursing Admininstration Quarterly, 41(1), 39-47. 46 Zhang, Y., Caines, K. J., & Powers, C. A. (2017). Evaluating the effects of pioneer accountable care organizations on Medicare part d drug spending and utilization. Medical Care, 55(5), 470-475.

Rapid Review No. 12
38
Study period: 2011-2012.
Population: Medicare beneficiaries with Part D drug coverage.
Shared Savings Program (MSSP) ACO.

North American Observatory on Health Systems and Policies
39
References Allison, P. D. (2009). Fixed effects regression models (Vol. 160). SAGE publications. Bagwell, M. T., Bushy, A., & Ortiz, J. (2017). Accountable Care Organization Implementation Experiences
and Rural Participation: Considerations for Nurses. J Nurs Adm, 47(1), 30-34. doi:10.1097/NNA.0000000000000433
Barry, C. L., Stuart, E. A., Donohue, J., M, Greenfield, S., F, Kouri, E., Duckworth, K., . . . Huskamp, H. A. (2015). The early impact of the ‘Alternative Quality Contract’on mental health service use and spending in Massachusetts. Health Affairs, 34(12), 2077-2085.
Bertrand, M., Duflo, E., et al. (2004) How much should we trust differences-in-differences estimates? Quarterly Journal of Economics, 119 (1), 249–275.
Canada, H. (2004). Royal Commission on Health Services 1961-1964. Retrieved from https://www.canada.ca/en/health-canada/services/health-care-system/commissions-inquiries/federal-commissions-health-care/royal-commission-health-services.html
Chien, A. T., Song, Z., Chernew, M. E., Landon, B. E., McNeil, B. J., Safran, D. G., & Schuster, M. A. (2014). Two-year impact of the alternative quality contract on pediatric health care quality and spending. Pediatrics, 133(1), 96-104.
Christensen, E. W., & Payne, N. R. (2016a). Effect of Attribution Length on the Use and Cost of Health Care for a Pediatric Medicaid Accountable Care Organization. JAMA Pediatr, 170(2), 148-154. doi:10.1001/jamapediatrics.2015.3446
Christensen, E. W., & Payne, N. R. (2016b). Pediatric Inpatient Readmissions in an Accountable Care Organization. J Pediatr, 170, 113-119. doi:10.1016/j.jpeds.2015.11.022
Colla, C. H., Lewis, V. A., Kao, L. S., O'Malley, A. J., Chang, C. H., & Fisher, E. S. (2016). Association Between Medicare Accountable Care Organization Implementation and Spending Among Clinically Vulnerable Beneficiaries. JAMA Intern Med, 176(8), 1167-1175. doi:10.1001/jamainternmed.2016.2827
Comfort, L., Shortell, S. M., Rodriguez, H. P., & Colla, C. H. (2018). Medicare Accountable Care Organizations of Diverse Structures Achieve Comparable Quality and Cost Performance. Health Services Research, 53(4), 2303-2323.
D'Aunno, T., Broffman, L., Sparer, M., & Kumar, S. (2018). Factors that Distinguish High-Performing Accountable Care Organizations in the Medicare Shared Savings Program. Health Services Research, 53(1), 120-137.
Dupree, J. M., Patel, K., Singer, S. J., West, M., Wang, R., Zinner, M. J., & Weissman, J. S. (2014). Attention to surgeons and surgical care is largely missing from early medicare accountable care organizations. Health Affairs, 33(6), 972-979. doi:10.1377/hlthaff.2013.1300
Embuldeniya, G., Kirst, M., Walker, K., & Wodchis, W. (2018). The Generation of Integration: The Early Experience of Implementing Bundled Care in Ontario, Canada. The Milbank Quarterly, 96(4), 782-813.
Geyer, B. C., Peak, D. A., Velmahos, G. C., Gates, J. D., Michaud, Y., Petrovick, L., . . . Raja, A. S. (2016). Cost savings associated with transfer of trauma patients within an accountable care organization. The American journal of emergency medicine, 34(3), 455-458.
Gittell, J. H., Beswick, J., Goldmann, D., & Wallack, S. S. (2015). Teamwork methods for accountable care: relational coordination and TeamSTEPPS(R). Health Care Manage Rev, 40(2), 116-125. doi:10.1097/HMR.0000000000000021

Rapid Review No. 12
40
Huskamp, H. A., Greenfield, S. F., Stuart, E. A., Donohue, J. M., Duckworth, K., Kouri, E. M., . . . Barry, C. L. (2016). Effects of Global Payment and Accountable Care on Tobacco Cessation Service Use: An Observational Study. Journal of General Internal Medicine, 1-7.
Imbens, G. W., & Wooldridge, J. M. (2009). Recent Developments in the Econometrics of Program Evaluation. Journal of Economic Literature, 47(1), 5–86.
Ionescu-Ittu, R., Glymour, M. M., & Kaufman, J. S. (2015). A difference-in-differences approach to estimate the effect of income-supplementation on food insecurity. Preventive Medicine, 70, 108–116.
Joseph, T., Hale, G. M., Eltaki, S. M., Prados, Y., Jones, R., Seamon, M. J., . . . Gernant, S. A. (2017). Integration Strategies of Pharmacists in Primary Care-Based Accountable Care Organizations: A Report from the Accountable Care Organization Research Network, Services, and Education. J Manag Care Spec Pharm, 23(5), 541-548. doi:10.18553/jmcp.2017.23.5.541
Joyce, N. R., Huskamp, H. A., Hadland, S. E., Donohue, J. M., Greenfield, S. F., Stuart, E. A., & Barry, C. L. (2017). The Alternative Quality Contract: Impact on Service Use and Spending for Children With ADHD. Psychiatric Services, 68(12), 1210-1212.
Kelleher, K. J., Cooper, J., Deans, K., Carr, P., Brilli, R. J., Allen, S., & Gardner, W. (2015). Cost saving and quality of care in a pediatric accountable care organization. Pediatrics, peds. 2014-2725.
L&M Policy Research. (2016). Advance payment ACO final report (Report prepared for Centers for Medicare & Medicaid Services). Retrieved from https://innovation.cms.gov/Files/reports/advpayaco-fnevalrpt.pdf
Lazar, H., Lavis, J. N., Forest, P. G., & Church, J. (2013). Paradigm Freeze: Why it is so Hard to Reform Health-Care Policy in Canada. Montreal and Kingston: McGill-Queen's University Press.
Lipsitch, M., Tchetgen, E., et al. (2010) Negative controls: a tool for detecting confounding and bias in observational studies. Epidemiology, 21 (3), 383–388.
McWilliams, J. M., Chernew, M. E., Landon, B. E., & Schwartz, A. L. (2015). Performance differences in year 1 of pioneer accountable care organizations. N Engl J Med, 372(20), 1927-1936. doi:10.1056/NEJMsa1414929
McWilliams, J. M., Hatfield, L. A., Chernew, M. E., Landon, B. E., & Schwartz, A. L. (2016). Early performance of accountable care organizations in Medicare. New England Journal of Medicine, 374(24), 2357-2366.
McWilliams, J. M., Hatfield, L. A., Landon, B. E., Hamed, P., & Chernew, M. E. (2018). Medicare Spending after 3 Years of the Medicare Shared Savings Program. New England Journal of Medicine, 379(12), 1139-1149. doi:10.1056/NEJMsa1803388
McWilliams, J. M., Landon, B. E., & Chernew, M. E. (2013). Changes in health care spending and quality for Medicare beneficiaries associated with a commercial ACO contract. JAMA, 310(8), 829-836. doi:10.1001/jama.2013.276302
McWilliams, J. M., Landon, B. E., Chernew, M. E., & Zaslavsky, A. M. (2014). Changes in patients' experiences in Medicare Accountable Care Organizations. New England Journal of Medicine, 371(18), 1715-1724. doi:10.1056/NEJMsa1406552
Nyweide, D. J., Lee, W., Cuerdon, T. T., Pham, H. H., Cox, M., Rajkumar, R., & Conway, P. H. (2015). Association of Pioneer Accountable Care Organizations vs traditional Medicare fee for service with spending, utilization, and patient experience. JAMA, 313(21), 2152-2161. doi:10.1001/jama.2015.4930
Ontario Ministry of Health and Long-Term Care. (2019). Ontario's Government for the People to Break Down Barriers to Better Patient Care [Press release]. Retrieved from https://news.ontario.ca/mohltc/en/2019/02/ontarios-government-for-the-people-to-break-

North American Observatory on Health Systems and Policies
41
down-barriers-to-better-patient-care.html?utm_source=ondemand&utm_medium=email&utm_campaign=p
Peckham, A., Morton-Chang, F., Williams, A. P., & Miller, F. A. (2018). Rebalancing health systems toward community-based care: The role of subsectoral politics. Health Policy, 122(11), 1260-1265. doi:10.1016/j.healthpol.2018.09.014
Peckham, A., Rudoler, D., Bahatia, D., Fakim, S., Allin, S., & Marchildon, G. P. (2018b). Accountable Care Organizations and the Canadian Context. Retrieved from North American Observatory on Health Systems and Policies https://ihpme.utoronto.ca/research/research-centres-initiatives/nao/research/rapid-reviews/rapid-review-9/
Peckham, A., Rudoler, D., Bhatia, D., Fakim, S., Allin, S., & Marchildon, G. P. (2018). Accountable Care Organizations and the Canadian Context.
Phipps-Taylor, M., & Shortell, S. M. (2016). More Than Money: Motivating Physician Behavior Change in Accountable Care Organizations. Milbank Q, 94(4), 832-861. doi:10.1111/1468-0009.12230
Resnick, M. J., Graves, A. J., Buntin, M. B., Richards, M. R., & Penson, D. F. (2018). Surgeon Participation in Early Accountable Care Organizations. Ann Surg, 267(3), 401-407. doi:10.1097/SLA.0000000000002233
Romanow, R. J. (2002). Building on values: the future of health care in Canada. Ryan, A. M., Krinsky, S., Adler-Milstein, J., Damberg, C. L., Maurer, K. A., & Hollingsworth, J. M. (2017).
Association Between Hospitals' Engagement in Value-Based Reforms and Readmission Reduction in the Hospital Readmission Reduction Program. JAMA Intern Med, 177(6), 862-868. doi:10.1001/jamainternmed.2017.0518
Schur, C. L., & Sutton, J. P. (2017). Physicians In Medicare ACOs Offer Mixed Views Of Model For Health Care Cost And Quality. Health Aff (Millwood), 36(4), 649-654. doi:10.1377/hlthaff.2016.1427
Song, Z., Rose, S., Chernew, M. E., & Safran, D. G. (2017). Lower- Versus Higher-Income Populations In The Alternative Quality Contract: Improved Quality And Similar Spending. Health Aff (Millwood), 36(1), 74-82. doi:10.1377/hlthaff.2016.0682
Song, Z., Safran, D. G., Landon, B. E., He, Y., Ellis, R. P., Mechanic, R. E., . . . Chernew, M. E. (2011). Health care spending and quality in year 1 of the alternative quality contract. New England Journal of Medicine, 365(10), 909-918. doi:10.1056/NEJMsa1101416
Song, Z., Safran, D. G., Landon, B. E., Landrum, M. B., He, Y., Mechanic, R. E., . . . Chernew, M. E. (2012). The 'Alternative Quality Contract,' based on a global budget, lowered medical spending and improved quality. Health Affairs, 31(8), 1885-1894. doi:10.1377/hlthaff.2012.0327
Stapleton, S. M., Chang, D. C., Rattner, D. W., & Ferris, T. G. (2018). Along for the Ride?: Surgeon Participation in Accountable Care Organizations. Ann Surg, 267(3), 408-410. doi:10.1097/SLA.0000000000002637
Stuart, E. A., Barry, C. L., Donohue, J. M., Greenfield, S. F., Duckworth, K., Song, Z., . . . Huskamp, H. A. (2017). Effects of accountable care and payment reform on substance use disorder treatment: evidence from the initial 3 years of the alternative quality contract. Addiction, 112(1), 124-133. doi:10.1111/add.13555
Strumpf, E. C., Harper, S., & Kaufman, J. S. (2017). Fixed effects and difference in differences. In K. J. S. Oakes M (Ed.), Methods in Social Epidemiology (pp. 341–368). San Francisco: John Wiley & Sons.
Stuart, E.A., Huskamp, H.A., et al. (2014) Using propensity scores in difference-in-differences models to estimate the effects of a policy change. Health Service Outcomes Research Methodology, 14 (4), 166–182.
Tenbensel, T., Miller, F., Breton, M., Couturier, Y., Morton-Chang, F., Ashton, T., . . . Wodchis, W. (2017). How do Policy and Institutional Settings Shape Opportunities for Community-Based Primary Health Care? A Comparison of Ontario, Quebec and New Zealand. Int J Integr Care, 17(2), 13. doi:10.5334/ijic.2514

Rapid Review No. 12
42
Tong, A., Sainsbury, P., & Craig, J. (2007). Consolidated criteria for reporting qualitative research (COREQ): a 32-item checklist for interviews and focus groups. International Journal for Quality in Health Care, 19(6), 349-357.
Traynor, K. (2016). Pharmacists' participation in ACOs has room to grow. Am J Health Syst Pharm, 73(9), e118-119. doi:10.2146/news160029
Valentine, M. A., Nembhard, I. M., & Edmondson, A. C. (2015). Measuring teamwork in health care settings: a review of survey instruments. Medical care, 53(4), e16-e30.
Wan, T. T., Demachkie Masri, M., Ortiz, J., & Lin, B. Y. (2014). Willingness to participate in accountable care organizations: health care managers' perspective. Health Care Manag (Frederick), 33(1), 64-74. doi:10.1097/01.HCM.0000440625.92879.e8
Williams, R.L. (2000) A note on robust variance estimation for cluster-correlated data. Biometrics, 56 (2), 645–646.
Wooldridge, J. M. (2010). Econometric analysis of cross section and panel data. London, England: MIT Press.
Wright, W. L. (2017). New Hampshire Nurse Practitioners Take the Lead in Forming an Accountable Care Organization. Nurs Adm Q, 41(1), 39-47. doi:10.1097/NAQ.0000000000000205


The North American Observatory on Health Systems and Policies (NAO) is a collaborative partnership of interested researchers, health organizations, and governments promoting evidence-informed health system policy decision-making. Due to the high degree of health system decentralization in the United States and Canada, the NAO is committed to focusing attention on comparing health systems and policies at the provincial and state level in federations.