ada and aace glycemic targets - homepage - med-iq · pdf file1 ada and aace glycemic targets...
TRANSCRIPT

1
ADA and AACE Glycemic Targets
• HbA1C target should be individualized based on a number of factors including: – Age– Life expectancy– Comorbidities– Duration of diabetes– Risk of hypoglycemia– Patient motivation– Patient adherence
ADA. Diabetes Care. 2017;40:S48-56; Garber AJ, et al. Endocr Pract. 2016;22:84-113; Handelsman Y, et al. Endocr Pract. 2015;21:1-87.
Test
Glycemic Control Targets
ADA AACE
HbA1C < 7% ≤ 6.5%
FPG 80-130 mg/dL < 110 mg/dL
PPG
< 180 mg/dL (measured within
1-2 hours after the start of a meal)
< 140 mg/dL (2-hour value)

2
HbA1C Levels in Patients With Diabetes
• Many patients with diabetes have HbA1C levels above the ADA-recommended target of 7%
• As T2DM progresses, maintaining glycemic control becomes more difficult and often requires insulin therapy
Ali MK, et al. N Engl J Med. 2013;368:1613-24; Kahn SE, et al. Lancet. 2014;383:1068-83;Casagrande SS, et al. Diabetes Care. 2013;36:2271-9; Maiorino MI, et al. Diabetes Care. 2017;40:614-24.
48%HbA1C > 7%
Total US Population With Diabetes
22%HbA1C > 8%
Decline in -Cell Function With Diabetes Progression
Lebovitz H. Clin Chem. 1999;45:1339-53; UKPDS Group. Diabetes. 1995;44:1249-58.
Postprandialhyperglycemia
IGT T2DMphase I T2DM
phase II
T2DMphase III
-C
ell F
un
ctio
n, %
25
100
75
0
50
-12 -10 -6 -2 0 2 6 10 14Years From Diagnosis
Dashed line shows extrapolation forward and backward from years 0 to 6 based on HOMA data from UKPDS.

3
T2DM
• T2DM is a complex, chronic disease characterized by multiple pathophysiologic abnormalities
• Most classes of drugs have multiple sites of action, leading to increased antihyperglycemic efficacy
• Combinations of oral and injectable therapies may be needed in T2DM patients to normalize glucose homeostasis, even those who are initially well controlled on monotherapy
Ferrannini E, et al. Eur Heart J. 2015;36:2288-96; ADA. Diabetes Care. 2017;40:S11-24.
Pathophysiologic Targets of T2DM Therapies
Ferrannini E, et al. Eur Heart J. 2015;36:2288-96.
Hyperglycemia
Liver↑ Glucose production
BrainNeurotransmitter dysfunction
KidneysGlucose reabsorption
Intestine↓ Incretin effect
Pancreatic α-cells↑ Glucagon secretion
Muscle↓ Glucose uptake
Pancreatic β-cells↓ Insulin release
Adipocytes↑ LipolysisGLP-1 RA,
DPP4-i
Insulin, TZD,MET, GLP-1 RA,
DPP4-i
Insulin,TZDGLP-1 RA
GLP-1 RA,DPP4-i,
SUInsulin,
TZD
AGi,GLP-1 RA
SGLT2-i
4
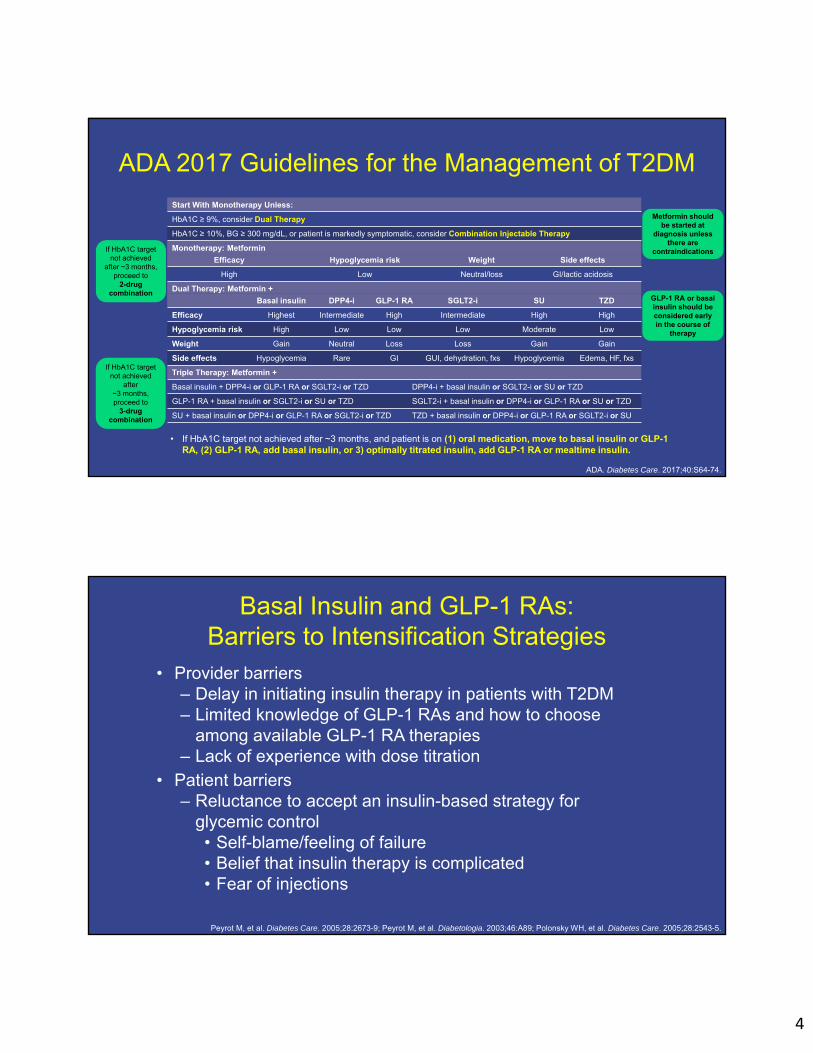
ADA 2017 Guidelines for the Management of T2DM
ADA. Diabetes Care. 2017;40:S64-74.
If HbA1C target not achieved
after ~3 months, proceed to
2-drug combination
If HbA1C target not achieved
after ~3 months, proceed to
3-drug combination
• If HbA1C target not achieved after ~3 months, and patient is on (1) oral medication, move to basal insulin or GLP-1 RA, (2) GLP-1 RA, add basal insulin, or 3) optimally titrated insulin, add GLP-1 RA or mealtime insulin.
Start With Monotherapy Unless:
HbA1C ≥ 9%, consider Dual Therapy
HbA1C ≥ 10%, BG ≥ 300 mg/dL, or patient is markedly symptomatic, consider Combination Injectable Therapy
Monotherapy: Metformin
Efficacy Hypoglycemia risk Weight Side effects
High Low Neutral/loss GI/lactic acidosis
Dual Therapy: Metformin +
Basal insulin DPP4-i GLP-1 RA SGLT2-i SU TZD
Efficacy Highest Intermediate High Intermediate High High
Hypoglycemia risk High Low Low Low Moderate Low
Weight Gain Neutral Loss Loss Gain Gain
Side effects Hypoglycemia Rare GI GUI, dehydration, fxs Hypoglycemia Edema, HF, fxs
Triple Therapy: Metformin +
Basal insulin + DPP4-i or GLP-1 RA or SGLT2-i or TZD DPP4-i + basal insulin or SGLT2-i or SU or TZD
GLP-1 RA + basal insulin or SGLT2-i or SU or TZD SGLT2-i + basal insulin or DPP4-i or GLP-1 RA or SU or TZD
SU + basal insulin or DPP4-i or GLP-1 RA or SGLT2-i or TZD TZD + basal insulin or DPP4-i or GLP-1 RA or SGLT2-i or SU
Metformin should be started at
diagnosis unless there are
contraindications
GLP-1 RA or basal insulin should be considered early in the course of
therapy
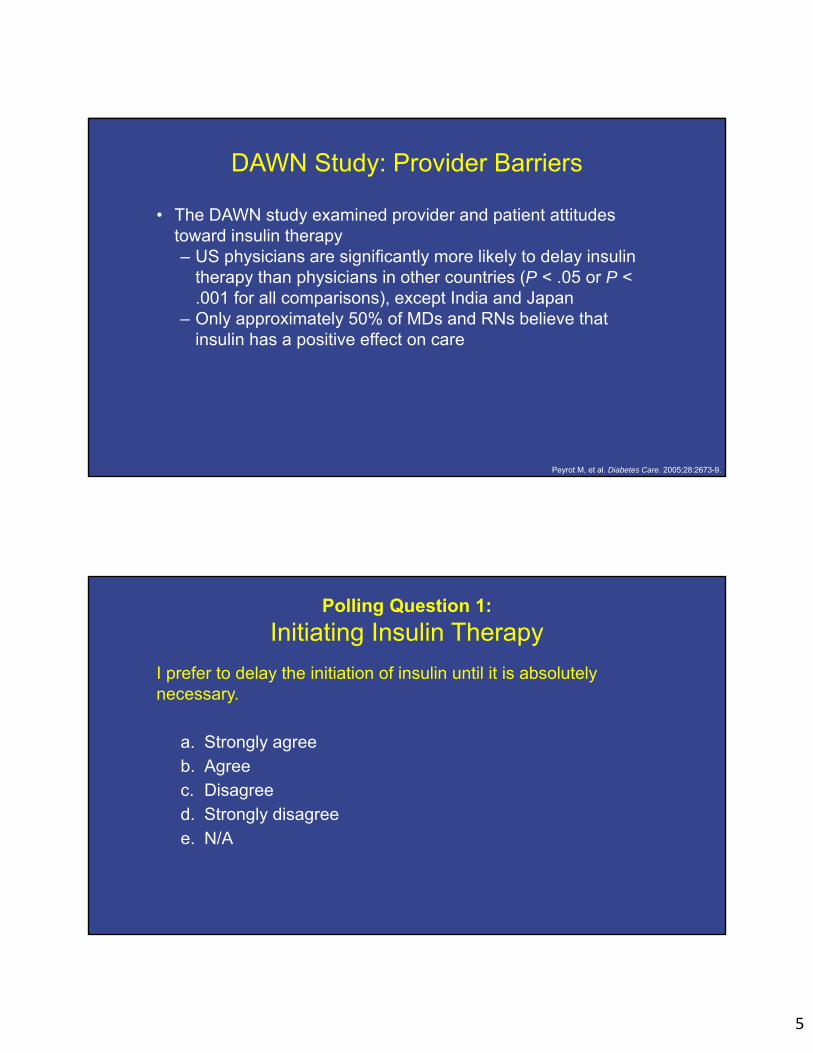
Basal Insulin and GLP-1 RAs: Barriers to Intensification Strategies
• Provider barriers– Delay in initiating insulin therapy in patients with T2DM – Limited knowledge of GLP-1 RAs and how to choose
among available GLP-1 RA therapies– Lack of experience with dose titration
• Patient barriers– Reluctance to accept an insulin-based strategy for
glycemic control • Self-blame/feeling of failure • Belief that insulin therapy is complicated • Fear of injections
Peyrot M, et al. Diabetes Care. 2005;28:2673-9; Peyrot M, et al. Diabetologia. 2003;46:A89; Polonsky WH, et al. Diabetes Care. 2005;28:2543-5.
5
DAWN Study: Provider Barriers
• The DAWN study examined provider and patient attitudes toward insulin therapy– US physicians are significantly more likely to delay insulin
therapy than physicians in other countries (P < .05 or P < .001 for all comparisons), except India and Japan
– Only approximately 50% of MDs and RNs believe that insulin has a positive effect on care
Peyrot M, et al. Diabetes Care. 2005;28:2673-9.
Polling Question 1:
Initiating Insulin Therapy
I prefer to delay the initiation of insulin until it is absolutely necessary.
a. Strongly agreeb. Agreec. Disagreed. Strongly disagreee. N/A

6
DAWN Study: Delaying Insulin Therapy Is Common in the US
59%
68%
42%
34%
50%
47%
0 20 40 60 80 100
Ove
rall
US
Percent of Respondents
Peyrot M, et al. Diabetes Care. 2005;28:2673-9.
NurseSpecialist physicianGeneral practitioner
“I prefer to delay the initiation of insulin until it is absolutely necessary”
Self-Reported Comfort Level for Managing Diabetes by Professional Category
Derr RL, et al. Diabetes Spectrum. 2007;20:177-85.
Very comfortableSomewhat comfortableSomewhat uncomfortableVery uncomfortableUnanswered
Nu
mb
er o
f P
arti
cip
ants
20
80
60
0
40
Professional Category
70
50
30
10
Nurse < 5 yrs
Nurse 6-10 yrs
Nurse > 10 yrs
PGY1resident
PGY2 resident
PGY3resident
Specialtyfaculty
General faculty

7
Patient Barriers
• The DAWN study demonstrated that in patients with T2DM who were not on insulin (n = 2,061): – 57% had anxiety about initiating insulin therapy– US patients were more likely to report a lower belief in insulin
efficacya and self-blameb for insulin therapy than patients from any other country
• A separate study of 708 patients with T2DM who were not on insulin found that:– 28% were unwilling to administer insulin even if prescribed– < 25% were “very willing” to begin insulin therapy
Peyrot M, et al. Diabetologia. 2003;46:A89;Peyrot M, et al. Diabetes Care. 2005;28:2673-9;
Polonsky WH, et al. Diabetes Care. 2005;28:2543-5.
aSignificant difference from Germany (P < .001), India (P < .01), Japan (P < .001), Scandinavia (P < .05), and Spain (P < .001).bSignificant difference from Australia, Germany, India, and the Netherlands (all P < .001).
Psychological Barriers to Insulin Therapy
• For many patients, initiating insulin therapy represents a failure in self-care– 48% of patients believed they were to blame for not
following physician instructions• Other barriers to insulin use include:
– Fear of injections– Belief that insulin use is complicated– Fear of loss of independence or a change in lifestyle– Stigma attached to needle use
Peyrot M, et al. Diabetologia. 2003;46:A89; Peyrot M, et al. Diabetes Care. 2005;28:2673-9.

8
Barriers to Initiating Insulin Therapy Among Privately Insured Patients—New Jersey, 2010
0 10 20 30 40 50 60
Too painful
Negative job impact
Negative social impact
Doubt ability to adjust dose
Hypoglycemia
Side effects of injection
Inadequate health literacy
Risks/benefits not well explained
Patients With T2DMa With Moderate to Extreme Concerns, %
Karter AJ, et al. Diabetes Care. 2010;33:733-5.
Statistically significant factors influencing insulin use from a survey of 169 privately insured, insulin-naïve patients with poorly controlled T2DM; P < .05, not adherent vs adherent for all factors shown.aPercentages of omitted responses not shown.
Initiated (n = 100)Did not initiate (n = 69)
Insulin Initiation Improves Quality of Life in T2DM
0 20 40 60 80 100
Daily struggles
Dietary restrictions
Fear of hypoglycemia
Worries about future
Social worries
Physical complaints
QOL
QOL Scorea
Braun A, et al. Patient Educ Couns. 2008;73:50-9.
Results from 42 insulin-naïve older (mean age, 68.4 years) German adults with T2DM who initiated insulin with a structured diabetes education program.aHigher scores indicate better QOL.
P < .05
P < .05
P < .01
6 months after insulin initiationBefore insulin initiation
P < .05
9
Assessing and Addressing Common Patient Concerns
• Many patients fear: – Needles– Painful injections– Hypoglycemia– Weight gain– Adverse effects on lifestyle– Loss of personal freedom and independence– Complications caused by insulin– Effects on relationships with family and friends
• Additionally, patients may believe that taking insulin means their diabetes has gotten worse or may think that needing insulin indicates a personal failure
Funnell MM, et al. Diabetes Educ. 2004;30:274-80.
Patient Engagement: Assessment Questions
• What is your greatest concern about your diabetes?
• What is the hardest thing for you in taking care of your diabetes?
• How satisfied are you with your current therapy for diabetes?
• How satisfied are you with your current level of glucose control?
• What do you need to know to consider insulin therapy?
• What is your biggest fear about insulin?
• What problems do you think you will encounter?
• What do you see as the most negative?
• What do you see as the most positive?
• What support do you have to overcome barriers?
• Are you willing to start insulin? If not, what would cause/help you to start taking insulin?
Funnell MM, et al. Diabetes Educ. 2004;30:274-80.

10
Overcoming Patients’ Fear of Injection
• Perform “dry run” injection – Insert needle without injecting any drug
• Administer the first injection in the office• Use the smallest needle possible• Present injection as a relatively painless process
– Injection is into fatty tissue, not muscle (like an intramuscular vaccine)
• Discuss injection technique– Injection devices are quick and easy to use– Have a pen available for demonstration
Kruger DF, et al. Diabetes Metab Syndr Obes. 2015;8:49-56.
Polling Question 2:
Insulin Intensification Strategy
When a patient on basal insulin therapy is not achieving glycemic goals, which of the following is your preferred strategy for intensifying therapy?
a. Add a GLP-1 RAb. Add oral noninsulin therapyc. Add prandial insulind. Titrate insuline. Other

11
Therapeutic Options in Patients Not Achieving Glycemic Goals With Basal Insulin
ADA. Diabetes Care. 2017;40:S64-74.
Add ≥ 2 rapid-acting insulin injections before
meals (“basal-bolus”)
If HbA1C not controlled, consider combination injectable therapy
If goals not met, consider changing to alternative insulin regimen
If goals not met, consider changing to alternative insulin regimen
If HbA1C not controlled, advance to basal-bolus
Initiate Basal InsulinUsually with metformin +/- other noninsulin agent
Add 1 rapid-acting insulin injection
before largest meal
Add GLP-1 RA
If not tolerated or HbA1C target not reached, change to 2-injection
insulin regimen
Change to premixed analog insulin 3 times daily
(breakfast, lunch, supper)
If HbA1C not controlled, advance to 3-injection
insulin regimen
Change to premixed insulin twice daily (before
breakfast and supper)
Postprandial Hyperglycemia Persists After Basal Insulin Therapy
• 164 patients with baseline HbA1C > 7.5% in 3-month intensified forced titration program
• Mealtime hyperglycemia persists after 3 months of intensive treatment
Woerle HJ, et al. Diabetes Res Clin Pract. 2007;78:280-5.
Glu
cose
, mg
/dL
220
200
180
160
140
120
1006 8 10 12 14 16 18 20 22 24
Time, hours
HbA1C > 7% (n = 44)HbA1C 7% (n = 120)

12
When to Stop Titrating Basal Insulin and Consider Prandial Control Options for T2DM Patients
Inzucchi S, et al. Diabetes Care. 2012;35:1364-79; Davidson MB, et al. Endocr Pract. 2011;17:395-403.
The individual is not meeting glycemic targets on basal insulin and:
HbA1C still not at goal with
0.5 units/kg/day of basal insulin
Elevated HbA1C despite
normal FPG with basal
insulin
FPG with basal insulin is
within target range, but PPG is persistently
above goal
Further increases in basal insulin
result in hypoglycemia
Aggressive Basal Dose Titration May Increase Severe Hypoglycemia Without Improving HbA1C
Tanenberg RJ, et al. Diabetologia. 2006;55:A135.
Mea
n In
sulin
Do
se,
un
its/
day
FPG Goal, mg/dL
Mean
Hb
A1C
, %
80
60
40
0120 110 100 90 80
6
7
8
978.174.969.6
62.259.2
7.6 7.5
7.4 7.4 7.3
Severe
Hyp
og
lycemia,
events/p
atient-year
0.13
0.080.05
0.030.02
00.050.1
0.15
24-week randomized study, N = 4,824.
Mean basal insulin dose, units/dayMean HbA1C, %Severe hypoglycemia, events/patient-year

13
When to Consider Combination Injectable Therapy for T2DM Patients Using Basal Insulin
ADA. Diabetes Care. 2017;40:S64-74.
Intensification with insulin (prandial or premixed)
Intensification with GLP-1 RA
Injectable therapy options
OR
Insulin is titrated to an acceptable FPG target (OR basal insulin dose is > 0.5 units/kg/day)
AND
HbA1C remains above target
Basal Insulin and GLP-1 RAs: Benefits
• GLP-1 RAs increase insulin secretion in a glucose-dependent manner, suppress glucagon secretion, and delay gastric emptying through their activation of the GLP-1 receptor
• GLP-1 RA therapies effectively control glycemia and are not associated with weight gain or hypoglycemia
• Improvements in cardiovascular markers including blood pressure, triglycerides, and low-density lipoprotein cholesterol are also associated with GLP-1 RA therapy
Balena R, et al. Diabetes Obes Metab. 2013;15:485-502.

14
Benefits of Adding a GLP-1 RA to Basal Insulin vs Adding Prandial Insulin
ADA. Diabetes Care. 2017;40:S64-74; Ahluwalia R, et al. Diabetes Ther. 2011;2:146-61; Inzucchi SE, et al. Diabetes Care. 2012;35:1364-79; Carris NW, et al. Drugs. 2014;74:2141-52.
Intensification with insulin (prandial or premixed)
Intensification with GLP-1 RA
• More injections• Increased risk of hypoglycemia• Increased body weight• Increased SMBG
• Fewer injections• Complementary pharmacologic profile to insulin,
especially with short-acting agents• Lower risk of hypoglycemia (vs insulin)• Decreased body weight• Less SMBG (vs insulin)• Large postprandial benefit, especially with short-
acting agents
Injectable therapy options
Insulin is titrated to an acceptable FPG target (OR basal insulin dose is > 0.5 units/kg/day)
AND
HbA1C remains above target
GLP-1 RAs Improve Glycemic Control in Patients With T2DM
Diamant M, et al. Diabetes Care. 2014;37:2763-73; Mathieu C, et al. Diabetes Obes Metab. 2014;16:636-44; Gough SC, et al. Lancet Diabetes Endocrinol. 2014;2:885-93; Rosenstock J, et al. Diabetologia. 2014;57:abstr 241; Blonde L, et al. Lancet. 2015;385:2057-66; Buse JB, et al. Ann Intern Med. 2011;154:103-12;
Ahmann A, et al. Diab Obes Metab. 2015;17:1056-64; Drucker DJ, et al. Lancet. 2008;372:1240-50; Rosenstock J, et al. Diabetes Care. 2014;37:2317-25.
50
60
84
30
69
77
58
81
59
49
35
78
25
5761
45
65
14
0
10
20
30
40
50
60
70
80
90
Exenatide vs BBT* Exenatide vsplacebo*
Lixisenatide FRCvs GLAR
Albiglutide vs BBT Dulaglutide vs BBT Exenatide QW vsexenatide BID
Liraglutide vs BBT Liraglutide FRCvs DEG
Liraglutide vsplacebo
Per
cen
tag
e A
ch
ievi
ng
Hb
A1
C <
7%
P = NSP = .0039P = NS P = NSP < .001 P = NS P = .010 P < .0001 P < .0001
GLP-1 RA Comparator
vs glargine vs degludec

15
GLP-1 RAs Improve Glycemia and Are Associated With Weight Loss and Reduced Insulin Dose• 7 RCTs and 15 clinical practice or observational studies
including ≥ 30 patients with T2DM
Balena R, et al. Diabetes Obes Metab. 2013;15:485-502.Each line represents a study.
Hb
A1C
, %
10
8
7
6Baseline Endpoint
9
GLP-1 RA added to insulinInsulin added to GLP-1 RAGLP-1 RA + insulin (sequence not specified)
Bo
dy
Wei
gh
t, k
g
130
110
100Baseline Endpoint
120
Insu
lin D
ose
, u
nit
s
150
90
50
30Baseline Endpoint
130
110
70
Head-to-Head Trials of GLP-1 RAs: Efficacy and Weight
• Occurrence of GI adverse effects is generally lower with longer-acting agents (LIRA and EXN QW vs EXN BIDa; EXN QW and ALBI vs LIRA)
• Injection-site reactions are more common with EXN QW and ALBI
Buse JB, et al. Lancet. 2009;374:39-47; Blevins T, et al. J Clin Endocrinol Metab. 2011;96:1301-10;Buse JB, et al. Lancet. 2013;381:117-24; Pratley R, et al. Lancet Diabetes Endocrinol. 2014;2:289-97.
aNausea rates initially similar for LIRA vs EXN BID, but rates were lower with LIRA (8%) vs EXN BID (16%) by week 6.
EXN BID 10 mcgLIRA 1.8 mgEXN QW 2.0 mgALBI 50 mg
P < .05 P < .05 P = .08
∆ H
bA
1C, % 1
-1 -0.8 -1.1
LEAD-1
0
-2-0.9
-1.6
DURATION-5
-1.5 -1.3
DURATION-6
-1.0 -0.8
HARMONY 7
P < .05
Noninferiority vs LIRA not met
P < .05 P < .05
∆ B
W, k
g
-2-2.9 -3.2
0
-4
-1.4-2.3
-3.6-2.7 -2.2
-0.6

16
GLP-1 RAs Significantly Lower PPG Levels
Balena R, et al. Diabetes Obes Metab. 2013;15:485-502.
Glu
cose
, mm
ol/L
6
8
9
11
7
10
13
12
2 hr postPreMorning Meal
2 hr postPreMidday Meal
2 hr postPreEvening Meal
0300 h
P < .001
P < .001
Glargine + placebo, baselineGlargine + exenatide, baselineGlargine + placebo, week 30Glargine + exenatide, week 30
P < .001
P < .01P < .001
P < .01
Polling Question 3:
GLP-1 RA Selection
In your practice, what is your GLP-1 RA dosing frequency preference?
a. I prefer to prescribe a GLP-1 RA that is taken once dailyb. I prefer to prescribe a GLP-1 RA that is taken once weeklyc. I prefer to prescribe a GLP-1 RA that is taken twice dailyd. N/A, I have no preference

17
Choosing the Appropriate GLP-1 RA to Achieve Patient Treatment Goals
• GLP-1 RA biomedical factors– Targeting of FPG vs PPG– Duration of action– Body weight reduction– Severity of side effects
• Patient psychosocial factors– Comfort with injections– Frequency of contact with healthcare provider– Meal pattern – Adherence
Kalra S. Diabetes Ther. 2014;5:333-40.
Comparison of Short-Acting vs Long-Acting GLP-1 RAsShort-Acting GLP-1 RAs Long-Acting GLP-1 RAs
Exenatide Lixisenatide Albiglutide Dulaglutide Exenatide-ER Liraglutide
Half-life 2.4 hours 2-4 hours 6-7 days 5 days 2 weeks 13 hours
Dosing Twice daily Once daily Once weekly Once weekly Once weekly Once daily
Control of HbA1C Effective
Control of FPG Suitable More suitable
Control of PPG More suitable Suitable
Body weight reduction 1-5 kg 2-5 kg
Directly observed therapy Not feasible Feasible
Injection-site reactions Rare Common; seldom for liraglutide
GI symptoms More common Less common
Increase in pulse rate Less common More common
Kalra S. Diabetes Ther. 2014;5:333-40; Pinelli NR, et al. Ann Pharmacother. 2011;45:850-60; ADA. Diabetes Care. 2017;40:S64-74;Anderson SL, et al. Ther Adv Chronic Dis. 2016;7:4-17; Murphy CE. Ann Pharmacother. 2012;46:812-21; Meier JJ. Nat Rev Endocrinol. 2012;8:728-42.
18
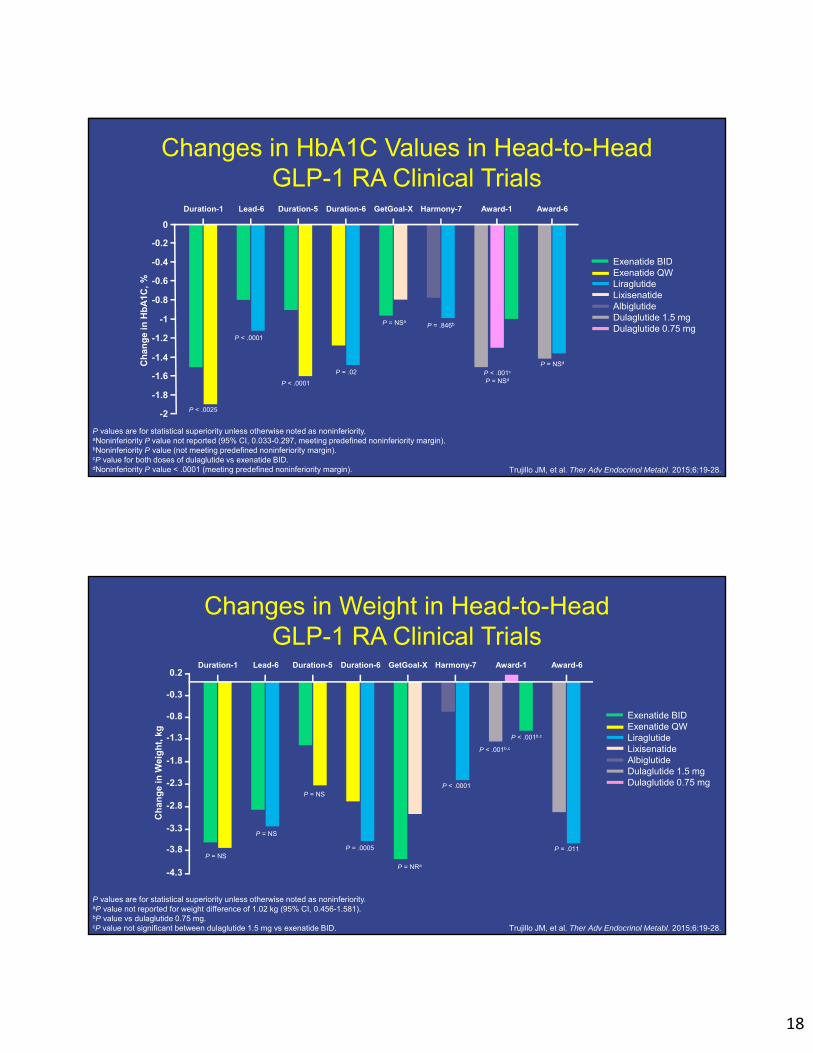
Changes in HbA1C Values in Head-to-Head GLP-1 RA Clinical Trials
Trujillo JM, et al. Ther Adv Endocrinol Metabl. 2015;6:19-28.
P values are for statistical superiority unless otherwise noted as noninferiority. aNoninferiority P value not reported (95% CI, 0.033-0.297, meeting predefined noninferiority margin).bNoninferiority P value (not meeting predefined noninferiority margin).cP value for both doses of dulaglutide vs exenatide BID.dNoninferiority P value < .0001 (meeting predefined noninferiority margin).
Ch
ang
e in
Hb
A1C
, %
-2
Exenatide BIDExenatide QWLiraglutideLixisenatideAlbiglutideDulaglutide 1.5 mgDulaglutide 0.75 mg
-1.8
-1.6
-1.4
-1.2
-1
-0.8
-0.6
-0.4
-0.2
0
Duration-1
P < .0025
P < .0001
P < .0001
P = .02
P = NSaP = .846b *
Lead-6 Duration-5 Duration-6 GetGoal-X Harmony-7 Award-1 Award-6
P < .001c
P = NSd
P = NSd
Changes in Weight in Head-to-Head GLP-1 RA Clinical Trials
Trujillo JM, et al. Ther Adv Endocrinol Metabl. 2015;6:19-28.
P values are for statistical superiority unless otherwise noted as noninferiority. aP value not reported for weight difference of 1.02 kg (95% CI, 0.456-1.581).bP value vs dulaglutide 0.75 mg.cP value not significant between dulaglutide 1.5 mg vs exenatide BID.
Exenatide BIDExenatide QWLiraglutideLixisenatideAlbiglutideDulaglutide 1.5 mgDulaglutide 0.75 mg
Ch
ang
e in
Wei
gh
t, k
g
-4.3
-3.8
-3.3
-2.8
-2.3
-1.8
-1.3
-0.8
-0.3
0.2Duration-1
P = NS
P = NS
P = NS
P = .0005
P < .0001
Lead-6 Duration-5 Duration-6 GetGoal-X Harmony-7 Award-1 Award-6
P = .011
P = NRa
P < .001b,c
P < .001b,c
19
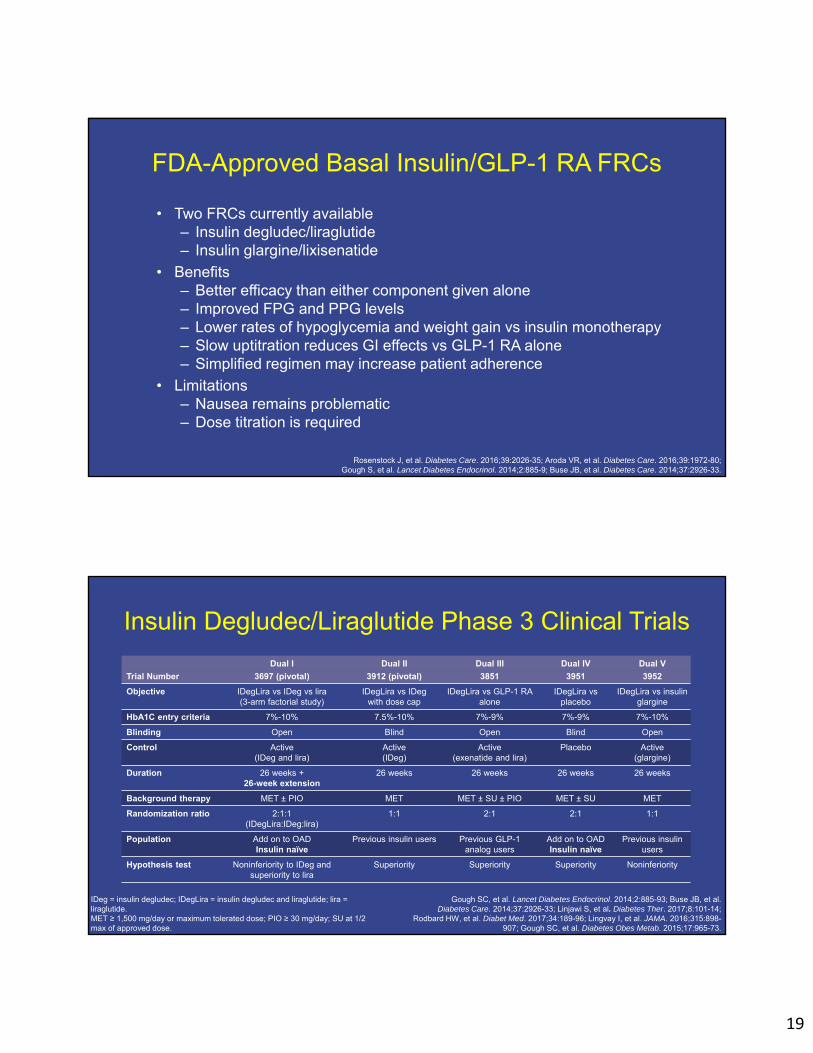
FDA-Approved Basal Insulin/GLP-1 RA FRCs
• Two FRCs currently available– Insulin degludec/liraglutide– Insulin glargine/lixisenatide
• Benefits– Better efficacy than either component given alone– Improved FPG and PPG levels– Lower rates of hypoglycemia and weight gain vs insulin monotherapy– Slow uptitration reduces GI effects vs GLP-1 RA alone– Simplified regimen may increase patient adherence
• Limitations– Nausea remains problematic– Dose titration is required
Rosenstock J, et al. Diabetes Care. 2016;39:2026-35; Aroda VR, et al. Diabetes Care. 2016;39:1972-80;Gough S, et al. Lancet Diabetes Endocrinol. 2014;2:885-9; Buse JB, et al. Diabetes Care. 2014;37:2926-33.
Insulin Degludec/Liraglutide Phase 3 Clinical Trials
Gough SC, et al. Lancet Diabetes Endocrinol. 2014;2:885-93; Buse JB, et al. Diabetes Care. 2014;37:2926-33; Linjawi S, et al. Diabetes Ther. 2017;8:101-14;
Rodbard HW, et al. Diabet Med. 2017;34:189-96; Lingvay I, et al. JAMA. 2016;315:898-907; Gough SC, et al. Diabetes Obes Metab. 2015;17:965-73.
Dual I Dual II Dual III Dual IV Dual V
Trial Number 3697 (pivotal) 3912 (pivotal) 3851 3951 3952
Objective IDegLira vs IDeg vs lira (3-arm factorial study)
IDegLira vs IDegwith dose cap
IDegLira vs GLP-1 RA alone
IDegLira vs placebo
IDegLira vs insulin glargine
HbA1C entry criteria 7%-10% 7.5%-10% 7%-9% 7%-9% 7%-10%
Blinding Open Blind Open Blind Open
Control Active (IDeg and lira)
Active (IDeg)
Active (exenatide and lira)
Placebo Active (glargine)
Duration 26 weeks +26-week extension
26 weeks 26 weeks 26 weeks 26 weeks
Background therapy MET ± PIO MET MET ± SU ± PIO MET ± SU MET
Randomization ratio 2:1:1 (IDegLira:IDeg:lira)
1:1 2:1 2:1 1:1
Population Add on to OAD Insulin naïve
Previous insulin users Previous GLP-1 analog users
Add on to OAD Insulin naïve
Previous insulin users
Hypothesis test Noninferiority to IDeg and superiority to lira
Superiority Superiority Superiority Noninferiority
IDeg = insulin degludec; IDegLira = insulin degludec and liraglutide; lira = liraglutide.MET ≥ 1,500 mg/day or maximum tolerated dose; PIO ≥ 30 mg/day; SU at 1/2 max of approved dose.
20
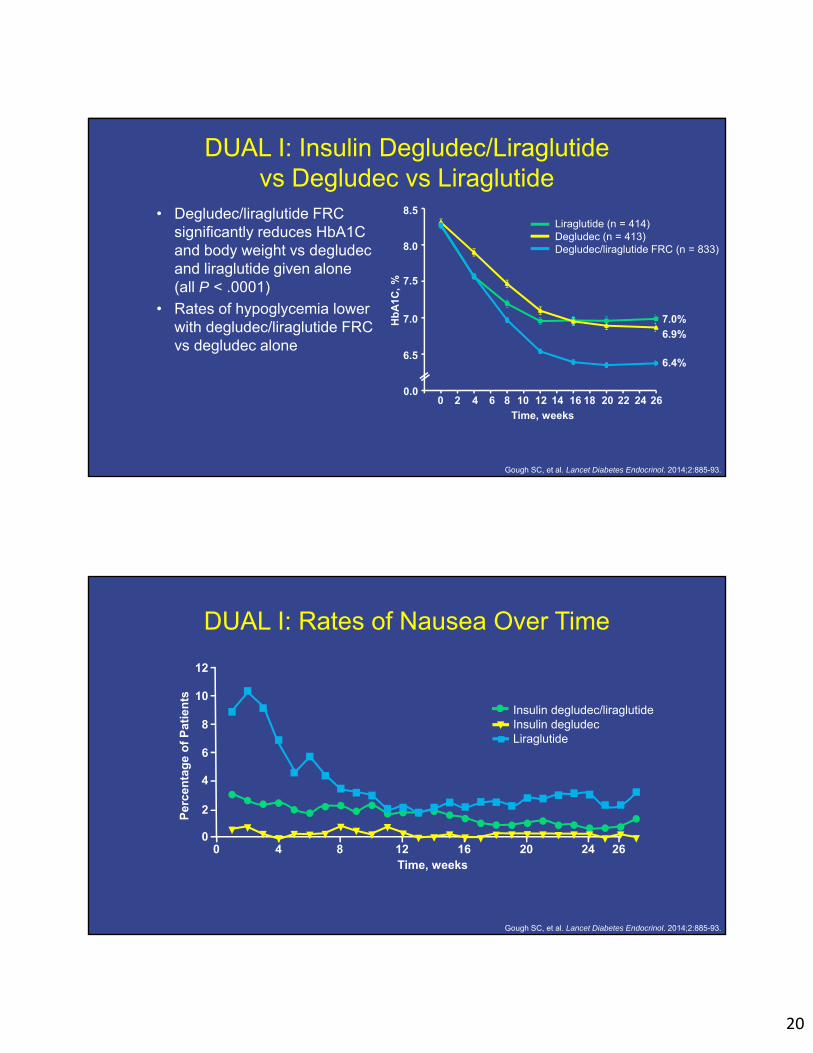
DUAL I: Insulin Degludec/Liraglutidevs Degludec vs Liraglutide
• Degludec/liraglutide FRC significantly reduces HbA1C and body weight vs degludec and liraglutide given alone (all P < .0001)
• Rates of hypoglycemia lower with degludec/liraglutide FRC vs degludec alone
Gough SC, et al. Lancet Diabetes Endocrinol. 2014;2:885-93.
0.0
8.5
8.0
7.5
7.0
6.5
Liraglutide (n = 414)Degludec (n = 413)Degludec/liraglutide FRC (n = 833)
Hb
A1C
, %
6.4%
6.9%
7.0%
0
Time, weeks
2 4 6 8 10 12 14 16 18 20 22 24 26
DUAL I: Rates of Nausea Over Time
Gough SC, et al. Lancet Diabetes Endocrinol. 2014;2:885-93.
Per
cen
tag
e o
f P
atie
nts
0
4
6
10
2
8
12
0Time, weeks
4 8 12 16 20 24 26
Insulin degludec/liraglutideInsulin degludecLiraglutide

21
DUAL III: Insulin Degludec/Liraglutidevs Unchanged GLP-1 RA
• Degludec/liraglutide FRC significantly reduces HbA1C vs unchanged GLP-1 RA (P < .001)
• FRC associated with significant increase in weight vs GLP-1 RA (P < .001)
Linjawi S, et al. Diabetes Ther. 2017;8:101-14.
5.5
6.0
6.5
7.0
7.5
8.0
-2 0 2 4 6 8 10 12 14 16 18 20 22 24 26
Time, weeks
Hb
A1C
, %
0.0
7.4%
6.4%
HBA1C Over Time
Insulin degludec/liraglutide (n = 292)Unchanged GLP-1 RA (n = 146)
DUAL IV: Insulin Degludec/Liraglutidevs Placebo
• Degludec/liraglutide FRC significantly reduces HbA1C over time vs placebo (treatment difference, 1.02%; P < .0001)
• Greater reduction in mean 9-point SMBG profile with FRC vs placebo (treatment difference, 1.55 mmol/L; P < .001)
Rodbard HW, et al. Diabet Med. 2017;34:189-96.
5.5
6.0
6.5
7.0
7.5
8.0
8.5
-2 0 2 4 6 8 10 12 14 16 18 20 22 24 26
Hb
A1C
, %
0.0
6.4%
7.4%
Time, weeks
Insulin degludec/liraglutide (n = 289)Placebo (n = 146)
22
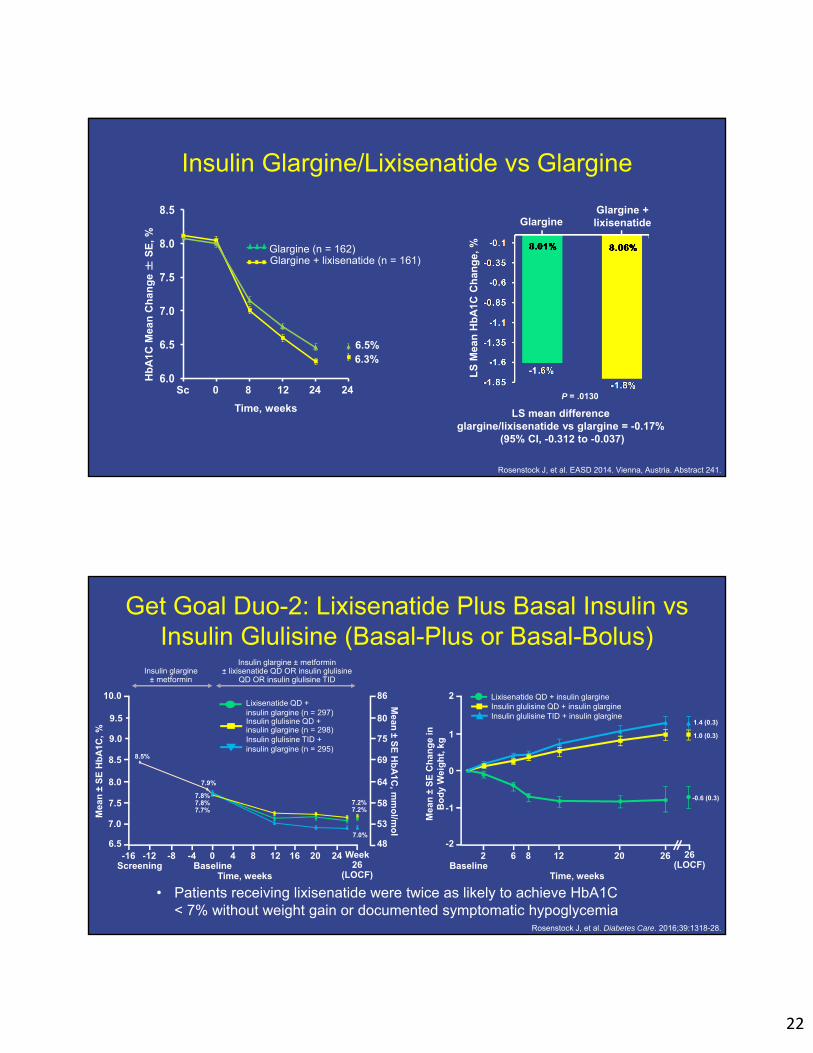
Insulin Glargine/Lixisenatide vs Glargine
Rosenstock J, et al. EASD 2014. Vienna, Austria. Abstract 241.
6.0
6.5
7.0
7.5
8.0
8.5
LS
Mea
nH
bA
1C C
han
ge,
%
GlargineGlargine + lixisenatide
LS mean difference glargine/lixisenatide vs glargine = -0.17%
(95% CI, -0.312 to -0.037)
P = .0130
6.3%
Glargine (n = 162)Glargine + lixisenatide (n = 161)
6.5%
Hb
A1C
Mea
nC
han
ge ±
SE
, %
24241280Sc
Time, weeks
Get Goal Duo-2: Lixisenatide Plus Basal Insulin vs Insulin Glulisine (Basal-Plus or Basal-Bolus)
• Patients receiving lixisenatide were twice as likely to achieve HbA1C < 7% without weight gain or documented symptomatic hypoglycemia
Rosenstock J, et al. Diabetes Care. 2016;39:1318-28.
Mea
n ±
SE
Hb
A1C
, %
6.5
10.0
7.0
9.5
Screening-16
BaselineTime, weeks
-4 8 20
Lixisenatide QD + insulin glargine (n = 297)Insulin glulisine QD + insulin glargine (n = 298)Insulin glulisine TID + insulin glargine (n = 295)
Insulin glargine± metformin
9.0
8.5
8.0
7.5
-12 -8 0 4 12 16 24 Week 26
(LOCF)
48
86
53
80
75
69
64
58
Insulin glargine ± metformin± lixisenatide QD OR insulin glulisine
QD OR insulin glulisine TID
8.5%
7.9%
7.8%7.8%7.7%
7.0%
7.2%7.2%
Mean
±S
E H
bA
1C, m
mo
l/mo
l
Time, weeks
Mea
n ±
SE
Ch
ang
e in
B
od
y W
eig
ht,
kg
-2
2
Baseline20
Lixisenatide QD + insulin glargine Insulin glulisine QD + insulin glargine Insulin glulisine TID + insulin glargine
1
0
-1
2 6 12 26 (LOCF)
8 26
1.4 (0.3)
1.0 (0.3)
-0.6 (0.3)

23
Insulin Glargine/Lixisenatide vs Lixisenatide vs Glargine
Rosenstock J, et al. Diabetes Care. 2016;39:2026-35.
A
Mea
n ±
SE
Hb
A1C
, %
6.0
8.5
Time, weeks
20
iGlarLixiiGlarLixi
8.0
7.0
6.5
S BL 12 30 (LOCF)
8 30
7.3%
6.8%
6.5%
7.5
42
69
64
53
48
58
Mean
±S
E H
bA
1C, m
mo
l/mo
l
P < .0001-1.8
iGlarLixiiGlarLixi
-0.2
-1.6
-0.4
-0.6
-0.8
-1.0
-1.2
-1.4
-1.6
P < .0001
0.0
LS
Mea
n C
han
ge
in H
bA
1C,
%
-1.3
-0.85
Insulin Glargine/Lixisenatide vs Lixisenatide vs Glargine
Rosenstock J, et al. Diabetes Care. 2016;39:2026-35.
-10
-16.4*
-38.4*
-180
iGlarLixiiGlarLixi
-20 -41.7[-2.3]
-40
-60
-80
-100
-120
-140
-160
0
LS
Mea
n C
han
ge
in 2
-Ho
ur
PP
G
Exc
urs
ion
, mg
/dL
-58.1[-3.2]
-3.2[-0.2]
95% CI, -45.0 to -31.9[-2.1*]
[95% CI, -2.5 to -1.8]P < .0001
95% CI, 8.1 to 24.8[+0.9*]
[95% CI, 0.4 to 1.4]
-1
-2
-3
-4
-5
-6
-7
-9
0
-8
Mea
n ±
SE
C
han
ge
in
7-P
oin
t S
MB
G,
mg
/dL
80
240
iGlarLixiiGlarLixi
200
140
120
Pre-breakfast
180
13
12
8
6
11
Mean
±S
E C
han
ge in
7-Po
int
SM
BG
, mm
ol/L
220
160
100
10
9
7
5
2 hourspost-
breakfast
Pre-lunch
2 hourspost-lunch
Pre-dinner
2 hours post-
dinner
Bedtime
LS
Mean
Ch
ang
e in 2-H
ou
r PP
G
Excu
rsion
, mm
ol/L
Baseline
Week 30

24
Basal Insulin/GLP-1 RA FRCs
• Insulin degludec/liraglutide 100/3.6– 1 dose step = 1 unit of insulin degludec + 0.036 mg of liraglutide – 16 dose steps = 16 units of degludec + 0.6 mg of liraglutide– 32 dose steps = 32 units of degludec + 1.2 mg of liraglutide– 50 dose steps = 50 units of degludec + 1.8 mg of liraglutide
• Insulin glargine/lixisenatide 100/33– 15 units of insulin glargine + 5 mcg lixisenatide– 30 units of glargine + 10 mcg lixisenatide– 60 units of glargine + 20 mcg of lixisenatide
Prescribing information for individual agents.
Basal Insulin/GLP-1 RA FRCs: Dosing and Titration
Prescribing information for individual agents.
Product Starting Dose Dose Range Titration
Insulin degludec/ liraglutide 100/3.6 16 units/0.58 mg
Lowest dose:10 units/0.36 mg
Max dose:50 units/1.8 mg
Every 3 to 4 days
Above target: + 2 units
Within target: 0 units
Below target: -2 units
Insulin glargine/ lixisenatide 100/33
15 units/5 mcg(if < 30 units basal
insulin or lixisenatide)
30 units/10 mcg(if 30-60 units basal insulin)
Lowest dose: 15 units/5 mcg
Max dose: 60 units/20 mcg
Weekly
Above target: + 2 units
Within target: 0 units
Below target: -2 units
25
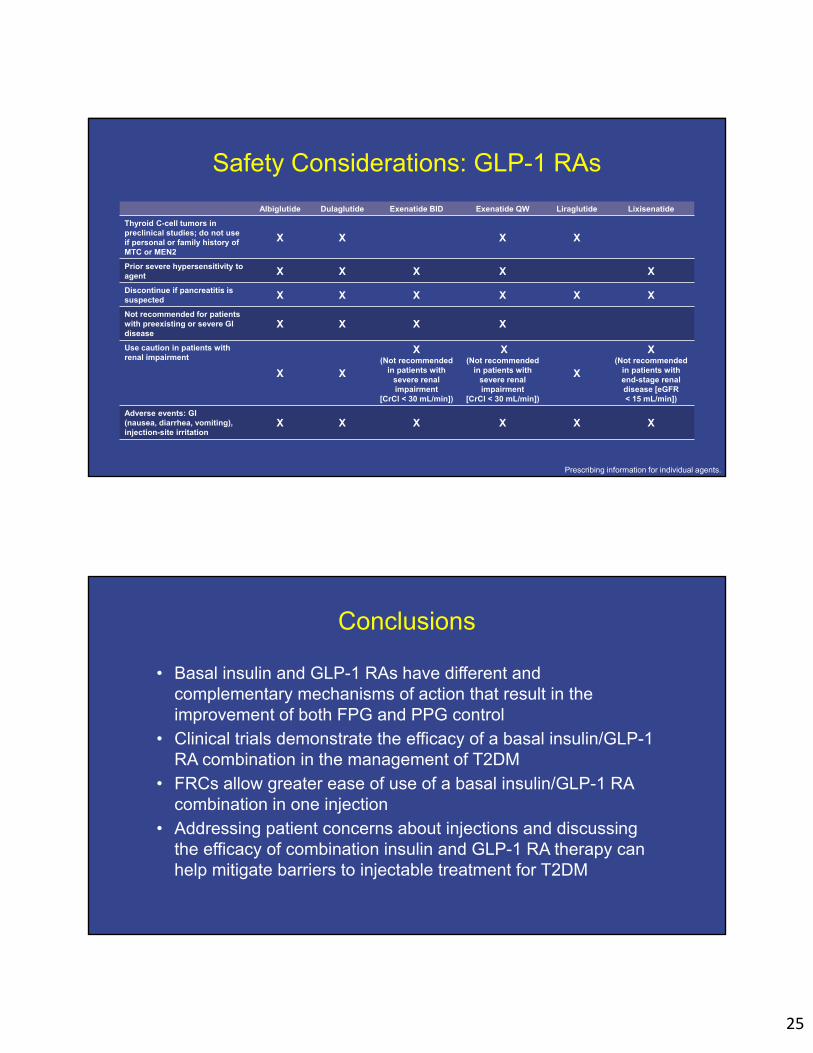
Safety Considerations: GLP-1 RAs
Albiglutide Dulaglutide Exenatide BID Exenatide QW Liraglutide Lixisenatide
Thyroid C-cell tumors in preclinical studies; do not use if personal or family history of MTC or MEN2
X X X X
Prior severe hypersensitivity to agent X X X X X
Discontinue if pancreatitis is suspected X X X X X X
Not recommended for patients with preexisting or severe GI disease
X X X X
Use caution in patients with renal impairment
X X
X (Not recommended
in patients with severe renal impairment
[CrCl < 30 mL/min])
X(Not recommended
in patients with severe renal impairment
[CrCl < 30 mL/min])
X
X(Not recommended
in patients with end-stage renal disease [eGFR< 15 mL/min])
Adverse events: GI (nausea, diarrhea, vomiting),injection-site irritation
X X X X X X
Prescribing information for individual agents.
Conclusions
• Basal insulin and GLP-1 RAs have different and complementary mechanisms of action that result in the improvement of both FPG and PPG control
• Clinical trials demonstrate the efficacy of a basal insulin/GLP-1 RA combination in the management of T2DM
• FRCs allow greater ease of use of a basal insulin/GLP-1 RA combination in one injection
• Addressing patient concerns about injections and discussing the efficacy of combination insulin and GLP-1 RA therapy can help mitigate barriers to injectable treatment for T2DM

26
Question/Answer Session With Faculty
Acknowledgment of Commercial Support
This activity is supported by an educational grant from Sanofi US.
Contact Information
Call (toll-free) 866 858 7434E-mail [email protected]
Please visit us online at www.Med-IQ.com for additional activities
provided by Med-IQ®.
27
© 2017
To receive credit, click the “Get Credit” tab at the bottom of the Webcast for access to the evaluation, attestation, and post-test.
Unless otherwise indicated, photographed subjects who appear within the content of this activity or on artwork associated with this activity are models; they are not actual patients or doctors.
Abbreviations and Acronyms AACE = American Association of Clinical Endocrinologists
ADA = American Diabetes Association
AGi = alpha‐glucosidase inhibitor
BBT = basal insulin glargine, bolus insulin lispro, and metformin therapy
BG = blood glucose
BID = twice daily
BW = body weight
CrCl = creatinine clearance
DDP4‐i = dipeptidyl‐peptidase 4 inhibitor
eGFR = estimated glomerular filtration rate
ER = extended release
FDA = Food and Drug Administration
FPG = fasting plasma glucose
FRC = fixed‐ratio combination
fxs = fractures
GI = gastrointestinal
GLP‐1 = glucagon‐like peptide‐1
GUI = genitourinary infections
HbA1C = hemoglobin A1C
HF = heart failure
HOMA = homeostasis model assessment
IGT = impaired glucose tolerance
LOCF = last observation carried forward
LS = least squares
MEN2 = multiple endocrine neoplasia type 2
MET = metformin
MTC = medullary thyroid carcinoma
OAD = oral antidiabetic drug
PIO = pioglitazone
PPG = postprandial glucose
QD = daily
QOL = quality of life
QW = once weekly
RA = receptor agonist
RCT = randomized controlled trial
SE = standard error
SGLT2‐i = sodium‐glucose cotransporter 2 inhibitor
SMBG = self‐monitoring of blood glucose
SMPG = self‐monitoring of plasma glucose
SU = sulfonylurea
T2DM = type 2 diabetes mellitus
TID = three times daily
TZD = thiazolidinedione
UKPDS = United Kingdom Prospective Diabetes Study
US = United States