addressing today’s challenges within the emerging trends · context of emerging trends ... tour...
TRANSCRIPT

Addressing Today’s Challenges within the Context of Emerging Trends
Bill Daggett, Founder and ChairmanNovember 4, 2014

Questions

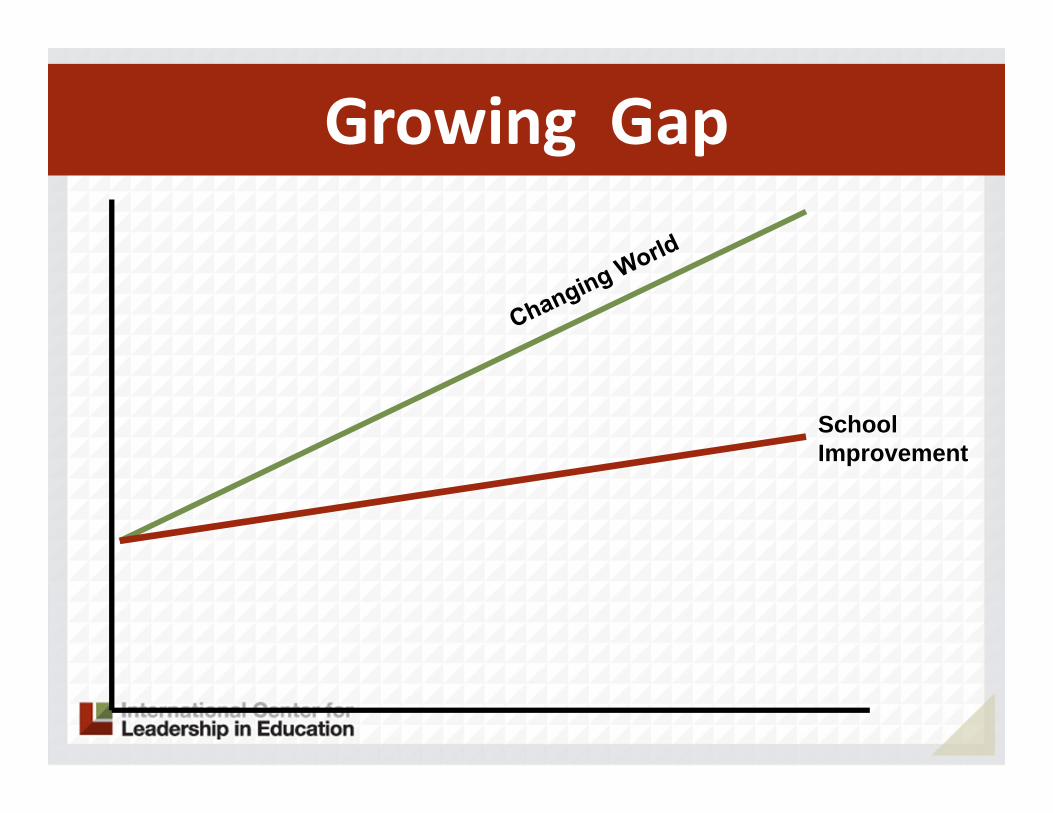
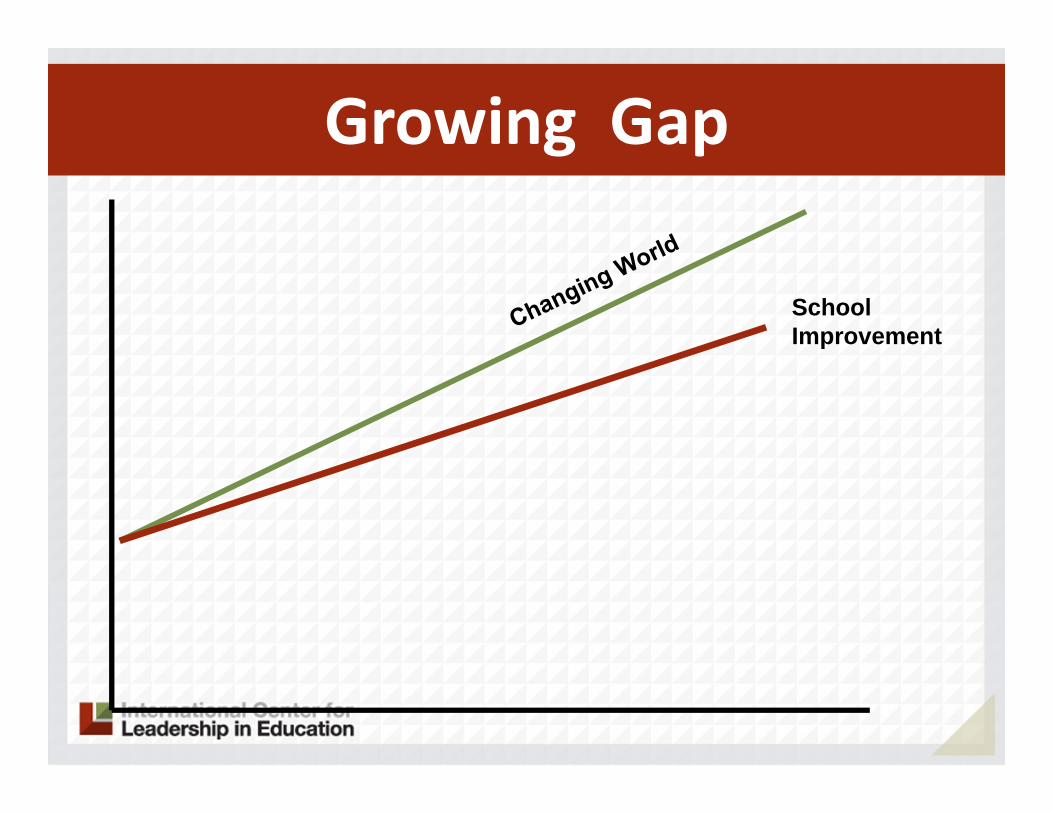
School Improvement
Growing Gap
School Improvement
Growing Gap
School Improvement
Growing Gap

School Improvement
Growing Gap

WHY - WHAT - HOW

WHY

70%

• Lack high‐school diploma• Cannot pass basic literacy test• Obesity• Drugs• Incarceration
Eligible for the Military

70%Increasing 1% Per Year

70%Are they employable?

70%Are they headed to public assistance?

Population
FemaleMale
1950

Retirement Age
Male
Female
Life Expectancy Vs. the Social Security Retirement Age
1940 1960 1980 2000 2020 2040 2060
60
65
70
75
80
85
90
Source: 2004 Annual Reports of the Board of Trustees of Social Security and Medicare

Birth Rates, 1920‐ 2010Births Per 1,000 women ages 15‐44
1920 1930 1940 1950 1960 1970 1980 1990 2000 20100
20
40
60
80
100
120
140
Source: National Center For Health Statistics Pew Research Center

EMERGING TRENDS

Digital/Technology Impact
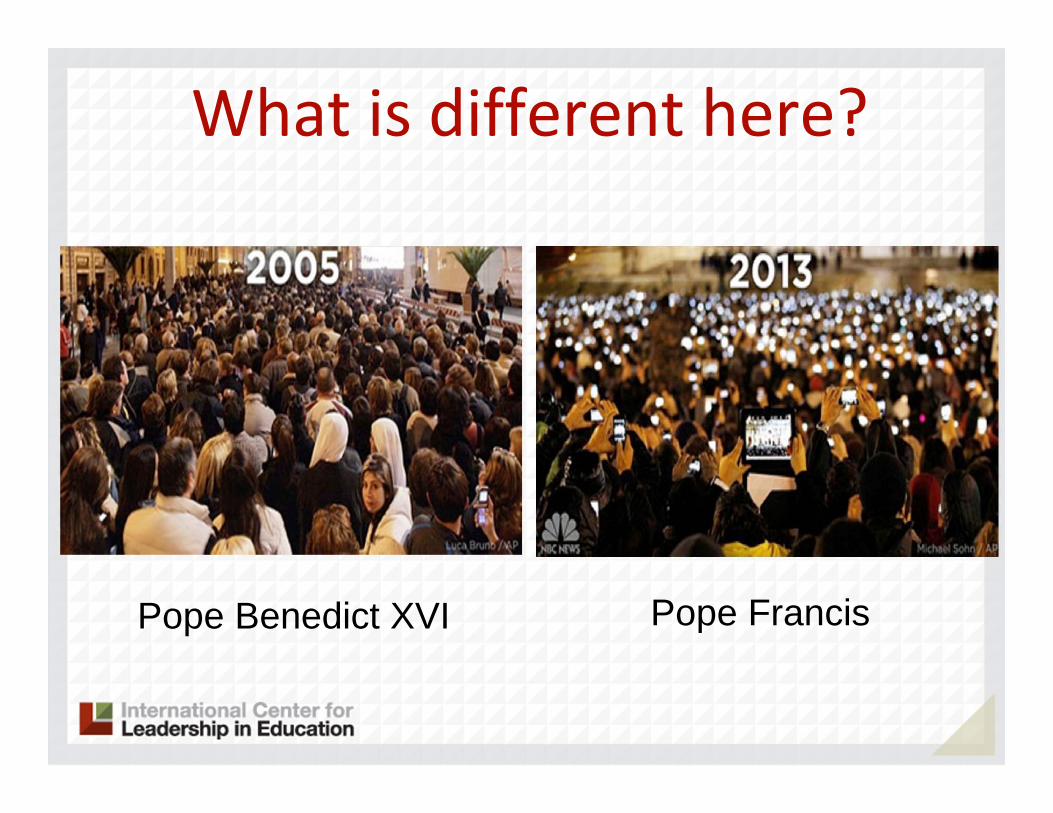
What is different here?
Pope Benedict XVI Pope Francis


• 1.0 – Informational
Web

• 1.0 – Informational• Google
Web
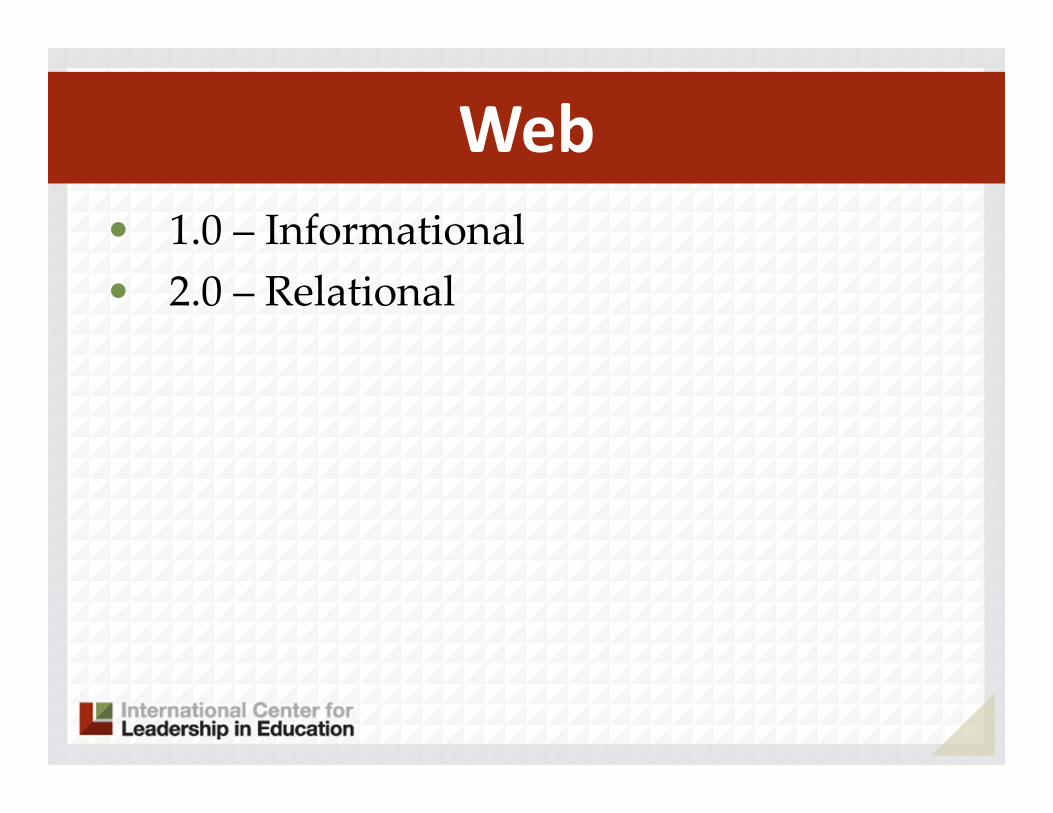
• 1.0 – Informational• 2.0 – Relational
Web

• 1.0 – Informational• 2.0 – Relational• 3.0 – Anticipatory
Web

• 1.0 – Informational• 2.0 – Relational• 3.0 – Anticipatory
• Artificial intelligence
Web

• 1.0 – Informational• 2.0 – Relational• 3.0 – Anticipatory
• Artificial intelligence• Deep Data Mining
Web

• 1.0 – Informational• 2.0 – Relational• 3.0 – Anticipatory
• Artificial intelligence• Deep Data Mining• Google > Ads
Web

• 1.0 – Informational• 2.0 – Relational• 3.0 – Anticipatory
• Artificial intelligence• Deep Data Mining• Google > Ads• Gmail > Ads
Web

• 1.0 – Informational• 2.0 – Relational• 3.0 – Anticipatory
• Artificial intelligence• Deep Data Mining• Google > Ads• Gmail > Ads• Wolfram Alpha
Web

• Digital Literacy
Digital Impact

Digital Literacy
• Tools/Applications/Systems• Digital Footprint

Digital Footprint
• Facebook• Snapchat• Instagram• Vine

Snapchat Allows users to take pictures and videos and share them with recipients for 1 ‐10 seconds. Users send 400 million messages per day. With a core audience between the ages of 13 and 25.
Source: Business insider

Snap‐HackAllows you to save your Snapchats including pictures and videos without notifying the sender.

Digital Footprint
• College Admission• Applying for a Job• Boyfriend/Girlfriend (their parents)

… and you thought locker searches were controversial
Digital Literacy
• Tools/Applications/Systems• Digital Footprint• Vetting of Sources

• Digital• Career Ready
Emerging Trends

Are our Students College and Career Ready?

College FreshmanWell or Very Well Prepared• High School Teachers – 89%• College Instructors – 26%

• Two Year College – 51.7%• Four Year College – 19.9%
Freshmen NeedingRemediation

• Two‐Year Colleges – 55.5%• Four‐Year Colleges – 65.2%
College Retention Rate2013
First to Second Year
Source: ACT

• Two‐Year Colleges – 44.5%• Four‐Year Colleges – 34.8%
College Dropout Rate2013
First to Second Year
Source: ACT

• Two‐Year Colleges in 3 years – 29.1%• Four‐Year Colleges in 5 years – 36.6%
Average Graduation Rate1983‐2013
Source: ACT
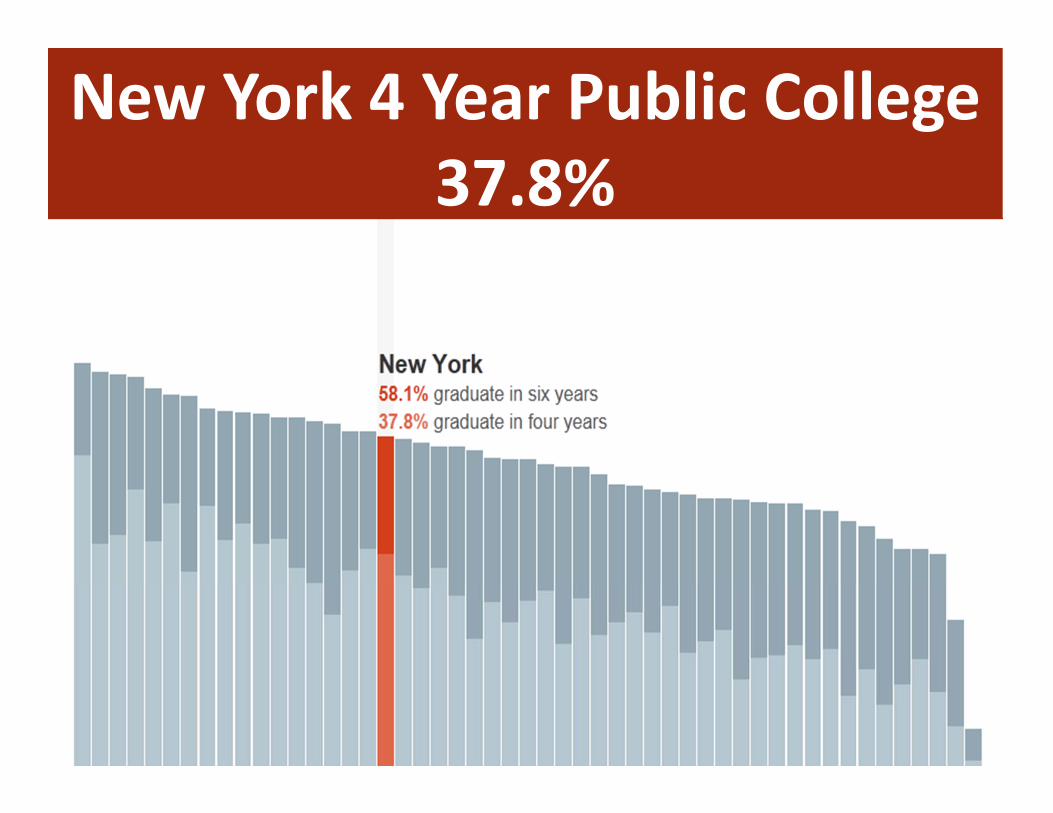
New York 4 Year Public College37.8%

New York 2 Year Public College10.9%
1. Success of Graduates2. Cost
College Challenges

College tuition rates have increased on average at twice the rate of inflation in the past
17 years
Source: ACT

2013 college grad average loan debt was $35,200
Source: ACT

1980 1990 2000 2010
200%
400%
600%
800%
1,000%
0
1,200%
Percent Change Since January 1978• Food• Consume Price Index• Shelter• Medicare• College

Career Ready

BUT
3.8 million jobs in theU.S.
remain unfilled
13 Million Americans are Unemployed

Your Major MattersA LOT

1. Business2. General Studies3. Social Science and History4. Psychology5. Health Professions6. Education7. Visual and Performing Arts8. Engineering and Technology9. Communications and Journalism10. Computer and Information Science
Bachelor’s Degrees
Source: National Center for Education Statistics

1. Business (1)2. General Studies (10)3. Social Science and History (6)4. Psychology (9)5. Health Professions (4)6. Education (5)7. Visual and Performing Arts (8)8. Engineering and Technology (2)9. Communications and Journalism (7)10. Computer and Information Science (3)
Bachelor’s–Competing Nations
Source: National Center for Education Statistics

Job Shares by Skill Group, 1980‐2010
Sources: NY Fed Calculations, U.S. Census Bureau
High‐skill Upper‐middle Lower‐middle Low‐skill
100
80
60
40
20
0 12.7
18.9
47.1
21.3
1980
16.2
25.4
37.7
20.7
2010 2040
Percent

Lost Jobs
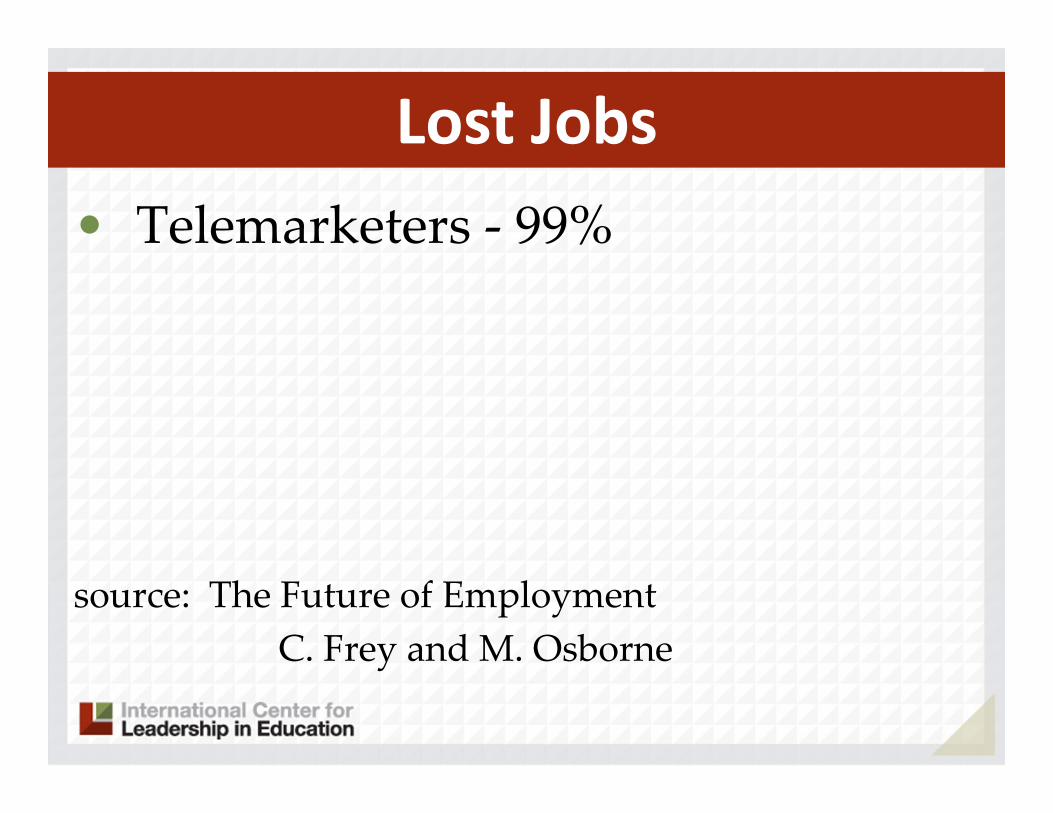
• Telemarketers ‐ 99%
source: The Future of EmploymentC. Frey and M. Osborne
Lost Jobs

• Telemarketers ‐ 99%• Secretarial/Adm. Assistant ‐ 96%
source: The Future of EmploymentC. Frey and M. Osborne
Lost Jobs
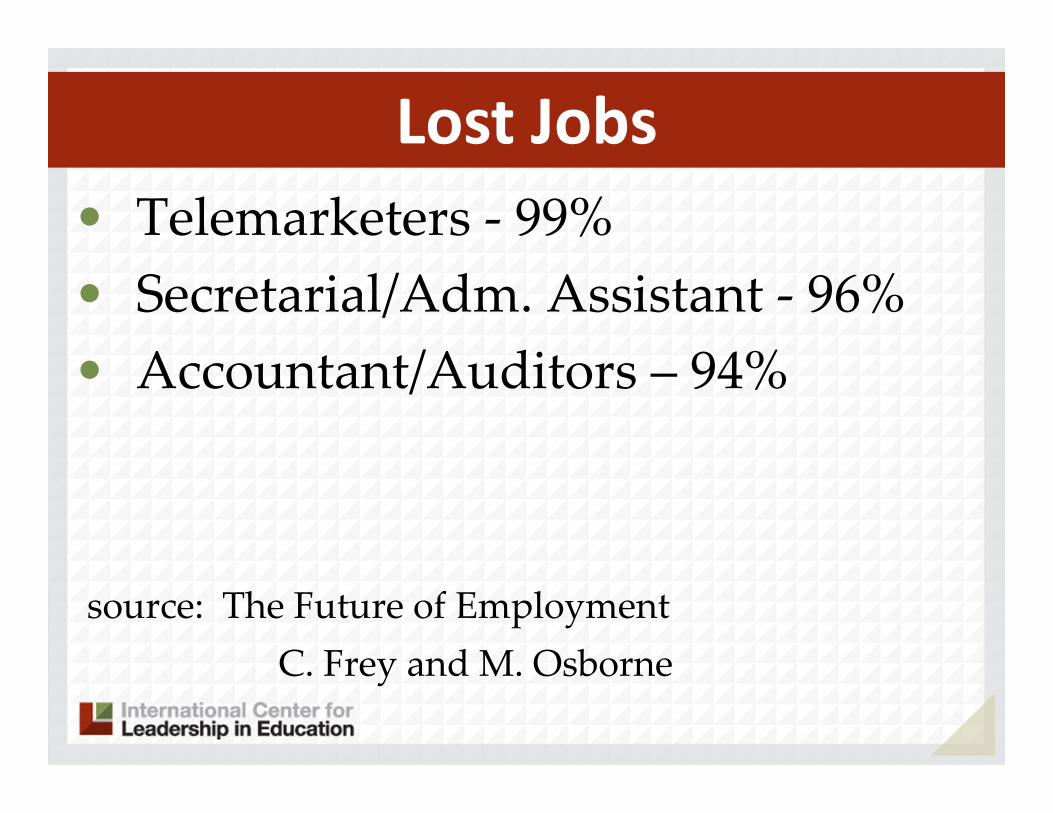
• Telemarketers ‐ 99%• Secretarial/Adm. Assistant ‐ 96%• Accountant/Auditors – 94%
source: The Future of EmploymentC. Frey and M. Osborne
Lost Jobs

• Telemarketers ‐ 99%• Secretarial/Adm. Assistant ‐ 96%• Accountant/Auditors – 94%• Technical Writers – 89%
source: The Future of EmploymentC. Frey and M. Osborne
Lost Jobs
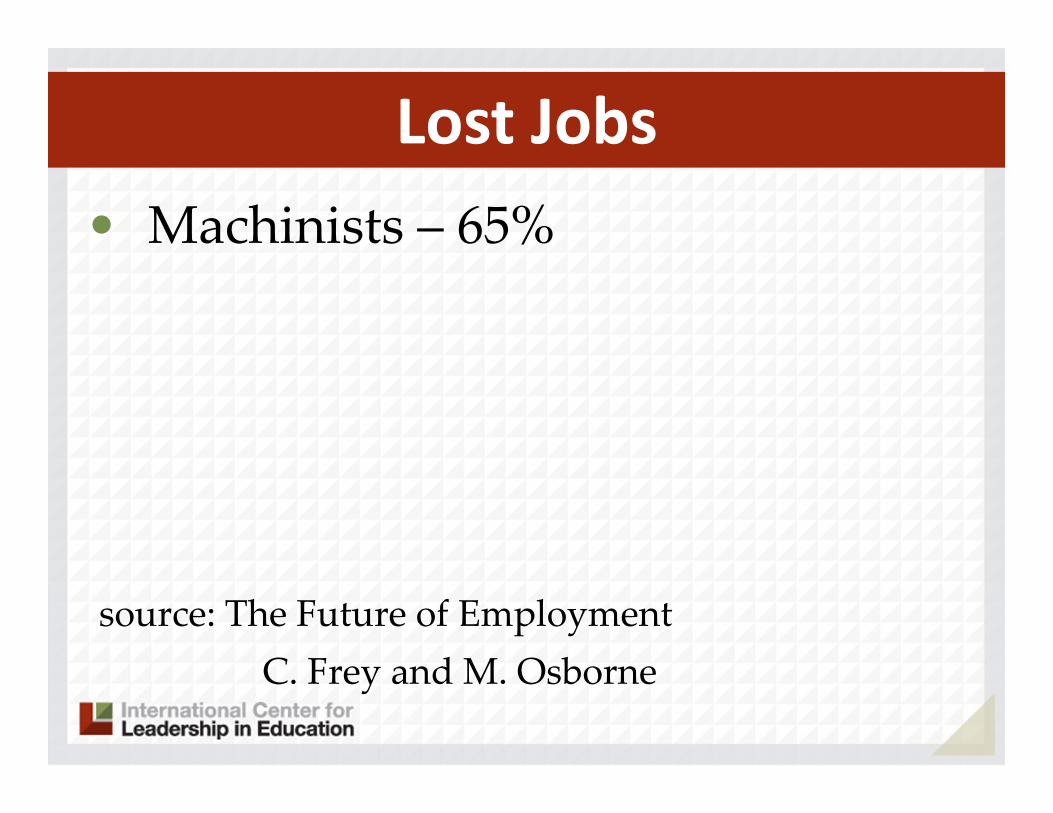
• Machinists – 65%
source: The Future of EmploymentC. Frey and M. Osborne
Lost Jobs

• Machinists – 65%• Economist – 43%
source: The Future of EmploymentC. Frey and M. Osborne
Lost Jobs
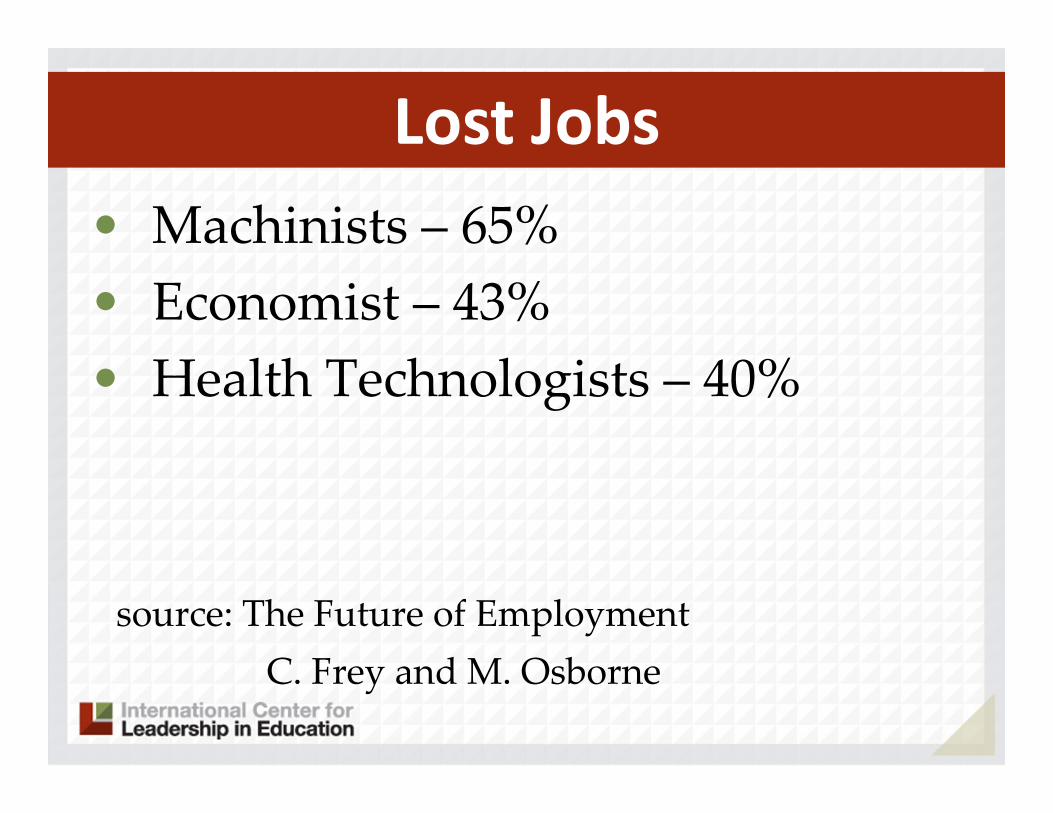
• Machinists – 65%• Economist – 43%• Health Technologists – 40%
source: The Future of EmploymentC. Frey and M. Osborne
Lost Jobs

Job Shares by Skill Group, 1980‐2010
Sources: NY Fed Calculations, U.S. Census Bureau
High‐skill Upper‐middle Lower‐middle Low‐skill
100
80
60
40
20
0 12.7
18.9
47.1
21.3
1980
16.2
25.4
37.7
20.7
2010 2040
Percent

• Digital• Career Ready• Focus on Application
Emerging Trends

1. Knowledge in one discipline2. Application within discipline3. Application across disciplines4. Application to real‐world
predictable situations5. Application to real‐world
unpredictable situations
Application Model

1. Awareness2. Comprehension3. Application4. Analysis5. Synthesis6. Evaluation
Knowledge Taxonomy

Levels
1 2 3 4 5
Bloom’s
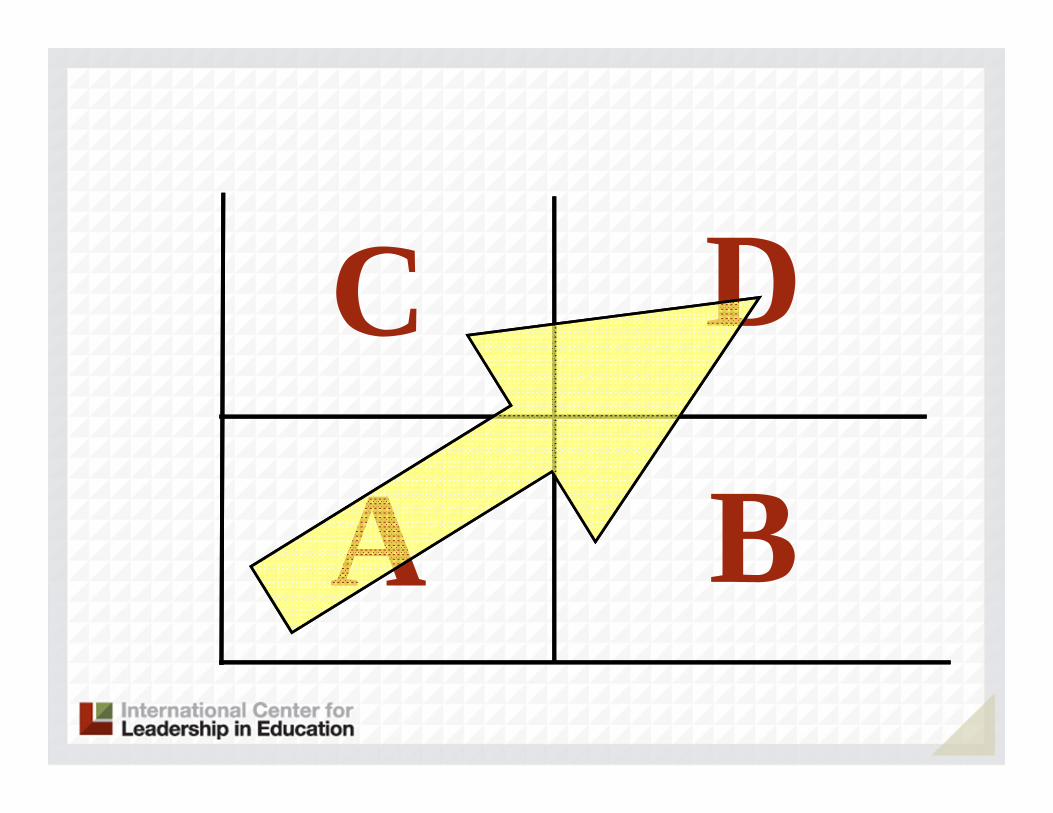
C D
A B456
321
Application

Rigor/Relevance Framework
1
23
456
1 2 3 4 5
A B
DCExpress probabilities as fractions, percents, or decimals.
Classify triangles according to angle size and/or length of sides.
Calculate volume of simple three‐dimensional shapes.
Given the coordinates of a quadrilateral, plot the quadrilateral on a grid.
Analyze the graphs of the perimeters and areas of squares having different‐length sides.
Determine the largest rectangular area for a fixed perimeter.
Identify coordinates for ordered pairs that satisfy an algebraic relation or function.
Determine and justify the similarity or congruence for two geometric shapes.
Obtain historical data about local weather to predict the chance of snow, rain, or sun during year.
Test consumer products and illustrate the data graphically.
Plan a large school event and calculate resources (food, decorations, etc.) you need to organize and hold this event.
Make a scale drawing of the classroom on grid paper, each group using a different scale.
Calculate percentages of advertising in a newspaper.
Tour the school building and identify examples of parallel and perpendicular lines, planes, and angles.
Determine the median and mode of real data displayed in a histogram
Organize and display collected data, using appropriate tables, charts, or graphs.

Rigor/Relevance Framework
1
23
456
1 2 3 4 5
A B
DCAnalyze the graphs of the perimeters
and areas of squares having different‐length sides.
Determine the largest rectangular area for a fixed perimeter.
Identify coordinates for ordered pairs that satisfy an algebraic relation or function.
Determine and justify the similarity or congruence for two geometric shapes.
Obtain historical data about local weather to predict the chance of snow, rain, or sun during year.
Test consumer products and illustrate the data graphically.
Plan a large school event and calculate resources (food, decorations, etc.) you need to organize and hold this event.
Make a scale drawing of the classroom on grid paper, each group using a different scale.
Calculate percentages of advertising in a newspaper.
Tour the school building and identify examples of parallel and perpendicular lines, planes, and angles.
Determine the median and mode of real data displayed in a histogram
Organize and display collected data, using appropriate tables, charts, or graphs.
Express probabilities as fractions, percents, or decimals.
Classify triangles according to angle size and/or length of sides.
Calculate volume of simple three‐dimensional shapes.
Given the coordinates of a quadrilateral, plot the quadrilateral on a grid.

Rigor/Relevance Framework
1
23
456
1 2 3 4 5
A B
DCExpress probabilities as fractions, percents, or decimals.
Classify triangles according to angle size and/or length of sides.
Calculate volume of simple three‐dimensional shapes.
Given the coordinates of a quadrilateral, plot the quadrilateral on a grid.
Analyze the graphs of the perimeters and areas of squares having different‐length sides.
Determine the largest rectangular area for a fixed perimeter.
Identify coordinates for ordered pairs that satisfy an algebraic relation or function.
Determine and justify the similarity or congruence for two geometric shapes.
Obtain historical data about local weather to predict the chance of snow, rain, or sun during year.
Test consumer products and illustrate the data graphically.
Plan a large school event and calculate resources (food, decorations, etc.) you need to organize and hold this event.
Make a scale drawing of the classroom on grid paper, each group using a different scale.
Calculate percentages of advertising in a newspaper.
Tour the school building and identify examples of parallel and perpendicular lines, planes, and angles.
Determine the median and mode of real data displayed in a histogram.
Organize and display collected data, using appropriate tables, charts, or graphs.
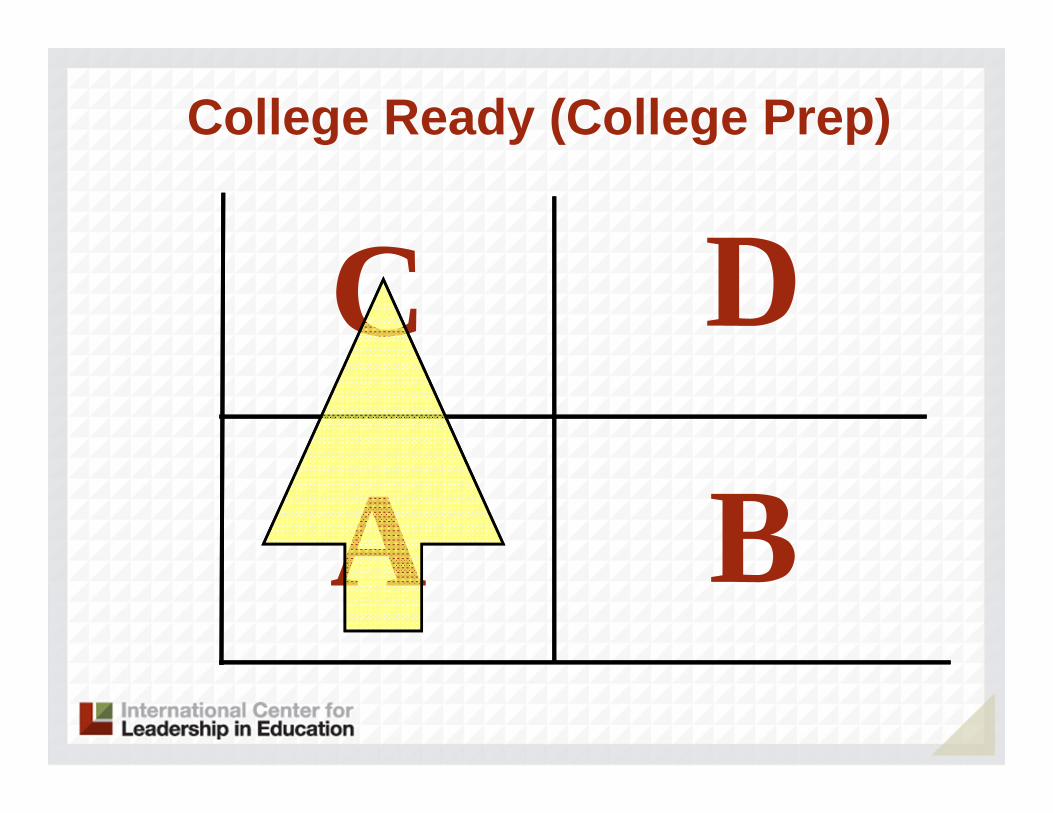
A B
DCCollege Ready (College Prep)

A B
DCJob Ready (CTE)

A B
DCCareer Ready

Decision MakingInnovation/Creativity Goal Setting/Results DrivenMulti TaskingWork with others
Quad D – Skills and Knowledge
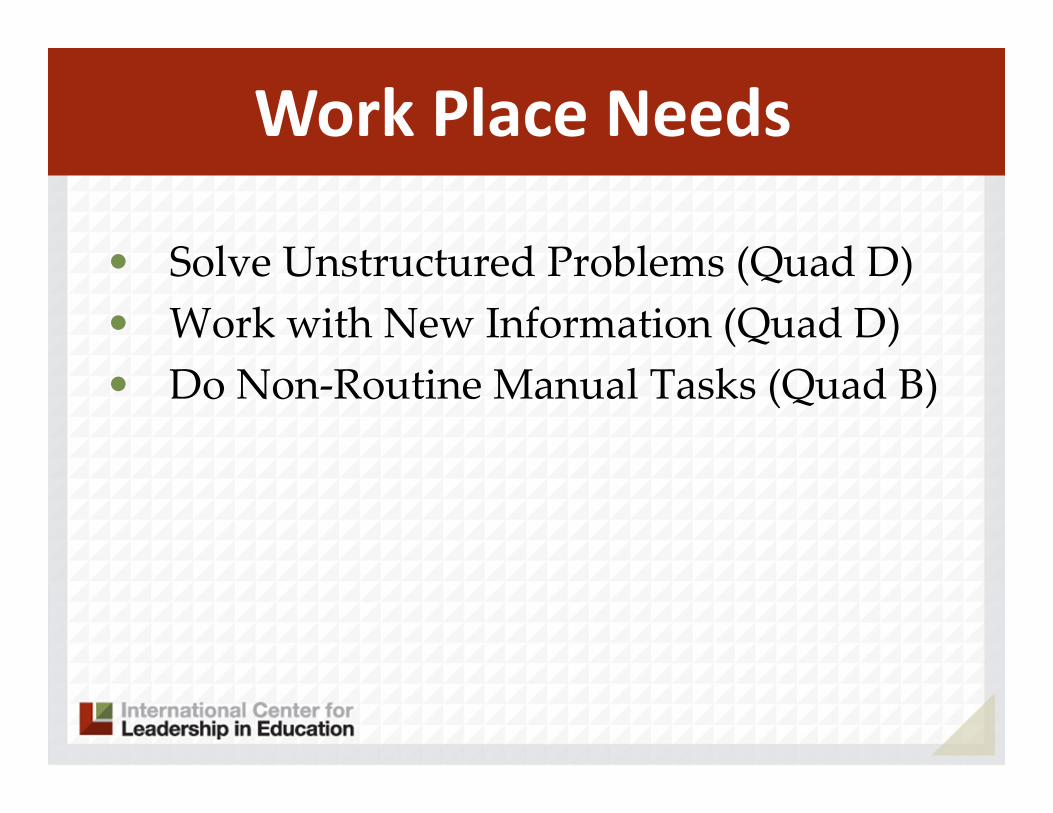
• Solve Unstructured Problems (Quad D)• Work with New Information (Quad D)• Do Non‐Routine Manual Tasks (Quad B)
Work Place Needs

A B
DCStandards

A B
DCAssessments
SAT, ACT, AP

Challenges our Rules, Regulations, Certifications, Contracts, Tenure,
and Bell Schedules
Quad D
• Digital• Career Ready• Focus on Application• Focus on Rigor
Emerging Trends

600
800
1000
1400
1600
1200
Text
Lex
ile M
easu
re (L
)
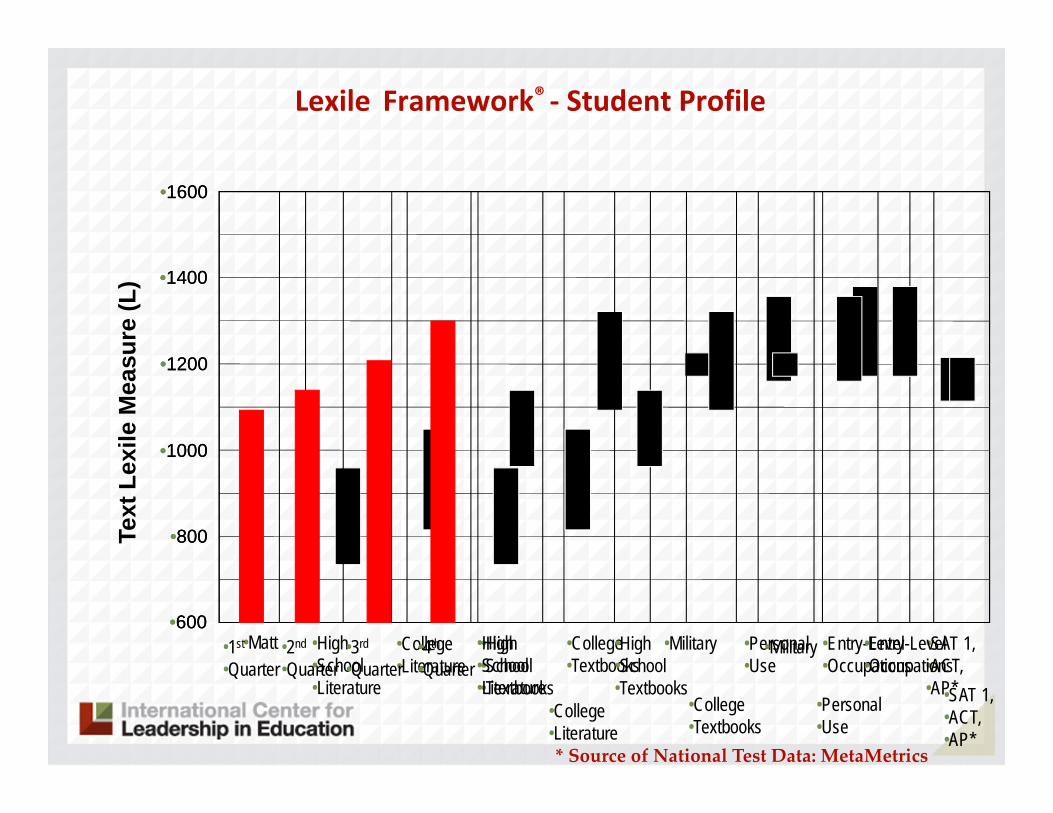
HighSchool
Literature
CollegeLiterature
HighSchool
Textbooks
CollegeTextbooks
Military PersonalUse
Entry-LevelOccupations
SAT 1,ACT,AP*
* Source of National Test Data: MetaMetrics
Reading Study SummaryInterquartile Ranges Shown (25% - 75%)

Grade 4 Reading Proficiency
TN170
MA234NY
200
(207)
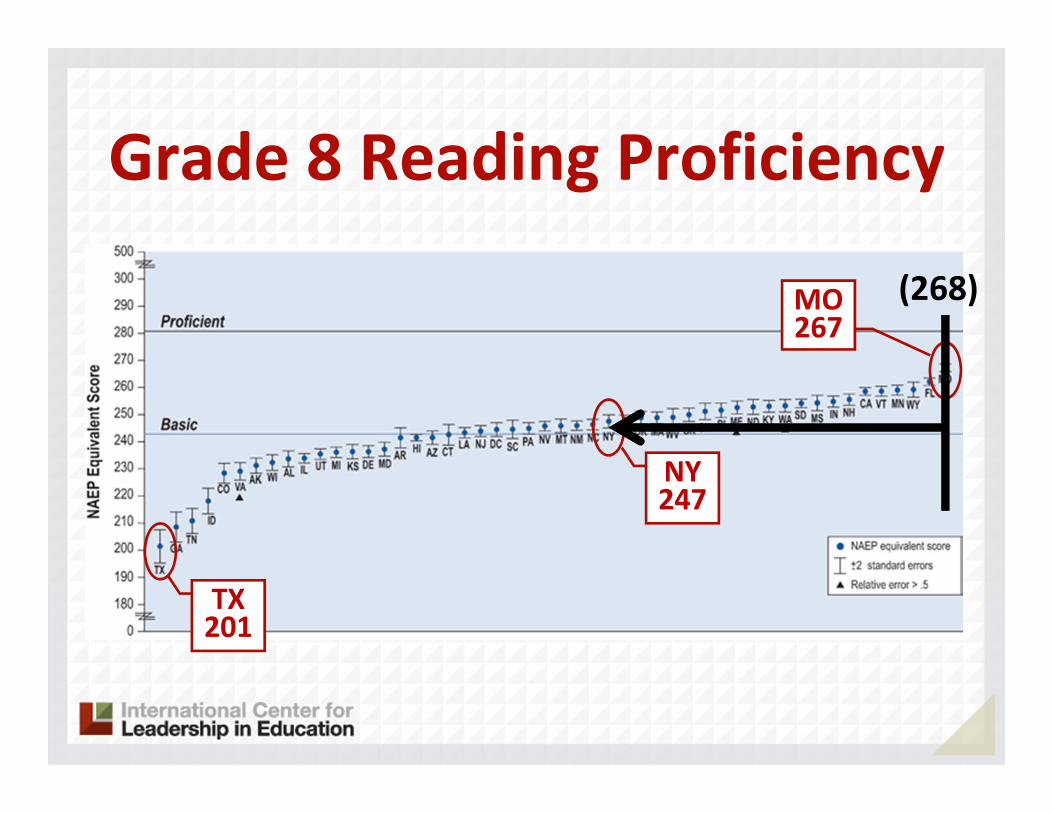
Grade 8 Reading Proficiency
MO267
TX201
NY247
(268)

Grade 4 Math Proficiency
TN195
MA255
NY207
(207)
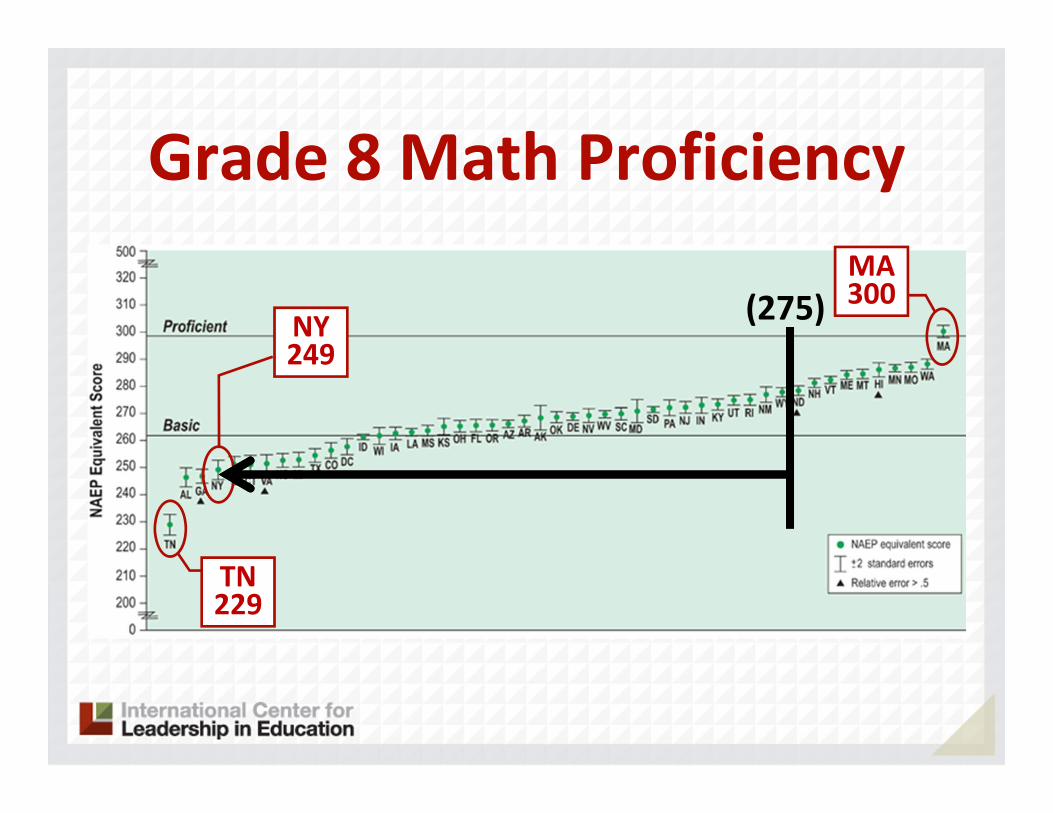
Grade 8 Math Proficiency
TN229
MA300
NY249
(275)

• Digital• Career Ready• Focus on Application• Focus on Rigor• Personal Skill Development
Emerging Trends

Guiding Principles
Responsibility Contemplation Initiative Perseverance Optimism Courage
Respect Compassion Adaptability Honesty Trustworthiness Loyalty

WHY - WHAT - HOW WHAT

1. Knowledge in one discipline2. Application within discipline3. Application across disciplines4. Application to real‐world
predictable situations5. Application to real‐world
unpredictable situations
Application Model

600
800
1000
1400
1600
1200
Text
Lex
ile M
easu
re (L
)
HighSchool
Literature
CollegeLiterature
HighSchool
Textbooks
CollegeTextbooks
Military PersonalUse
Entry-LevelOccupations
SAT 1,ACT,AP*
* Source of National Test Data: MetaMetrics
Reading Study SummaryInterquartile Ranges Shown (25% - 75%)
Guiding Principles
Responsibility Contemplation Initiative Perseverance Optimism Courage
Respect Compassion Adaptability Honesty Trustworthiness Loyalty

HOW

Model Schools Conference
www.modelschoolsconference.com
23rd Annual
June 28 – July 1, 2015 | Atlanta
REGISTER TODAYFor Early Registration Savings

Recommendations

Action Plan
• Create a Culture

Action Plan
• Create a Culture•Needs Assessment

Action Plan
• Create a Culture•Needs Assessment• Professional Development

Action Plan
• Professional Development‐Rigor and Relevance
A B
DC

Action Plan
• Professional Development‐Rigor and Relevance‐Literacy across the Curriculum

600
800
1000
1400
1600
1200
Text
Lex
ile M
easu
re (L
)
HighSchool
Literature
CollegeLiterature
HighSchool
Textbooks
CollegeTextbooks
Military PersonalUse
Entry-LevelOccupations
SAT 1,ACT,AP*
* Source of National Test Data: MetaMetrics
Reading Study SummaryInterquartile Ranges Shown (25% - 75%)

Action Plan
• Create a Culture•Needs Assessment• Professional Development• Change the Report Card

Lexile Framework® ‐ Student ProfileMatt ‐ Age 15, Grade 10, Lexile 1090, GPA 3.0
•600
•800
•1000
•1400
•1600
•1200
Text
Lex
ileM
easu
re (L
)
•Matt
•910
* Source of National Test Data: MetaMetrics

Lexile Framework® ‐ Student Profile
•600
•800
•1000
•1400
•1600
•1200
•Tex
t Lex
ile M
easu
re (L
)
•High•School•Literature
•College•Literature
•High•School•Textbooks
•College•Textbooks
•Military •Personal•Use
•Entry-Level•Occupations
•SAT 1,•ACT,•AP*
* Source of National Test Data: MetaMetrics
•Matt•600
•800
•1000
•1400
•1600
•1200
•High•School•Literature
•College•Literature
•High•School•Textbooks
•College•Textbooks
•Military
•Personal•Use
•Entry-Level•Occupations
•SAT 1,•ACT,•AP*
•1st
•Quarter•2nd
•Quarter•3rd
•Quarter•4th
•Quarter
Lexile Framework® ‐ Student Profile
•600
•800
•1000
•1400
•1600
•1200
Text
Lex
ileM
easu
re (L
)
•High•School•Literature
•College•Literature
•High•School•Textbooks
•College•Textbooks
•Military •Personal•Use
•Entry-Level•Occupations
•SAT 1,•ACT,•AP*
* Source of National Test Data: MetaMetrics
•Matt•600
•800
•1000
•1400
•1600
•1200
•High•School•Literature
•College•Literature
•High•School•Textbooks
•College•Textbooks
•Military
•Personal•Use
•Entry-Level•Occupations
•SAT 1,•ACT,•AP*
•1st
•Quarter•2nd
•Quarter•3rd
•Quarter•4th
•Quarter

Recommendations
• Create a Culture•Needs Assessment• Professional Development• Report Card •We Surveys

Guiding Principles
Responsibility Contemplation Initiative Perseverance Optimism Courage
Respect Compassion Adaptability Honesty Trustworthiness Loyalty

Survey Tools for Rigor, Relevance and Relationships
We Learn Student Survey
We Teach Instructional Staff Survey
We LeadWhole Staff Survey

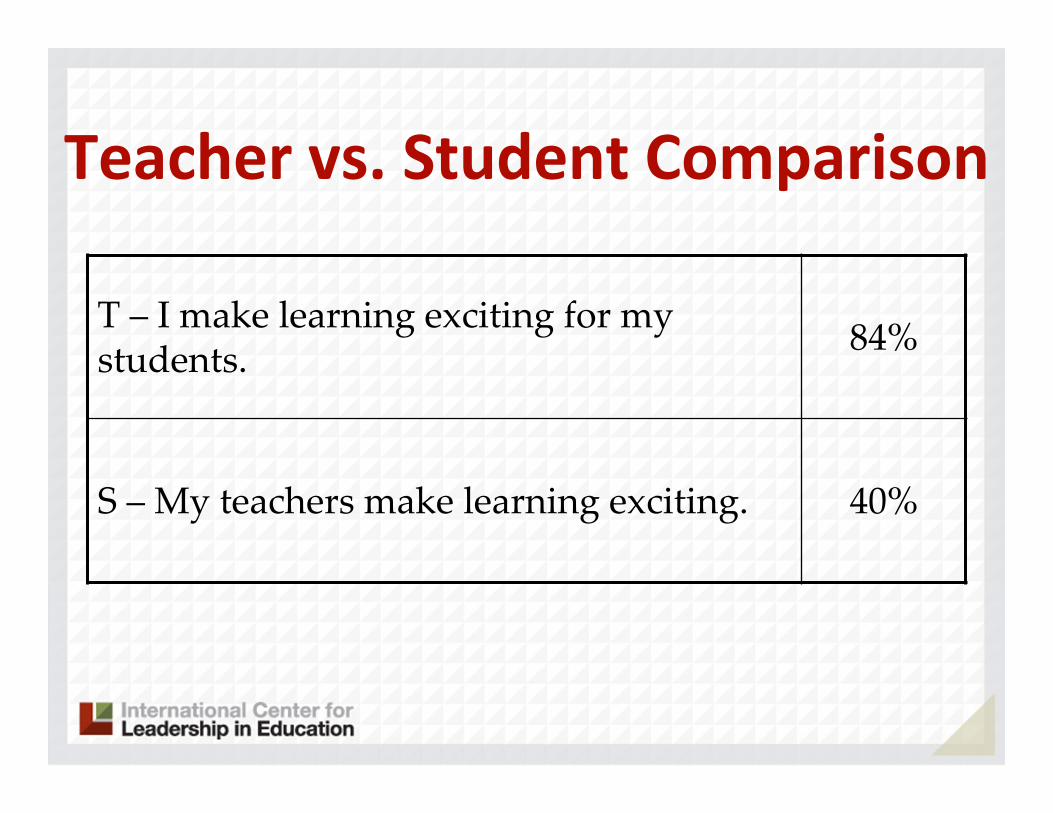
Teacher vs. Student Comparison
T – Students can apply what I am teaching to their everyday lives. 92%
S – I can apply what I learn to my everyday life. 58%

Teacher vs. Student Comparison
T – Students in my classroom engage in hands‐on activities. 88%
S – We do lots of hands‐on activities in my classes. 45%
Teacher vs. Student Comparison
T – I make learning exciting for my students. 84%
S – My teachers make learning exciting. 40%

Teacher vs. Student Comparison
T – I recognize students when they demonstrate positive behavior in school. 95%
S – Good citizenship is rewarded in this school. 40%

Recommendations
• Create a Culture•Needs Assessment• Professional Development•Report Card •We Surveys• Career Ready Institute

Model Schools Conference
www.modelschoolsconference.com
23rd Annual
June 28 – July 1, 2015 | Atlanta
REGISTER TODAYFor Early Registration Savings

Doctor