advanced strategies to control white paper - mettler toledo · white paper advanced strategies to...
TRANSCRIPT

Whi
te P
aper Advanced Strategies to Control
Crystal Size Distribution
Author: Des O’Grady PhD, METTLER TOLEDO
Many products in the pharmaceutical and high value chemical industries go through multiple crystallization steps during their development and manufacture. Crystallization is an extremely important unit operation that provides both purification and product isoltaion at the same time. Furthermore, crystallization also provides the opportunity to control the particle size and shape distribution of the product; which directly impacts product performance and downstream process efficiency. During the development of a new crystallization step, or as part of an existing process improvement strategy, it is possible to implement proven tech-niques that will facilitate the control of crystal size and shape distribution in a manufacturing environment. In a previous whitepaper, the fundamentals of crystallization process develop-ment were elucidated, namely solubility determination, supersaturation control, and crystal size monitoring. In this paper, attention will be paid to more advanced techniques where in process characterization of important crystallization parameters, such as supersaturation and crystal size, are needed to make evidence-based decisions that ensure a high quality product is delivered consistently at the lowest possible total cost. The following topics will be covered:
Contents
1 How to Control Supersaturation
2 Choosing the Correct Process Parameters
3 Using Seeding to Improve Process Consistency – Choosing the Seed Mass and Size – Choosing the Seed Temperature – Ensuring Seed Dispersion
4 The Impact of Mixing on Crystallization – Supersaturation and Anti-solvent Addition – Effect of Mixing on Crystal Breakage and Attrition
5 After the Crystallization – Methods to Control Crystal Size
6 Conclusions
7 Appendix A and B
8 References
Whi
te P
aper
2 White Paper METTLER TOLEDO
1 How to Control Supersaturation
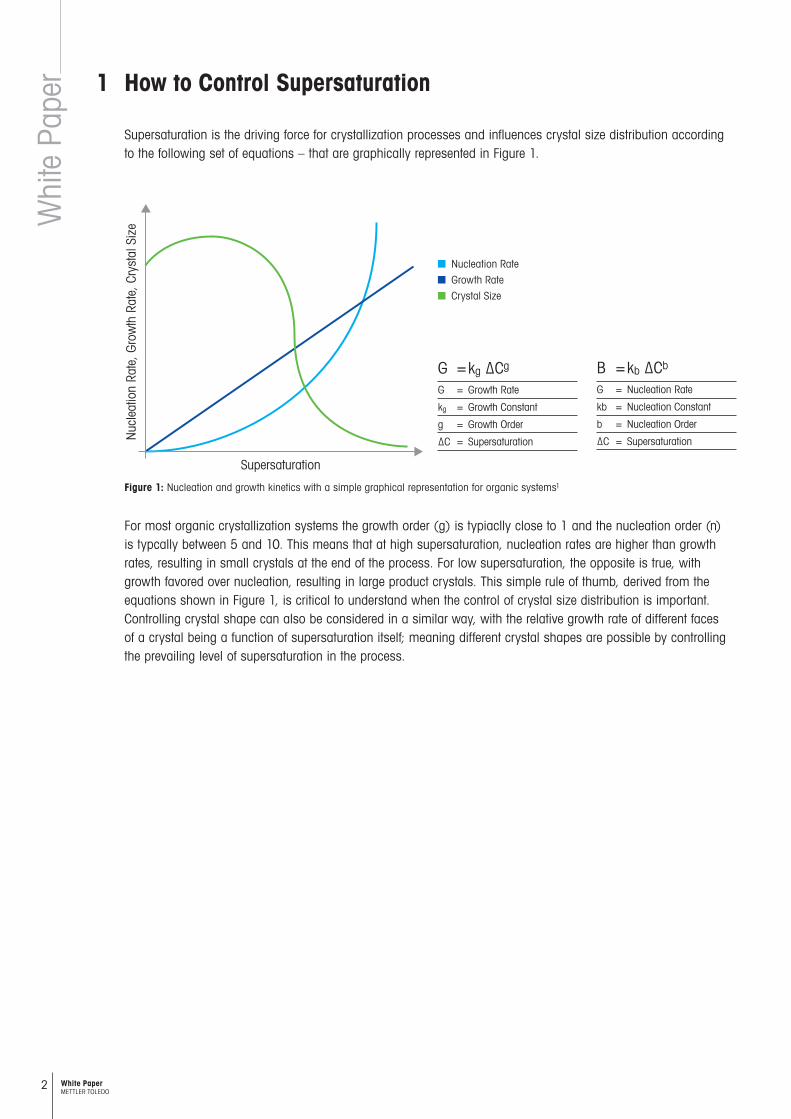
Supersaturation is the driving force for crystallization processes and influences crystal size distribution according to the following set of equations – that are graphically represented in Figure 1.
Figure 1: Nucleation and growth kinetics with a simple graphical representation for organic systems1
Nuc
leat
ion
Rate
, Gro
wth
Rat
e, C
ryst
al S
ize
Supersaturation
For most organic crystallization systems the growth order (g) is typiaclly close to 1 and the nucleation order (n) is typcally between 5 and 10. This means that at high supersaturation, nucleation rates are higher than growth rates, resulting in small crystals at the end of the process. For low supersaturation, the opposite is true, with growth favored over nucleation, resulting in large product crystals. This simple rule of thumb, derived from the equations shown in Figure 1, is critical to understand when the control of crystal size distribution is important. Controlling crystal shape can also be considered in a similar way, with the relative growth rate of different faces of a crystal being a function of supersaturation itself; meaning different crystal shapes are possible by controlling the prevailing level of supersaturation in the process.
Nucleation Rate
Growth Rate
Crystal Size
G = kg ∆Cg
G = Growth Rate
kg = Growth Constant
g = Growth Order
∆C = Supersaturation
B = kb ∆Cb
G = Nucleation Rate
kb = Nucleation Constant
b = Nucleation Order
∆C = Supersaturation

3White Paper METTLER TOLEDO
Supersaturation is generated by reducing the solubility of the product in solution, typically by cooling or adding an anti-solvent. The rate at which a solution is cooled or anti-solvent is added, directly influences the level of super-saturation. Since crystallization is a kinetic process, and does not occur instantaneously, supersaturation can build up over time, especially in cases where the growth and nucleation kinetics are slow. Such an effect is exacerbated when cooling or anti-solvent addition is rapid. In this case supersaturation is generated quickly, does not have time to be consumed via crystallization, and results in a significant accumulation of supersaturation.
This well-known phenomenon is studied in detail by comparing a slow and fast anti-solvent addition crystalliza-tion.5 Undersaturated solutions of benzoic acid in ethanol-water mixtures are prepared and water is added at a fixed rate of 0.1 g/s and 0.2 g/s respectively, at a fixed temperature of 25 °C. The liquid concentration is measured in real time with in situ FTIR (ReactIR™ instruments). Figure 2a shows the solubility curve for benzoic acid in ethanol-water mixtures with desupersaturation profiles overlaid for each experiment. The desupersaturation profile shows that the solution begins in the undersaturated region and as water is added the process moves past the solubility curve into the supersaturated region. The liquid concentration decreases upon crystal nucleation, stays close to the solubility curve, and at the end of the anti-solvent addition period drops to the solubility curve. When anti-solvent is added at the faster rate, the supersaturation level is higher throughout the process due to a buildup that cannot be relieved fast enough through crystal growth and nucleation. In Figure 2b supersaturation for each experiment is plotted with respect to anti-solvent concentration, and clearly shows that a faster addition rate means higher supersaturation for the full experimental range.
1.0 1.5 2.0 2.5 3.5
0.30
0.25
0.20
0.15
0.10
0.05
0.00
Solu
te C
once
ntra
tion
(g/g
)
Anti-solvent Concentration (g/g)3.0
Figure 2: (a) Anti-solvent concentration vs. solute concentration; (b) anti-solvent concentration vs. supersaturation
Addition Rate – 0.2 g/s
Addition Rate – 0.1 g/s
Solubility Curve
1.0 1.5 2.0 2.5 3.5
0.04
0.02
0.00
-0.02
-0.04
-0.06
-0.08
-0.10
-0.12
Supe
rsat
urat
ion
(g/g
)
Anti-solvent Concentration (g/g)3.0
Saturated
Undersaturated Addition Rate – 0.2 g/s
Addition Rate – 0.1 g/s

Whi
te P
aper
4 White Paper METTLER TOLEDO
This simple example illustrates a critical rule-of-thumb, that is based on the equations presented in Figure 1 and proven experimentally, for an organic system in Figures 2 and 3.
Such an approach has obvious merit, and is grounded in sound scientific principles, however effective and evidence-based crystallization process development and improvement is more nuanced. For example, generating supersaturation at a very fast rate can lead to the generation of unwanted impurities in the form of transient oil phases or unwanted polymorphic forms. Similarly, in an effort to generate large crystals, cycle time cannot always be sacrificed, meaning extremely slow cooling or anti-solvent addition rates are simply not possible. In the following sections, more advanced methods to control crystal size and shape will be presented.
The chord length distributions shown in Fig 3a were measured in line for both experiments using FBRM technology (ParticleTrack™ instruments). These distributions show a clear shift towards finer particles with faster antisolvent addition and a higher degree of supersaturation. Changing process parameters and supersaturation influences both crystal size and shape. Images captured with PVM technology (ParticleView™ instruments) at the end of each experiment illustrate this point. The slow addition rate yields large, well-formed elongated plates, while the fast addition rate yields fine needles that readily agglomerate (Figure 3b). This result shows that by changing super-saturation in a crystallization system it is possible to modify crystal size, shape, and the degree of agglomeration, and demonstrates the importance of understanding and controlling the prevailing level of supersaturation.
To make large crystals, generate supersaturation slowly; to make small crystals, generate supersaturation quickly
1.0 10.0 100.0 1000.0
100
80
60
40
20
0
Coun
t/s
Dimension (μm)Figure 3: (a) chord length distributions at the end of the slow and fast antisolvent addition processes; (b) real time microscope images providing information on the size, shape, and structure of the crystals at the endpoint.
More Fine Material
Less Coarse Material
1 2
Mean, Sqr Wt(1 to 1000)
165.90 89.39
a. b.

5White Paper METTLER TOLEDO
2 Choosing the Correct Process Parameters
Often large crystals are desired due to their preferable behavior downstream from the crystallizer, during filtration, drying, and transport to a subsequent step. For intermediate crystallization steps, generating large crystals is generally highly favorable since downstream filtration and drying are bottlenecks where cycle time can be mini-mized. Since large crystals typically filter and dry well, this is often desired.
Studying the governing equations of crystal growth and nucleation, described in Figure 1, it is shown that the surface area of the crystal slurry actually plays a very important role. In fact, a surface area factor is a variable in the growth and nucleation constants kg and kb, meaning the rate of crystal growth and nucleation depends on the surface area of the crystals present in the slurry1. Further investigation of the derivation of these equations shows that growth rates are highly dependent on surface area, far more than nucleation rates. Surface area has important implications for the design of a crystallization process. At the start of crystallization, the surface area of crystals present in the slurry is low – meaning nucleation can dominate over growth, regardless of other kinetic factors. As the crystallization proceeds, the surface area increases and it is possible for growth to take over.
With this in mind, it becomes clear that a clever technique for enhancing growth is to cool very slowly at first, when surface area is small. This keeps supersaturation low and allows growth to dominate. After some time, when surface area has increased, the cooling rate can be increased, reducing batch time, while still favoring growth. This technique strikes the right balance between controlling supersaturation and excessive nucleation, while avoid-ing very long batch times. Figure 4 compares linear and optimized cooling rates2. It should be noted that ambient cooling (fixing the jacket temperature at the endpoint temperature and simply allowing the batch to cool down) is the worst possible scenario with a fast cooling rate at first, where there is little surface area, and then slow at the end, when the process could run much faster!

Whi
te P
aper
6 White Paper METTLER TOLEDO
Δc,
T
Time
Gro
wth
, Nuc
leat
ion
Time
a b
Figure 4: Schematic of expected growth and nucleation rates for linear and non-linear cooling profiles. The supersaturation generated in Figures a and c results in nucleation and growth rates shown in Figures b and d respectively.
Δc,
T
Time
Gro
wth
, Nuc
leat
ion
Time
dc
The theory behind the value of non-linear cooling rates to keep supersaturation constant over the course of a process has been shown often in the literature and has been proven elegantly by implementing a control loop that adjusts process temperature in order to keep supersaturation constant. Such a result is shown in Figure 5 where a control algorithm is used to perform a crystallization process at constant supersaturation and the resulting temperature profiles are non-linear, slow at first and fast towards the end3. Supersaturation is controlled via in situ FTIR (ReactIR) which measures liquid phase concentration. Control can be accomplished by using commercial lab reactor hardware such as the EasyMax™ or OptiMax™ automated chemistry workstations. As expected, the crystal size for each experiment varies with low supersaturation; producing more large crystals and fewer small crystals. Figure 6 neatly illustrates this result with FBRM (ParticleTrack instrument) measurements showing a steady increase in the particle dimension as measured by the median square weighted chord length (a measure of needle length) for both experiments, but a higher value for the process that operated at the slower cooling rate. Particle count, measured in process is also significantly lower for the slow process, evidence that growth is likely favored over nucleation.
Temperature
Supersaturation (Δc) Growth Rate
Nucleation Rate
Temperature
Supersaturation (Δc) Growth Rate
Nucleation Rate

7White Paper METTLER TOLEDO
Tem
pera
ture
Time
Temperature; Supersaturation (Δc)
Figure 5: Supersaturation and temperature profiles for control experiments with supersaturation set-point values of (a) 2.0 and (b) 1.5. ReactIR was used to monitor supersaturation in real time.
0 2 4 6 8 10 12 14 16 18
60
55
50
45
40
35
30
25
20
Tem
pera
ture
(°C
)
Time (h)
8
7
6
5
4
3
2
1
0
Supe
rsat
urat
ion
(C-C
*)
0 2 4 6 8 10 12 14 16 18
60
55
50
45
40
35
30
25
20
Tem
pera
ture
(°C
)
Time (h)
8
7
6
5
4
3
2
1
0
Supe
rsat
urat
ion
(C-C
*)
a b
Median Sq. Wt.; Counts (1-50 µm)
Figure 6: Median square weight and counts 1-50 µm profiles for control experiments with a supersaturation set-point value of (a) 2.0 and (b) 1.5
0 2 4 6 8 10 12 14 16 18
115
110
105
100
95
90
85
80
75
70Sq. W
t. M
edia
n (5
0 μm
to 1
000
μm)
Time (h)
1400
1300
1200
1100
1000
900
800
700
600
500
Coun
ts/s
ec (
1 μm
to 5
0 μm
)
0 2 4 6 8 10 12 14 16 18
115
110
105
100
95
90
85
80
75
70Sq. W
t. M
edia
n (5
0 μm
to 1
000
μm)
Time (h)
1400
1300
1200
1100
1000
900
800
700
600
500
Coun
ts/s
ec (
1 μm
to 5
0 μm
)
a b
The data shown in Figures 5 and 6 essentially illustrate that in order to keep supersaturation low and constant, the kinetics of the system demand a non-linear cooling rate that is slow at first and fast at the end. This is direct evidence that proves the assertions in Figure 4 and provide a good indicator that non-linear cooling rates have a major role to play in ensuring targeted and consistent crystals size distributions can be achieved during crystalli-zation process development and improvement.
Figure 7: Three linear cooling ramps approximating a non-linear cooling curve.
Non-linear cooling curve
Three linear cooling ramps
One draw-back from such an approach is that implementing a non-linear cooling or anti-solvent addition profile in the plant can be difficult – however success can still be achieved by using a small number of linear ramps that achieve a similar result (Figure 7).

Whi
te P
aper
8 White Paper METTLER TOLEDO
3 Using Seeding to Improve Process Consistency
Choosing the Seed Mass and Size
The preceding examples have shown in detail that controlling supersaturation is critical for effective crystallization process development. One of the most straightforward methods to control supersaturation is to use seeding – whereby a small mass of crystals is added to a supersatured solution in order to (a) start the crystallization at the desired supersaturation level and (b) provide sufficient surface area so as to ensure supersaturation is consumed in a controlled way.
Choosing the correct seed loading (mass) and seed size can also help to produce final crystal product of a specified size. If we consider a theoretical crystallization system where only growth occurs and the crystals are spherical, it is possible to develop a very simple model whereby the final crystal size can be predicted based simply on the starting seed size and loading.
Consider the case where we seed a crystallization with 1% seed. In this case 1% is simply the ratio of seed mass to the final anticipated product mass. Since the seed and final product have identical density it is simple to convert mass ratio to volume ratio and then the next logical step would be to convert volume ratio to diameter ratio (Figure 8).
Figure 8: Simple equations used to model the relationship between seed and final product size
With this simple model it is possible to input seed mass and size to calculate the size of the final product for a model crystallization system. For example:
1% seed of 20 μm will produce final product crystals of 93 μm5% seed of 20 μm will produce final product crystals of 54 μm1% seed of 40 μm will produce final product crystals of 185 μm
MassSeed
MassProduct
= 0.01DiameterSeed
DiameterProduct
= 0.01VolumeSeed
VolumeProduct
= 0.01
3
This shows that for the same seed size, a larger seed mass results in smaller crystals. And for the same seed mass a larger seed size produces larger crystals.

9White Paper METTLER TOLEDO
Figure 9: Real time microscopy (ParticleView instrument) images for a seeded crystallization process during an isothermal hold (a) seeding event; (b) surface nucleation; (c) dendritic growth and secondary nucleation; (d) bimodal crystal size and shape distribution
While this simple model is useful for demonstrating how seed size and loading affect the final crystal size distribu-tion, the assumptions used are not commonly observed in real systems. Crystals are rarely spherical, meaning more complex models are needed to predict the size of needles. Crystallization processes are rarely, if ever, completely growth dominated. Some degree of nucleation and attrition almost always occurs and in order to develop an effective seeded crystallization. Real-time microscopy offers a unique opportunity to better understand seeding events as this example demonstrates.
In Figure 9 the seeding process during an organic crystallization process is observed directly using real time microscopy. After seed crystals are added to the supersaturated solution (Figure 9a) it becomes apparent that surface nucleation on the seed crystals occurs (Figure 9b). Over time dendritic growth occurs, with small crystal “branches” growing orthogonally from the seed crystal (Figure 9c). After 30 minutes a bimodal size and shape distribution is present, indicating that the final crystal product may filter and dry poorly (Figure 9d).
Seed Crystals
a Tseed b Tseed + 2 min
c Tseed + 10 min d Tseed + 20 min
Dendritic Growth
Dendritic Growth
Secondary Nucleation
Poorly Filtering Material

Whi
te P
aper
10 White Paper METTLER TOLEDO
With real time microscopy it is possible to directly observe seed behavior in order to make rapid optimization decisions. In this example, a poorly filtering crystal product was immediately traced back to the dendritic growth on seed crystals. The reason dendritic growth occurred in this case is because the seed crystals were dry milled to increase available surface area prior to addition to the supersaturated solution. The surface defects and imperfec-tions caused by this milling procedure introduced sites on the crystal surface for this dendritic growth to occur. An example such as this serves to prove that the seeding event should be understood and characterized effectively in order to ensure a repeatable and effective final crystal product.
Choosing the Seed Temperature
Another critical variable to consider when designing a seeded crystallization process is the supersaturation level at which seed will be added. In a cooling crystallization, this might be referred to as the “seeding temperature”, but really it is the supersaturation level that is being considered. Seeding at high supersaturation levels may simply result in excessive secondary nucleation, rendering the seeding process itself redundant unless the goal is a fine crystal size distribution. If crystal growth is desired, then seeding closer to the solubility curve, at lower super-saturation, may be a wise choice. This approach is shown in Figure 10 where three crystallization processes are compared, using a ParticleTrack instrument, at three different seeding temperatures. By comparing particle counts between 0 µm and 10 µm for each crystallization, it is possible to compare relative nucleation rates at different seeding temperatures. The lowest seeding temperature (highest supersaturation) results in the highest degree of nucleation and fine crystals at the end of the process.
Figure 10: Time vs. counts (0 μm to 10 μm) for three crystallization processes with seeding temperatures of 19 °C, 25 °C, and 33 °C.
Seeding Temperature − 19 °C, many small particles
Seeding Temperature − 25 °C
Seeding Temperature − 33 °C, less small particlesParti
cle
Coun
t (0
μm to
10
μm)
Time (min)

11White Paper METTLER TOLEDO
It is even more critical to ensure that seed is not added to an undersaturated solution – in which case the seeds would dissolve, and the particle counts would disappear from the ParticleTrack trends. Likewise adding seed to a crystallization where seeds have already appeared is not effective, since the addition of a few more crystals won’t provide any more additional effective surface area to enhance the process, and the seeds ability to control the tem-perature at which crystallization occurs is redundant.
Ensuring Seed Dispersion
Another important factor to consider, when seeding, is that during preparation and storage, seed crystals can stick together and form aggregates. Often an isothermal hold after seeding is required to ensure that seed crystals are able to fully disperse and the full surface area is available for crystallization to progress. Such an isothermal hold can also help seed crystals grow, increasing the surface area available for growth. Figure 11 shows a ParticleTrack process trend that describes a crystallization process where it takes four hours for seeds to fully disperse. This example, along with the others provided above, indicate that careful characterization of the seeding process, in terms of a number of critical process variables, is vital to ensure consistency and product quality4.
Figure 11: Seed dispersion over time showing counts (0 µm to 50 µm) increasing with mean chord length and large counts (50 µm to 1000 µm) decreasing simultaneously. Seeds are not fully dispersed for a full four hours in this manufacturing scale batch.
Counts (0 μm to 50 μm)
Counts (50 μm to 1000 μm)
Mean Chord Length
Parti
cle
Coun
ts
Time (min)

Whi
te P
aper
12 White Paper METTLER TOLEDO
4 The Impact of Mixing on Crystallization
Supersaturation and Anti-solvent Addition
Changing the scale or mixing conditions in a crystallizer can directly impact the kinetics of the crystallization process and the final crystal size. Heat and mass transfer effects are important to consider for cooling and anti-solvent systems respectively where temperature or concentration gradients can produce inhomogeneity in the prevailing level of supersaturation. This often manifests itself as pockets of very high supersaturation close to the walls of the vessel for a cooling crystallization, or at the addition location of the antisolvent for antisolvent (and also reactive) crystallizations. These pockets of high supersaturation can cause very high nucleation and growth rates in certain regions of a large scale crystallizer, meaning the final crystal size distribution could vary dramatically from that achieved in a better mixed environment in the lab during development. In Figure 12, a change from a 500 mL reactor to a 2 L reactor for the same crystallization process results in unexpected nucleation events charac-terized by ParticleTrack. Also the number of fines generated throughout the batch is significantly higher.
Parti
cle
Coun
ts (
0 μm
to 5
0 μm
)
Time (min)
Figure 12: Comparing the generation of fine counts, measured by ParticleTrack, over time for the same crystallization process at 500 mL and 2 L
Fine Counts at 2 L Scale, Crude Addition
Fine Counts from 500 mL
Secondary and Tertiary Nucleation∆ Fines

13White Paper METTLER TOLEDO
The effect of local supersaturation build up on crystallization is shown in Figure 13 where the repeatability of the nucleation point for an unseeded crystallization is shown for an anti-solvent crystallization system. For this process, when anti-solvent is added above the liquid surface and near the wall of the reactor, especially at higher addition rates, the nucleation point is extremely variable with wide error bars shown for these experiments that were conducted in triplicate5. Additionally when adding anti-solvent above surface and at the wall of the crystal- lizer, nucleation consistently occurs sooner, at lower anti-solvent concentrations. The reason for these two concerning results is that when anti-solvent is added close to the wall, the mixing conditions in the crystallizer make it difficult for the anti-solvent to be incorporated easily and supersaturation builds up at the feed location.
The reason for this dramatic disparity in consistency is due to how anti-solvent is incorporated into the vessel. Figure 14 shows computational fluid dynamics (CFD) images from a tracer experiment video for the vessel and addition locations shown in Figure 13. When anti-solvent is added above surface and close to the wall, it is diffi-cult to effectively incorporate the liquid into the bulk solution. The tracer stills for the wall addition location indicate that almost no anti-solvent incorporation occurs over the first second of the experiment. When anti-solvent is added closer to the impeller, it is clear from the adjacent tracer CFT images that incorporation of the anti-solvent occurs immediately. For this crystallization system this difference in anti-solvent incorporation – and the asso- ciated difference in the homogeneity of supersaturation through the vessel – causes significant differences in the nucleation and consistency of the crystallization process (Figure 13).5
Figure 13: (a) Reactor schematic; (a1) Impeller additional point; (a2) Wall additional point; (b) Antisolvent required to induce nucleation as a function of addition rate
0.0 0.1 0.2 0.3 0.5
0.4
0.3
0.2
0.1
0.0
-0.1
MSZ
W (
g w
ater
/g e
than
ol)
Additiona Rate (g water/s)0.4
Center Addition
Wall Addition
Liqu
id L
evel
Hei
ght =
46
mm
Reactor Diameter = 75 mm
ReactIR Probe, Ø 16 mm
Temperature Probe, Ø 6 mm
Impeller Shaft,Ø 8 mm
ParticleTrack Probe,Ø 8 mm
a b
a1 a2

Whi
te P
aper
14 White Paper METTLER TOLEDO
Figure 14: CFD tracer experiments profiling antisolvent incorporation in a 500 mL crystallizer agitated at 325 rpm with down-pumping impeller at relative time 0.1 s, 0.5 s, and 1 s; (a) wall addition (b) centre addition
b
b
b
a
a
a

15White Paper METTLER TOLEDO
Effect of Mixing on Crystal Breakage and Attrition
In addition to mass transfer effects, the shear rate in a crystallizer can have a physical impact on the crystals through breakage6. Crystal breakage is a function of the solids concentration in the system as well as the shear rate. As scale and mixing conditions change - solids concentration and shear rate gradients may become impor-tant, meaning more or less breakage could occur as a crystallization process is scaled up. In Figure 15 chord length distributions aquired using FBRM technology (ParticleTrack instruments) for a continuous crystallization process are shown for three different agitation intensities. As agitation and the associated shear rate increase, the distributions shift to the left with an increase in fine crystal counts, indicating crystal breakage. Such a result is common, however such behavior is extremely difficult to predict as the volume changes, since agitation intensity is not a scalable parameter. In Figure 16 specific power input, a saleable factor, is compared to a net attrition generation rate measured using FBRM. Here a clear relationship between the two is shown, meaning the impact of scale and mixing on crystal breakage can be predicted.
Figure 15: Chord length distributions for a continuous crystallization process at different agitation intensities6
Figure 16: Specific power input vs. net attrition generation providing a scale independent predictor of crystal attrition6
0.01 0.10 1.00
3.0E-03
2.5E-03
2.0E-03
1.5E-03
1.0E-03
5.0E-04
0.0E+00
Net
Attr
ition
Gen
erat
ion
Rate
[s-1
]
Specific Power Input (W.kg-1)
1 10 1000
2.E+09
1.E+09
1.E+09
1.E+09
8.E+08
6.E+08
4.E+08
2.E+08
0.E+00
Popu
latio
n D
ensi
ty [
m-4]
Crystal Size (μm)100
Initial Distribution
300 rpm
400 rpm
500 rpm
Increase in Population
Decrease in Dimension

Whi
te P
aper
16 White Paper METTLER TOLEDO
5 After the Crystallization – Methods to Control Crystal Size
After a crystallization process is complete, it is still possible to modify the crystal size and shape distribution using wet-milling. Typically a crystal slurry is passed through a high shear wet mill and crystal size is reduced with a corresponding increase in crystal count. This can be a useful approach in cases where crystal growth is dominant during the crystallization itself, and generating fine crystals through a standard crystallization process is not possible. Wet milling does pose challenges in terms of reaching a consistent crystal size distribution – when there may be variability in crystal size coming from the crystallizer itself. It is also preferable to avoid running multiple, high shear wet-mill passes as the excessive heat generated may compromise yield by dissolving crystals, or could result in the formation of unwanted impurities such as a different polymorphic crystal form.
In process particle characterization tools lend themselves particularly well to monitoring wet milling since taking a sample from a wet milling process is time consuming and the delay in offline analytical results is often prohibitive. In Figure 17, fine crystal counts as well as the mean chord length are trended over time for a wet milling process. Counts between 10 µm and 40 µm, increase in a non-linear way just as the mean chord length decreases in the same way. During the same period, fine counts (0 µm to 10 µm) increase linearly which is indicative of attrition. Real time microscopy images, Figure 18, before and after the wet milling process show how the size and shape distribution has changed, and in particular, the presence of very small crystal fragments after the wet milling step. Such complexity in the wet milling process is common and care must be taken to ensure that mill settings are optimized in order to consistently hit the target size specification in the shortest time possible.
Figure 17: Time vs. mean chord length and counts (0 µm to 10 µm and 10 µm to 40 µm) for a wet milling process
Coun
ts, M
ean
Time (min)
Mean Chord Length
Counts (0 µm to 10 µm)
Counts (10 µm to 40 µm)

17White Paper METTLER TOLEDO
Figure 18: Corresponding real time microscopy images for a wet milling process at the start and end of the process
6 Conclusions
Controlling crystal size during crystallization process development, or as part of a process improvement strategy, can have a major impact on product quality as well as process economics. It has been shown that careful control of supersaturation, through evidence-based development of the most appropriate cooling or anti-solvent addition rates, is vital to reach a consistent and targeted crystal size distribution. Non-linear cooling, with a slow cooling rate employed at the start of the process, and a faster rate at the end, is another useful strategy worth considering. Seeding has been shown to support the control of the nucleation point and maintenance of a desired supersatu-ration level; however, care must be taken to choose the correct seeding protocol particularly when it comes to processes that exhibit excessive nucleation rates or narrow metastable zone widths. Mixing plays a pivotal role in crystallization scale-up, particularly for anti-solvent addition processes, and care must be taken to develop, understanding around mixing for crystallization processes across volumes. Wet milling after the crystallization has been shown to offer an important opportunity to control crystal size, for difficult crystallization processes where generating small crystals is a challenge. Finally, common to all examples is the importance of inline particle characterization and liquid concentration measurements, which provide process understanding and offer insights into how process conditions continuously effect the crystallization process in real time. This enables smart decisions to be made throughout process development, scale up, and manufacturing, resulting in a higher quality product at a lower total cost.
Starting Material End Material

Whi
te P
aper
18 White Paper METTLER TOLEDO
7 Appendix A: ParticleTrack with FBRM® (Focused Beam Reflectance Measurement)
Measurement for optimization in real time – ParticleTrack is a precise and sensitive technology which tracks changes to particle dimension, particle shape, and particle count. Over a wide detection range from 0.5 µm to 2000 µm, measurements are acquired in real time, while particles are forming and can still be modified, enabling process optimization and control. No sampling or sample preparation is required – even in highly concentrated (70 % and higher) and opaque suspensions.
www.mt.com/ParticleTrack
1 2 3 4
Figure b.
Figure c. Chord Length Distributions
Figure d. Trended Statistics
Sapphire Window
Figure a.
The ParticleTrack probe is immersed into a dilute or concentrated flowing slurry, droplet emulsion, or fluidized particle system. A laser is focused to a fine spot at the sapphire window interface (Figure a). A magnified view shows individual particle structures will backscatter the laser light back to the probe (Figure b). These pulses of backscattered light are detected by the probe and translated into Chord Lengths based on the calculation of the scan speed (velocity) multiplied by the pulse width (time). A chord length is simply defined as the straight line distance from one edge of a particle or particle structure to another edge. Thousands of
individual chord lengths are typically measured each second to produce the Chord Length Distribution (CLD) (Figure c). The CLD is a “fingerprint” of the particle system, and provides statistics to detect and monitor changes in particle dimension and count in real time (Figure d).
Unlike other particle analysis techniques, ParticleTrack measurement makes no assumption of particle shape. This allows the fundamental measurement to be used to directly track changes in the particle dimension, shape, and count.
How does ParticleTrack work?
Laser Source
Laser Return
Optics Module

19White Paper METTLER TOLEDO
Appendix B: ParticleView with PVM® (Particle and Vision Microscope)
ParticleView V19 with PVM® technology is a probe-based instrument that visualizes particles and particle mechanisms in real time. High resolution images are continuously captured under a wide range of process conditions without the need for sampling or manual offline analysis. A process trend, sensitive to changes in particle size and concentration, is automatically combined with the most relevant images providing scientists with a straightforward and reliable method to ensure comprehensive process understanding is acquired with every experiment.
www.mt.com/ParticleView
How does ParticleView work?ParticleView uses a high resolution camera and internal illumination source to obtain high quality images even in dark and concentrated suspensions or emulsions. With no calibration needed and easy data interpretation, ParticleView quickly provides critical knowledge of crystal, particle, and droplet behavior.
Light Source
Camera
PVM Optics
Sapphire Window
Particle System
200 µm200 µm
Left: ParticleView inline image; Right: Offline microscope

Whi
te P
aper 8 References
1. J. Nývlt (1968) Kinetics of Nucleation in Solutions. Journal of Crystal Growth, 3 – 4, 377 – 383.
2. P. Barrett, B. Smith, J. Worlitschek, V. Bracken, B. O’Sullivan, and D. O’Grady (2005) A Review of the Use of Process Analytical Technology for the Understanding and Optimization of Production Batch Crystallization Processes. Organic Process Research & Development, 9(3), 348 – 355. http://doi.org/10.1021/op049783p
3. V. Liotta and V. Sabesan (2004) Monitoring and Feedback Control of Supersaturation Using ATR-FTIR to Produce an Active Pharmaceutical Ingredient of a Desired Crystal Size. Organic Process Research & Development, 8(3), 488 – 494. Copyright (2004) American Chemical Society
4. E.L. Paul, H. Tung, and M. Midler (2005) Organic Crystallization Processes. Powder Technology, 150, 133 – 143. http://doi.org/10.1016/j.powtec.2004.11.040
5. D. O’Grady, M. Barrett, E. Casey, and Ã, B. G. (2007) The Effect of Mixing on the Metastable Zone Width and Nucleation Kinetics in the Anti-solvent Crystallization of Benzoic Acid. Chemical Engineering Research and Design, 85, 945 – 952. http://doi.org/10.1205/cherd06207
6. E. Kougoulos, A.G. Jones, and M.W. Wood-Kaczmar (2005) Estimation of Crystallization Kinetics for an Organic Fine Chemical Using a Modified Continuous Cooling Mixed Suspension Mixed Product Removal (MSMPR) Crystallizer, Journal of Crystal Growth, Volume 273, Issues 3 – 4, 3 January 2005, Pages 520 – 528.
White Paper: Effective Crystallization Process Development – A Guide to Crystallization and PrecipitationThis white paper introduces the fundamentals of crystallization and presents guidelines for the design of a high quality crystallization process. Using case studies and references from industry and academia, key crystallization topics such as solubility, supersaturation and crystallization kinetics are explained. Examples of how to utilize solubility, supersaturation and crystallization kinetics to make informed decisions regarding effective crystallization process develop-ment are included.
Download the Free White Paper www.mt.com/wp-crystallization-pd
For more informationMettler-Toledo AutoChem, Inc.7075 Samuel Morse DriveColumbia, MD 21046 USATelephone +1 410 910 8500Fax +1 410 910 8600
Email [email protected] www.mt.com/autochem
Subject to technical changes© 07/2015 Mettler-Toledo AutoChem, Inc.
www.mt.com/crystallization