an assessment of deficiency payments to milk producers in japan
TRANSCRIPT
An Assessment of Deficiency Paymentsto Milk Producers in Japan
Nobuhiro Suzuki and D. H. Judson
This article represents an econometric assessment of the role that deficiency paymentshave played in developing the Japanese fluid and manufacturing milk markets and thepotential effects of reducing deficiency payments on these milk markets. Principalfindings are: (a) an historical simulation of the model without deficiency paymentsand import quotas indicates that these measures have reduced the variation in milkprices that would have otherwise occurred under this model, and price supportsthrough these measures have resulted in greater milk production than would haveaccrued without price supports; and (b) a reduction in deficiency payments beginningin 1988 results in a decrease in milk prices and manufacturing milk supply and anincrease in fluid milk supply and dairy imports, but fluid milk prices soon stopdeclining. The policy implications of such a decline in deficiency payments arediscussed.
Key words: deficiency payments, price supports, dairy supply, milk pricing.
The objective of this report is to quantitativelyanalyze two problems. The first is to determinethe role that deficiency payments to producersof milk for manufacturing into dairy productsplayed in developing the Japanese dairy in-dustry, analyzing the effect of payments overthe period 1966-87. The second is to assessthe effects of reducing the guaranteed milk priceon the Japanese dairy industry and milk mar-ket. A nonlinear simultaneous equations mod-el of the Japanese milk market was developedto analyze these policies.
The "temporary" law of deficiency pay-ments to producers of milk for manufacturingcame into being in 1966.1 This system wasdesigned to compensate farmers for the differ-
Nobuhiro Suzuki is a researcher at the National Research Instituteof Agricultural Economics, Japanese Ministry of Agriculture. D.H. Judson is a graduate student, Department of Sociology, Wash-ington State University.
The authors thank Raymond Jussaume and Ron Mittelhammerof Washington State University for their invaluable assistance inthe preparation of this article. Editorial comments by anonymousreviewers are gratefully acknowledged.
' The law has been in effect since 1966, although it is labeled"temporary." It is labeled "temporary" because it was supposedto be terminated if one of two scenarios developed. First, paymentswould stop if the bulk of the Japanese milk supply was sold asfluid milk, although a trigger for stopping payments was not set.The Japanese government originally thought that the growth ratein demand for fluid milk would be much higher than the available
ence between their guaranteed price and thetrade-basis manufacturer's purchase price. Theguaranteed price is set by the government basedon farm production costs, while the trade-basisor "standard" manufacturer's purchase priceis set by the government as the price payableto farmers for milk used for manufacture, basedon market prices of dairy products and man-ufacturers' processing and selling costs.
This law was not applied to milk sold fluidbut only to milk for manufacturing. The for-mer is little affected by overseas milk suppliesbecause of its perishability and the high unitcost of transportation. On the other hand, themanufacturer's payable price to farmers formilk used for manufacturing is affected by im-ports of overseas dairy products and is muchlower than farmers' production costs. There-fore, it was necessary for the Japanese govern-ment to compensate for this differential in or-der to encourage the development of the Jap-anese dairy industry. This guaranteed price en-couraged a sharp increase in milk production
supply. This means that most manufactured dairy products wouldhave been provided by imports. Second, payments would havebeen terminated when the improving productivity in Japanesedairy farming reduced the differential between the farmers' pro-duction costs and the manufacturer's price. However, neither ofthese situations has been realized.
Western Journal of Agricultural Economics, 16(1): 119-131Copyright 1991 Western Agricultural Economics Association
Western Journal of Agricultural Economics
in the Hokkaido prefecture. Over 80% of Hok-kaido milk production is used for manufac-turing. Moreover, it is important to recognizethat the high guaranteed price of milk for man-ufacturing has played a role in protecting milkproduction in Tofuken (areas of Japan otherthan Hokkaido) by keeping the bulk of Hok-kaido milk off ofthe fluid milk market.2 Nearly90% of Tofuken milk production is used forfluid purposes (e.g., drinking and cooking).
Deficiency payments to dairy farmers haveplayed an important role in developing Japa-nese dairy farming. This policy and relatedmeasures to develop large-scale dairy farms inJapan enabled the average scale of Japanesedairy farms to equal those in the EuropeanEconomic Community. However, under therecent situation of increasing production ca-pacity and stagnant milk demand, the main-tenance of a high guaranteed price is contrib-uting to a chronic milk surplus.3 Someresearchers say that the main reason for thepersistent milk surplus is the increase in thenumber of large-scale, full-time farmers (Ka-jii). Indeed, such farmers intend to maintainmilk production levels even if the milk priceis reduced, because they have no income sourceother than milk sales and their fixed costs anddebts are extremely high. However, even large-scale farmers must reduce their production ifmilk prices decline substantially. This view-point, which emphasizes the effects of an in-creasing production capacity, overlooks the ef-fects of the rigid guaranteed price.
Moreover, the rigidity of the guaranteed pricein Japan, together with the high appreciationof the yen and low prices of overseas dairyproducts, is enlarging the differences betweendomestic and foreign dairy product prices.
Producers' cooperatives have been makingefforts to regulate supplies by installing theirown supply management programs through theuse of production quotas. This was in responseto payment quotas which were introduced in1979 in order to reduce the cost of the program
2 If fluid milk prices in Tofuken are equal to the guaranteed priceplus the transportation costs from Hokkaido to Tofuken, Hok-kaido will not send its milk to Tofuken as long as the manufacturingmilk supply in Hokkaido is within payment quotas.
3 By "surplus" we mean large stockpiles of dairy products. Forexample, the dairy product stocks in 1979 enlarged five times asmuch as those in 1975. After 1979 producers' cooperatives in-stalled their own production quotas in response to government-introduced payment quotas. The reduced production should alsobe considered milk surplus.
to government. A policy of production quotascan bring short-term benefits to sellers of com-modities with inelastic demands. Kaiser,Streeter, and Liu demonstrated that farmersare better off under a voluntary supply controlprogram. As mentioned by some researchers,the drawback would be that imposing rigid andequal quotas for each farm will prevent largerfarms from realizing scale economies, and ad-ministrative costs for the policy are large (Oh-tsuka). As long as the rigidity of guaranteedprices contributes to milk surpluses, one of thepossible policy options is to reduce guaranteedprices gradually in order to make milk pricesreflect market conditions.
The Japanese government reduced the guar-anteed price in 1986, 1987, and 1988 in orderto reduce the government's financial burdenand to reduce the differential between domes-tic and foreign milk price. From the viewpointof reducing milk surpluses, however, it was nota reduction in real terms because milk pro-duction costs declined much more due mainlyto a reduction in imported mixed feed prices.
Theoretical Background
Several econometric models of the Japanesemilk market have been developed (Ohtsuka;Matsubara; Ministry of Agriculture, Forestry,and Fisheries; Yuize). In all of them fluid milkprices are thought to be determined in part bythe monopolistic power of milk marketingboards with fluid milk demand being deter-mined by a set price and the supply of milkused in manufacturing considered to be a re-sidual after the fluid milk demand is subtractedfrom the total milk supply, with no relation tothe guaranteed price for milk used in manu-facturing. Such a modeling procedure over-looks the fact that there is competition be-tween producers in Hokkaido and the rest ofJapan (known as the "Civil War"). By neglect-ing the relationship between Hokkaido and therest of Japan and considering manufacturingmilk supply to be a mere residual with no re-lation to the guaranteed price, these modelsmay not effectively estimate the effects of theguaranteed price reduction.
The Japanese milk marketing boards do nothave monopolistic power like the England andWales Milk Marketing Board (EWMMB). In-deed, EWMMB adopts a high price for fluidmilk in order to maximize total revenue under
120 July 1991

Deficiency Payments to Milk Producers in Japan 121
the assumption that the price elasticity for fluidmilk demand is smaller than that for manu-factured milk demand. The theory of price dis-crimination cannot be applied to the wholeJapanese milk market (as in the case of theEWMMB) because the Japanese milk market-ing board 4 is independent in each prefectureand there is no national milk marketing board.Therefore, considering the competition be-tween Hokkaido and Tofuken in the Japanesemilk market, it is assumed in the current mod-el that the ratio of manufactured milk to totalsupply is determined by the relative price ofmanufactured milk to fluid milk. Given a cer-tain guaranteed price for milk used in manu-facturing, fluid milk demand, supply, price,and manufactured milk supply are determinedsimultaneously. This system will allow simu-lation of the effects of guaranteed price reduc-tion.
Structure of the Model
This model consists of 36 behavioral equa-tions, where there are 15 structural equationsand 21 definitional identities, as given in tables1 and 2.
Most of the structural equations are speci-fied in double logarithmic form with constantelasticities and estimated by the Ordinary LeastSquares (OLS) method.5 The observation pe-riod spans the fiscal years 1966-87. It is as-sumed that the structure of the Japanese milkmarket remained relatively stable for 22 yearsafter the introduction of deficiency payments.This assumption is somewhat tenuous, butthere is supporting statistical evidence in thatall of the computed equations have high coef-ficients of determination as well as generallyacceptable Durbin-Watson d statistics or Dur-bin's h statistics.
Figure 1 represents a simplified flow chartof this model. Milk production is determinedby a lagged weighted average price for bothfluid and manufactured milk. How much milkis destined for each end use is determined by
4 The milk marketing board in each prefecture is the designatedproducers' cooperative which gathers almost all of the milk pro-duced in the prefecture, sells it, and pays each producer a weightedaverage price (or blend price) for both fluid and manufacturedmilk.
5 The application of nonlinear simultaneous estimation methodsdoes not provide significantly different results and takes muchmore time to compute. Hence, we present the OLS results.
the relative price of fluid and manufacturedmilk. Demand for fluid milk is determined byfluid milk price, and fluid milk price is deter-mined at a market clearing level. That is, quan-tity demanded or supplied for fluid milk andfluid milk price are solved simultaneously. De-mand for manufactured milk is determined byboth the standard purchase price of manufac-turers and the imported dairy product priceconverted into raw milk equivalents. Since do-mestic manufacturing supply, including thedecrease in dairy product stocks sent into themarket, cannot satisfy the demand for man-ufactured milk, the shortfall is imported. Inthis model, dairy import prices and dairy prod-uct stocks are considered as exogenous vari-ables.
That is, the basic structure of the model isexplained by following equations (a) through(h):
(a) Milk supply = fi (Blend price),(b) Manufacturing milk supply =f2 (Fluid milk
price, Guaranteed price),(c) Fluid milk supply = Milk supply - Man-
ufacturing milk supply,(d) Fluid milk demand = f (Fluid milk price),(e) Fluid milk demand = Fluid milk supply,(f) Manufacturing milk demand = f4 (Stan-
dard purchase price, Dairy import price)(g) Dairy imports = Manufacturing milk de-
mand - Manufacturing milk supply - De-crease in stocks, and
(h) Blendprice = [Fluid milk supply*Fluid milkprice + Payment quota Guaranteed price+ (Manufacturing milk supply - Paymentquota)* Standard purchase price]/Milksupply.
Boldface variables are the exogenous vari-ables in this system. Equation (e) determinesfluid milk price. This system can be solvedbecause there are eight endogenous variablesand eight equations.
Equations (1)-(4) (table 1) represent the re-production cycle of milk cows. Equations (1)and (2) determine the number of adult dairycattle (ABT, ABH) which are two years old andolder. The sum of the price parameters is near-ly zero [.26 - .19 - .09 in equation (1) and.16 - .07 - .07 in equation (2)], which meansthat these equations are approximately zero-order homogeneous expressions with respectto prices. Dairy beef price (MBMP) is consid-ered as an opportunity cost of an animal inmilk production. Half of two-period-lagged
Suzuki and Judson

Western Journal of Agricultural Economics
guaranteed price for iI... _ to _- _ . - _, _- 1 __ !1 1_ il
Note: - means an endogenous variable and [ means an exogenous variable.
Figure 1. Basic structure of the milk market model-simplified flow chart
milk cow numbers (MBTt_2/2, MBHt_2/2)represents the number of female calves whichwere born two years ago. This variable andlagged dependent variables (ABTt_, ABHt-,)are added in order to avoid multicollinearityproblems.
DY72 is one of the livestock industry crisisindicators. During the years 1972-74, farmerswere anxious about a sharp rise in feed pricesand slaughtered excess numbers of cows.DY7274 takes on the value one in the years1972-74 and zero in other years. DY8687 isone of the production quota indicator vari-ables. Production quotas have been in effectsince 1979. During the years 1979-85, thesequotas were gradually enlarged each year.
However, in 1986-87, the quotas were set lessthan the previous years. In this model, effectsof production quotas are measured by intro-ducing these indicator variables. 6 Clearly, thequota does not have the same effect in everyyear. Therefore, many combinations of peri-ods were tried and only periods for which es-timated effects were significantly different fromzero were chosen. As a result, DY79, DY80,DY81, DY82, DY8085, DY86, DY87, andDY8687 are used in this model.
6 An alternative method would be to take the quotas as given.However, in that case, we would need to use only the years before1979 to estimate price elasticities of milk production.
122 July 1991

Deficiency Payments to Milk Producers in Japan 123
Equations (3) and (4) determine the numberof milking cows (MBT, MBH). The numberof milking cows is given as a stable ratio of thenumber of adult dairy cattle (ABT, ABH) forseveral years.
The sign of each parameter of(1)-(2) is con-sistent with the a priori expectations. That is,a rise in the average milk price received byfarmers brings an increase in cow numbers,7 arise in feed prices brings a decrease in cownumbers, and a rise in dairy beef carcass pricesbrings a decrease in cow numbers due to anincrease in cow slaughter. Supply response inboth regions is very inelastic and Hokkaidoparameters are smaller than those for Tofuken.This may reflect the fact that the reactions toprice change by large-scale, full-time farmers,which predominate in Hokkaido, are rigid duemainly to fixed cost effects.
In (5) and (6), milk production per cow isdetermined by cow numbers, mixed feed prices,and time trends. As a decrease in cow numbersmeans a decrease in the number of low-pro-ducing cows through slaughter, an increase inmilk production per cow results. A decline inmixed feed prices also brings an increase inmilk production per cow because more mixedfeeds are given to cows. As a proxy for tech-nological advancements in milk production percow, we use a time-trend variable. In this equa-tion, a semilog function is adopted because itis assumed that future technological advance-ments will decline because of the biologicallimits of cows. However, it might not declinein the short run. Technological advance willdepend in part on improvements in fertiliza-tion and other technology.
Milk production is calculated by multiplyingcow numbers by milk production per cow, asin (11) and (12).
Equations (13) and (14) show milk quantityfor farmers' own use, for nursing calves andother uses. This quantity has been only ap-proximately 2% of total milk production. Milksupply is calculated by subtracting this quan-tity from milk production, as in (15) and (16).
Milk supply is divided into fluid milk supplyand milk supply for manufacturing. How muchmilk farmers will divert to each use is deter-mined by the relative price between fluid andmanufactured milk, as in (18)-(21).
7 Decreasing cow numbers through slaughter takes less time thanincreasing them. That is, the effects of price decline and rise arenot symmetric. Further research should be done in order to realizethis asymmetry in the model.
Fluid milk demand is determined by (24).This is not final consumers' demand but pro-cessors' derived demand. Explanatory vari-ables are milk price, consumption expendi-ture, temperature, and the ratio of persons 0-14 years old to total population. In Japan, itis said that people drink more milk when it iswarm, in the same fashion as people in theU.S. drink greater quantities of soda pop.
Equation (25) indicates the milk marketequilibrium condition, wherein fluid milk priceis determined at a market clearing level andwhere demand and supply for fluid milk areequal. In model simulations, this equilibriumprice is found by means of the Gauss-Seidelsolution technique.
Manufactured milk demand is determinedby (27). This demand includes domestic man-ufacturing supply, imported dairy productsconverted into raw milk equivalents, and adecrease in dairy product stocks. Therefore,explanatory price variables include both stan-dard purchase prices for domestic manufac-tured milk and imported dairy product pricesrepresented by natural cheese prices includingthe tariff converted into raw milk equivalents.Equation (27) also includes an income vari-able, proxied by private consumption expen-ditures.
Equation (31) shows the relationship be-tween average prices received by farmers inTofuken and those in Hokkaido. For the past22 years, Hokkaido's price has been approxi-mately 17% lower than Tofuken's price. In (31)it is assumed that transportation costs are de-termined at a rate proportional to milk prices.This assumption may not be valid when ap-plied to cases where milk prices decline sig-nificantly.
The model was estimated using MICROAGNESS, which is a computer package pro-gram for econometric analysis developed byInaba.
Case I: Comparison of the Modelwith Historical Data
Table 3 indicates the results of testing thismodel against historical data. In the test, giventhe exogenous variables, values for endoge-nous variables are determined in a fully dy-namic simulation by means of the Gauss-Sei-del solution technique for the estimation period1966-87.
Suzuki and Judson

Western Journal of Agricultural Economics
Table 1. Equations of the Milk Market Model
*(1) ln(ABT) = 2.40 + .26-1n(FPT)- .19*ln(MFI)- .09-ln(MBMP)(3.9) (3.2) (-2.5) (-1.9)+ .67*ln(ABT,_1 + MBT,_2/2) - .06*DY72 - .08*DY8687(6.9) (-1.9) (3.1)
R2= .92 R2 adjusted = .88 D.W. = 1.83
*(2) ln(ABH) = 1.00 + .16-n(FPH) - .07*ln(MFI) - .07-1n(MBMP)(4.8) (2.3) (- 1.1) (-1.8)+ .82*ln(ABH, _ + MBH,_2/2) - .06*DY72 - .04*DY8687(14.0) (-2.1) (-1.4)
R2 = .99 R2 adjusted = .99 D.W. = 2.25
*(3) MBT= .77*ABT(420.0)
R2= .99 R2 adjusted = .99 D.W. = .72
*(4) MBH=.69-ABH(228.2)
R2= .99 R2 adjusted = .99 D.W. = .55
*(5) AMSFT =-7.62 - 1.18ln(AMBT)- 1.52-1n(MFI/WPIF) + 4.90*ln(TR)(-4.8) (-3.1) (-6.6) (10.2)
R2= .97 R2 adjusted = .97 D.W. = 1.55
*(6) AMSFH = -38.93 - .74-ln(AMBH) - 1.55- n(MFI/WPIF) + 11.38*ln(TR)(-9.0) (-1.4) (-3.7) (7.0)
R2= .98 R2 adjusted = .98 D.W. = 1.32
*(7) AAMBT= 16.11/(1 + 8.50*e--'7 TR)
(52.8) (55.5) (-49.3)R2
= .999 R2 adjusted = .999 D.W. = .83
*(8) AAMBH = 26.67/(1 + 5.80*e- -16
'TR)
(63.9) (62.9) (-50.0)R2
= .999 R2 adjusted = .999 D.W. = .71
(9) AFNT = AMBT/AAMBT
(10) AFNH = AMBH/AAMBH
(11) MSFT = AMBT*AMSFT
(12) MSFH= AMBH*AMSFH
*(13) ln(FOFT) =.46 + .66*ln(AFNT) + .13*ln(ST) + .15*DY79 + .21*DY8085(2.4) (29.7) (6.6) (4.2) (9.0)+ .58*DY8687
(18.4)R2 = .99 R2 adjusted = .99 D.W. = 2.04
*(14) In(FOFH)= 1.01 + .31*ln(AFNH) + .29*ln(ST) + .56*DY80 + .71*DY81(1.0) (2.1) (3.0) (3.9) (5.1)+ .35*DY82 + .69*DY86 + .88*DY87
(2.6) (4.8) (5.7)R2
= .90 R2 adjusted = .84 D.W. = 2.06
(15) MSRFT = MSFT - FOFT
(16) MSRFH = MSFH - FOFH
(17) MSRF = MSRFT + MSRFH
*(18) ln(FDFH) = .98 + .63*ln(PP/WPIF) - .46*1n(WMPT/WPIF)(5.3) (2.8) (-2.3)
+ .89*ln(FDFH,_ )(35.7)
R2= .99 R2 adjusted = .98 D.W. = 1.47 h-statistic = 1.05
(19) FMFH = MSRFH - FDFH
*(20) ln(FDFT) = 1.16 + 1.93*1n(PP/WPIF) - 1.40*1n(WMPT/WPIF) + .88*ln(FDFT,_l)(1.5) (4.2) (-3.7) (7.2)
- .23*DY75 - .28*DY8687(-2.8) (-4.7)
R2= .85 R2 adjusted = .81 D.W. = 2.65 h-statistic = -1.93
124 July 1991

Deficiency Payments to Milk Producers in Japan 125
Table 1. Continued
(21) FMFT = MSRFT - FDFT
(22) FMF = FMFT + FMFH
(23) FDF = FDFT + FDFH
*(24) ln(DFMFNF) = .61 - .19ln(WMPTH/WPIF) + 901n(CF/NF) + .001ANN(3.0) (-4.7) (33.8) (1.4)+ 2.38*NR014 - .07*DY7274
(4.7) (-7.0)
R2 = .995 R2 adjusted = .994 D.W. = 2.10
(25) WMPTH = WMPTH-DFMF/(MSRF - FDF)
(26) WMPT = (WMPTH-FMF - (FPH-MSRFH - ADMH-PP - (FDFH - ADMH)-SP))/FMFT
*(27) ln(FDIMNF) = 1.82 - .24*n(SP/WPIF) - .251n(CMPT/WPIF) + .51 ln(CF/NF)(21.7) (-2.2) (-3.4) (9.5)
R2 = .96 R2 adjusted = .95 D.W. = 1.21
(28) DPIM = FDIM- (FDF + ST,_ - ST)
(29) FP = (FMF- WMPTH + ADM-PP + (FDF - ADM)-SP)/MSRF
(30) FPT = (FMFT- WMPT + ADMT-PP + (FDFT - ADMT)-SP)/MSRFT
*(31) FPH= .83FPT(147.2)
(32)(33)
(34)(35)
(36)
R2 = .99 R2 adjusted = .99
GV- (PP - SP)-ADM
FDIM = FDIMNF*NF/1,000
DFMF = DFMFNF*NF/1,000
AMBT = (MBT + MBT,_ )/2
AMBH = (MBH + MBH,_,)/2
D.W. = .69
Note: Numbers in parentheses are t-statistics. R2 is the coefficient of determination. R2 adjusted is the coefficient of determinationadjusted for the number of parameters estimated. D.W. is the Durbin-Watson d-statistic for auto correlation. * indicates structuralequation, while others are definitional identities.
The results indicate that the dynamic prop-erties of this model are reasonably good. Inparticular, the fact that all performance indi-cators of fluid milk price are favorable sup-ports the assumption that fluid milk price isdetermined as a market equilibrium price.However, in the cases of Hokkaido's fluid milksupply and dairy product imports, the meanabsolute percent error is large and Theil'sU-statistic is over one. This is because the twovariables are calculated as residuals of the totalvalues by definitional equations and their per-centages to total Hokkaido milk supply andtotal manufactured milk demand have beenrather small in past years.
Case II: No Deficiency Payments andNo Import Quotas
After FY 1966, if there had been no deficiencypayments and no import quotas, what wouldhave happened in the Japanese milk market?We simulate such a situation by adding two
equations, PP = SP and SP = CMPT, into thismodel and eliminating the production quotaindicator variables, where PP = guaranteedprice, SP = standard purchase price, andCMPT = imported dairy product price con-verted into raw milk equivalents as represent-ed by the imported natural cheese price in-cluding the tariff. In the last two years (1986,1987), CMPT was less than half of SP. Thismeans there is a large differential between do-mestic and overseas milk prices, but in FY1982, CMPT was about 80% of SP. Thus,CMPT is fluctuating widely due to changes inboth international dairy product prices and ex-change rates.
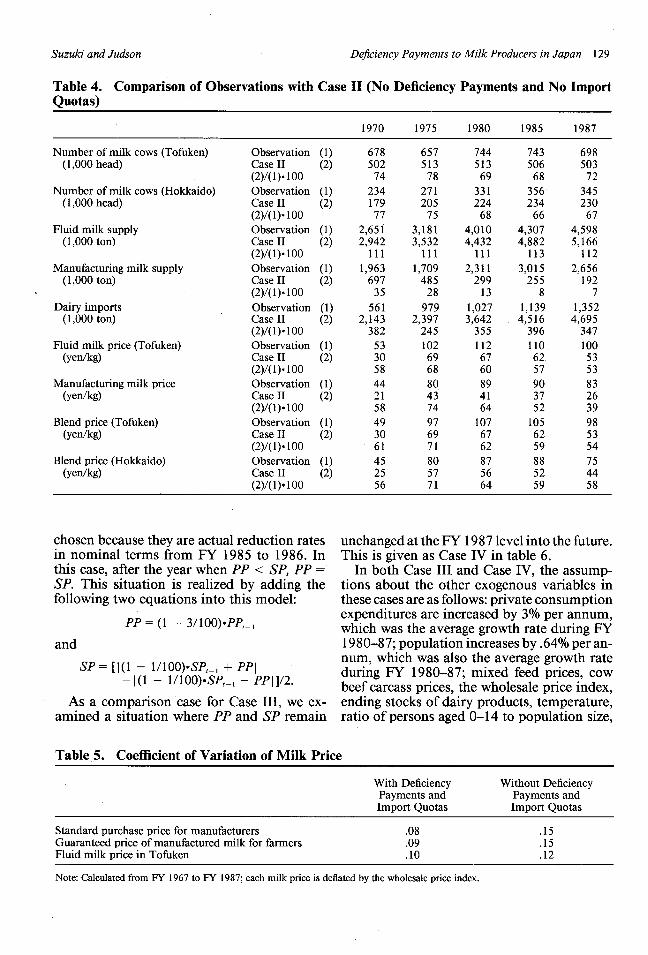
Results of this historical simulation were re-markable and are shown as Case II in table 4.Price supports through deficiency paymentsand import quotas have been keeping Japanesemilk cow numbers larger than would occurwithout price supports by at least 20-30%(compare the observations with Case II valuesof table 4). The expression "at least" is usedfor two reasons. First, as previously men-
Suzuki and Judson

Western Journal of Agricultural Economics
Table 2. Variables of the Milk Market Model
SymbolicNames Definitions
AAMBH Number of milk cows per farm(Hokkaido)
AAMBT Number of milk cows per farm(Tofuken)
ABH Number of dairy cattle two yearsold and over (Hokkaido)
ABT Number of dairy cattle two yearsold and over (Tofuken)
ADM* Volumes for which deficiencypayments were provided (allJapan)
ADMH* Volumes for which deficiencypayments were provided (Hok-kaido)
ADMT* Volumes for which deficiencypayments were provided (Tofu-ken)
AFNH Average number of dairy farms(Hokkaido)
AFNT ' Average number of dairy farms(Tofuken)
AMBH Average number of milk cows(Hokkaido)
AMBT Average number of milk cows(Tofuken)
AMSFH Milk production per cow (Hok-kaido)
AMSFT Milk production per cow (Tofu-ken)
ANN* Averate temperature (Tokyo)CF* Total private consumption ex-
penditures (in CY 1980 price)
CMPT* Imported natural cheese price in-cluding tariff converted intoraw milk equivalents
DFMF Fluid milk demandDFMFNF Fluid milk demand per capitaDPIM Dairy imports converted into raw
milk equivalentsDY7274* Livestock industry crisis panic
indicatorDY8687* Production quota indicator
FDF Manufactured milk supply (allJapan)
FDFH Manufactured milk supply (Hok-kaido)
FDFT Manufactured milk supply (Tofu-ken)
FDIM Manufactured milk demandFDIMNF Manufactured milk demand per
capitaFMF Fluid milk supply (all Japan)
FMFH Fluid milk supply (Hokkaido)
FMFT Fluid milk supply (Tofuken)
FNH Number of dairy farms (Hokkai-do)
TimePeriod
FY
FY
Feb. 1
Feb. 1
FY
Unit
head/farm
head/farm
1,000 head
1,000 head
1,000 ton
FY 1,000 ton
FY
FY
FY
FY
FY
FY
FY
CYFY
CY
FYFYFY
FY
FY
FY
FY
FY
FYFY
FY
FY
FY
FY
1,000 ton
1,000 farm
1,000 farm
1,000 head
1,000 head
ton/head
ton/head
0.1°C0.1 billion yen
yen/kg
1,000 tonkg/person1,000 ton
72-74 = 1other = 086-87= 1other = 0
1,000 ton
1,000 ton
1,000 ton
1,000 tonkg/person
1,000 ton
1,000 ton
1,000 ton
Source
AMBH/AFNH
AMBT/AFNT
Livestock Statistics, MAFF
Livestock Statistics, MAFF
Milk and Milk Products Statistics,MAFF
Milk and Milk Products Statistics,MAFF
Milk and Milk Products Statistics,MAFF
(FNH,_, + FNH)/2
(FNTt_, + FNT)/2
(MBHt_ + MBH)/2
(MBT,_, + MBT)/2
MSFH/AMBH
MSFT/AMBT
Meteorological AgencyAnnual Report on National Ac-
counts, Economic PlanningAgency
CIF price*1.35/13.43 from JapanExports and Imports, Ministry ofFinance
Food Balance Sheet, MAFFDFMF/NF- 1,000Food Balance Sheet, MAFF
DY72, DY75 are similar
DY79, DY80, DY81, DY82,DY8085, DY86, DY87 are simi-lar
Milk and Milk Products Statistics,MAFF
Milk and Milk Products Statistics,MAFF
Milk and Milk Products Statistics,MAFF
Food Balance Sheet, MAFFFDIM/NF- 1,000
Milk and Milk Products Statistics,MAFF
Milk and Milk Products Statistics,MAFF
Milk and Milk Products Statistics,MAFF
1,000 farm Livestock Statistics, MAFF
.
126 July 1991
Deficiency Payments to Milk Producers in Japan 127
ontinued
Definitions
Number of dairy farms (Tofuken)Milk quantity for farmers' own
use, for nursing calves and oth-ers (Hokkaido)
Milk quantity for farmers' ownuse, for nursing calves and oth-ers (Tofuken)
Average price received by farm-ers (all Japan)
Average price received by farm-ers (Hokkaido)
Average price received by farm-ers (Tofuken)
Amount of deficiency paymentsNumber of milk cows (Hokkai-
do)Number of milk cows (Tofuken)Wholesale milk cow beef carcass
price at Shibaura market (aver-age of all grades)
Price indices of compound con-centrated feed for cattle
Milk production (Hokkaido)
Milk production (Tofuken)
Milk supply (all Japan)
Milk supply (Hokkaido)
Milk supply (Tofuken)
Average population
Ratio of persons aged 0-14 to to-tal population size
Manufactured milk guaranteedprice for farmers
Standard purchase price for man-ufacturers
Ending stocks of dairy productsconverted into raw milk equiv-alents
Time trend
Fluid milk price (Tofuken)
Fluid milk price (all Japan)
Wholesale price indices (all com-modities)
TimePeriod
FYFY
FY
FY
FY
FY
FYFeb.
Feb.CY
FY
FY
FY
FY
FY
FY
FY
Oct. 1
FY
FY
FY
FY
FY
FY
FY
Unit
1,000 farm1,000 ton
1,000 ton
yen/kg
yen/kg
yen/kg
million yen1,000 head
1,000 headyen/kg
1985 = 100
1,000 ton
1,000 ton
1,000 ton
1,000 ton
1,000 ton
1,000 persons
total = 1
yen/kg
yen/kg
1,000 ton
FY
yen/kg
yen/kg
1985 = 100
Source
Livestock Statistics, MAFFMilk and Milk Products Statistics,
MAFF
Milk and Milk Products Statistics,MAFF
Statistics of Prices and Wages inRural Area, MAFF
Statistics of Prices and Wages inRural Area, MAFF
(FP-MSRF - FPH-MSRFH)/MSRFT
(PP - SP).ADMLivestock Statistics, MAFF
Livestock Statistics, MAFFMeat Marketing Statistics, MAFF
Statistics of Prices and Wages inRural Area, MAFF
Milk and Milk Products Statistics,MAFF
Milk and Milk Products Statistics,MAFF
Milk and Milk Products Statistics,MAFF
Milk and Milk Products Statistics,MAFF
Milk and Milk Products Statistics,MAFF
Annual Report on National Ac-counts, Economic PlanningAgency
Japan Statistical Yearbook
Milk and Milk Products Statistics,MAFF
Milk and Milk Products Statistics,MAFF
Estimated from Food BalanceSheet, etc.
FY-1900 (for example, 70 meansFY 1970)
(FPT.MSRFT - ADMT-PP -(FDFT - ADMT)-SP)/FMFT
(FP.MSRF - ADM.PP - (FDF -ADM).SP)/FMF
Wholesale Price Indices, The Bankof Japan
Note: * means an exogenous variable in the model; MAFF = Ministry of Agriculture, Forestry, and Fisheries.
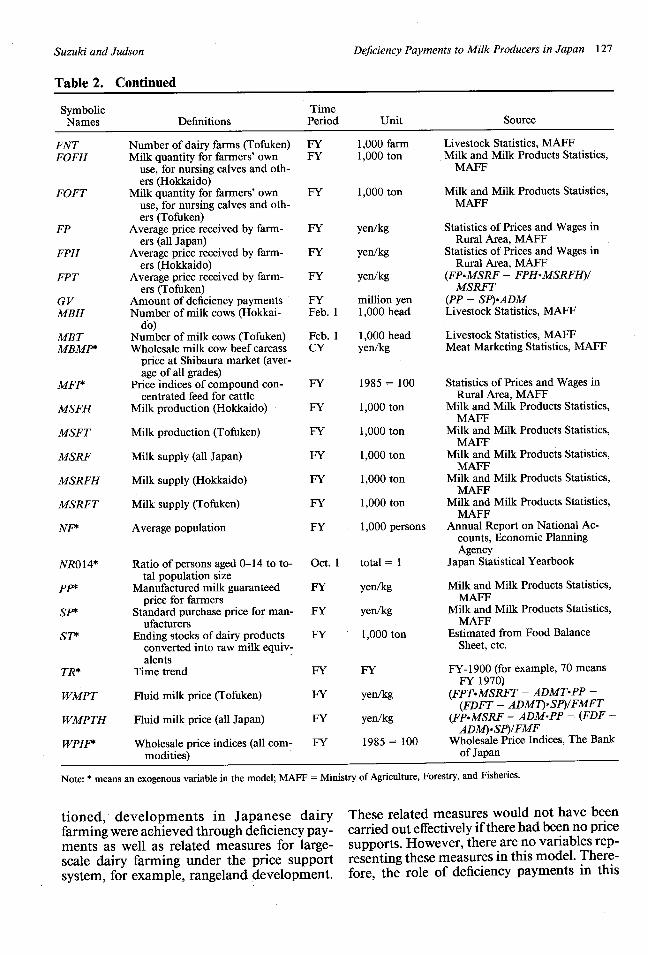
tioned, developments in Japanese dairy These related measures would not have beenfarming were achieved through deficiency pay- carred out effectively if there had been no pricements as well as related measures for large- supports. However, there are no variables rep-scale dairy farming under the price support resenting these measures in this model. There-system, for example, rangeland development. fore, the role of deficiency payments in this
Table 2. C
SymbolicNames
FNTFOFH
FOFT
FP
FPH
FPT
GVMBH
MBTMBMP*
MFI*
MSFH
MSFT
MSRF
MSRFH
MSRFT
NF*
NRO14*
PP*
SP*
ST*
TR*
WMPT
WMPTH
WPIF*
-.
Suzuki and Judson
1

Western Journal ofAgricultural Economics
Table 3. Final Test of the Model
Turn- Turn-Mean ing ingAbso- Theil's Point Point
Endogenous lute % U-Sta- Error ErrorVariables Error tistic 1 2
(1) ABT(2) ABH(3) MBT(4) MBH(5) AMSFT(6) AMSFH(7) AAMBT(8) AAMBH(9) AFNT
(10) AFNH(11) MSFT(12) MSFH(13) FOFT(14) FOFH(15) MSRFT(16) MSRFH(17) MSRF(18) FDFH(19) FMFH(20) FDFT(21) FMFT(22) FMF(23) FDF(24) DFMFNF(25) WMPTH(26) WMPT(27) FDIMNF(28) DPIM(29) FP(30) FPT(31) FPH(32) GV(33) FDIM(34) DFMF(35) AMBT(36) AMBH
1.901.851.971.970.921.531.081.201.911.682.052.502.357.072.082.621.803.64
25.506.392.031.124.721.122.902.262.87
12.361.861.853.190.002.871.121.801.88
0.57840.36230.52180.33880.76190.69700.16220.13000.20460.29650.47800.35410.31090.67610.47010.35640.40840.50851.37860.56340.43870.44990.56350.55630.62080.43960.92731.57550.42590.38550.57900.00000.80370.45010.35700.2640
33.330.00
33.330.006.25
21.050.000.00(a)(a)
20.005.00
40.0027.2713.335.00
10.5321.0525.0041.67
0.005.00
31.2511.1123.0823.08
6.6730.0015.3815.3815.380.00
11.765.00
18.180.00
20.000.00
33.335.566.256.250.000.00(a)(a)
25.000.00
40.0027.2713.530.000.006.25
20.0012.505.000.000.005.88
23.0823.0817.6546.1515.3821.4321.43
0.0011.760.00
30.770.00
Note: (a) means that there are no turning points in both observedand simulated values. Mean absolute percent error is defined as 2I(Y, - YY,)/l/n*100 and Theil's U-statistic is defined as [2 {(Yf- Y_,I)/IY_- -(Y- Y,_,)/Y,_)2/ {(Y, - Ytl)/Y,,}2]1/2, whereYt = solution value and Y, = actual value. Turning point percenterror 1 is the percentage of values which are turning points in thesimulation, while their observed values are nonturning points. Onthe other hand, turning point percent error 2 is the percentage ofvalues which are nonturning points in the simulation, while theirobserved values are turning points. Our definition of Theil'sU-statistic is based on Inaba.
model considers only direct effects throughprice supports and does not consider indirecteffects through related measures. 8
A second reason why the model may be un-derestimating the effect of price supports is the
8 The indirect effects of related measures are being captured, inpart, by the price support variables.
assumption that fluid milk prices are not af-fected by overseas fluid milk prices. Under asituation of no import quotas, not only dairyproducts such as butter and skim milk powderbut also much cheaper Long-Life Milk (LLMilk) may be imported. In such cases, im-ported LL Milk may gain some market sharein Japan. This is a factor which can lead to adecline in domestic fluid milk prices. More-over, a decline in prices for various milk bev-erages (including chocolate milk) due to cheap-er skim milk powder imports may also havesome influence on fluid milk because variousmilk beverages have some substitutability.These downward pressures on fluid milk pricesunder a no import quota scenario are not takeninto account in this model.
Without deficiency payments and importquotas, domestic manufacturing milk supplywould have almost vanished and dairy importswould have increased by a factor of three tofour. Japanese dairy farmers would have sur-vived depending on the fluid market alone.Fluid milk supply would have increased byabout 10%, and fluid milk price would havedeclined by 30-50%.
As shown in table 5, the coefficients of vari-ation of milk prices without price supports arelarger than those with price supports. This iscaused by the fact that price elasticities in bothsupply and demand are small, and importeddairy product prices have a rather large fluc-tuation.
Case III and Case IV: ReducingGuaranteed Price by 3% Annually andReducing Standard Purchase Price by1% Annually versus MaintainingFY 1987 Levels of Price Supports
If the guaranteed price had been reduced grad-ually after FY 1988, what changes would haveoccurred in the Japanese milk market? CaseIII is the situation wherein every year after FY1988 the guaranteed price (PP) is reduced by3% and the standard purchase price (SP) isreduced by 1%.9 These reduction rates were
9 An alternative case, in which the guaranteed price is reducedby 6% annually and the standard purchase price is reduced 3%annually, was also considered. The differences between this alter-native and Case III were only a matter of degree; average pricesin Hokkaido and Tofuken dipped lower around FY 1989-2005,but eventually converged to the same level. Other results weresimilar.
128 July 1991
Deficiency Payments to Milk Producers in Japan 129
Table 4. Comparison of Observations with Case II (No Deficiency Payments and No ImportQuotas)
1970 1975 1980 1985 1987
Number of milk cows (Tofuken) Observation (1) 678 657 744 743 698(1,000 head) Case II (2) 502 513 513 506 503
(2)/(1)*100 74 78 69 68 72Number of milk cows (Hokkaido) Observation (1) 234 271 331 356 345
(1,000 head) Case II (2) 179 205 224 234 230(2)/(1) 100 77 75 68 66 67
Fluid milk supply Observation (1) 2,651 3,181 4,010 4,307 4,598(1,000 ton) Case II (2) 2,942 3,532 4,432 4,882 5,166
(2)/(1)* 100 111 111 111 113 112Manufacturing milk supply Observation (1) 1,963 1,709 2,311 3,015 2,656
(1,000 ton) Case II (2) 697 485 299 255 192(2)/(1).100 35 28 13 8 7
Dairy imports Observation (1) 561 979 1,027 1,139 1,352(1,000 ton) Case II (2) 2,143 2,397 3,642 4,516 4,695
(2)/(1) 100 382 245 355 396 347Fluid milk price (Tofuken) Observation (1) 53 102 112 110 100
(yen/kg) Case II (2) 30 69 67 62 53(2)/(1) 100 58 68 60 57 53
Manufacturing milk price Observation (1) 44 80 89 90 83(yen/kg) Case II (2) 21 43 41 37 26
(2)/(1) 100 58 74 64 52 39Blend price (Tofuken) Observation (1) 49 97 107 105 98
(yen/kg) Case II (2) 30 69 67 62 53(2)/(1)*100 61 71 62 59 54
Blend price (Hokkaido) Observation (1) 45 80 87 88 75(yen/kg) Case II (2) 25 57 56 52 44
(2)/(1) 100 56 71 64 59 58
chosen because they are actual reduction rates unchanged at the FY 1987 level into the future.in nominal terms from FY 1985 to 1986. In This is given as Case IV in table 6.this case, after the year when PP < SP, PP = In both Case III and Case IV, the assump-SP. This situation is realized by adding the tions about the other exogenous variables infollowing two equations into this model: these cases are as follows: private consumption
expenditures are increased by 3% per annum,PP = (1 - 3/100)*PP_,- which was the average growth rate during FY
and 1980-87; population increases by .64% per an-num, which was also the average growth rate
SP = [I1(1 - 1/100)sP t I + P PII ]2during FY 1980-87; mixed feed prices, cowI-(1 -l/l00)SP,1 - PP|1/2. beef carcass prices, the wholesale price index,
As a comparison case for Case III, we ex- ending stocks of dairy products, temperature,amined a situation where PP and SP remain ratio of persons aged 0-14 to population size,
Table 5. Coefficient of Variation of Milk Price
With Deficiency Without DeficiencyPayments and Payments andImport Quotas Import Quotas
Standard purchase price for manufacturers .08 .15Guaranteed price of manufactured milk for farmers .09 .15Fluid milk price in Tofuken .10 .12
Note: Calculated from FY 1967 to FY 1987; each milk price is deflated by the wholesale price index.
Suzuki and Judson

Western Journal of Agricultural Economics
Table 6. Comparison of Case III with Case IV
1990 1995 1997 2001 2005
Number of milk cows (Tofuken) Case IV (1) 770 819 830 845 859(1,000) head) Case III (2) 748 735 721 699 696
(2)/(1)*100 97 90 87 83 81Number of milk cows (Hokkaido) Case IV (1) 360 382 389 399 409
(1,000 head) Case III (2) 353 350 345 334 330(2)/(1)*100 98 92 89 84 81
Fluid milk supply Case IV (1) 4,904 5,571 5,869 6,515 7,228(1,000 ton) Case III (2) 4,971 5,783 6,138 6,881 7,655
(2)/(1) 100 101 104 105 106 106Manufacturing milk supply Case IV (1) 3,112 3,374 3,370 3,258 3,056
(1,000 ton) Case III (2) 2,912 2,468 2,150 1,477 894(2)/(1) 100 94 73 64 45 29
Dairy imports Case IV (1) 1,327 1,484 1,667 2,155 2,761(1,000 ton) Case III (2) 1,559 2,485 3,013 4,238 5,431
(2)/(1).100 118 167 181 197 197Fluid milk price (Tofuken) Case IV (1) 99 103 104 105 107
(yen/kg) Case III (2) 92 84 81 78 79(2)/(1) 100 93 82 78 74 74
Guaranteed price Case IV (1) 83 83 83 83 83(yen/kg) Case III (2) 76 65 61 54 48
(2)/(1)4100 91 78 74 65 58Blend price (Tofuken) Case IV (1) 97 99 100 102 104
(yen/kg) Case III (2) 90 82 80 77 79(2)/(1)*100 93 82 80 76 76
Blend price (Hokkaido) Case IV (1) 80 83 83 85 87(yen/kg) Case III (2) 75 68 66 64 65
(2)/(1) 100 93 82 80 76 76
Note: Case III = reducing guaranteed price by 3% annually and reducing standard purchase price by 1% annually; Case IV = maintainingFY 1987 levels of price supports. FY 1997 is the year when the guaranteed price and the standard purchase price are projected to beat the same level in Case III. FY 2001 is the year when fluid milk prices and the average price received by farmers are projected torebound in Case III.
and imported natural cheese prices convertedinto raw milk equivalents are all fixed at theFY 1987 level. The volumes for which thedeficiency payments are provided are the wholequantity which is earmarked for milk for man-ufacturing.
These simulation results are shown as CaseIII (reducing guaranteed and standard pur-chase prices) and Case IV (prices fixed at FY1987 level) in table 6. As all price levels areunchanged in real terms in Case IV, price vari-ables are almost constant and quantity vari-ables seem to follow reasonably parallel tra-jectories from empirical trends during theforecasting years.
In Case III, the guaranteed price (PP) andthe standard purchase price (SP) are projectedto be at the same level, 61 yen per kilogramin FY 1997 and 48 yen in FY 2005. This meansthat deficiency payments would vanish by1997. Corresponding with these reductions inguaranteed price, manufacturing milk supplyis predicted to be 71% smaller than in Case IV
in FY 2005 while fluid milk supply is predictedto be 6% larger than in Case IV in FY 2005.As a result, fluid milk price should decline andin FY 2001, the average price received byfarmers is projected to be 77 yen in Tofuken,or 25% lower than in Case IV, and 64 yen inHokkaido, also 25% lower than in Case IV.However, such reductions should cease at thislevel, and after FY 2001 the average price re-ceived by farmers will begin to rise. Dairy im-ports should be about two times larger than inCase IV in FY 2005. Cow numbers in FY 2005are predicted to be 19% smaller in both To-fuken and Hokkaido, as compared with CaseIV.
One of the important findings in this sim-ulation is that the blend price received byfarmers is expected to stop declining even ifthe guaranteed price continues to decline. Theratio of fluid milk to total domestic milk sup-ply is predicted to be 90% by FY 2005. Eighty-six percent of manufacturing milk demand willbe provided by dairy imports in FY 2005.
130 July 1991

Deficiency Payments to Milk Producers in Japan 131
Summary and Conclusions References
Price supports through deficiency paymentsand import quotas have resulted in Japanesemilk production at least 20-30% greater thanit would have been without price supports.Also, price supports have kept milk price fluc-tuations smaller, in terms of the coefficient ofvariation, than they would have been in a freemarket and as a result contributed to stabiliz-ing the operation of both dairy farms and milkmanufacturing firms.
A gradual reduction in the guaranteed pricewill make the ratio of fluid milk to total milksupply rise, and the temporary deficiency pay-ment act can be repealed. In this case, as totalfluid milk supply in Japan increases, fluid milkprices should fall, but are expected to stop fall-ing at some level and rebound, if recent priceand income elasticities for demand and thegrowth rate of the population and income re-main unchanged. It is estimated that the lowestaverage prices received by farmers will be 64yen in Hokkaido and 77 yen in Tofuken, if theannual average reduction rate in the guaran-teed price is 3%. A guaranteed price reductionin the future means that the majority of Jap-anese dairy farmers will have to survive bydepending on the fluid market.
[Received February 1990; final revisionreceived January 1991.]
Inaba, H. Pasocon Niyoru Keiryo Bunseki (EconometricAnalysis by Personal Computer). Norin Tokei Kyokai,1987.
Kaiser, H. M., D. H. Streeter, and D. J. Liu. "PricesVersus Stock Effect Policies for Reducing Excess MilkProduction." West. J. Agr. Econ. 13(1988):277-84.
Kajii, I. "Gyunyu Jukyu no Kozo Mondai" ("StructuralProblems in Milk Market"), pp. 97-141. NosanbutsuJukyu no Kozo to Choseitaisaku no kadai (Structureand Adjustment in Agricultural Market). Meibunsho-bo, 1981.
Matsubara, S. "Gyunyu Keizai no Chiiki Keiryo Model"("Econometric Model of Regional Milk Market"), pp.227-58. Nogyo Seisan no Modelka to Simulation(Model and Simulation in Agricultural Sector). NogyoKeiei Keiryo Bunseki Kenkyukai, 1981.
Ministry of Agriculture, Forestry, and Fisheries (MAFF).Keiryo Model niyoru Gyunyu Keizai Bunseki (Econo-metric Analysis of Milk Market), 1971.
Ohtsuka, K. "Kakogenryonyu Fusokubarai Seido no Kei-zai Bunseki" ("Econometric Analysis of DeficiencyPayments to Milk Producers"). Nogyo Keizai Kenkyu(Japanese J. Agr. Econ.) 58(1986):151-63.
Yuize, Y. "Chikusan oyobi Haigoshiryo no Keiryo KeizaiModel" ("Econometric Model of Livestock and MixedFeed Sectors"). Nogyo Sogo Kenkyu (Quart. J. Agr.Econ.) 30(1976):1-104.
Suzuki and Judson