an empirical analysis of attitudinal and behavioral reactions
TRANSCRIPT
Journal of Relationship Marketing, 9:200–228, 2010Copyright © Taylor & Francis Group, LLCISSN: 1533-2667 print / 1533-2675 onlineDOI: 10.1080/15332667.2010.522474
An Empirical Analysis of Attitudinaland Behavioral Reactions Towardthe Abandonment of Unprofitable
Customer Relationships
MICHAEL HAENLEIN and ANDREAS M. KAPLANDepartment of Marketing, ESCP Europe, Paris, France
The management of unprofitable customer relationships and inparticular their abandonment is a topic that has received increas-ing interest in both managerial decision making and academicresearch. However, little is known about the attitudinal and be-havioral reactions that companies should expect from current andpotential customers in response to such strategies. Based on anonline study of 773 customers, we show that the majority of cur-rent/potential customers react with affective or cognitive responsestoward unprofitable customer abandonment, whereas salient be-havioral attitude components are less frequent. In addition, weshow that different attitude components lead to different conse-quences for the abandoning firm and that the salience of behav-ioral attitude components tends to be associated with more negativereactions. Finally, we show that the potential negative consequencesof unprofitable customer abandonment for current customers canbe compensated for by improvements in core service quality.
KEYWORDS customer prioritization, customer relationship man-agement, relationship dissolution, relationship termination, un-profitable customer management
We thank Common Knowledge Research Services, especially Stacey L. Weber, for theirhelp during data collection. This research was supported by Marketing Science InstituteResearch Grant No. 4-1416.
Address correspondence to Michael Haenlein, ESCP Europe, 79 Avenue de la Republique,F-75011 Paris, France. E-mail: [email protected]
200
Downloaded By: [Haenlein, Michael] At: 07:56 11 December 2010
Reactions Toward Unprofitable Customer Abandonment 201
INTRODUCTION
Customer relationship management, which deals with the creation of“improved shareholder value through the development of appropriaterelationships with key customers and customer segments” (Payne & Frow,2005, p. 168), is a topic that has received substantial interest among aca-demics and practitioners over the past decade. Nowadays, it is widely ac-cepted that customers need to be considered as assets by the firm (Gupta,Lehmann, & Stuart, 2004) and that they require individual-level and proactivemanagement. However, given that such activities are not without cost, thevaluation of customer relationships, most often done using customer lifetimevalue (e.g., Berger & Nasr, 1998), is usually the first step of any customerrelationship management strategy. On the one hand, customer relationshipmanagement implies that companies should treat their most profitable cus-tomers in the best possible way. On the other hand, it also means thatmarketing managers need to define appropriate strategies for handling un-profitable customers in order to avoid future losses for the firm.
The latter approach to customer relationship management appears to beespecially important, as previous research in the area of customer profitabil-ity measurement has provided an indication that such unprofitable accountscan represent a substantial share of a company’s client base. Niraj, Gupta,and Narasimhan (2001) analyzed customer profitability for a grocery distrib-utor in a business-to-business setting and found that when cost was allocatedusing activity-based costing, about 32% of all customers were unprofitable.Bowman and Narayandas (2004) investigated the customer base of a vendorin the processed metal business industry and showed that 31% of all rela-tionships recorded a negative operating profit. Haenlein, Kaplan, and Beeser(2007) analyzed the customer base of a retail bank in a business-to-consumerenvironment and identified five customer segments (accounting for 27% ofthe total customer base) that had a negative contribution margin.
Several factors contributing to negative customer profitability have beendiscussed in the literature. Rosenblum, Tomlinson, and Scott (2003) as wellas Bhargava and Feng (2005) highlighted the fact that some customers maybecome unprofitable because their needs and requirements are incompat-ible with the company’s business model. Shapiro, Rangan, Moriarty, andRoss (1987) mentioned that differences in cost-to-serve and customer sit-uations contribute to significant differences in customer profitability. In asimilar spirit, Kaplan and Anderson (2004) stressed that clients requiringcomplex and nonstandard processes stand a high chance of being unprof-itable. This was also highlighted by van Hoek and Evans (2005), who statedthat customers with a disproportionate share of last-minute requests of-ten have negative profitability. Given the importance of the problem aswell as the multitude of different reasons for it, it is unsurprising that the
Downloaded By: [Haenlein, Michael] At: 07:56 11 December 2010
202 M. Haenlein and A. M. Kaplan
management of accounts that lack profitability has been discussed in severalmanagerial articles in recent years (Haenlein & Kaplan, 2009; Mittal, Sarkees,& Murshed, 2008).
Among the strategies that have been recommended and implemented byfirms in such situations is the proactive termination of business relationshipsthat are unprofitable, a phenomenon referred to as unprofitable customerabandonment. Such abandonment can be carried out either directly (i.e.,by informing customers explicitly that the relationship has been terminated)or indirectly (e.g., by treating unprofitable customers less well in the hopethat they will leave the company on their own). It has been shown thatunprofitable customer abandonment can be a value-creating strategy whencustomers are truly unprofitable (i.e., have a negative contribution margin,defined as revenue less direct cost less cost-to-serve) and when unprof-itability in one period is not overcompensated for by profitability in somefuture period (i.e., negative customer lifetime value; see Haenlein, Kaplan,& Schoder, 2006).
Although the idea of proactively terminating customer relationships maybe unexpected for some of the clients negatively affected by it, it is far fromuncommon and has received increasing interest in the academic literaturein recent years. For example, it has become common business practice toroute call center calls based on customer profitability in order to minimizewaiting time for the most profitable clients (Mohl, 2003)—an approach thatcan be considered an indirect abandonment strategy. In a similar spirit, the“customer divestment continuum” proposed by Mittal et al. (2008) includesrelationship termination as a (last) resort in case other strategies, such asrelationship reassessment and customer education or migration, do not proveto be successful. Pressey and Mathews (2003) identified various cases inwhich customer de-selection can take place, especially in markets in whichsuppliers have near monopolist status. Helm (2004) obtained similar findingsin the context of the German mechanical engineering industry.
Yet although the benefits of such a strategy have received some at-tention, the drawbacks, especially the reactions that unprofitable customerabandonment may evoke among the abandoning firm’s current and poten-tial customers, are less well understood. Our research intends to providea contribution in this area. Based on a study of 773 U.S. consumers, weprovide answers to three research questions: First, what is the attitude thatcurrent and potential customers of the abandoning firm show toward un-profitable customer abandonment? Second, do different components of theattitude toward unprofitable customer abandonment (i.e., affective, cogni-tive, behavioral components) differ in their consequences with respect tothe abandoning firm? And third, to what extent does the overall position-ing strategy of the abandoning firm influence reactions toward unprofitablecustomer abandonment?
Downloaded By: [Haenlein, Michael] At: 07:56 11 December 2010
Reactions Toward Unprofitable Customer Abandonment 203
RELATED RESEARCH
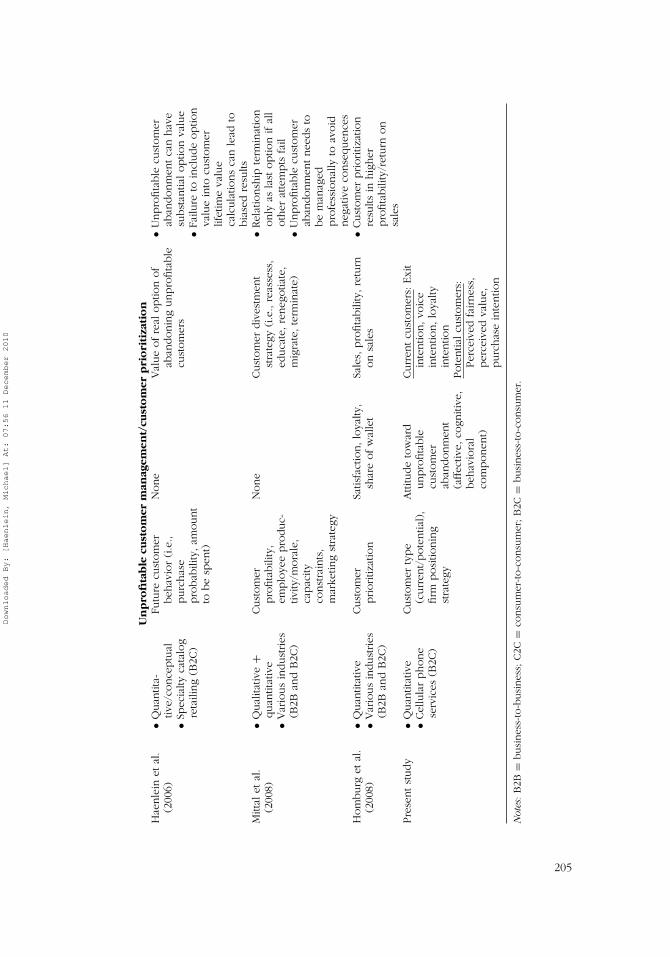
Our work is related to three areas of research that have previously beenthe subject of empirical studies in marketing and social psychology: (a) thereactions to marketing relationship problems, specifically destructive acts(e.g., Hibbard, Kumar, & Stern, 2001; Ping, 1993, 1997, 1999); (b) the disso-lution of personal/business relationships (e.g., Alajoutsijarvi, Moller, & Tahti-nen, 2000; Baxter, 1985); and (c) the management of unprofitable customersor, more generally, customer prioritization (e.g., Haenlein et al., 2006; Hom-burg, Droll, & Totzek, 2008; Mittal et al., 2008). Table 1 presents an overviewof selected work in each of these areas and provides insights into the re-lationship/marketing decision characteristics, mediating variables, and out-come variables considered in each of these studies.
Several authors have analyzed the reactions to problems in marketingchannel relationships, specifically responses to actions that the aggrievedchannel member considers to have a significant negative impact on theirviability or functioning (i.e., destructive acts; Hibbard et al., 2001). Giventhat the management of customers on an individual basis is still a rela-tively new phenomenon in business-to-consumer relationships, these anal-yses have all been conducted in a business-to-business environment anddeal with problems in manufacturer–retailer relationships. Consistent withHirschman’s (1970) exit–voice–loyalty theory, it has been shown that re-lationship problems can result in relationship dissolution (threatened with-drawal, exit), word of mouth (constructive discussion, venting, voice), or en-durance (passive acceptance, loyalty), possibly in a stage-like sequence. Yetalthough these studies provide important insights, it is unclear to what extenttheir findings can be generalized to problems in business-to-consumer rela-tionships, specifically the proactive abandonment of unprofitable customerrelationships.
Given that unprofitable customer abandonment naturally implies dis-continuing business with some groups of clients, another stream of researchrelevant to our study deals with approaches for relationship termination.Because buyer–seller interactions have frequently been compared to a mar-riage (Tynan, 1997), a natural starting point lies in research in the area ofinterpersonal relationship dissolution. Based on a series of studies, Baxter(1985) identified eight disengagement strategies that differ in their degreeof directness (direct vs. indirect) and orientation (self-oriented/unilateral vs.other-oriented/bilateral). The choice between these different strategic op-tions depends on personal characteristics (e.g., age, gender) and prior re-lationship quality (e.g., closeness) and may follow a stage-like sequence.Although naturally related to the disruption of romantic relationships, thequalitative work of Alajoutsijarvi et al. (2000) provides an indication thatthe same strategies can be found and applied in commercial (business-to-
Downloaded By: [Haenlein, Michael] At: 07:56 11 December 2010

TA
BLE
1O
verv
iew
ofRel
ated
Res
earc
h
Res
earc
hRel
atio
nsh
ipan
d/o
rAuth
or
Met
hodolo
gy/
Mar
ketin
gD
ecis
ion
Med
iatin
gO
utc
om
eM
ajor
(Yea
r)Sa
mple
Char
acte
rist
ics
Var
iable
sVar
iable
sFi
ndin
gs
Rea
ctio
ns
top
rob
lem
sin
mar
ket
ing
rela
tio
nsh
ips/
des
tru
ctiv
eac
tsPin
g(1
993)
Pin
g(1
997)
Pin
g(1
999)
•Quan
titat
ive
•Har
dw
are
supplie
rsan
dre
taile
rs(B
2B)
Satis
fact
ion,
cost
-to-e
xit
(alte
rnat
ive
attrac
tiven
ess,
rela
tionsh
ipin
vest
men
t,sw
itchin
gco
st)
None
Exi
t,vo
ice,
loya
lty,
opportunis
m,neg
lect
•Anal
ysis
ofre
taile
rre
actio
ns
tosu
pplie
rre
latio
nsh
ippro
ble
ms
•Sat
isfa
ctio
nan
dco
st-to-e
xitim
pac
tvo
ice
•Sta
ge-lik
ese
quen
cebet
wee
nvo
ice,
loya
lty,
neg
lect
,an
dex
itH
ibbar
det
al.
(200
1)•Q
uan
titat
ive
•Consu
mer
dura
ble
sm
anufa
cture
ran
din
dep
enden
tdea
lers
(B2B
)
Des
truct
ive
act
inte
nsi
ty,ca
usa
lat
trib
utio
ns,
pre
-act
rela
tionsh
ipqual
ity,
dep
enden
ce(t
ota
l,re
lativ
e)
Exi
t(d
isen
gage
men
t),
voic
e(c
onst
ruct
ive
dis
cuss
ion,ve
ntin
g),
loya
lty(p
assi
veac
cepta
nce
)
Supplie
rper
form
ance
,post
-act
rela
tionsh
ipqual
ity
•Anal
ysis
ofdea
ler
reac
tions
tom
anufa
cture
rdes
truct
ive
acts
•Ove
rall
support
for
med
iatin
gro
leofex
it,vo
ice,
and
loya
lty
Rel
atio
nsh
ipd
isso
luti
on
Bax
ter
(198
5)•Q
ual
itativ
e+
quan
titat
ive
•Ser
ies
of10
studie
s•I
nte
rper
sonal
rela
tionsh
ips
(C2C
)
Age
,se
x/se
xro
leorien
tatio
n,prior
rela
tionsh
ipcl
ose
nes
s,fa
ctors
asso
ciat
edw
ithbre
ak-u
p
None
Dis
enga
gem
entst
rate
gy(d
irec
tvs
.in
direc
t,se
lf-o
rien
ted
vs.
oth
er-o
rien
ted)
•Iden
tifica
tion
ofei
ght
dis
tinct
dis
enga
gem
ent
stra
tegi
es•S
equen
cing
pat
tern
bet
wee
ndis
enga
gem
ent
stra
tegy
optio
ns
Ala
jouts
ijarv
iet
al.(2
000)
•Qual
itativ
e(4
case
studie
s)•O
rgan
izat
ional
buye
r–se
ller
rela
tionsh
ips
(B2B
)
Dis
enga
gem
ent
stra
tegy
(direc
tvs
.in
direc
t,se
lf-o
rien
ted
vs.
oth
er-o
rien
ted)
None
Dis
solu
tion
qual
ity(p
roce
ss,outc
om
e)•C
hoic
eofdis
enga
gem
ent
stra
tegy
impac
tsdis
solu
tion
qual
ity•S
om
est
rate
gies
resu
ltin
less
neg
ativ
eco
nse
quen
ces
than
oth
ers—
“bea
utif
ulex
it”is
poss
ible
204
Downloaded By: [Haenlein, Michael] At: 07:56 11 December 2010
Un
pro
fita
ble
cust
om
erm
anag
emen
t/cu
sto
mer
pri
ori
tiza
tio
nH
aenle
inet
al.
(200
6)•Q
uan
tita-
tive/
conce
ptu
al•S
pec
ialty
cata
log
reta
iling
(B2C
)
Futu
recu
stom
erbeh
avio
r(i.e
.,purc
has
epro
bab
ility
,am
ount
tobe
spen
t)
None
Val
ue
ofre
aloptio
nof
aban
donin
gunpro
fita
ble
cust
om
ers
•Unpro
fita
ble
cust
om
erab
andonm
entca
nhav
esu
bst
antia
loptio
nva
lue
•Fai
lure
toin
clude
optio
nva
lue
into
cust
om
erlif
etim
eva
lue
calc
ula
tions
can
lead
tobia
sed
resu
ltsM
ittal
etal
.(2
008)
•Qual
itativ
e+
quan
titat
ive
•Var
ious
indust
ries
(B2B
and
B2C
)
Cust
om
erpro
fita
bili
ty,
emplo
yee
pro
duc-
tivity
/mora
le,
capac
ityco
nst
rain
ts,
mar
ketin
gst
rate
gy
None
Cust
om
erdiv
estm
ent
stra
tegy
(i.e
.,re
asse
ss,
educa
te,re
neg
otia
te,
mig
rate
,te
rmin
ate)
•Rel
atio
nsh
ipte
rmin
atio
nonly
asla
stoptio
nif
all
oth
erat
tem
pts
fail
•Unpro
fita
ble
cust
om
erab
andonm
entnee
ds
tobe
man
aged
pro
fess
ional
lyto
avoid
neg
ativ
eco
nse
quen
ces
Hom
burg
etal
.(2
008)
•Quan
titat
ive
•Var
ious
indust
ries
(B2B
and
B2C
)
Cust
om
erprioritiz
atio
nSa
tisfa
ctio
n,lo
yalty
,sh
are
ofw
alle
tSa
les,
pro
fita
bili
ty,re
turn
on
sale
s•C
ust
om
erprioritiz
atio
nre
sults
inhig
her
pro
fita
bili
ty/r
eturn
on
sale
sPre
sentst
udy
•Quan
titat
ive
•Cel
lula
rphone
serv
ices
(B2C
)
Cust
om
erty
pe
(curr
ent/
pote
ntia
l),
firm
posi
tionin
gst
rate
gy
Attitu
de
tow
ard
unpro
fita
ble
cust
om
erab
andonm
ent
(affec
tive,
cogn
itive
,beh
avio
ral
com
ponen
t)
Curr
entcu
stom
ers:
Exi
tin
tentio
n,vo
ice
inte
ntio
n,lo
yalty
inte
ntio
nPote
ntia
lcu
stom
ers:
Per
ceiv
edfa
irnes
s,per
ceiv
edva
lue,
purc
has
ein
tentio
n
Not
es:B
2B=
busi
nes
s-to
-busi
nes
s;C2C
=co
nsu
mer
-to-c
onsu
mer
;B2C
=busi
nes
s-to
-consu
mer
.
205
Downloaded By: [Haenlein, Michael] At: 07:56 11 December 2010
206 M. Haenlein and A. M. Kaplan
business) settings and that different strategies are associated with differentconsequences and levels of “dissolution quality.”
Finally, several studies have addressed the specific question of unprof-itable customer management. Haenlein et al. (2006) analyzed the (real) op-tion of unprofitable customer abandonment and showed that its value canbe substantial, depending on the variance in future customer behavior. Theauthors highlighted that unprofitable customer abandonment should be con-sidered a valid and profitable strategic option and that the value of thisoption needs to be included when determining customer lifetime value toavoid biased results. More recently, Mittal et al. (2008) discussed the man-agement of unprofitable customers in more general terms and stressed thatterminating such accounts can generate benefits beyond a pure profitabilityincrease, such as improved employee productivity/morale, reduced capac-ity constraints, and better strategic alignment between the customer baseand business objectives. Finally, the work of Homburg et al. (2008) showedempirically that customer prioritization (i.e., treating customers differentlywith respect to marketing investments according to their importance for thefirm) leads to higher average customer profitability and a higher return onsales because it affects relationships with top-tier customers positively butdoes not affect relationships with bottom-tier customers and reduces market-ing and sales costs. These studies therefore provide consistent support forthe financial benefits of customer prioritization and unprofitable customerabandonment. Nonetheless, the attitudinal reactions that such strategies mayevoke within the existing customer base and the likely (indirect) abandon-ment cost that may result from such reactions have not yet been analyzed.
In sum, the question of how unprofitable customer abandonment isperceived in a business-to-consumer context and which attitudinal reactionsit evokes among the abandoning firm’s current customers has not yet beenanswered and therefore represents an important research gap. Our studyaddresses this gap by (a) providing a quantitative analysis of attitudinal reac-tions to unprofitable customer abandonment in a business-to-consumer set-ting, (b) analyzing whether different components of the attitude toward un-profitable customer abandonment (i.e., affective, cognitive, behavioral com-ponents) are associated with different behavioral intentions in response tounprofitable customer abandonment, and (c) investigating how the overallpositioning strategy of the abandoning firm influences behavioral intentionsin response to unprofitable customer abandonment.
CONCEPTUAL FRAMEWORK AND HYPOTHESES
Overview of Research Framework and Constructs
Within our conceptual framework, we assume that unprofitable customerabandonment will evoke attitudinal reactions among the abandoning firm’scurrent and potential customers. Such thinking is consistent with research in
Downloaded By: [Haenlein, Michael] At: 07:56 11 December 2010
Reactions Toward Unprofitable Customer Abandonment 207
psychology and consumer behavior that has frequently shown that stimulilead to attitudes that in turn precede behavioral intentions (see, e.g., the the-ory of planned behavior; Ajzen, 1991). Attitudes are defined as learned pre-dispositions “to respond in a consistently favorable or unfavorable mannerwith respect to a given object” (Fishbein & Ajzen, 1975, p. 6). Many authorshave highlighted the idea that attitudes are not unidimensional but insteadconsist of affective, cognitive, and behavioral components (e.g., Bagozzi, Ty-bout, Craig, & Sternthal, 1979; Ostrom, 1969; Rosenberg & Hovland, 1960).Affective components summarize sympathetic nervous responses or verbalstatements of affect; cognitive components perceptual responses or ver-bal statements of beliefs; and behavioral components overt actions or verbalstatements concerning behavior (Rosenberg & Hovland, 1960).
With respect to behavioral intentions in response to unprofitable cus-tomer abandonment, we differentiate between the reactions of current andpotential customers. For current customers, we assume that unprofitablecustomer abandonment may lead to behavioral intentions of exit, voice, andloyalty. Such thinking is consistent with the work of Hirschman (1970) onresponses to organizational decline, Ping (1993, 1997, 1999) on relationshipproblems, and Hibbard et al. (2001) on destructive acts. We define a currentcustomer’s exit intention as the intention to stop buying the firm’s productsor services; voice intention as the intention to express dissatisfaction directlyto the company’s management or to some other authority to which man-agement is subordinate, or through general protest to anyone who caresto listen; and loyalty intention as the intention to maintain a considerableattachment to the organization combined with the expectation that someonewill act or something will happen to improve matters (Hirschman, 1970).
For potential customers, we draw from the literature in the area of pricediscrimination and unfair pricing, in which several theories have been pro-posed to explain reactions that can be expected when consumers perceivethat they are being treated in an unfair way. In line with the propositionsdeveloped by Xia, Monroe, and Cox (2004), we assume that the perceivedfairness of the abandonment act influences the perceived value of the aban-doning company’s offering, which in turn influences purchase intention. Wedefine perceived fairness as the customer’s perception of the fairness of earn-ings and other outcomes that he or she receives from his or her relationshipwith the supplier (distributive fairness; Kumar, Scheer, & Steenkamp, 1995)and perceived value as the utility derived from the feelings or affective statesthat a product or service generates (emotional value; Sweeney & Soutar,2001).
Finally, we assume that the abandoning firm does not need to pas-sively accept the reactions of current and potential customers but insteadcan influence them by adapting its positioning strategy. Here we focuson the dimensions of perceived sacrifice (price) and perceived (service)quality, which have been shown to jointly influence the perceived value ofa company’s offering (Zeithaml, 1988).
Downloaded By: [Haenlein, Michael] At: 07:56 11 December 2010

208 M. Haenlein and A. M. Kaplan
Hypotheses
In an environment in which customers are used to being treated as “kings,”the news that a company abandons unprofitable customer relationships islikely to be perceived as surprising and unexpected by current and potentialcustomers of the abandoning firm. Consistent with attribution theory, thesecustomers will therefore engage in “spontaneous causal thinking” (Weiner,1985) and make causal attributions with respect to the abandonment actthat ultimately translate into an attitudinal reaction toward the abandonmentdecision. Under the assumption that (a) abandonment impacts the unprof-itable customer in a negative way (e.g., because he or she is obliged to lookfor an alternative supplier) and (b) a social relationship exists between thecurrent/potential customer and the unprofitable customer being abandoned,such an attitudinal reaction is consistent with balance theory. Balance the-ory states that people strive to achieve balance in triadic relationships (e.g.,current/potential customer–unprofitable customer–abandoning firm). In thecase of an unbalanced relationship, attitudes toward the other two partiesare adapted according to the attitude the two parties have toward themselvesin order to regain balance.
As highlighted previously, it has frequently been stressed that attitudesare not unidimensional but instead consist of affective, cognitive, and behav-ioral components (e.g., Fishbein & Ajzen, 1975; Ostrom, 1969; Rosenberg &Hovland, 1960). Yet only a few publications have investigated this from anempirical perspective—see Ostrom for a notable example. As discussed byOliver (1999) for the special case of (attitudinal) loyalty, these three com-ponents are not necessarily salient simultaneously for each individual butinstead may follow a stage-like sequence in which, for example, attitudesare first driven primarily by cognitive, then affective, and finally behavioralcomponents. Yet on an overall level, it would be misleading to considerattitudes as unidimensional constructs. This leads to the following two hy-potheses:
H1a: Unprofitable customer abandonment will evoke attitudinal reactionsamong the abandoning firm’s current and potential customers.H1b: The attitude toward unprofitable customer abandonment consists ofaffective, cognitive, and behavioral components.
Consistent with research in the area of consumer behavior, in whichthe mediating role of attitudes has been supported in a variety of differentsettings, we assume that affective, cognitive, and behavioral componentsof the attitude toward unprofitable customer abandonment differ in theirconsequences for the abandoning firm. For current customers, we assumethat negative reactions in response to unprofitable customer abandonmentare more likely when behavioral attitude components are salient than when
Downloaded By: [Haenlein, Michael] At: 07:56 11 December 2010
Reactions Toward Unprofitable Customer Abandonment 209
affective and/or cognitive components are salient. Such thinking is appro-priate because, as defined previously, behavioral attitude components dealwith overt actions concerning behavior to be taken and verbal statements tobe made. We therefore postulate that when behavioral attitude componentsare salient current customers are (a) more likely to leave the abandoning firm(i.e., higher levels of exit intention), (b) more likely to spread negative wordof mouth about the abandoning firm (i.e., higher levels of voice intention),and (c) less likely to remain customers (i.e., lower levels of loyalty intention)than when affective and/or cognitive components are salient.
H2a: When behavioral attitude components are salient current customershave higher levels of exit intention, higher levels of voice intention, andlower levels of loyalty intention than when affective and/or cognitiveattitude components are salient.
Unlike current customers, potential customers are not faced with anydirect decisions with respect to the abandoning firm in the short term, assuch a decision only becomes relevant when they are confronted with thechoice of trading their current provider for an alternative one. Although inthis case the salience of behavioral attitude components is still likely to drivethe overall evaluation of the abandonment act (i.e., perceived fairness, per-ceived value), direct reactions (i.e., purchase intention) are likely to be moresevere when affective (emotional) attitude components are salient. This hy-pothesis finds support in existing research investigating the behavioral con-sequences of certain emotions, specifically anger and regret (e.g., Bonifield& Cole, 2007; Bougie, Pieters, & Zeelenberg, 2003; Folkes, Koletsky, &Graham, 1987). These studies have shown that emotional reactions havean important influence on consumer behavior in situations in which cus-tomers feel that they are being treated in an unfair way. We assume thatsimilar processes are in place when analyzing the reaction to unprofitablecustomer abandonment. We therefore postulate that when behavioral atti-tude components are salient potential customers are likely to evaluate theabandonment decision more severely (i.e., lower levels of perceived fair-ness and perceived value), whereas when affective attitude components aresalient potential customers are more likely to show more negative reactions(i.e., lower levels of purchase intent). This leads to the following hypotheses:
H2b: When behavioral attitude components are salient potential cus-tomers have lower levels of perceived fairness and lower levels of per-ceived value than when affective and/or cognitive attitude componentsare salient.H2c: When affective attitude components are salient potential customershave lower levels of purchase intention than when behavioral and/orcognitive attitude components are salient.
Downloaded By: [Haenlein, Michael] At: 07:56 11 December 2010
210 M. Haenlein and A. M. Kaplan
A question of great managerial relevance for the abandoning firm is notonly how current and potential customers might react toward unprofitablecustomer abandonment but also to what extent these reactions can be in-fluenced by the choice of a certain positioning strategy. For example, theabandoning company could make the decision to invest the money savedby abandoning unprofitable customer relationships in improvements to itsproduct/service offering by either increasing quality or decreasing prices,and thus position itself accordingly. Although abandonment might then stilllead to unfavorable attitudes, any potential negative consequences could becompensated for by the overall increase in the perceived value of the offer.
According to Zeithaml (1988), price and the perceived quality of a prod-uct jointly influence perceived value. Price represents the perceived sacrificeto obtain a product or service of a certain quality, and (re)purchase onlyoccurs if a net benefit (i.e., positive perceived value) is created for the con-sumer. Within this framework, unprofitable customer abandonment could beconsidered a factor lowering the perceived quality of the product/service,which could be offset either by (a) a lower perceived sacrifice (price) asso-ciated with the purchase or (b) an improvement of other product attributesso that perceived quality remains unchanged. In both cases, the perceivedvalue of the whole offering would be the same before versus after abandon-ment, leading to similar levels of purchase intent. Based on these theoreticalarguments, we propose the following hypothesis:
H3: The overall positioning strategy of the abandoning firm with respectto price and quality will have an impact on the consequences of unprof-itable customer abandonment for current and potential customers.
RESEARCH METHODOLOGY
Data Collection
Data collection was carried out using an online experiment in which re-spondents were exposed to a scenario text describing an unprofitable cus-tomer abandonment decision implemented by a mobile phone provider (seeAppendix A). We chose the mobile phone industry because it represents amajor service sector in the United States and Europe and because unprof-itable customer abandonment has previously taken place in this setting (e.g.,by Sprint Nextel in June 2007; Mittal et al., 2008). Given that the focus of ourresearch was to investigate how unprofitable customer abandonment influ-ences the attitudes and reactions of customers of the abandoning firm whohave not been abandoned themselves, one experiment focused on currentcustomers and one on potential customers.
Within the scenario description we randomized the strength of the re-lationship (tie strength) with the abandoned customer. Respondents were
Downloaded By: [Haenlein, Michael] At: 07:56 11 December 2010
Reactions Toward Unprofitable Customer Abandonment 211
first asked to provide the name or initials (NAME) of a friend/acquaintancewho fulfilled certain characteristics in terms of tie strength.1 The sce-nario text then continued with the description of an example of a mo-bile phone provider implementing an abandonment strategy with respectto this friend/acquaintance. The mobile phone provider in this examplewas either the provider with whom the respondent currently had a contract(PROVIDER; analysis of current customers) or Cell Phone Inc., an imaginarymobile phone provider (analysis of potential customers). We randomizedthe type of abandonment strategy used by the firm equally and exposed halfof the respondents to a direct abandonment strategy and half to an indi-rect abandonment strategy (see Baxter, 1985, for a distinction between thesetwo types of abandonment strategy).2 In total, this resulted in eight differenttreatment conditions (2 [customer type] × 2 [tie strength] × 2 [abandonmentstrategy]) to which respondents were allocated randomly.
After having been exposed to the scenario descriptions, respondentswere asked to describe their feelings and reactions in such a situation in fiveor more sentences to increase the salience of the respective motivationalorientation. The resulting verbatim comments formed the basis of our anal-ysis of attitudes toward unprofitable customer abandonment. Respondentswere then asked to imagine themselves in the respective situation and toreply to a set of multi-item scales covering the key variables included in ourstudy (i.e., exit intention, voice intention, and loyalty intention for currentcustomers; perceived fairness, perceived value, and purchase intention forpotential customers). Regarding the operationalization of these variables werelied on existing scales, which we adapted slightly to fit the context of ourstudy (see Appendix B and Appendix C for details). Following the recom-mendations of Cox (1980), we measured all items on 7-point Likert scalesanchored by strongly agree (+3) and strongly disagree (−3).
Subsequently, we used a full-factorial design to analyze the impact ofdifferent positioning strategies on respondents’ decisions to leave their cur-rent provider (analysis of current customers) or join Cell Phone Inc. (analysisof potential customers). For this we systematically varied three componentsof the offer (price, network quality, handset attractiveness) on two levels,leading to 23 = 8 different stimuli to be evaluated.3 Within this design, weasked current customers how likely they would be to leave their currentprovider (who implemented a customer abandonment strategy) if the alter-native provider had the same (or a higher) price, an equal (or worse) qualitynetwork, and as attractive (or less attractive) handsets. Similarly, we askednew customers how likely they would be to join Cell Phone Inc. (a companyimplementing unprofitable customer abandonment) if it had the same (or alower) price, an equal (or better) quality network, and as attractive (or moreattractive) handsets as their current provider. All options were presented in arandomized way (to avoid potential order effects), and all respondents wereasked to rank each option based on their likelihood to subscribe from 1(least likely) to 8 (most likely).
Downloaded By: [Haenlein, Michael] At: 07:56 11 December 2010
212 M. Haenlein and A. M. Kaplan
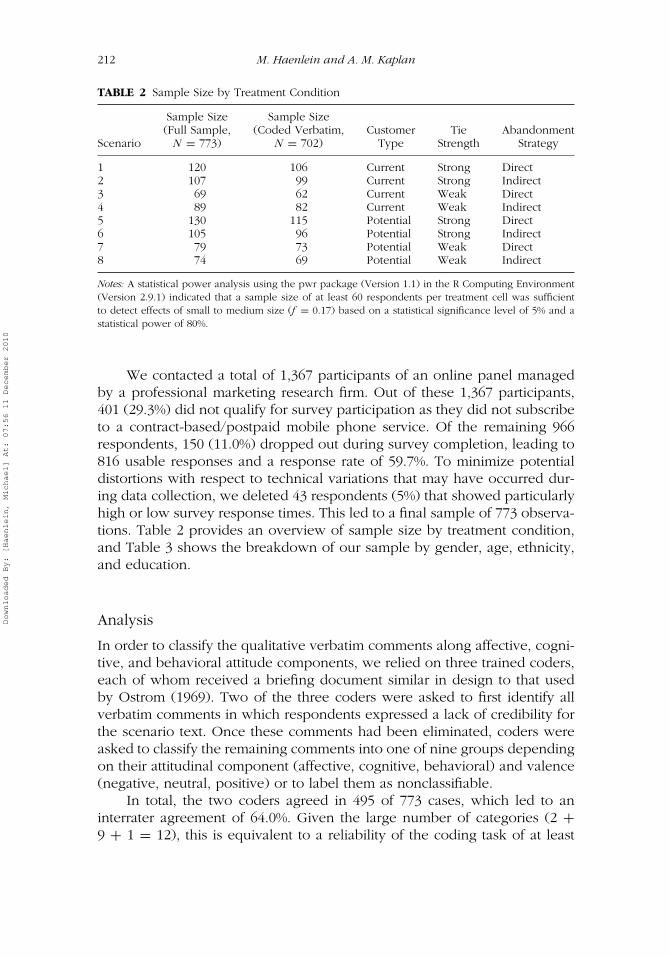
TABLE 2 Sample Size by Treatment Condition
Sample Size Sample Size(Full Sample, (Coded Verbatim, Customer Tie Abandonment
Scenario N = 773) N = 702) Type Strength Strategy
1 120 106 Current Strong Direct2 107 99 Current Strong Indirect3 69 62 Current Weak Direct4 89 82 Current Weak Indirect5 130 115 Potential Strong Direct6 105 96 Potential Strong Indirect7 79 73 Potential Weak Direct8 74 69 Potential Weak Indirect
Notes: A statistical power analysis using the pwr package (Version 1.1) in the R Computing Environment(Version 2.9.1) indicated that a sample size of at least 60 respondents per treatment cell was sufficientto detect effects of small to medium size (f = 0.17) based on a statistical significance level of 5% and astatistical power of 80%.
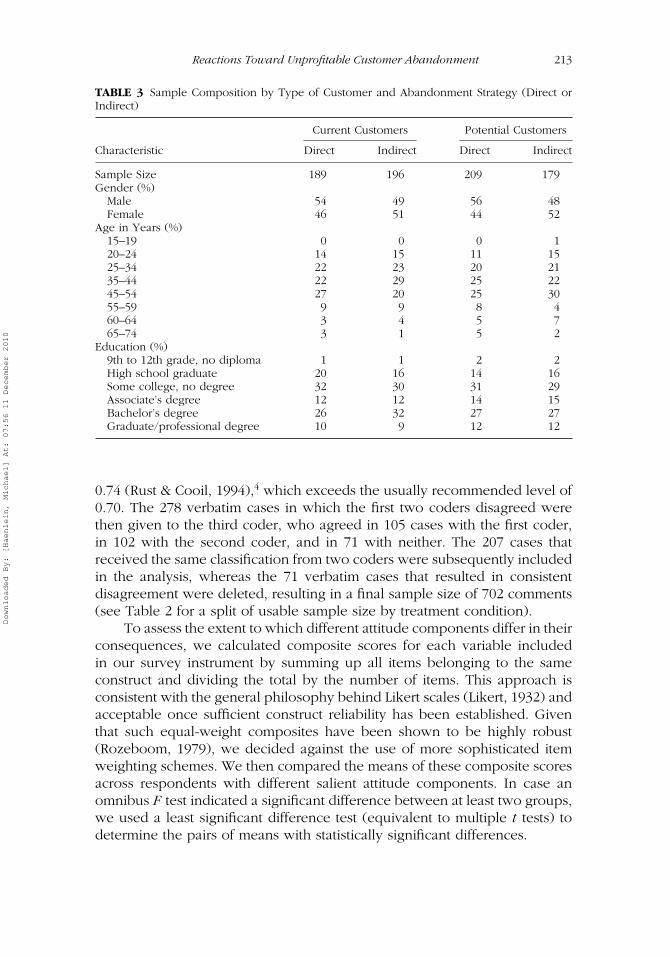
We contacted a total of 1,367 participants of an online panel managedby a professional marketing research firm. Out of these 1,367 participants,401 (29.3%) did not qualify for survey participation as they did not subscribeto a contract-based/postpaid mobile phone service. Of the remaining 966respondents, 150 (11.0%) dropped out during survey completion, leading to816 usable responses and a response rate of 59.7%. To minimize potentialdistortions with respect to technical variations that may have occurred dur-ing data collection, we deleted 43 respondents (5%) that showed particularlyhigh or low survey response times. This led to a final sample of 773 observa-tions. Table 2 provides an overview of sample size by treatment condition,and Table 3 shows the breakdown of our sample by gender, age, ethnicity,and education.
Analysis
In order to classify the qualitative verbatim comments along affective, cogni-tive, and behavioral attitude components, we relied on three trained coders,each of whom received a briefing document similar in design to that usedby Ostrom (1969). Two of the three coders were asked to first identify allverbatim comments in which respondents expressed a lack of credibility forthe scenario text. Once these comments had been eliminated, coders wereasked to classify the remaining comments into one of nine groups dependingon their attitudinal component (affective, cognitive, behavioral) and valence(negative, neutral, positive) or to label them as nonclassifiable.
In total, the two coders agreed in 495 of 773 cases, which led to aninterrater agreement of 64.0%. Given the large number of categories (2 +9 + 1 = 12), this is equivalent to a reliability of the coding task of at least
Downloaded By: [Haenlein, Michael] At: 07:56 11 December 2010
Reactions Toward Unprofitable Customer Abandonment 213
TABLE 3 Sample Composition by Type of Customer and Abandonment Strategy (Direct orIndirect)
Current Customers Potential Customers
Characteristic Direct Indirect Direct Indirect
Sample Size 189 196 209 179Gender (%)
Male 54 49 56 48Female 46 51 44 52
Age in Years (%)15–19 0 0 0 120–24 14 15 11 1525–34 22 23 20 2135–44 22 29 25 2245–54 27 20 25 3055–59 9 9 8 460–64 3 4 5 765–74 3 1 5 2
Education (%)9th to 12th grade, no diploma 1 1 2 2High school graduate 20 16 14 16Some college, no degree 32 30 31 29Associate’s degree 12 12 14 15Bachelor’s degree 26 32 27 27Graduate/professional degree 10 9 12 12
0.74 (Rust & Cooil, 1994),4 which exceeds the usually recommended level of0.70. The 278 verbatim cases in which the first two coders disagreed werethen given to the third coder, who agreed in 105 cases with the first coder,in 102 with the second coder, and in 71 with neither. The 207 cases thatreceived the same classification from two coders were subsequently includedin the analysis, whereas the 71 verbatim cases that resulted in consistentdisagreement were deleted, resulting in a final sample size of 702 comments(see Table 2 for a split of usable sample size by treatment condition).
To assess the extent to which different attitude components differ in theirconsequences, we calculated composite scores for each variable includedin our survey instrument by summing up all items belonging to the sameconstruct and dividing the total by the number of items. This approach isconsistent with the general philosophy behind Likert scales (Likert, 1932) andacceptable once sufficient construct reliability has been established. Giventhat such equal-weight composites have been shown to be highly robust(Rozeboom, 1979), we decided against the use of more sophisticated itemweighting schemes. We then compared the means of these composite scoresacross respondents with different salient attitude components. In case anomnibus F test indicated a significant difference between at least two groups,we used a least significant difference test (equivalent to multiple t tests) todetermine the pairs of means with statistically significant differences.
Downloaded By: [Haenlein, Michael] At: 07:56 11 December 2010
214 M. Haenlein and A. M. Kaplan
To investigate how the overall positioning strategy of the abandoningfirm influences the consequences of customer abandonment, we relied on awithin-subject analysis of variance. Although rank orders represent ordinal(vs. interval) measured variables, the use of an analysis of variance seemedjustified, as nonparametric tests are generally less powerful than parametricones and statistics involving means and standard deviations tend to provideplausible results, even in the absence of interval scaled data (Stevens, 1946).All calculations were carried out in SPSS for Windows (Version 14.0) and theR Computing Environment (Version 2.5.1).
RESULTS
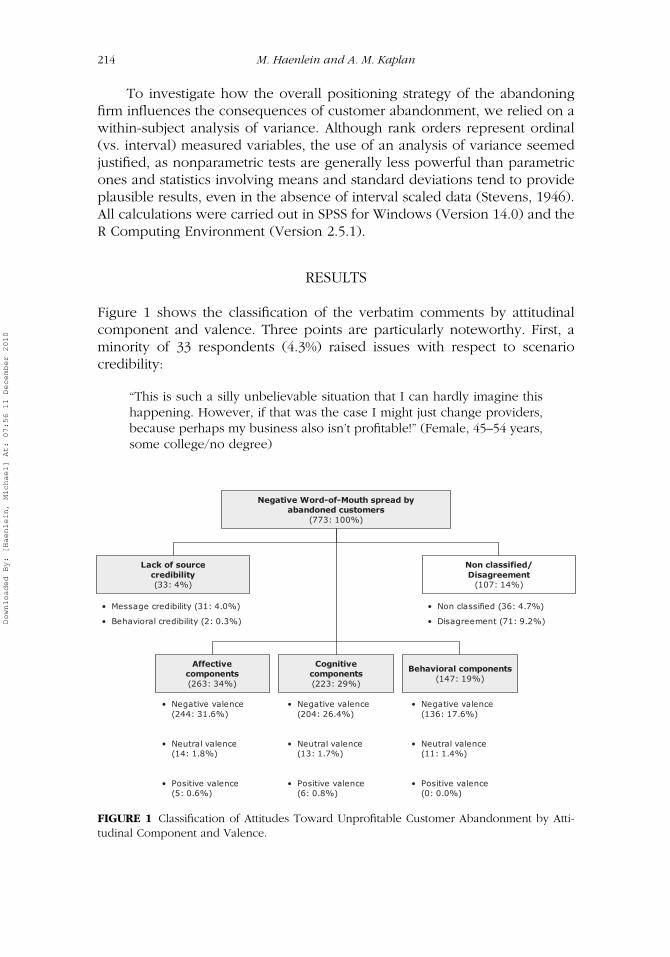
Figure 1 shows the classification of the verbatim comments by attitudinalcomponent and valence. Three points are particularly noteworthy. First, aminority of 33 respondents (4.3%) raised issues with respect to scenariocredibility:
“This is such a silly unbelievable situation that I can hardly imagine thishappening. However, if that was the case I might just change providers,because perhaps my business also isn’t profitable!” (Female, 45–54 years,some college/no degree)
Negative Word-of-Mouth spread byabandoned customers
(773: 100%)
Non classified/Disagreement
(107: 14%)
Lack of sourcecredibility(33: 4%)
Affectivecomponents(263: 34%)
Cognitivecomponents(223: 29%)
Behavioral components(147: 19%)
• Message credibility (31: 4.0%)
• Behavioral credibility (2: 0.3%)
• Non classified (36: 4.7%)
• Disagreement (71: 9.2%)
• Negative valence(244: 31.6%)
• Neutral valence(14: 1.8%)
• Positive valence(5: 0.6%)
• Negative valence(204: 26.4%)
• Neutral valence(13: 1.7%)
• Positive valence(6: 0.8%)
• Negative valence(136: 17.6%)
• Neutral valence(11: 1.4%)
• Positive valence(0: 0.0%)
FIGURE 1 Classification of Attitudes Toward Unprofitable Customer Abandonment by Atti-tudinal Component and Valence.
Downloaded By: [Haenlein, Michael] At: 07:56 11 December 2010
Reactions Toward Unprofitable Customer Abandonment 215
“I would have to say that, since most mobile phone providers requireyearly contracts and if these contracts are broken there is a large fee tobe paid, this is not very believable.” (Male, 25–34 years, some college/nodegree)
“Disbelief, would think that she had misunderstood the information givento her. If it turned out to be true, it would be unacceptable.” (Female,25–34 years, associate’s degree)
Obviously, for those participants, unprofitable customer abandonmentappeared to be so strange and unfamiliar that the message was incompatiblewith their current belief system. Given that we did not prompt respondentsdirectly to react on the credibility of the scenario text, this can be seen asa strong indication of the degree to which customer abandonment violatesimplicitly assumed norms.
Second, although the majority of respondents (584 participants, 75.5%)expressed a negative attitude toward customer abandonment, 11 participants(1.4%) reacted to it in a positive way. This is somewhat surprising and mayprovide an indication that unprofitable customer abandonment also evokespositive attitudinal reactions, at least for some market segments.
Third, as expected, we observed comments that were consistent withall three attitudinal components (affective, cognitive, behavioral). For 263respondents (34.0%), these comments described feelings and emotions thatindicated the salience of affective components:
“I would be very angry and disappointed. Every customer should betreated equally.” (negative: male, 35–44 years, bachelor’s degree)
“I would not care as she has her own mind and is smarter on bargainsthan I am. So I would say ‘Do what you think is best’!” (neutral: male,45–54 years, some college/no degree)
“I think that is the best thing for you. This has happened for a reason andright now there are a few providers out there that can be competitive andoffer you great service.” (positive: female, 25–34 years, some college/nodegree)
An almost equally large group (223 respondents, 28.8%) reacted in amore rational way, as expressed in comments about beliefs and (perceived)characteristics, which can be seen as an indication for cognitive attitudecomponents:
“I would tell him the company is not a company for him. If Cell PhoneInc. does not care about customers that have been with them a while
Downloaded By: [Haenlein, Michael] At: 07:56 11 December 2010
216 M. Haenlein and A. M. Kaplan
TABLE 4 Reactions in Response to Unprofitable Customer Abandonment by AttitudeComponent
Affective Cognitive Behavioral TotalCustomer Component (M) (M) (M) (M) F p
CurrentCustomers
Sample size 150 106 59 315Exit intention 1.11 0.77 1.75 1.11 8.391 0.0003Voice intention 1.30 1.02 1.36 1.21 2.150 0.1182Loyalty intention −0.29 −0.26 −0.74 −0.37 3.113 0.0458
PotentialCustomers
Sample size 113 117 88 318Perceived fairness −1.68 −1.79 –2.14 –1.85 3.273 0.0392Perceived value −2.12 −2.41 –2.54 –2.34 3.346 0.0365Purchase intention −2.18 −2.54 –2.74 –2.47 6.888 0.0012
and only looks at the bottom dollar, they will sooner or later realize theirmistake.” (negative: female, 35–44 years, bachelor’s degree)
“I would tell Jennifer that her business is just as important as any otherbusiness that Cellular South had, and if they did not feel that her businesswas important enough, she should change services.” (neutral: female,35–44 years, some college/no degree)
“Business is business. If he is unprofitable, then I am paying more so thathe can have the service. Bummer for him, but there are a lot of otherproviders.” (positive: male, 45–54 years, bachelor’s degree)
Finally, the smallest group (147 respondents, 19.0%) showed thesalience of behavioral components and spoke about intended reactions andbehavior in such a situation:
“I would start looking for another provider myself just to avoid the hassleof it happening to me later when I didn’t have the time to deal withit. I would be irritated that a company would do something like that.”(negative: male, 25–34 years, bachelor’s degree)
“I would still stay with the company. It’s the only one I get service withat my residence.” (neutral: female, 45–54 years, high school graduate)
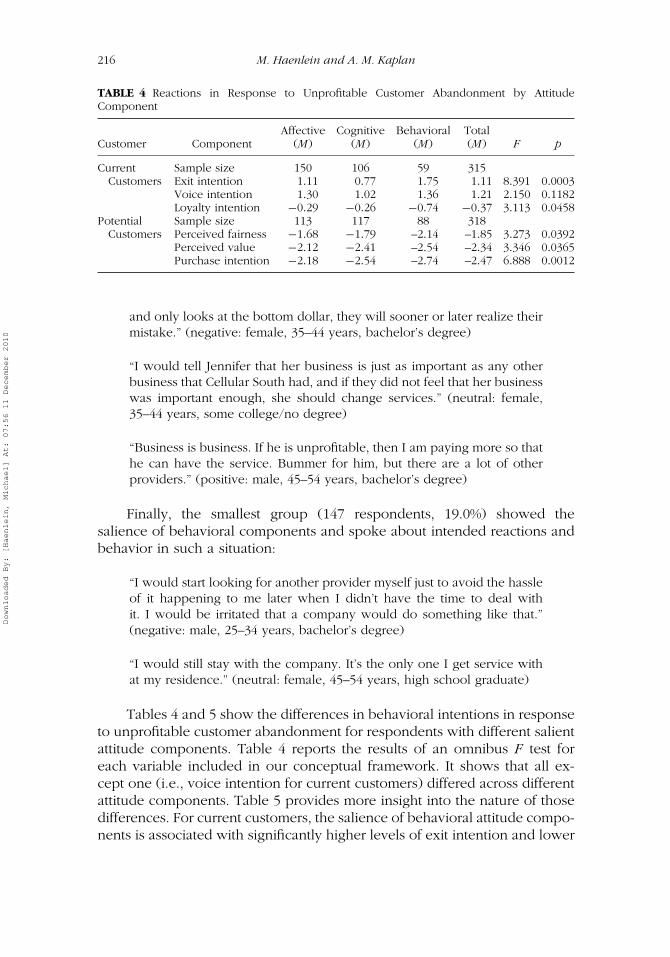
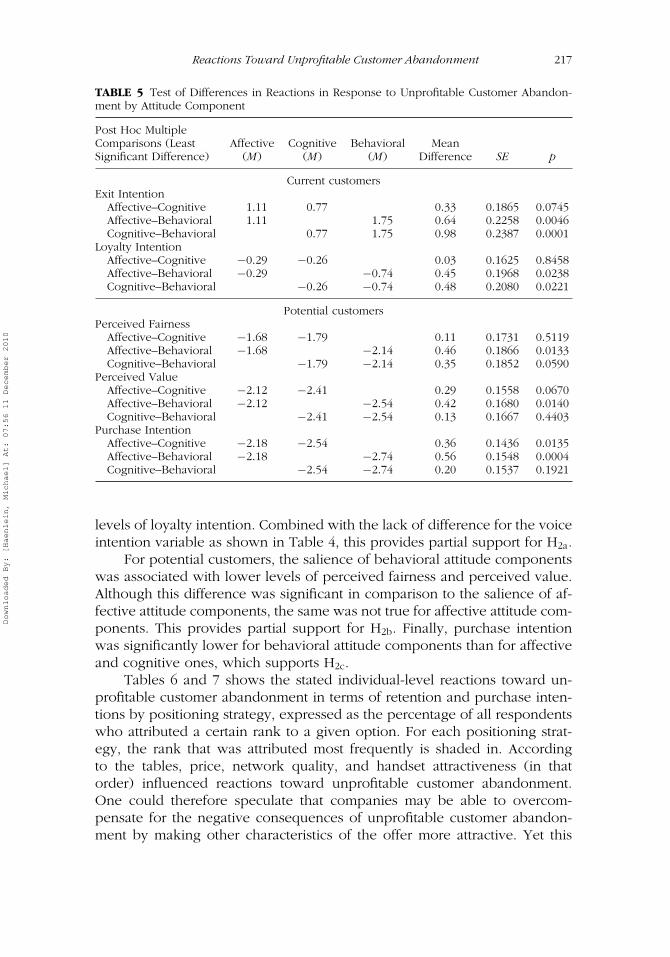
Tables 4 and 5 show the differences in behavioral intentions in responseto unprofitable customer abandonment for respondents with different salientattitude components. Table 4 reports the results of an omnibus F test foreach variable included in our conceptual framework. It shows that all ex-cept one (i.e., voice intention for current customers) differed across differentattitude components. Table 5 provides more insight into the nature of thosedifferences. For current customers, the salience of behavioral attitude compo-nents is associated with significantly higher levels of exit intention and lower
Downloaded By: [Haenlein, Michael] At: 07:56 11 December 2010
Reactions Toward Unprofitable Customer Abandonment 217
TABLE 5 Test of Differences in Reactions in Response to Unprofitable Customer Abandon-ment by Attitude Component
Post Hoc MultipleComparisons (Least Affective Cognitive Behavioral MeanSignificant Difference) (M) (M) (M) Difference SE p
Current customersExit Intention
Affective–Cognitive 1.11 0.77 0.33 0.1865 0.0745Affective–Behavioral 1.11 1.75 0.64 0.2258 0.0046Cognitive–Behavioral 0.77 1.75 0.98 0.2387 0.0001
Loyalty IntentionAffective–Cognitive −0.29 −0.26 0.03 0.1625 0.8458Affective–Behavioral −0.29 −0.74 0.45 0.1968 0.0238Cognitive–Behavioral −0.26 −0.74 0.48 0.2080 0.0221
Potential customersPerceived Fairness
Affective–Cognitive −1.68 −1.79 0.11 0.1731 0.5119Affective–Behavioral −1.68 −2.14 0.46 0.1866 0.0133Cognitive–Behavioral −1.79 −2.14 0.35 0.1852 0.0590
Perceived ValueAffective–Cognitive −2.12 −2.41 0.29 0.1558 0.0670Affective–Behavioral −2.12 −2.54 0.42 0.1680 0.0140Cognitive–Behavioral −2.41 −2.54 0.13 0.1667 0.4403
Purchase IntentionAffective–Cognitive −2.18 −2.54 0.36 0.1436 0.0135Affective–Behavioral −2.18 −2.74 0.56 0.1548 0.0004Cognitive–Behavioral −2.54 −2.74 0.20 0.1537 0.1921
levels of loyalty intention. Combined with the lack of difference for the voiceintention variable as shown in Table 4, this provides partial support for H2a.
For potential customers, the salience of behavioral attitude componentswas associated with lower levels of perceived fairness and perceived value.Although this difference was significant in comparison to the salience of af-fective attitude components, the same was not true for affective attitude com-ponents. This provides partial support for H2b. Finally, purchase intentionwas significantly lower for behavioral attitude components than for affectiveand cognitive ones, which supports H2c.
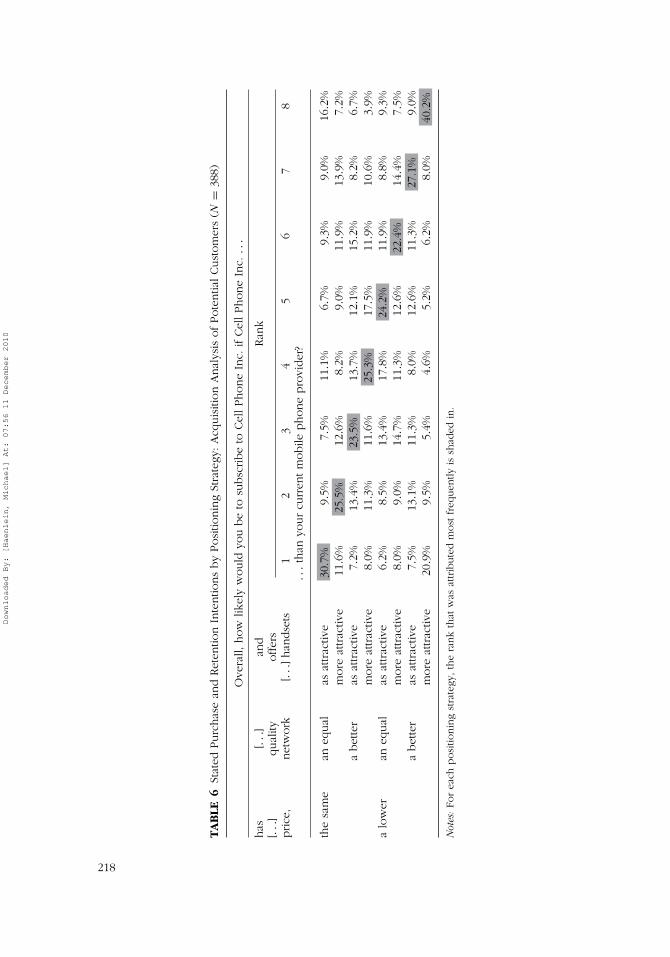
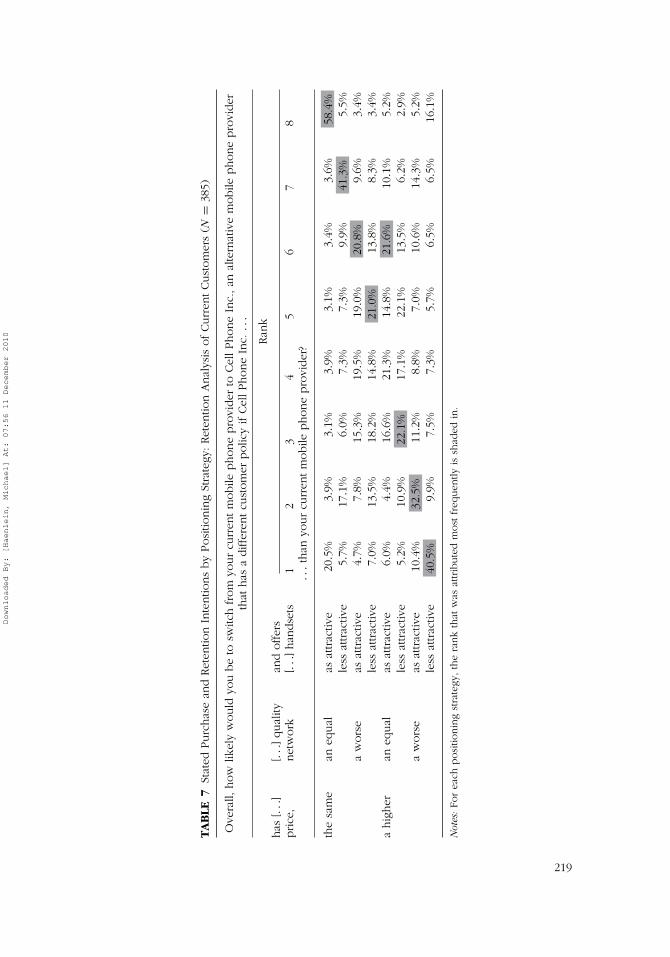
Tables 6 and 7 shows the stated individual-level reactions toward un-profitable customer abandonment in terms of retention and purchase inten-tions by positioning strategy, expressed as the percentage of all respondentswho attributed a certain rank to a given option. For each positioning strat-egy, the rank that was attributed most frequently is shaded in. Accordingto the tables, price, network quality, and handset attractiveness (in thatorder) influenced reactions toward unprofitable customer abandonment.One could therefore speculate that companies may be able to overcom-pensate for the negative consequences of unprofitable customer abandon-ment by making other characteristics of the offer more attractive. Yet this
Downloaded By: [Haenlein, Michael] At: 07:56 11 December 2010
TA
BLE
6St
ated
Purc
has
ean
dRet
entio
nIn
tentio
ns
by
Posi
tionin
gSt
rate
gy:A
cquis
ition
Anal
ysis
ofPote
ntia
lCust
om
ers
(N=
388)
Ove
rall,
how
likel
yw
ould
you
be
tosu
bsc
ribe
toCel
lPhone
Inc.
ifCel
lPhone
Inc.
...
has
[...
]an
dRan
k[.
..]
qual
ityoffer
sprice
,net
work
[...
]han
dse
ts1
23
45
67
8..
.th
anyo
ur
curr
entm
obile
phone
pro
vider
?
the
sam
ean
equal
asat
trac
tive
30.7
%9.
5%7.
5%11
.1%
6.7%
9.3%
9.0%
16.2
%m
ore
attrac
tive
11.6
%25
.5%
12.6
%8.
2%9.
0%11
.9%
13.9
%7.
2%a
bet
ter
asat
trac
tive
7.2%
13.4
%23
.5%
13.7
%12
.1%
15.2
%8.
2%6.
7%m
ore
attrac
tive
8.0%
11.3
%11
.6%
25.3
%17
.5%
11.9
%10
.6%
3.9%
alo
wer
aneq
ual
asat
trac
tive
6.2%
8.5%
13.4
%17
.8%
24.2
%11
.9%
8.8%
9.3%
more
attrac
tive
8.0%
9.0%
14.7
%11
.3%
12.6
%22
.4%
14.4
%7.
5%a
bet
ter
asat
trac
tive
7.5%
13.1
%11
.3%
8.0%
12.6
%11
.3%
27.1
%9.
0%m
ore
attrac
tive
20.9
%9.
5%5.
4%4.
6%5.
2%6.
2%8.
0%40
.2%
Not
es:Fo
rea
chposi
tionin
gst
rate
gy,th
era
nk
that
was
attrib
ute
dm
ost
freq
uen
tlyis
shad
edin
.
218
Downloaded By: [Haenlein, Michael] At: 07:56 11 December 2010
TA
BLE
7St
ated
Purc
has
ean
dRet
entio
nIn
tentio
ns
by
Posi
tionin
gSt
rate
gy:Ret
entio
nA
nal
ysis
ofCurr
entCust
om
ers
(N=
385)
Ove
rall,
how
likel
yw
ould
you
be
tosw
itch
from
your
curr
entm
obile
phone
pro
vider
toCel
lPhone
Inc.
,an
alte
rnat
ive
mobile
phone
pro
vider
that
has
adiffe
rentcu
stom
erpolic
yif
Cel
lPhone
Inc.
...
Ran
khas
[...
][.
..]qual
ityan
doffer
sprice
,net
work
[...
]han
dse
ts1
23
45
67
8..
.th
anyo
ur
curr
entm
obile
phone
pro
vider
?
the
sam
ean
equal
asat
trac
tive
20.5
%3.
9%3.
1%3.
9%3.
1%3.
4%3.
6%58
.4%
less
attrac
tive
5.7%
17.1
%6.
0%7.
3%7.
3%9.
9%41
.3%
5.5%
aw
ors
eas
attrac
tive
4.7%
7.8%
15.3
%19
.5%
19.0
%20
.8%
9.6%
3.4%
less
attrac
tive
7.0%
13.5
%18
.2%
14.8
%21
.0%
13.8
%8.
3%3.
4%a
hig
her
aneq
ual
asat
trac
tive
6.0%
4.4%
16.6
%21
.3%
14.8
%21
.6%
10.1
%5.
2%le
ssat
trac
tive
5.2%
10.9
%22
.1%
17.1
%22
.1%
13.5
%6.
2%2.
9%a
wors
eas
attrac
tive
10.4
%32
.5%
11.2
%8.
8%7.
0%10
.6%
14.3
%5.
2%le
ssat
trac
tive
40.5
%9.
9%7.
5%7.
3%5.
7%6.
5%6.
5%16
.1%
Not
es:Fo
rea
chposi
tionin
gst
rate
gy,th
era
nk
that
was
attrib
ute
dm
ost
freq
uen
tlyis
shad
edin
.
219
Downloaded By: [Haenlein, Michael] At: 07:56 11 December 2010
220 M. Haenlein and A. M. Kaplan
TABLE 8 Impact of Positioning Strategy on Stated Purchase and Retention Intentions
Sum of MeanVariable df Squares Squares F p
Acquisition analysis—Potential customers (N = 388)Price 1 1.10 1.10 0.2238 0.6362Network Quality (Network) 1 0.30 0.30 0.0566 0.8120Handset Attractiveness (Handset) 1 1.80 1.80 0.3577 0.5498Price × Network 1 8.30 8.30 1.6152 0.2039Price × Handset 1 7.30 7.30 1.4340 0.2312Network × Handset 1 9.70 9.70 1.9014 0.1680Price × Network × Handset 1 3.20 3.20 0.6228 0.4301Residuals 3,088 15,774.7 5.10
Retention analysis—Current customers (N = 385)Price 1 7.60 7.60 1.5834 0.2084Network Quality (Network) 1 30.30 30.30 6.3245 0.0120Handset Attractiveness (Handset) 1 7.60 7.60 1.5910 0.2073Price × Network 1 7.10 7.10 1.4856 0.2230Price × Handset 1 0.10 0.10 0.0264 0.8710Network × Handset 1 10.80 10.80 2.2564 0.1332Price × Network × Handset 1 2.70 2.70 0.5686 0.4509Residuals 3,064 14,668.8 4.80
Notes: Boldface represents variables that are significant on 5% level (i.e., where the p-value is below0.05).
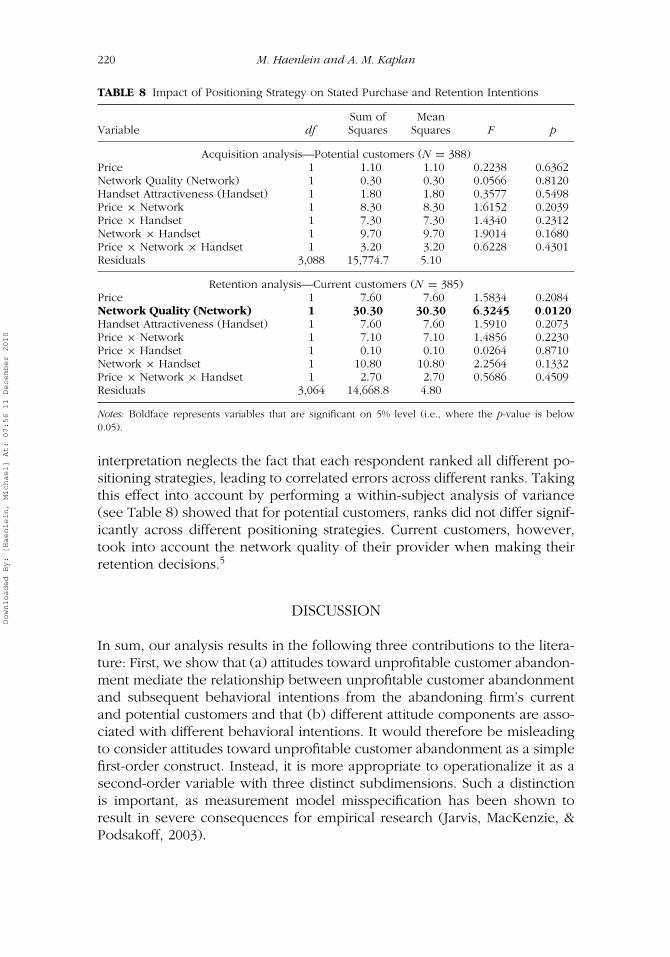
interpretation neglects the fact that each respondent ranked all different po-sitioning strategies, leading to correlated errors across different ranks. Takingthis effect into account by performing a within-subject analysis of variance(see Table 8) showed that for potential customers, ranks did not differ signif-icantly across different positioning strategies. Current customers, however,took into account the network quality of their provider when making theirretention decisions.5
DISCUSSION
In sum, our analysis results in the following three contributions to the litera-ture: First, we show that (a) attitudes toward unprofitable customer abandon-ment mediate the relationship between unprofitable customer abandonmentand subsequent behavioral intentions from the abandoning firm’s currentand potential customers and that (b) different attitude components are asso-ciated with different behavioral intentions. It would therefore be misleadingto consider attitudes toward unprofitable customer abandonment as a simplefirst-order construct. Instead, it is more appropriate to operationalize it as asecond-order variable with three distinct subdimensions. Such a distinctionis important, as measurement model misspecification has been shown toresult in severe consequences for empirical research (Jarvis, MacKenzie, &Podsakoff, 2003).
Downloaded By: [Haenlein, Michael] At: 07:56 11 December 2010
Reactions Toward Unprofitable Customer Abandonment 221
The distinction between different attitude components goes back tothe 1950s/1960s, when Rosenberg and Hovland (1960) were among thefirst to identify different classes of evaluative responses that respondentsshowed in reply to a stimulus. It has since been widely accepted and usedin psychology and consumer research, although only a few researchers haveempirically investigated the existence of different attitude components (seeOstrom, 1969, for a noteworthy exception). From a theoretical perspective,our article can be seen as additional evidence that this distinction is indeednecessary. From a practical viewpoint, our results represent a first step towarddeveloping a scale that can be used to measure attitudes toward unprofitablecustomer abandonment. Once such a scale is developed, it could be used byfirms implementing an abandonment strategy to assess the likely (indirect)abandonment cost associated with such an approach.
Second, our findings indicate that the majority of respondents react withaffective (263 respondents, 34.0%) or cognitive (223 respondents, 28.8%)responses toward unprofitable customer abandonment, whereas salient be-havioral attitude components are less frequent (147 respondents, 19.0%).Hence, the most common reactions deal with verbal statements of emo-tions/feelings (e.g., anger, disappointment) and beliefs (e.g., the perceptionof a lack of appropriate customer service) instead of intended actions. Inaddition, we show that consequences with direct damaging impact for theabandoning firm’s current customers (i.e., exit intention, voice intention) andthe evaluation of the abandonment act by potential customers (i.e., perceivedfairness, perceived value) are least favorable for the salience of behavioralattitude components. Given that such behavioral components are relativelyless frequent, this can be seen as an indication that unprofitable customerabandonment may be less costly for the abandoning firm than might bethought at first glance.
This speculation is also supported by the fact that although for the vastmajority of participants (584 respondents, 75.5%) the valence of their attitudeis negative, some clients perceive such information as either neutral (38respondents, 4.9%) or even positive (11 respondents, 1.4%). The literature inthe area of price fairness has regularly shown that consumers have a certainunderstanding of the constraints faced by companies and accept that firmsneed to make profit in order to survive (Kahneman, Knetsch, & Thaler, 1986).Based on our results, it appears that clients may equally understand that firmsthat decide to provide above-standard service to their best customers alsoneed to make savings among their unprofitable customers in order to remainprofitable overall.
Third, our results indicate that although unprofitable customer aban-donment can have a negative impact on current and potential customers theabandoning firm would like to retain, its negative consequences for currentcustomers can potentially be compensated for by improvements in core ser-vice quality (network quality in our case). For potential customers, however,
Downloaded By: [Haenlein, Michael] At: 07:56 11 December 2010
222 M. Haenlein and A. M. Kaplan
different positioning strategies in terms of price and/or quality do not have asignificant impact on stated purchase intentions. This provides an indicationthat unprofitable customer abandonment may hurt the acquisition processmore strongly than the retention process. Although abandoning firms mightbe able to protect their existing customers through quality improvements,they risk creating a negative image in the marketplace with substantial neg-ative impacts on future customer acquisitions.
NOTES
1. In total, five different levels of tie strength were included in our experimental design. However,a manipulation check (see Appendix D for details) revealed only two groups with significant differencesin tie strength.
2. Direct abandonment strategies refer to cases in which the abandoning firm explicitly statesits desire to exit the relationship. According to Baxter (1985), these strategies include the followingfour options: fait accompli (i.e., explicit declaration to the other party that the relationship is over),state-of-the-relationship talk (i.e., explicit statement of dissatisfaction and desire to exit the relationship),negotiated farewell (i.e., explicit communication between both parties to formally end the relationship),and attributional conflict (i.e., conflict about why the exit is necessary, triggered by the mutual desire toexit the relationship). Indirect abandonment strategies describe cases in which the abandoning firm triesto accomplish relationship dissolution without an explicit statement of this goal and are summarized inthe following four approaches: cost escalation (i.e., behavior to increase the relational cost of the otherparty), withdrawal (i.e., avoidance-based behavior to reduce relationship intimacy), pseudo de-escalation(i.e., false declaration of the desire to transform the relationship into one of reduced closeness), andfading away (i.e., implicit understanding that the relationship has ended).
3. We decided on network quality and handset attractiveness as indicators of perceived qualitybased on the SERVQUAL scale. We focused on the two dimensions reliability (i.e., ability to performthe promised service dependably and accurately) and tangibles (i.e., physical facilities, equipment, andappearance of personnel).
4. Rust and Cooil (1994) provided a set of tables for determining reliability for qualitative dataas a function of the number of judges, interrater agreement, and number of categories for two to fivecategories. In the case of five categories, a proportion of interjudge agreement of 0.64 results in a reliabilityestimate of 0.74 for two judges. Given that the number of categories in our study was more than twiceas large, reliability was likely greater than 0.74.
5. We appreciate that our finding that current customers place such strong emphasis on networkquality might also be an artifact of our study context (i.e., mobile phone industry), because some currentcustomers might be unable to switch providers because of lack of sufficient alternative network coverage.We thank one anonymous reviewer for bringing this point to our attention.
REFERENCES
Ajzen, I. (1991). The theory of planned behavior. Organizational Behavior andHuman Decision Processes, 50(2), 179–211.
Alajoutsijarvi, K., Moller, K., & Tahtinen, J. (2000). Beautiful exit: How to leave yourbusiness partner. European Journal of Marketing, 34, 1270–1289.
Bagozzi, R. P., Tybout, A. M., Craig, C. S., & Sternthal, B. (1979). The constructvalidity of the tripartite classification of attitudes. Journal of Marketing Research,16, 88–95.
Baker, M. J., & Churchill, G. A., Jr. (1977). The impact of physically attractive modelson advertising evaluations. Journal of Marketing Research, 14, 538–555.
Downloaded By: [Haenlein, Michael] At: 07:56 11 December 2010
Reactions Toward Unprofitable Customer Abandonment 223
Baxter, L. A. (1985). Accomplishing relationship disengagement. In S. Duck & D.Perlman (Eds.), Understanding personal relationships: An interdisciplinary ap-proach (pp. 243–265). London, England: Sage.
Berger, P. D., & Nasr, N. I. (1998). Customer lifetime value: Marketing models andapplications. Journal of Interactive Marketing, 12(1), 17–30.
Bhargava, H. K., & Feng, J. (2005). America OnLine’s Internet access service: Howto deter unwanted customers. Electronic Commerce Research and Applications,4(1), 35–48.
Bonifield, C., & Cole, C. (2007). Affective responses to service failure: Anger, regret,and retaliatory versus conciliatory responses. Marketing Letters, 18(1/2), 85–99.
Bougie, R., Pieters, R., & Zeelenberg, M. (2003). Angry customers don’t come back,they get back: The experience and behavioral implications of anger and dissat-isfaction in services. Journal of the Academy of Marketing Science, 31, 377–393.
Bowman, D., & Narayandas, D. (2004). Linking customer management effort tocustomer profitability in business markets. Journal of Marketing Research, 41,433–447.
Cox, E. P., III. (1980). The optimal number of response alternatives for a scale: Areview. Journal of Marketing Research, 17, 407–422.
Fishbein, M., & Ajzen, I. (1975). Belief, attitude, intention and behavior: An intro-duction to theory and research. Reading, MA: Addison-Wesley.
Folkes, V. S., Koletsky, S., & Graham, J. L. (1987). A field study of causal infer-ences and consumer reaction: The view from the airport. Journal of ConsumerResearch, 13, 534–539.
Frenzen, J. K., & Davis, H. L. (1990). Purchasing behavior in embedded markets.Journal of Consumer Research, 17, 1–12.
Gupta, S., Lehmann, D. R., & Stuart, J. A. (2004). Valuing customers. Journal ofMarketing Research, 41, 7–18.
Haenlein, M., & Kaplan, A. M. (2009). Unprofitable customers and their management.Business Horizons, 52(1), 89–97.
Haenlein, M., Kaplan, A. M., & Beeser, A. J. (2007). A model to determine customerlifetime value in a retail banking context. European Management Journal, 25,221–234.
Haenlein, M., Kaplan, A. M., & Schoder, D. (2006). Valuing the real option of aban-doning unprofitable customers when calculating customer lifetime value. Jour-nal of Marketing, 70(3), 5–20.
Helm, S. (2004). Customer valuation as a driver of relationship dissolution. Journalof Relationship Marketing, 3(4), 77–91.
Hibbard, J. D., Kumar, N., & Stern, L. W. (2001). Examining the impact of destructiveacts in marketing channel relationships. Journal of Marketing Research, 38,45–61.
Hirschman, A. O. (1970). Exit, voice and loyalty: Responses to decline in firms, orga-nizations and states. Cambridge, MA: Harvard University Press.
Homburg, C., Droll, M., & Totzek, D. (2008). Customer prioritization: Does it payoff, and how should it be implemented? Journal of Marketing, 72(5), 110–130.
Jarvis, C. B., MacKenzie, S. B., & Podsakoff, P. M. (2003). A critical review of constructindicators and measurement model misspecification in marketing and consumerresearch. Journal of Consumer Research, 30, 199–218.
Downloaded By: [Haenlein, Michael] At: 07:56 11 December 2010

224 M. Haenlein and A. M. Kaplan
Kahneman, D., Knetsch, J. L., & Thaler, R. (1986). Fairness as a constraint on profitseeking: Entitlements in the market. American Economic Review, 76, 728–741.
Kaplan, R. S., & Anderson, S. R. (2004). Time-driven activity-based costing. HarvardBusiness Review, 82(11), 131–138.
Kumar, N., Scheer, L. K., & Steenkamp, J.-B. E. M. (1995). The effects of supplierfairness on vulnerable resellers. Journal of Marketing Research, 32, 54–65.
Likert, R. (1932). A technique for the measurement of attitudes. Archives of Psychol-ogy, 140, 55.
Mittal, V., Sarkees, M., & Murshed, F. (2008). The right way to manage unprofitablecustomers. Harvard Business Review, 86(4), 95–102.
Mohl, B. (2003). Facing their demons: Firms intentionally use poor service otherdirect methods to weed out profit-zapping customers. The Boston Globe.
Muthen, L. K., & Muthen, B. O. (1998–2007). Mplus user’s guide (5th ed.). LosAngeles, CA: Muthen & Muthen.
Niraj, R., Gupta, M., & Narasimhan, C. (2001). Customer profitability in a supplychain. Journal of Marketing, 65(3), 1–16.
Oliver, R. L. (1999). Whence consumer loyalty? Journal of Marketing, 63(4), 33–44.Ostrom, T. M. (1969). The relationship between the affective, behavioral and cogni-
tive components of attitude. Journal of Experimental Psychology, 5, 12–30.Payne, A., & Frow, P. (2005). A strategic framework for customer relationship man-
agement. Journal of Marketing, 69(4), 167–176.Ping, R. A., Jr. (1993). The effects of satisfaction and structural constraints on re-
tailer exiting, voice, loyalty, opportunism, and neglect. Journal of Retailing, 69,320–352.
Ping, R. A., Jr. (1997). Voice in business-to-business relationships: Cost-of-exit anddemographic antecedents. Journal of Retailing, 73, 261–281.
Ping, R. A., Jr. (1999). Unexplored antecedents of exiting in a marketing channel.Journal of Retailing, 75, 218–241.
Pressey, A. D., & Mathews, B. P. (2003). Jumped, pushed or forgotten: Approachesto dissolution. Journal of Marketing Management, 19(1/2), 131–155.
Rosenberg, M. J., & Hovland, C. I. (1960). Cognitive, affective and behavioral com-ponents of attitudes. In C. I. Hovland & M. J. Rosenberg (Eds.), Attitude orga-nization and change (1–14). New Haven, CT: Yale University Press.
Rosenblum, D., Tomlinson, D., & Scott, L. (2003). Bottom-feeding for blockbusterbusinesses. Harvard Business Review, 81(3), 52–59.
Rozeboom, W. W. (1979). Sensitivity of a linear composite of predictor items todifferential item weighting. Psychometrika, 44, 289–296.
Rusbult, C. E., Farrell, D., Rogers, G., & Mainous, A. G., IIII. (1988). Impact of ex-change variables on exit, voice, loyalty and neglect: An integrative model ofresponses to declining job satisfaction. Academy of Management Journal, 31,599–627.
Rust, R. T., & Cooil, B. (1994). Reliability measures for qualitative data: Theory andimplications. Journal of Marketing Research, 31, 1–14.
Shapiro, B. P., Rangan, V. K., Moriarty, R. T., & Ross, E. B. (1987). Manage customersfor profits (not just sales). Harvard Business Review, 65(5), 101–108.
Stevens, S. S. (1946, June 7). On the theory of scales of measurement. Science, 103,677–680.
Sweeney, J. C., & Soutar, G. N. (2001). Customer perceived value: The developmentof a multiple item scale. Journal of Retailing, 77, 203–220.
Downloaded By: [Haenlein, Michael] At: 07:56 11 December 2010
Reactions Toward Unprofitable Customer Abandonment 225
Tynan, C. (1997). A review of the marriage analogy in relationship marketing. Journalof Marketing Management, 13, 695–703.
van Hoek, R., & Evans, D. (2005). When good customers are bad. Harvard BusinessReview, 83(9), 19.
Weiner, B. (1985). “Spontaneous” causal thinking. Psychological Bulletin, 97, 74–84.Xia, L., Monroe, K. B., & Cox, J. L. (2004). The price is unfair! A conceptual framework
of price fairness perceptions. Journal of Marketing, 68(4), 1–15.Zeithaml, V. A. (1988). Consumer perceptions of price, quality, and value: A means-
end model and synthesis of evidence. Journal of Marketing, 52(3), 2–22.
APPENDIX A
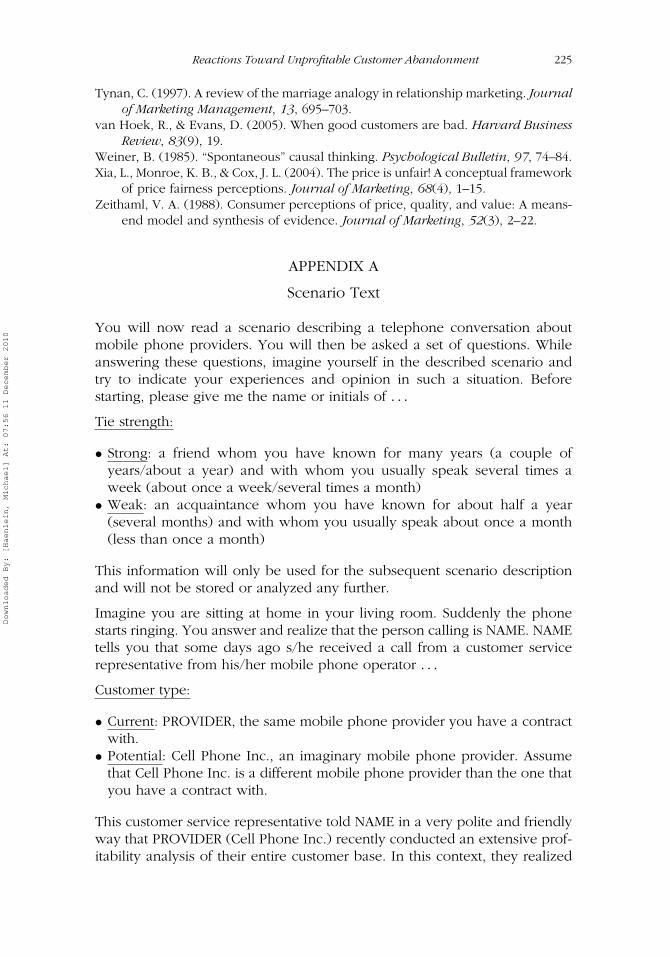
Scenario Text
You will now read a scenario describing a telephone conversation aboutmobile phone providers. You will then be asked a set of questions. Whileanswering these questions, imagine yourself in the described scenario andtry to indicate your experiences and opinion in such a situation. Beforestarting, please give me the name or initials of . . .
Tie strength:
• Strong: a friend whom you have known for many years (a couple ofyears/about a year) and with whom you usually speak several times aweek (about once a week/several times a month)
• Weak: an acquaintance whom you have known for about half a year(several months) and with whom you usually speak about once a month(less than once a month)
This information will only be used for the subsequent scenario descriptionand will not be stored or analyzed any further.
Imagine you are sitting at home in your living room. Suddenly the phonestarts ringing. You answer and realize that the person calling is NAME. NAMEtells you that some days ago s/he received a call from a customer servicerepresentative from his/her mobile phone operator . . .
Customer type:
• Current: PROVIDER, the same mobile phone provider you have a contractwith.
• Potential: Cell Phone Inc., an imaginary mobile phone provider. Assumethat Cell Phone Inc. is a different mobile phone provider than the one thatyou have a contract with.
This customer service representative told NAME in a very polite and friendlyway that PROVIDER (Cell Phone Inc.) recently conducted an extensive prof-itability analysis of their entire customer base. In this context, they realized
Downloaded By: [Haenlein, Michael] At: 07:56 11 December 2010
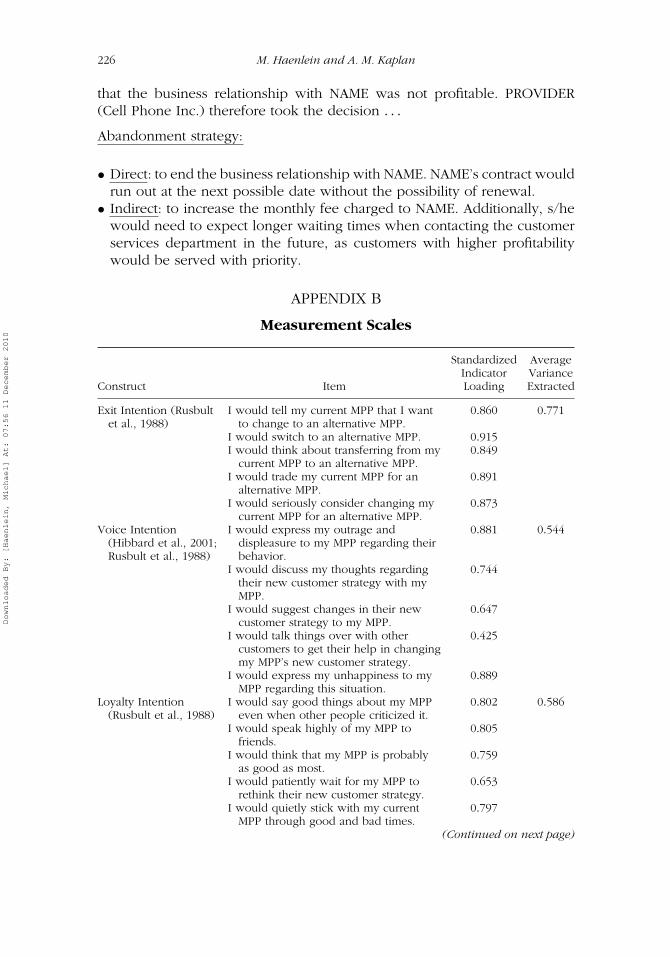
226 M. Haenlein and A. M. Kaplan
that the business relationship with NAME was not profitable. PROVIDER(Cell Phone Inc.) therefore took the decision . . .
Abandonment strategy:
• Direct: to end the business relationship with NAME. NAME’s contract wouldrun out at the next possible date without the possibility of renewal.
• Indirect: to increase the monthly fee charged to NAME. Additionally, s/hewould need to expect longer waiting times when contacting the customerservices department in the future, as customers with higher profitabilitywould be served with priority.
APPENDIX B
Measurement Scales
Standardized AverageIndicator Variance
Construct Item Loading Extracted
Exit Intention (Rusbultet al., 1988)
I would tell my current MPP that I wantto change to an alternative MPP.
0.860 0.771
I would switch to an alternative MPP. 0.915I would think about transferring from my
current MPP to an alternative MPP.0.849
I would trade my current MPP for analternative MPP.
0.891
I would seriously consider changing mycurrent MPP for an alternative MPP.
0.873
Voice Intention(Hibbard et al., 2001;Rusbult et al., 1988)
I would express my outrage anddispleasure to my MPP regarding theirbehavior.
0.881 0.544
I would discuss my thoughts regardingtheir new customer strategy with myMPP.
0.744
I would suggest changes in their newcustomer strategy to my MPP.
0.647
I would talk things over with othercustomers to get their help in changingmy MPP’s new customer strategy.
0.425
I would express my unhappiness to myMPP regarding this situation.
0.889
Loyalty Intention(Rusbult et al., 1988)
I would say good things about my MPPeven when other people criticized it.
0.802 0.586
I would speak highly of my MPP tofriends.
0.805
I would think that my MPP is probablyas good as most.
0.759
I would patiently wait for my MPP torethink their new customer strategy.
0.653
I would quietly stick with my currentMPP through good and bad times.
0.797
(Continued on next page)
Downloaded By: [Haenlein, Michael] At: 07:56 11 December 2010
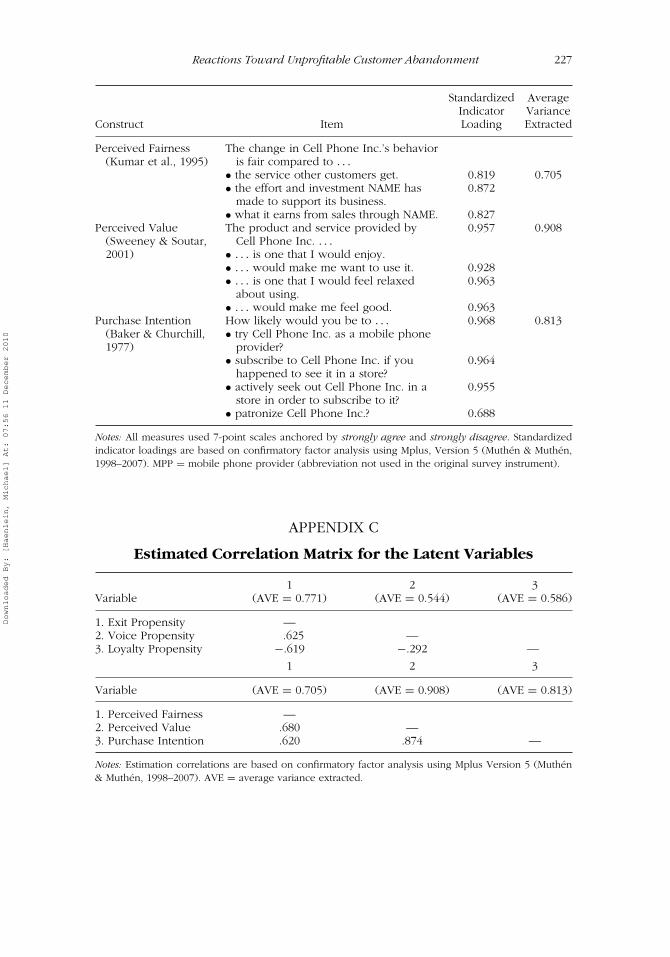
Reactions Toward Unprofitable Customer Abandonment 227
Standardized AverageIndicator Variance
Construct Item Loading Extracted
Perceived Fairness(Kumar et al., 1995)
The change in Cell Phone Inc.’s behavioris fair compared to . . .
• the service other customers get. 0.819 0.705• the effort and investment NAME has
made to support its business.0.872
• what it earns from sales through NAME. 0.827Perceived Value
(Sweeney & Soutar,2001)
The product and service provided byCell Phone Inc. . . .
• . . . is one that I would enjoy.
0.957 0.908
• . . . would make me want to use it. 0.928• . . . is one that I would feel relaxed
about using.0.963
• . . . would make me feel good. 0.963Purchase Intention
(Baker & Churchill,1977)
How likely would you be to . . .• try Cell Phone Inc. as a mobile phone
provider?
0.968 0.813
• subscribe to Cell Phone Inc. if youhappened to see it in a store?
0.964
• actively seek out Cell Phone Inc. in astore in order to subscribe to it?
0.955
• patronize Cell Phone Inc.? 0.688
Notes: All measures used 7-point scales anchored by strongly agree and strongly disagree. Standardizedindicator loadings are based on confirmatory factor analysis using Mplus, Version 5 (Muthen & Muthen,1998–2007). MPP = mobile phone provider (abbreviation not used in the original survey instrument).
APPENDIX C
Estimated Correlation Matrix for the Latent Variables
1 2 3Variable (AVE = 0.771) (AVE = 0.544) (AVE = 0.586)
1. Exit Propensity —2. Voice Propensity .625 —3. Loyalty Propensity −.619 −.292 —
1 2 3
Variable (AVE = 0.705) (AVE = 0.908) (AVE = 0.813)
1. Perceived Fairness —2. Perceived Value .680 —3. Purchase Intention .620 .874 —
Notes: Estimation correlations are based on confirmatory factor analysis using Mplus Version 5 (Muthen& Muthen, 1998–2007). AVE = average variance extracted.
Downloaded By: [Haenlein, Michael] At: 07:56 11 December 2010
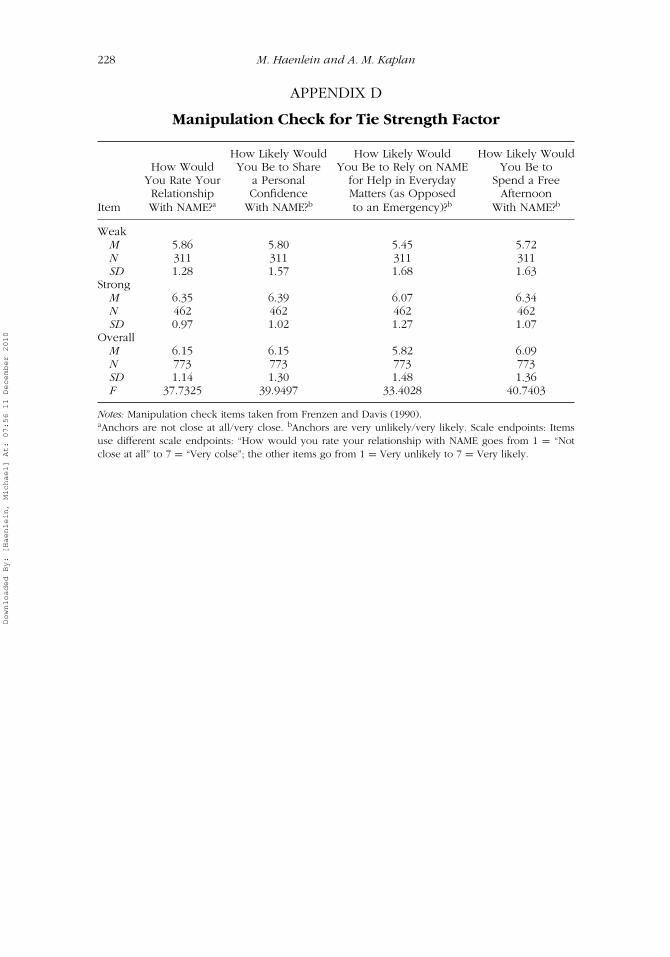
228 M. Haenlein and A. M. Kaplan
APPENDIX D
Manipulation Check for Tie Strength Factor
How Likely Would How Likely Would How Likely WouldHow Would You Be to Share You Be to Rely on NAME You Be to
You Rate Your a Personal for Help in Everyday Spend a FreeRelationship Confidence Matters (as Opposed Afternoon
Item With NAME?a With NAME?b to an Emergency)?b With NAME?b
WeakM 5.86 5.80 5.45 5.72N 311 311 311 311SD 1.28 1.57 1.68 1.63
StrongM 6.35 6.39 6.07 6.34N 462 462 462 462SD 0.97 1.02 1.27 1.07
OverallM 6.15 6.15 5.82 6.09N 773 773 773 773SD 1.14 1.30 1.48 1.36F 37.7325 39.9497 33.4028 40.7403
Notes: Manipulation check items taken from Frenzen and Davis (1990).aAnchors are not close at all/very close. bAnchors are very unlikely/very likely. Scale endpoints: Itemsuse different scale endpoints: “How would you rate your relationship with NAME goes from 1 = “Notclose at all” to 7 = “Very colse”; the other items go from 1 = Very unlikely to 7 = Very likely.
Downloaded By: [Haenlein, Michael] At: 07:56 11 December 2010