analysis of manufacturing of railways bogies … doc/2019/ijmie_july2019/ijmra-15908.pdfthe latest...
TRANSCRIPT

International Journal of Management, IT & Engineering Vol. 9 Issue 7, July 2019,
ISSN: 2249-0558 Impact Factor: 7.119
Journal Homepage: http://www.ijmra.us, Email: [email protected]
Double-Blind Peer Reviewed Refereed Open Access International Journal - Included in the International Serial
Directories Indexed & Listed at: Ulrich's Periodicals Directory ©, U.S.A., Open J-Gage as well as in Cabell’s
Directories of Publishing Opportunities, U.S.A
354 International journal of Management, IT and Engineering
http://www.ijmra.us, Email: [email protected]
ANALYSIS OF MANUFACTURING OF RAILWAYS
BOGIES THROUGH QUALITY CONTROL TOOLS
Nitesh Kumar*
D. R. Prajapati**
ABSTRACT
It is very important improve and maintain the quality of manufactured products now a
days to survive in global or local market. Some quality control tools have been applied to
one of the leading coach manufacturing industry, located in norther India. ThePareto
chart, Fishbone diagram etc. have been applied to find the root causes of failures of
components and improving the quality of manufacturing products. It has been established
that the organization has numerous issues particularly in dismissal and modifications in
the assembly lines. Various processes like CNC cutting, welding, machining, assembly of
parts are involved, where probability of defects are more and improvement is required.
Pareto chart shows that fault in control arms accounted for 35.3%, while Ankerlink block
accounts for 29.35% and gap between pair of control arms are approximately 19%.
Keywords: Quality Control Tools, Pareto chart, Cause & Effect Diagram., Railways coach
manufacturing
* PG student, Department of Mechanical Engineering,Punjab Engineering College
(Deemed to be University), Chandigarh
** Professor, Department of Mechanical Engineering,Punjab Engineering College (Deemed
to be University), Chandigarh

ISSN: 2249-0558 Impact Factor: 7.119
355 International journal of Management, IT and Engineering
http://www.ijmra.us, Email: [email protected]
1. INTRODUCTION
The latest challenge in the current worldwide market is an issue converting into a huge
requirement for the proceeding with advancement of the manufacturing. Consequently, world
business is ceaselessly in scan for the aggressive edge because of the developing requests of
client needs and desires. Quality has a significant job in the business procedure over the whole
association, to be increasingly proficient and viable in the worldwide market, in this way
improving profitability and client dedication just as increment piece of the overall industry. It
isn't just important to decrease the wastage, yet additionally to fulfil client's desires, cost
decreases and constant upgrades to get by in profoundly focused condition.Quality improvement
is an essential prerequisite in any production framework that sends items or administration as its
yields. Hence, it is a noteworthy objective in any assembling and manufacturing industry.
Assembling and manufacturing industries spend a great deal of endeavours in keeping up and
improving quality of their items utilizing an assortment of quality control tools and methods.
Quality control tools can be connected in item improvement, generation and showcasing
additionally. Quality concerns influence the whole association in each aggressive condition. It
isn't just important to decrease the wastage, yet in addition to fulfil client's desires, nonstop cost
decreases and ceaseless enhancements to make due in exceedingly aggressive condition. The
quality control is meant to fulfil the clients by conveyance of imperfection free items. The
exploration is meant to research the fruitful Implementation of quality control tools and
Techniques in assembling and manufacturing industry. Figure 1 shows the Quality control flow
chart.

ISSN: 2249-0558 Impact Factor: 7.119
356 International journal of Management, IT and Engineering
http://www.ijmra.us, Email: [email protected]
Fig.1 Quality Control Flow Chart
The use of Quality control tools is significant, as it could improve process execution by
diminishing item fluctuation and improve generation effectiveness by diminishing scarp and
modify. These tools are helpful in (i) Minimization of the dismissal (ii) Enhance consumer
loyalty by decrease in client complaints. (iii) Beneficial for decreasing the generation cost (iv)
Finding the underlying drivers of issue and improving production execution.
1.1 Quality control tools and techniques
By understands the processes with the goal that they can be improved by methods for an orderly
methodology requires the learning of a straightforward pack of tools or methods. The viable
utilization of these tools and methods requires their application by the general people who really
deal with the procedures, and their responsibility to increase quality may be achievable and
guaranteed that the executives thinks about improving quality. The tools and procedures most
normally utilized in procedure improvement are:
(i) Process flowcharting (ii) Cause and Effect diagram (iii) Brainstorming
(iv) Pareto investigation (v) Control Charts (vi) Check sheets
(vii) Scatter graphs (viii) Histograms and (ix) Failure Mode Effect Analysis (FMEA)
These tools are very common and popular, so details of these tools are not required in this paper.
2. Literature Review
Gaafar and Keats (1984)focused on the Statistical Process Control (SPC) implementation phase
in an effort to underline that SPC is not just control charts, and that many steps have to be
accomplished before these charts are used. In addition, they highlighted the role of training and
presented it as an ongoing process which involves everyone in the organization. Chan et al.

ISSN: 2249-0558 Impact Factor: 7.119
357 International journal of Management, IT and Engineering
http://www.ijmra.us, Email: [email protected]
(2003) contemplated consolidating the consequence of two charts to be specific x-diagramand x-
bar graph. Control charts assumed a significant job in observing the presentation of activity
forms, as far back as their development.
Saniga et al. (2006)looked at the expenses of a monetarily planned CUSUM control diagram and
a typical Shewhart control charts, the X–bar graph for some setups of parameters. They found
that there are recognizable locales where X–bar graph can be utilized with no considerable
monetary weakness.Prajapati and Mahapatra (2007)examined an extremely straightforward and
powerful structure of proposed X-bar and R charts to screen the procedure mean and standard
deviation. The idea of the proposed charts depends on the aggregate of chi-square (χ²) to register
and analyze Average Run Lengths (ARLs). They compared their proposed charts with VSS, VSI
and VSSI joint plans proposed by Costa (1999).
Fricker (2009) portrayed a system for advancing the Shewhart x-diagram working on parallel
creation lines in a production line. They utilized non-direct programming to suitably set the
diagram control limits which consolidates the data about the likelihood of every generation line
leaving control. By utilizing this methodology, production lines can set their control frameworks
to ideally recognize crazy conditions. The objective is to expand the production line wide
likelihood of recognizing a crazy condition exposed to a requirement on the normal number.Das
and Sachan (2013) discussed the importance of control charts in detecting the assignable cause of
variation. They discussed the assumption under which these charts are developed. They
proposed some alternatives control charts for controlling location parameters based on some
robust estimators, because the present charts are not used with assumption in real
situations.Prajapati and Singh (2014) processed ARLs (normal run length) at different
arrangements of parameters of the X diagram by reproduction, utilizing MATLAB. The
presentation of the graph is estimated as far as the normal run length (ARL), which is the normal
number of tests before getting a crazy sign. They made an endeavor to counter autocorrelation by
planning the X charts utilizing cautioning limits. They proposed different ideal plans for various
dimension of connection.

ISSN: 2249-0558 Impact Factor: 7.119
358 International journal of Management, IT and Engineering
http://www.ijmra.us, Email: [email protected]
Singh and Prajapati (2016) examined that both management and employees in the service sector
can take advantage of SPC techniques to analyse processes and procedures. Processes may be
streamlined to save employee hours. Procedures that lead to mistakes may be changed so that the
incidence of mistakes is reduced or eliminated. Employee involvement in the use of charts and
check sheets can lead to valuable input in improving the service. It is found from the Pareto
analysis that maximum percentage of rejection (33.75%) is due to drive shaft run-outs defects.
Other two important causes are Crank shaft bearing diameter undersize & oversize (14.61%) and
under size of cylinder block depth (13.28%) respectively.Everard and Hardjono (2018)states In
quality administration four standards can be observed: the Empirical, the Reference, the
Reflective and the Emergence Paradigm. Right now the Emergence Paradigm is the least created.
Following the Emergence Paradigm would mean the fuse of frameworks thinking in initiative
preparing, quality administration hypothesis and practices. Rehearsing quality administration
from the Emergence Paradigm would embroil for an association to be available to change and its
specific circumstance.
Chen et al. (2014) examined that first attempt at developing yield based PCIs for non normal
processes. In the literature, the use of classical PCIs such as Cp and Cpk is based on the
normality assumption of the process characteristic X. If X is non normal, the percentile-based
PCIs cannot quantify the process yield, which limits their usefulness in various applications such
as the supplier-selection problem. On the contrary, our proposed PCIs degenerate to the classical
PCIs when X is normally distributed, and they have the same quantitative interpretation to the
process capability
3.0 Industry and Processes
This rail coach factory was laid on 17th
August 1985 in the northern part of India and was a
timely step towards making good shortfall and complementing the coach manufacturing capacity
of Railway’s other manufacturing units.The present production capacity of this plant is
approximately 2000 coaches per year. Various kinds of coaches- AC, Non-AC, Chair Car,Tejas,
MG Diesel Electrical Multiple Units, Main Line Electrical Multiple Units etc. are manufactured
in this plant of India. Flow process chart for manufacturing of railways bogies is shown in Figure
2.

ISSN: 2249-0558 Impact Factor: 7.119
359 International journal of Management, IT and Engineering
http://www.ijmra.us, Email: [email protected]
Plate
Straightening
Prof i le
Cutt ingEdge
PreparingPlate B last ing
Press Break For
Bending
Bolster Stage Bolster 2 nd
Stage
Ful l Welding Of
Bolster
Bolster Stress
ReleaseBogie S ide
Frame
Line
Bla
stin
g A
nd
Pa
intin
g
S ide Frame
1 s t Stage
Side
Frame 2 nd
Stage
Side Frame
WeldingYaw Damper
Assembly
Yaw Damper
Welding
Break Beam
Assembly LineBreak Beam
Assembly
Break Beam
WeldingAssembly Of Bogie
Frame
Welding Of
Bogie
FrameBogie Frame
Stress Release
Fig.2 Flow process chart for manufacturing of bogies
4. RESEARCH METHODOLOGY
The Objective of this paper is to find the defects of the components and improve the
manufacturing line using Quality control tools in assembly process so as to decrease the
dismissals, and to upgrade client satisfaction.
4.1Data Collection
ISSN: 2249-0558 Impact Factor: 7.119
360 International journal of Management, IT and Engineering
http://www.ijmra.us, Email: [email protected]
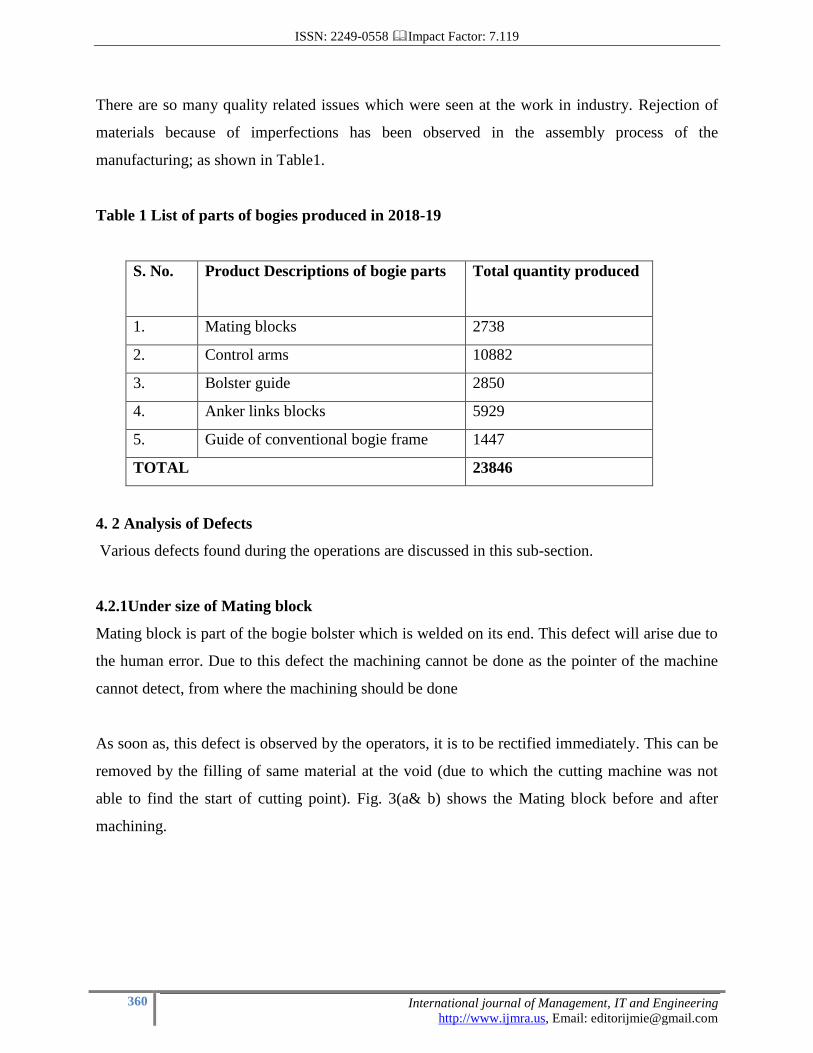
There are so many quality related issues which were seen at the work in industry. Rejection of
materials because of imperfections has been observed in the assembly process of the
manufacturing; as shown in Table1.
Table 1 List of parts of bogies produced in 2018-19
S. No. Product Descriptions of bogie parts
Total quantity produced
1. Mating blocks 2738
2. Control arms 10882
3. Bolster guide 2850
4. Anker links blocks 5929
5. Guide of conventional bogie frame 1447
TOTAL 23846
4. 2 Analysis of Defects
Various defects found during the operations are discussed in this sub-section.
4.2.1Under size of Mating block
Mating block is part of the bogie bolster which is welded on its end. This defect will arise due to
the human error. Due to this defect the machining cannot be done as the pointer of the machine
cannot detect, from where the machining should be done
As soon as, this defect is observed by the operators, it is to be rectified immediately. This can be
removed by the filling of same material at the void (due to which the cutting machine was not
able to find the start of cutting point). Fig. 3(a& b) shows the Mating block before and after
machining.

ISSN: 2249-0558 Impact Factor: 7.119
361 International journal of Management, IT and Engineering
http://www.ijmra.us, Email: [email protected]
(a) (b)
Fig. 3 (a) Mating block before machining and (b) Mating block after machining
4.2.2Fault in Control Arm
The Figure 4 shows the control arms; which are welded on the side frame of the bogie. These are
used for the fitting of the dampers. This defect occurs when machine did not cut the
circumference with proper depth, as shown in Figure 4(b).
(a) (b)
Fig.4 (a) control arm before cutting by machine and(b) control arm with improper depth of
cutting
If this is not rectified according to drawing then no further operations can be done due to
dimensional error in the control arm circumference.
4.2.3 Gap between pair of control arms
There are 8 control arms used in the assembly of single bogie. They are always welded in pairs,
so there are four pairs welded to the side frames of the bogie. Sometimes; during the welding the
required gap between the control arm pairs may not according to the drawing.To rectify this
defect; a rod will be welded between the pair of the control arms, so during the handling or doing

ISSN: 2249-0558 Impact Factor: 7.119
362 International journal of Management, IT and Engineering
http://www.ijmra.us, Email: [email protected]
other operations the gap between the pairs will remains same but when this assembly will go to
the wheel assembly this rod is required to be cut, as shown in Figure 5 (a & b).
(a) (b)
Fig.5 (a) Gap between control arms and (b) Gap between control arms after rectification
4.2.4 Unequal levelling of Bolster’s guide holes
This defect occurs in the bolster guide hole and this guide hole is used to assemble the bolster
with the bogie frame. Figure 6 (a & b) shows the bolster guide holes of both types.
(a) (b)
Fig.6 (a)Improper level of bolster guide hole and (b) rectified guide hole after machining
and boring
This error can be rectified by heating the unlevelled surface, and now machining can be done
properly. There are 4 guide holes on the bolster
4.2.5 Ankerlink Blocks
The Ankerlink blocks are welded on the cross beams. These are welded in pair. There are 2 pairs
of Ankerlink block in one bogie. These blocks are used to support the traction centre which is
used for the fitting of bolster pin which will come through traction centre.This defect occurs due

ISSN: 2249-0558 Impact Factor: 7.119
363 International journal of Management, IT and Engineering
http://www.ijmra.us, Email: [email protected]
to improper welding but this defect may be rectified by heating.Fig.7 shows the Ankerlink blocks
with improper gap and animated view of the setup.
(a) (b)
Fig. 7 (a) Ankerlink blocks with improper gap and (b) Animated view of the setup
4.2.6 Distortion in guide of bogie frame
The guide of the bogie is used to bring bogie to a lower position. Sometimes, there is a distortion
in this guide, as it gets tilted in one direction due to the improper welding.This defect can reduce
the life of the bogies. Fig.8 shows the distortion in guide of bogie frames.
Fig. 8 Distortion in guide of bogie frames
ISSN: 2249-0558 Impact Factor: 7.119
364 International journal of Management, IT and Engineering
http://www.ijmra.us, Email: [email protected]
5. Application of Quality control tools:
In this paper two quality tools namely; Pareto Chart and Cause & Effect diagrams are used to
find the numbers and percentages of causes of defects and their possible rectification to improve
the quality of the products/ assembly of the Railways.
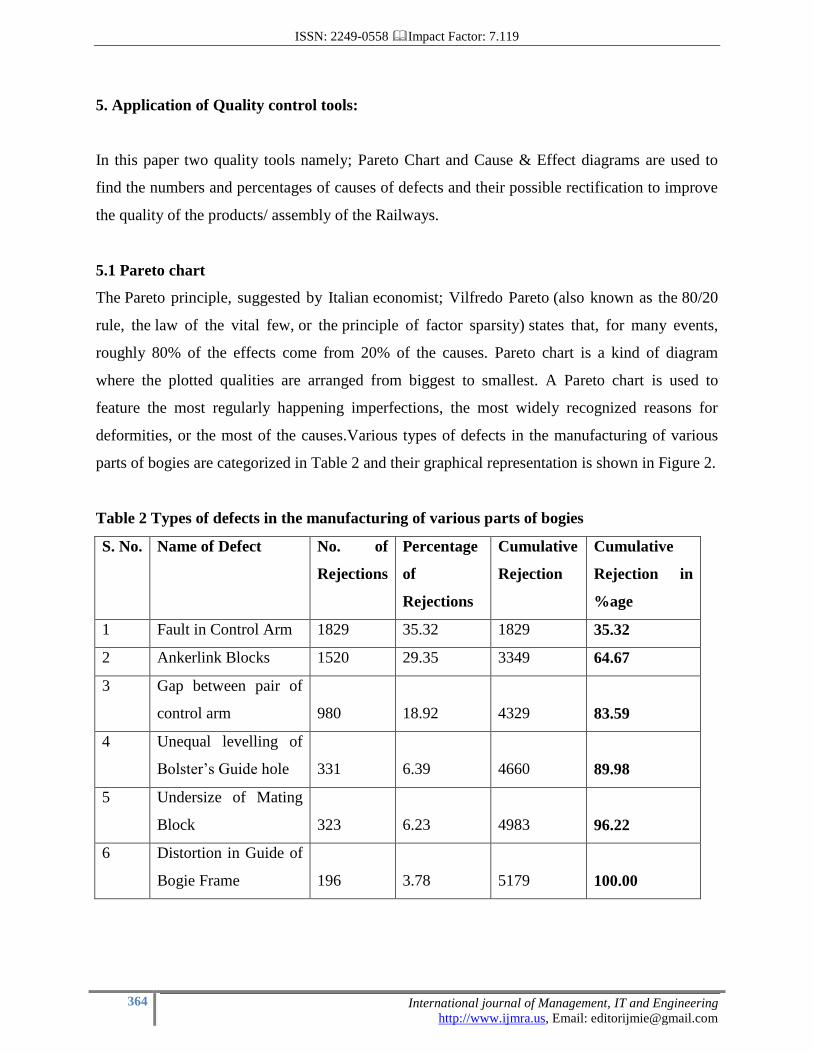
5.1 Pareto chart
The Pareto principle, suggested by Italian economist; Vilfredo Pareto (also known as the 80/20
rule, the law of the vital few, or the principle of factor sparsity) states that, for many events,
roughly 80% of the effects come from 20% of the causes. Pareto chart is a kind of diagram
where the plotted qualities are arranged from biggest to smallest. A Pareto chart is used to
feature the most regularly happening imperfections, the most widely recognized reasons for
deformities, or the most of the causes.Various types of defects in the manufacturing of various
parts of bogies are categorized in Table 2 and their graphical representation is shown in Figure 2.
Table 2 Types of defects in the manufacturing of various parts of bogies
S. No. Name of Defect No. of
Rejections
Percentage
of
Rejections
Cumulative
Rejection
Cumulative
Rejection in
%age
1 Fault in Control Arm 1829 35.32 1829 35.32
2 Ankerlink Blocks 1520 29.35 3349 64.67
3 Gap between pair of
control arm 980 18.92 4329 83.59
4 Unequal levelling of
Bolster’s Guide hole 331 6.39 4660 89.98
5 Undersize of Mating
Block 323 6.23 4983 96.22
6 Distortion in Guide of
Bogie Frame 196 3.78 5179 100.00

ISSN: 2249-0558 Impact Factor: 7.119
365 International journal of Management, IT and Engineering
http://www.ijmra.us, Email: [email protected]
Fig.9 Pareto chart for analysis of defects in manufacturing in bogie shop
It is found from the Pareto chart that fault in control arms accounted for 35.3%, while is
Ankerlink block accounts for 29.35%. Similarly, defects due to gap between pair of control arms
areapproximately 19%. These are the main defects which are responsible for about 84% of
defects. So for these defects, Cause and Effect diagrams for each one are shown in the following
sub-section.
1829
1520
980
331 323
196
35.3
64.6
83.5
89.9
96.2100
0
10
20
30
40
50
60
70
80
90
100
0
200
400
600
800
1000
1200
1400
1600
1800
2000
Fault In Control Arm
Ankerlink Blocks
Gap Between One Pair Of Control Arm
Unequal Levelling Of
Bolster’s Guide Hole
Less Size Of Mating Block
Distortion In Guide Of Bogie
Frame

ISSN: 2249-0558 Impact Factor: 7.119
366 International journal of Management, IT and Engineering
http://www.ijmra.us, Email: [email protected]
5.2 Cause and Effect or Fishbone diagram(Ishikawa diagram)
Cause and Effect diagram are frequently arranged into four major’s categories. These categories
can be anything: Manpower, Methods, Materials and Machinery. Figure 10 shows the Cause and
effect diagram for fault in control arm connection.
Fig 10 Cause and effect diagram for fault in control arm connection
Figure 11 shows the Cause and effect diagram for fault in deflection of Ankerlink blocks.
Not controlled parameters Machine
Men Methods
Environment
conditions
Low machine
maintenance
Fault in Control
Arm
Improper (high/low)
current welding pass
Contact
resistance
Worker’s
skills
Work
instruction not
implemented
Casual handling
during connection
Improper heating
treatment
Materials Machine
Men Methods
improper electrode size
wrong equipment use during connection
Deflections of
Ankerlink blocks
after welding
Fluctuation during welding
low material inspection
welding training
Work instruction not implemented
Casual handling during connection
Heat treatment

ISSN: 2249-0558 Impact Factor: 7.119
367 International journal of Management, IT and Engineering
http://www.ijmra.us, Email: [email protected]
Fig.11Cause and effect diagram for fault in deflection of Ankerlink blocks
Figure 12 shows the Cause and effect diagram for gap between a pair of control arms.
Fig 12 Cause and effect diagram for gap between a pair of control arms
5.3 Suggested action plans
Tables 3, 4 and 5 present the corrective action plans to improve the quality of products.
Tables 3 Action Plan for faults in Control arm
Category Suggested actions
MACHINE (i) To give the maintenance to the machine time to time, so it will give
no fluctuation.
(ii) Set appropriate current of welding machine according to the
Materials Machine
Men Methods
Filler material specification
Wrong equipment use during connection
Gap between a pair
of control arm
improper clearance Base material specification
Welding skills
Work instruction not implemented
Drawing and specification
Improper heat treatment

ISSN: 2249-0558 Impact Factor: 7.119
368 International journal of Management, IT and Engineering
http://www.ijmra.us, Email: [email protected]
requirement.
MEN (i) To give the required training to the worker.
(ii) To give every machine instruction to the worker to avoid the
deformities.
METHOD (i) Do not do any casual handling during the connection.
(ii) To give right amount of heat during treatment.
Tables 4 Action plan for deflection in Ankerlink blocks
Category Suggested actions
MATERIAL (i) Must use right kind of electrode to welding.
(ii) Must do the inspection of the material.
MACHINE (i) Use right equipment during welding.
(ii)Set appropriate current of welding machine according to the
requirement.
MEN (i) Give right welding training to the worker.
(ii) Give every machine instruction to the worker to avoid the
deformities.
METHOD (i) Avoid casual handling
(ii) Appropriate heat treatment after welding
Tables 5 Action plan for gap between a pair of control arms
Type Suggested actions
MATERIAL (i) Study the specification of filler material
(ii) Study the specification of base material
MACHINE (i) Use right equipment during connection
ISSN: 2249-0558 Impact Factor: 7.119
369 International journal of Management, IT and Engineering
http://www.ijmra.us, Email: [email protected]
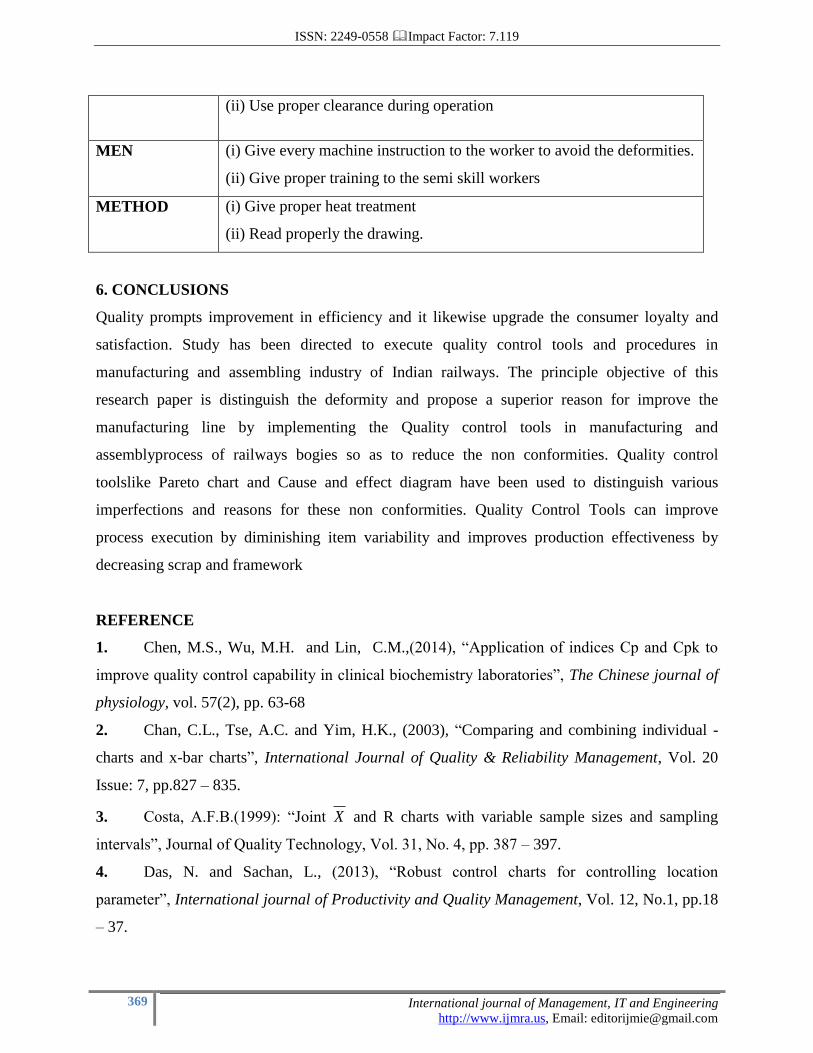
(ii) Use proper clearance during operation
MEN (i) Give every machine instruction to the worker to avoid the deformities.
(ii) Give proper training to the semi skill workers
METHOD (i) Give proper heat treatment
(ii) Read properly the drawing.
6. CONCLUSIONS
Quality prompts improvement in efficiency and it likewise upgrade the consumer loyalty and
satisfaction. Study has been directed to execute quality control tools and procedures in
manufacturing and assembling industry of Indian railways. The principle objective of this
research paper is distinguish the deformity and propose a superior reason for improve the
manufacturing line by implementing the Quality control tools in manufacturing and
assemblyprocess of railways bogies so as to reduce the non conformities. Quality control
toolslike Pareto chart and Cause and effect diagram have been used to distinguish various
imperfections and reasons for these non conformities. Quality Control Tools can improve
process execution by diminishing item variability and improves production effectiveness by
decreasing scrap and framework
REFERENCE
1. Chen, M.S., Wu, M.H. and Lin, C.M.,(2014), “Application of indices Cp and Cpk to
improve quality control capability in clinical biochemistry laboratories”, The Chinese journal of
physiology, vol. 57(2), pp. 63-68
2. Chan, C.L., Tse, A.C. and Yim, H.K., (2003), “Comparing and combining individual -
charts and x-bar charts”, International Journal of Quality & Reliability Management, Vol. 20
Issue: 7, pp.827 – 835.
3. Costa, A.F.B.(1999): “Joint X and R charts with variable sample sizes and sampling
intervals”, Journal of Quality Technology, Vol. 31, No. 4, pp. 387 – 397.
4. Das, N. and Sachan, L., (2013), “Robust control charts for controlling location
parameter”, International journal of Productivity and Quality Management, Vol. 12, No.1, pp.18
– 37.

ISSN: 2249-0558 Impact Factor: 7.119
370 International journal of Management, IT and Engineering
http://www.ijmra.us, Email: [email protected]
5. Gaafar, L.K. and Keats, J.B.,(1984), “Statistical Process Control: A Guide for
Implementation”, International Journal of Quality & Reliability Management, Vol. 9 Issue: 4,
pp. 9–20
6. Kemenade, E.V. and Hardjono, T.W.,(2018), “Twenty-first century Total Quality
Management: the Emergence Paradigm”, The TQM Journal, Vol.42, No.1, pp.77-89.
7. Prajapati, D.R. and Mahapatra, P.B., (2007), “An effective joint X-bar and R chart to
monitor the process mean and variance”, International journal of Productivity and Quality
Management, Vol.2, No.4, pp.459 – 474.
8. Prajapati, D.R. and Singh, S., (2014), “Effect of warning limits on the performance of the
X chart under autocorrelation”, International journal of Productivity and Quality Management,
Vol.13, No.2, pp.235 – 250.
9. Ronald, D. and Fricker, J.,(2009), “Optimising Shewhart charts in parallel production
lines”, International journal of quality engineering and productivity, Volume 1 No. 2 pages 125-
135.
10. Saniga, E., McWilliams, T., Davis, D. and Lucas, J., (2006), “Economic control chart
policies for monitoring variables”, International journal of Productivity and Quality
Management, Vol.1, No.1/2, pp.116 – 138.
11. Singh, A., and Prajapati, D.R., (2016), “Implementation of SPC tools for process
Improvement: A Case Study”, International Journal of Management, IT & Engineering, Vol. 6
Issue 9, pp.223-237.