analysis of wind turbine vibrations based on scada data · large, and it contains errors caused by...
TRANSCRIPT

1
srtwsmtvtbpa
etmCa�wS
�ppmsyhw
an
N
sS
J
Downloa
Andrew Kusiake-mail: [email protected]
Zijun Zhang
Department of Mechanical and IndustrialEngineering,
3131 Seamans Center,University of Iowa,
Iowa City, IA 52242-1527
Analysis of Wind TurbineVibrations Based on SCADA DataVibrations of a wind turbine have a negative impact on its performance. Mitigating thisundesirable impact requires knowledge of the relationship between the vibrations andother wind turbine parameters that could be potentially modified. Three approaches forranking the impact importance of measurable turbine parameters on the vibrations of thedrive train and the tower are discussed. They include the predictor importance analysis,the global sensitivity analysis, and the correlation coefficient analysis versed in datamining and statistics. To decouple the impact of wind speed on the vibrations of the drivetrain and the tower, the analysis is performed on data sets with narrow speed ranges.Wavelet analysis is applied to filter noisy accelerometer data. To exclude the impactmalfunctions on the vibration analysis, the data are analyzed in a frequency domain.Data-mining algorithms are used to build models with turbine parameters of interest asinputs, and the vibrations of drive train and tower as outputs. The performance of eachmodel is thoroughly evaluated based on metrics widely used in the wind industry. Theneural network algorithm outperforms other classifiers and is considered to be the mostpromising approach to study wind turbine vibrations. �DOI: 10.1115/1.4001461�
Keywords: vibration, wind turbine, drive train acceleration, tower acceleration, datamining, neural networks, torque, blade pitch angle, data analysis, predictor importanceanalysis, global sensitivity analysis, correlation coefficient
IntroductionWind energy is considered one of the most viable sources of
ustainable energy. Its rapid growth in recent years has gainedesearch attention aimed at investigating emerging problems. Inhe past, most of the research has concentrated on domains such asind energy conversion �1,2�, prediction of wind power �3�, wind-
peed prediction �4,5�, wind farm layout design �6,7�, and turbineonitoring �8,9�. Despite its impact on the performance and life-
ime of wind turbines, the published research on wind turbineibrations is rather limited. Mitigating the vibrations of a windurbine can potentially prevent material fatigue, reduce the num-er of component failures, and extend the life-cycle of some com-onents. This in turn translates into increased turbine availabilitynd reduced maintenance costs.
Due to the large size of wind turbines, conducting laboratoryxperiments with such systems is a challenge. Thus, the past windurbine vibration research has primarily focused on the building
odels based on first principles and simulation. Leithead andonnor �10� studied the dynamics of variable speed wind turbinesnd design of models to control wind turbines. Fadaeinedjad et al.11� investigated the impact of voltage sag on vibration of theind turbine tower. They used three simulation programs, TRUB-
IM, FAST, and SIMULINK, to model wind turbines. Murtagh et al.12� investigated control wind turbine vibration by incorporating aassive control device. It is widely recognized that the analysis ofarametric models has limitations, as such models usually involveany assumptions, and therefore they may not adequately repre-
ent reality. With massive deployment of wind farms in recentears, both the performance and maintenance of wind turbinesave grown in importance. Thus, models accurately portrayingind turbine vibrations are needed.Modeling turbine vibrations is complex, as many parameters
re involved. A new approach designed to handle vibrations iseeded. In this paper, the wind turbine vibration data are analyzed
Contributed by the Solar Energy Division of ASME for publication in the JOUR-
AL OF SOLAR ENERGY ENGINEERING. Manuscript received April 10, 2009; final manu-cript received January 23, 2010; published online June 14, 2010. Assoc. Editor:
pyros Voutsinas.ournal of Solar Energy Engineering Copyright © 20
ded 14 Jun 2010 to 128.255.53.136. Redistribution subject to ASM
from two different perspectives: the time domain and the fre-quency domain. The basis of the time domain analysis is statisticaland data-driven methodologies. Three approaches, namely, thepredictor importance analysis, the global sensitivity analysis, andthe correlation coefficient analysis, are applied to determine tur-bine parameters that could potentially mitigate turbine vibrations.In the frequency domain analysis, Fourier analysis transformstime domain data into frequency domain. Five data-mining algo-rithms are used to model the relationships between the identifiedparameters and wind turbine vibrations, and the best one is se-lected for modeling and in-depth computational study. The datasets used in this research were collected by the Supervisory Con-trol and Data Acquisition �SCADA� system at a wind farm.
2 Data Analysis of Wind Turbine Vibrations in TwoDomains
2.1 Data Description. In this research, data sets collected bythe SCADA system at two variable speed 1.5 MW turbines of alarge wind farm are used. Each data set contains average values ofmore than 120 parameters, including vibration parameters, allstored at 10-s intervals and thus the sampling frequency is 0.1 Hz.Although the SCADA system contains values of many param-eters, only some of them are of interest to vibration analysis. Theliterature and domain expertise was used to select a list of param-eters that could be potentially relevant to the research discussed inthis paper. Table 1 illustrates the format of the data used in thisresearch.
As illustrated in Table 1, the values of all parameters containedin the data set, such as torque, wind speed, wind deviation, drivetrain acceleration, and tower acceleration, are time stamped. Thewind turbine vibration is indicated by two important parameters,the drive train acceleration reflecting vibrations of the drive train,and the tower acceleration reflecting vibrations of the tower. Theaccelerometer measuring the drive train acceleration is attached atthe rear bottom of the nacelle, and the tower acceleration acceler-ometer is located near the nacelle and tower connection.
2.2 Data Preprocessing. Since the data set is stored at 10-s
intervals, the month-long data set considered in this research isAUGUST 2010, Vol. 132 / 031008-110 by ASME
E license or copyright; see http://www.asme.org/terms/Terms_Use.cfm

lmuitacd
rodTcaa�at
Tip
tompuft
st
D
D
0
Downloa
arge, and it contains errors caused by malfunction of sensors,echanical systems, and the data collection system. Those errors
sually appear as missing values, values that are out of range, andnvalid values. For example, the net power produced by a windurbine should be a positive number, which is usually between 0nd its rated power. Thus, filtering erroneous values is a signifi-ant step in data-driven research. However, once the error logic isiscovered, the data cleaning process can be automated.
After filtering the errors and invalid values, three derived pa-ameters are created based on the original SCADA data. The firstne is the wind deviation �yaw error�, which is defined as theifference between the wind direction and the nacelle position.he next two are the rate of change in torque and the rate ofhange in the pitch angle. The rate of change in torque �referred tos torque rate� is the difference between the current torque valuend the torque value at the preceding time 10-s interval �see Eq.1��. The rate of change in pitch angle �referred to as blade pitchngle rate� is the difference between the current pitch angle andhe pitch angle preceding the 10-s time interval �see Eq. �2��.
torque rate = torque value�t� − torque value�t − 1� �1�
pitch angle rate = pitch angle�t� − pitch angle�t − 1� �2�
he two derived parameters �Eqs. �1� and �2�� provide additionalnformation about wind turbine vibrations from the rate of changeerspective.
In the time domain analysis, the entire data set is used forraining models, and it is decomposed into three partitions basedn the wind-speed values: wind speed in the interval �3.5 m/s, 7/s�, �7 m/s, 12 m/s�, and ��=12 m /s�. This rather arbitrary
artitioning provides a way to isolate the turbine vibrations attrib-ted to both the drive train and the tower from the impact of otheractors such as the wind itself, malfunctions of mechanical sys-ems �e.g., shaft misalignments�, and so on �see Table 2�.
Although the volume of data collected at the wind farm is large,ome data samples are biased; i.e., some observations included inhe population dominate other data points. A typical biased data
Table 1 Sa
ObservationNo. Time
Torque value�%�
1 10/1/08 12:00 a.m. 22.102 10/1/08 12:00 a.m. 22.603 10/1/08 12:00 a.m. 23.10… … …
60,482 10/8/08 12:00 a.m. 0.00
Table 2 Three data subsets
Wind Turbine 1
ata Partition No. Wind speed No. of data points
1 �3.5 m/s, 7 m/s� 77,593 10-s observations2 �7 m/s, 12 m/s� 103,148 10-s observations3 ��=12 m /s� 21,525 10-s observations
Wind Turbine 2
ata Partition No. Wind speed No. of data points
1 �3.5 m/s, 7 m/s� 63,554 10-s observations2 �7 m/s, 12 m/s� 103,115 10-s observations3 ��=12 m /s� 11,855 10-s observations
31008-2 / Vol. 132, AUGUST 2010
ded 14 Jun 2010 to 128.255.53.136. Redistribution subject to ASM
sample of torque values included in Data Partition 1 of Turbine 1�see Table 2� is illustrated in the histogram of Fig. 1.
It is obvious from the histogram in Fig. 1 that the torque rates inthe interval ��0.84, 0.84� have a much higher frequency than thevalues in the other intervals. Thus, the number of observations inthis interval needs to be reduced from about 36,000 to 7000. Thishas been accomplished with a random sampling without a replace-ment scheme. The histogram of torque values after sampling ispresented in Fig. 2.
2.3 Data Analysis of Wind Turbine Vibration in TimeDomain. In this research, several parameters measured by sensorsor derived from data, such as torque, torque rate, wind speed,wind deviation, blade pitch angle �average of the three measuredpitch angles, one for each blade�, and the blade pitch rate, areconsidered as the major factors potentially impacting the turbinevibrations. These parameters are selected mainly based on domainknowledge and study of the wind energy literature �13,14�.
The tower and drive train accelerations are recorded by theSCADA system. As there are two similar measured values offeredby the sensor installed on the drive train, the average value ofdrive train acceleration is considered for simplicity of analysis.Three different data approaches are applied to quantitatively ana-lyze the impact of each of the selected parameters on the turbinevibrations reflected by the drive train acceleration and the toweracceleration. The data analysis approaches include the predictorimportance analysis, the global sensitivity analysis, and the corre-lation coefficient analysis, and they are applied to each of thethree data partitions of Table 2. Predictor importance is deter-mined by the boosting regression tree algorithm �15,16�. The pre-dictor importance statistics, e.g., the sum of the squares’ errors,are computed for each split during the process of building trees,and the best predictor parameter is then selected. An average sta-tistic is computed over all trees and all splits. The predictor pa-rameter with the highest value is assigned the value of 100, andother parameters are assigned lower values. The global sensitivityanalysis ranks the importance of inputs on the model extracted bya neural network approach �17–19�. It examines the contributionof uncertainty of all inputs to the output of the model simulta-neously, rather than individually, to determine the order of param-eter importance. The correlation coefficient �20� is a statisticalapproach to analyze the relationship between predictors and thetarget based on their affinity.
2.3.1 Analysis of Data Partition 1. For Data Partition 1 ofTable 2, the wind speed of both turbines is in the interval �3.5 m/s,7 m/s�. Due to the fact that the wind speed is rather low, its impacton the drive train and the tower is likely to be minimal.
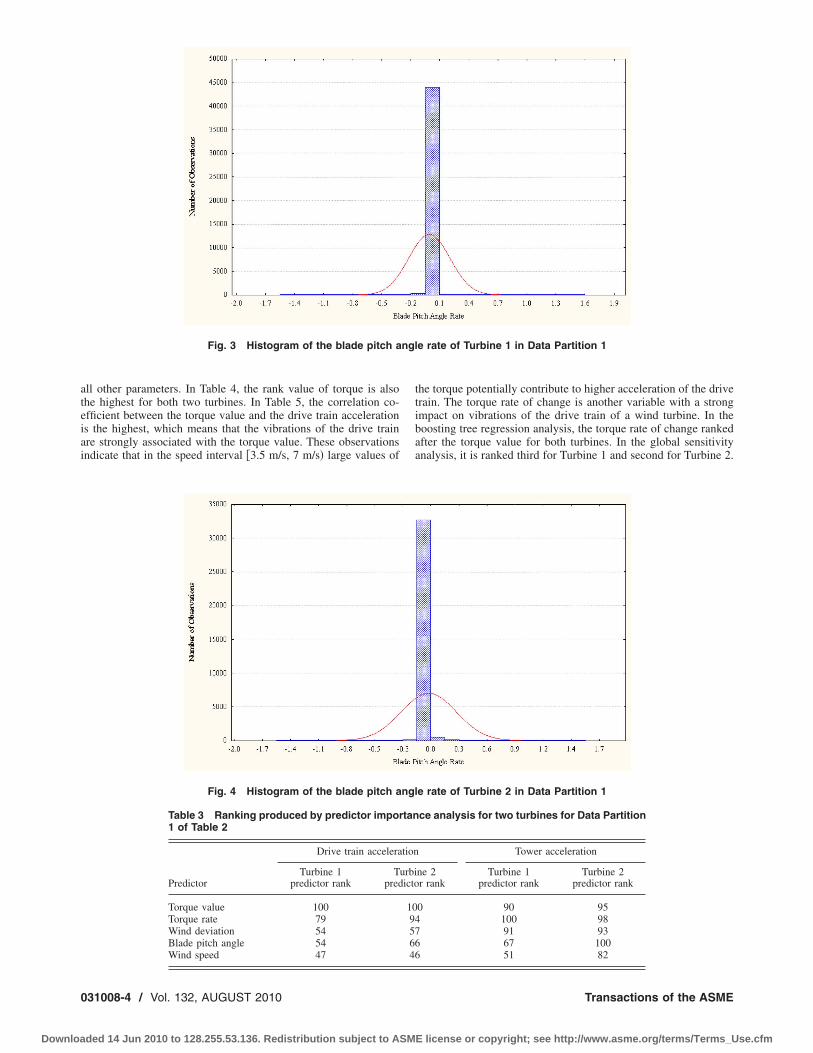
It is also known that for low wind speeds, the blade pitch angleremains mostly constant for most pitch controlled turbines, asshown in Figs. 3 and 4; therefore, this parameter could be ex-cluded in the analysis. Table 3 shows the impact of predictors�measured with the predictor importance� on the drive train accel-eration and the average tower acceleration of the two turbines.
The values of the predictor rank in Table 3 are generated by
le data set
Wind speed�m/s� …
Drive trainacceleration
�mm /s2�
Toweracceleration
�mm /s2�
5.77 … 25.67 29.316.45 … 24.78 30.266.07 … 23.89 31.21… … … …
2.74 … 18.01 29.34
mp
the boosting tree regression algorithm. The predictor importance
Transactions of the ASME
E license or copyright; see http://www.asme.org/terms/Terms_Use.cfm

vt
adve
aib
J
Downloa
aries by the predictor �e.g., torque value and torque rate� and thearget �i.e., drive train acceleration and tower acceleration�.
The global sensitivity rankings produced by a neural networkre provided in Table 4. Although the scale used to rank the pre-ictors is different than the one used in Table 3, a higher rankingalue indicates that the contribution of the corresponding param-ter for making predictions is higher.
Table 5 illustrates the correlation coefficient between predictorsnd two accelerations. A higher value of the correlation coefficientndicates a stronger dependence between a predictor and the vi-ration.
Fig. 1 Torque histogram fo
Fig. 2 Torque histogram for Data Par
ournal of Solar Energy Engineering
ded 14 Jun 2010 to 128.255.53.136. Redistribution subject to ASM
In the boosting tree regression analysis, a higher predictor rankpoints to a stronger impact of the predictor on a target variable�here vibration�. The nature of the global sensitivity analysis issimilar to the regression boosting tree analysis. However, the cor-relation coefficient analysis offers a different concept. A positivecorrelation coefficient implies that the two variables are positivelyand linearly correlated, while a negative correlation coefficientindicates the inverse relationship. A higher value of the correlationcoefficient indicates a more obvious linear relationship betweenthe corresponding variables. In Table 3, the rank of the torquewith respect to the drive train acceleration is 100, the highest of
ata Partition 1 of Turbine 1
r Dtition 1 of Turbine 1 after sampling
AUGUST 2010, Vol. 132 / 031008-3
E license or copyright; see http://www.asme.org/terms/Terms_Use.cfm
ateiai
0
Downloa
ll other parameters. In Table 4, the rank value of torque is alsohe highest for both two turbines. In Table 5, the correlation co-fficient between the torque value and the drive train accelerations the highest, which means that the vibrations of the drive trainre strongly associated with the torque value. These observationsndicate that in the speed interval �3.5 m/s, 7 m/s� large values of
Fig. 3 Histogram of the blade pitch a
Fig. 4 Histogram of the blade pitch a
Table 3 Ranking produced by predictor impo1 of Table 2
Predictor
Drive train accelera
Turbine 1predictor rank
Tpred
Torque value 100Torque rate 79Wind deviation 54Blade pitch angle 54Wind speed 47
31008-4 / Vol. 132, AUGUST 2010
ded 14 Jun 2010 to 128.255.53.136. Redistribution subject to ASM
the torque potentially contribute to higher acceleration of the drivetrain. The torque rate of change is another variable with a strongimpact on vibrations of the drive train of a wind turbine. In theboosting tree regression analysis, the torque rate of change rankedafter the torque value for both turbines. In the global sensitivityanalysis, it is ranked third for Turbine 1 and second for Turbine 2.
e rate of Turbine 1 in Data Partition 1
e rate of Turbine 2 in Data Partition 1
ce analysis for two turbines for Data Partition
Tower acceleration
ne 2r rank
Turbine 1predictor rank
Turbine 2predictor rank
0 90 95100 9891 9367 10051 82
ngl
ngl
rtan
tion
urbiicto
1094576646
Transactions of the ASME
E license or copyright; see http://www.asme.org/terms/Terms_Use.cfm

Tfdrrats
tTto4T
J
Downloa
he wind speed turns out to be more important for Turbine 1 thanor Turbine 2. The correlation coefficient in Table 5 provides aifferent result for the torque rate, as it emphasizes the linearelationship rather than the nonlinear relationship between the cor-esponding variables. In this case, the results of the first twonalyses provide more valuable information and indicate that theorque rate of change is another factor �after torque value�trongly associated with the vibrations of the turbine drive train.
For the tower vibration, no single parameter consistently scoreshe highest rank in all three analyses. However, the rank values inables 3 and 4 indicate that the torque value is more important
han most other variables for both turbines. In Table 3, the ranksf torque value are 90 for Turbine 1 and 95 for Turbine 2. In Table, the ranks of torque value are 3.27 for Turbine 1 and 1.25 forurbine 2. In conclusion, although the rankings for a turbine
Table 4 Rankings produced by the global setion 1 of Table 2
Predictor
Drive train accelera
Turbine 1predictor rank
Tpred
Torque value 3.27Torque rate 1.55Wind deviation 1.03Blade pitch angle 1.02Wind speed 1.96
Table 5 Rankings produced by the correlatioPartition 1 of Table 2
Predictor
Drive train acceleration
Turbine 1correlation coefficient
Turbincorrelation c
Torque value 0.74 0.5Torque rate �0.23 �0.2Wind deviation 0.14 0.0Blade pitchangle �0.36 �0.1Wind speed 0.55 0.2
Fig. 5 Histogram of the blade pitch angl
ournal of Solar Energy Engineering
ded 14 Jun 2010 to 128.255.53.136. Redistribution subject to ASM
tower provided by the three analyses are somehow different, it isapparent that the torque is associated with the vibrations at theturbine tower.
2.3.2 Analysis of Data Partition 2. In Data Partition 2 of Table1, the wind speed falls in the interval �7 m/s, 12 m/s�. Figures 5and 6 illustrate the blade pitch angle rate �i.e., the change in pitchangle in the consecutive time points �see Eq. �2�� for the data setsof two turbines.
The blade pitch angle of two wind turbines �see Figs. 5 and 6�does not significantly change. Table 6 shows the results of thepredictor importance analysis of two turbines in Data Partition 2.Table 7 illustrates the results of the global sensitivity analysis forthe two turbines. Table 8 presents the results of the correlationcoefficient analysis in this scenario.
tivity analysis for two turbines for Data Parti-
Tower acceleration
ne 2r rank
Turbine 1predictor rank
Turbine 2predictor rank
7 3.27 1.252 1.11 1.040 1.02 1.011 1.07 1.003 1.64 1.05
coefficient analysis for two turbines for Data
Tower acceleration
cientTurbine 1
correlation coefficientTurbine 2
correlation coefficient
0.30 0.11�0.05 0.01
0.09 0.05
�0.17 �0.060.17 �0.03
nsi
tion
urbiicto
3.82.01.01.01.3
n
e 2oeffi
024
98
e rate of Turbine 1 in Data Partition 2
AUGUST 2010, Vol. 132 / 031008-5
E license or copyright; see http://www.asme.org/terms/Terms_Use.cfm

vvTvcrstpfifi
fftp
0
Downloa
Torque value is considered as the most important variable inibration analysis of the drive train. In Table 6, the rank of torquealue is 100 for both turbines. Table 7 confirms the results ofable 6. In Table 8, the correlation coefficient between the torquealue and the drive train acceleration is the highest. These resultsonfirm that the torque value is the most significant parameterelated to vibrations of the drive train. Torque rate could be con-idered as the second most important parameter associated withhe drive train vibration. The blade pitch angle could be anotherarameter potentially causing the wind turbine vibrations, as con-rmed by the predictor importance analysis and correlation coef-cient analysis.In analyzing tower accelerations, the torque value ranks highest
or Turbine 1 �Table 6�. It also scores the second highest rank �98�or Turbine 2. The global sensitivity analysis �Table 7� shows thathe torque value is also important, as it gets ranked close to otherarameters. In Table 8, the correlation coefficient between the
Fig. 6 Histogram of the blade pitch a
Table 6 Ranking produced by the predictorPartition 2 of Table 2
Predictor importance analysis
Drive train a
Turbine 1predictor rank
Torque value 100Torque rate 86Wind deviation 42Blade pitch angle 71Wind speed 69
Table 7 Rankings produced by the global setion 2 of Table 2
Global sensitivity analysis
Drive train ac
Turbine 1predictor rank
Torque value 3.87Torque rate 2.02Wind deviation 1.00Blade pitch angle 1.01Wind speed 1.33
31008-6 / Vol. 132, AUGUST 2010
ded 14 Jun 2010 to 128.255.53.136. Redistribution subject to ASM
torque value and the tower acceleration is the highest. The torquerate and blade pitch angle are also important factors related to thetower acceleration. In the predictor importance analysis, the rankvalues of the torque rate and the blade pitch angle for both tur-bines are higher than 70. In Table 7, the rank values of the vari-ables besides torque value are similar. In Table 8, the blade pitchangle shows a higher correlation with the tower acceleration thanthe torque rate. In conclusion, although the results from differentanalyses point to different importance of parameters, the resultsimply that the torque rate and blade pitch angle are strongly asso-ciated with the tower acceleration.
2.3.3 Analysis of Data Partition 3. In this scenario, all thewind speeds are higher than 12 m/s. As the torque value does notfrequently change �see Figs. 7 and 8� it is not considered in theanalysis discussed in this section. The predictor importance is re-ported in Table 9; Table 10 shows the results of the global sensi-
e rate of Turbine 2 in Data Partition 2
portance analysis for two turbines for Data
leration Tower acceleration
Turbine 2redictor rank
Turbine 1predictor rank
Turbine 2predictor rank
100 100 9895 84 10047 39 4876 71 8155 80 76
tivity analysis for two turbines for Data Parti-
ration Tower acceleration
urbine 2dictor rank
Turbine 1predictor rank
Turbine 2predictor rank
3.77 1.25 1.171.90 1.04 1.111.00 1.01 1.011.02 1.00 1.011.42 1.05 1.17
ngl
im
cce
p
nsi
cele
Tpre
Transactions of the ASME
E license or copyright; see http://www.asme.org/terms/Terms_Use.cfm

tcet
t
te o
J
Downloa
ivity analysis, and Table 11 presents the results of the correlationoefficient analysis. This scenario �speed above 12 m/s� is consid-red to be high wind speed, and it is likely that some vibrations ofhe wind turbine are contributed by the wind.
The analysis of the drive train acceleration data has revealedhat the association of the blade pitch angle with turbine vibrations
Table 8 Rankings produced by the correlatioPartition 2 of Table 2
Correlationcoefficientanalysis
Drive train acceleration
Turbine 1correlation coefficient
Turbincorrelation c
Torque value 0.69 0.51Torque rate 0.08 0.12Wind deviation 0.02 0.03Blade pitchangle 0.25 0.23Wind speed 0.63 0.48
Fig. 7 Histogram of torque ra
Fig. 8 Histogram of torque rate o
ournal of Solar Energy Engineering
ded 14 Jun 2010 to 128.255.53.136. Redistribution subject to ASM
is the strongest of all parameters. In Table 9, the predictor impor-tance analysis ranks the blade pitch angle as the most importantfactor. In Table 10, the rank value of the blade pitch angle ishigher than for other parameters. In Table 11, although the corre-lation coefficient between wind speed and drive train accelerationis higher than that between the blade pitch angle and drive train
coefficient analysis for two turbines for Data
Tower acceleration
cientTurbine 1
correlation coefficientTurbine 2
correlation coefficient
0.52 0.380.08 0.140.00 0.01
0.23 0.230.48 0.35
f Turbine 1 in Data Partition 3
n
e 2oeffi
f Turbine 2 in Data Partition 3
AUGUST 2010, Vol. 132 / 031008-7
E license or copyright; see http://www.asme.org/terms/Terms_Use.cfm

acaaa
svTtb
Dc�ltsri
pfado
0
Downloa
cceleration, the difference between the two correlation coeffi-ients is not significant. Besides the blade pitch angle, other vari-bles such as torque value, torque rate, and wind deviation canlso impact the drive train acceleration; however, the impact is nots significant as the blade pitch angle.
The analysis of data shows that the blade pitch angle is the mostignificant factor associated with the tower acceleration. The rankalue of the blade pitch angle in Tables 9 and 10 is the highest.he correlation coefficient between the blade pitch angle and the
ower acceleration is almost identical to the correlation coefficientetween the wind speed and the tower acceleration �see Table 11�.
2.4 Data Analysis of Wind Turbine Vibration in Frequencyomain. Besides the wind and control, malfunctions of turbine
omponents may contribute to the vibrations of a wind turbine21�. Usually, the aberrations may be caused by mechanical prob-ems and are difficult to observe in the time domain. Projectinghe time domain data into the frequency domain �power spectrum�hown in Fig. 9 offers an alternative view. The x-axis in Fig. 9epresents the frequency, and the y-axis is the power correspond-ng to the drive train acceleration.
Usually, wind turbine vibrations caused by malfunctions of theower train are expressed as peaks in the spectrum at differentrequencies. However, since the sampling time of the data setvailable for this study is only 10 s, only a small portion of theata frequency �up to 0.05 Hz� is reflected in the spectrum. Basedn this limited analysis and information of turbine status from
Table 9 Ranking produced by the predictorPartition 3 of Table 2
Predictorimportanceanalysis
Drive train accel
Turbine 1predictor rank p
Torque value 42Blade pitch angle rate 37Wind deviation 12Blade pitch angle 100Wind speed 90
Table 10 Ranking produced by the global setion 3 of Table 2
Global sensitivity analysis
Drive train ac
Turbine 1predictor rank
Torque value 1.03Blade pitch angle rate 1.07Wind deviation 1.00Blade pitch angle 1.72Wind speed 1.17
Table 11 Ranking produced by the correlatioPartition 3 of Table 2
Correlationcoefficientanalysis
Drive train acceleration
Turbine 1correlation coefficient
Turbincorrelation c
Torque value �0.09 �0.1Blade pitchangle rate 0.08 0.0Wind deviation 0.00 0.0Blade pitchangle 0.78 0.8Wind speed 0.84 0.8
31008-8 / Vol. 132, AUGUST 2010
ded 14 Jun 2010 to 128.255.53.136. Redistribution subject to ASM
wind farm, an assumption that the turbine is operated in normalcondition is made in this research, and vibration caused by mal-function is excluded in consideration.
3 Modeling Turbine Vibrations
3.1 Wind-Speed-Based Scenarios. In this study, the data setis split into smaller subsets based on the following speed intervals:�3.5 m/s, 5 m/s�, �5 m/s, 6 m/s�, �6 m/s, 7 m/s�, �7 m/s, 8 m/s�, �8m/s, 9 m/s�, �9 m/s, 10 m/s�, �10 m/s, 11 m/s�, �11 m/s, 12 m/s�,and �12 m/s, 14 m/s�. Since each speed interval is narrow, theimpact of the wind-speed change can be neglected, and wind tur-bine vibration models can be built.
3.2 Wavelet Analysis. Noisy data usually diminish the accu-racy of the models derived from such data. Wavelets are used tosmooth the data and noise reduction before establishing vibrationmodels. Wavelet analysis calls for the order and level of wavelet.The difference between the mean of the original value and thedenoised value is used to select the best order and level. Threetypes of wavelets, wavelet of DB 7 level 10, DB 7 level 7, and DB5 level 5, are compared. Data set from 10/1/2008 12:00:10 a.m. to10/8/2008 12:00:00 a.m. has been used in the comparative analy-sis. Table 12 presents the difference between the mean of theoriginal drive train acceleration and the mean of the denoiseddrive train acceleration for the three wavelets.
portance analysis for two turbines for Data
ion Tower acceleration
bine 2ctor rank
Turbine 1predictor rank
Turbine 2predictor rank
38 44 4929 52 4413 31 25100 100 10091 84 89
tivity analysis for two turbines for Data Parti-
ration Tower acceleration
urbine 2dictor rank
Turbine 1predictor rank
Turbine 2predictor rank
1.02 1.01 1.011.04 1.04 1.021.01 1.01 1.012.93 1.76 1.811.15 1.17 1.02
coefficient analysis for two turbines for Data
Tower acceleration
cientTurbine 1
correlation coefficientTurbine 2
correlation coefficient
�0.03 �0.09
0.09 0.02�0.04 �0.02
0.64 0.670.66 0.69
im
erat
Turredi
nsi
cele
Tpre
n
e 2oeffi
0
12
56
Transactions of the ASME
E license or copyright; see http://www.asme.org/terms/Terms_Use.cfm

eDi
howam1tmpMwi
Fe
Td
WDt
T
OD
T
OD
J
Downloa
In this study, no significant shift in the mean of acceleration isxpected after denoising. According to Table 12, it is obvious thatB 5 level 5 is better than the other two transformations and thus
t is selected.To demonstrate the value of wavelet analysis, two experiments
ave been conducted. Neural network �NN� models were built forriginal data sets and denoised data by DB 5 level 5. The DB 5ith level 5 denoised only the drive train acceleration and tower
cceleration data. Table 13 presents the training results for a NNodel based on the �7 m/s, 8 m/s� data subset of Turbine 1. Table
4 presents the test results for the same data subset. Four metrics,he mean absolute error �MAE� �Eq. �3��, the standard deviation of
ean absolute error �Std. of MAE� �Eq. �4��, the mean absoluteercentage error �MAPE� �Eq. �5��, and the standard deviation ofAPE �Std. of MAPE� �Eq. �6��, are used to evaluate the results,here yi is the predicted drive train �or tower acceleration� and yi
s the observed value in the data set.
Mean absolute error �MAE� =1
n�i=1
n
�yi − yi� �3�
ig. 9 Spectrum from 0 Hz to 0.05 Hz of the drive train accel-ration of Turbine 1
able 12 Difference between the mean of the original and theenoised drive train acceleration
avelet type DB 7 level 10 DB 7 level 7 DB 5 level 5ifference between
wo means 0.0092 0.0088 0.0004
Table 13 Training results of the neural network model
raining MAE Std. of MAE MAPE Std. of MAPE
riginal data set 5.68 4.80 3.90 353.19enoised data set 1.29 2.30 0.00 2.70
Table 14 Test results of the neural network model
est MAE Std. of MAE MAPE Std. of MAPE
riginal data set 5.57 4.74 0.19 2.35enoised data set 1.25 2.11 0.04 0.63
ournal of Solar Energy Engineering
ded 14 Jun 2010 to 128.255.53.136. Redistribution subject to ASM
standard deviation of MAE
=�1
n�i=1
n ��yi − yi� −1
n�i=1
n
�yi − yi�2
�4�
mean absolute percentage error �MAPE�
=1
n�i=1
n � yi − yi
yi � 100% �5�
standard deviation of MAPE
=�1
n�i=1
n � yi − yi
yi −
1
n�i=1
n yi − yi
yi2
� 100% �6�
The results provided in Tables 12 and 13 and the model ex-tracted from the denoised data are more accurate than the modelextracted from the original data set. Thus, the wavelet analysis isbeneficial for modeling.
3.3 Data-Driven Models. Data-driven models are used torepresent the relationship between inputs, such as torque value,torque rate, wind speed and wind deviation, and outputs �the drivetrain acceleration and tower acceleration�. Such models differfrom the physics-based functions, for example, the function de-scribing the acceleration of a swing �see Eq. �7��.
Acceleration =d2x
dt2 = x = − x0�2 cos �t �7�
Unlike the parametric models, the data-driven models do not re-quire knowing in advance the function mapping inputs into anoutput �see Eq. �8��.
y = f�x��, x� = �x1,x2, . . . ,xn,v1,v2, . . . ,vn� �8�
where y is the drive train acceleration or the tower accelerationmeasured by accelerometers, xi are the noncontrollable inputs �thewind deviation and wind speed�, and v j are the controllable inputs�the torque value, torque rate, blade pitch angle, and so on�. Thefunction f� • � is learned by data-mining algorithms.
Before a data-driven model is built, the most suitable data-mining algorithm needs to be selected. In this section, the perfor-mance of five classifiers, NN �17–19�, support vector machine�SVM� �22,23�, boosted tree �15,16�, standard C&RT, and randomforest �24�, is evaluated using two metrics, MAE �Eq. �3�� andMAPE �Eq. �5��. The data set, which is randomly selected acrossall wind speeds �Table 2�, is used for training and testing.
The NN is a biology-based computational model that is adap-tive and robust. The SVM is used for classification and regressionbased on the concept of maximizing the margin between the datapoints of different classes. The last three data-mining algorithmsare tree-based approaches. Boosted tree applies the boostingmethod to regression trees. Standard C&RT, classification and re-gression tree, is a data-mining approach that builds an optimal treestructure to predict categorical or continuous variables. Randomforest is a data-mining algorithm composed of many decisiontrees, and it outputs the best values of an individual tree.
Tables 15 and 16 illustrate the performance of the five classifi-ers for predicting the drive train acceleration and tower accelera-tion, respectively. The NN model provides the lowest MAE andMAPE for both cases. Thus, the NN model is selected as the mostaccurate model to predict wind turbine vibrations.
All parameters used by the neural network model to extractmodels in Eqs. �9� and �10� are listed in Table 17.
y1 = f�y1�t − 1�,y1�t − 2�,y1�t − 3�,x1,x2,x3,x4,v1,v2� �9�
AUGUST 2010, Vol. 132 / 031008-9
E license or copyright; see http://www.asme.org/terms/Terms_Use.cfm

Tt
C
NSSBR
Ta
C
NSSBR
P
yyyyyyyyxxxxvv
031008-10 / Vol. 132, AUGUST 2010
Downloaded 14 Jun 2010 to 128.255.53.136. Redistribution subject to ASM
y2 = f�y2�t − 1�,y2�t − 2�,y2�t − 3�,x1,x2,x3,x4,v1,v2� �10�
where y1 and y2 represent the drive train acceleration and thetower acceleration, respectively.
4 Case StudyAs the neural network outperforms the other four data-mining
algorithms based on the sample data set, it is introduced to extractnonparametric predictive models of wind turbine vibration fromthe industrial data, i.e., the data set of Turbine 1 after preprocess-ing. In this study, data sets collected at two different turbines areused. The two data sets are decomposed into subsets, as describedin Sec. 3.1. Each Turbine 1 data subset is then split into trainingand test data sets by random sampling. The training data set in-cludes 2/3 of all data points and the test data set constitutes theremaining 1/3 data. The data subsets of Turbine 2 �external datasets� are applied to test the accuracy and robustness of the modelsderived from Turbine 1 data. The parameters in Table 17 are se-lected to build models according to the functions �see Eqs. �9� and�10�� learned by the neural network. Thus, two nonparametricmodels are extracted from the data: one for the drive average trainacceleration and another for the tower acceleration.
Table 18 presents test results from predicting the average drivetrain and the tower acceleration for 18 different scenarios. Themodel performance for each speed range �scenarios 1–9� is mea-sured with four metrics: MAE �Eq. �3��, standard deviation ofMAE �Eq. �4��, MAPE �Eq. �5��, and standard deviation of MAPE�Eq. �6��.
The results included in Table 18 indicate that the predictions forthe drive train acceleration are accurate as most of the MAPEvalues are lower than 0.03, which means that the prediction accu-racy is higher than 97%. In addition, the low value of the standarddeviation of MAPE indicates small variability of error relative tothe mean error.
The value of MAPE for tower acceleration oscillates about0.07, which corresponds to 93% prediction accuracy. Consideringthe complexity of the underlying relationships this prediction ac-curacy is acceptable. One possible reason for the reduced predic-tion accuracy is that the impact of the rotor on the vibration oftower is less direct than that on the drive train.
The performance of selected scenario, scenario 3 of Turbine 1,has been illustrated in scatter plots in Figs. 10 and 11 where thevertical axis represents the observed values and the horizontal axisrepresents the predicted ones. Figure 10 shows the prediction re-sults of the first 200 points based on the test data from scenario 3
on produced by the neural network model
MAE Std. of MAE MAPE Std. of MAPE
0.5782 0.9249 0.0184 0.02020.4752 1.4199 0.0191 0.15980.5154 1.3468 0.0133 0.04371.2393 2.0922 0.0246 0.04301.2382 2.2780 0.0195 0.03701.5762 3.0296 0.0042 0.35671.8956 3.3790 0.0162 0.45121.7312 2.9588 0.0173 0.03131.2692 2.1304 0.0120 0.5831
3.2221 4.8278 0.0955 0.10112.7683 5.6060 0.0709 0.15631.7724 4.2603 0.0410 0.14063.9584 6.4616 0.0882 0.29113.4913 6.2439 0.0545 0.08945.2208 11.0250 0.0634 0.09709.5497 25.4213 0.0916 0.16918.4061 16.9336 0.0738 0.10995.9573 9.3430 0.0473 0.0752
able 15 Performance of five classifiers for predicting driverain acceleration
Drive train acceleration
lassifier MAE MAPE
N 1.17 0.07VM 8.64 0.27tandard C&RT 4.23 0.16oosted tree 3.20 0.20andom forest 2.06 0.09
able 16 Performance of five classifiers for predicting towercceleration
Tower acceleration
lassifier MAE MAPE
N 4.54 0.11VM 13.72 0.27tandard C&RT 10.86 0.22oosted tree 6.91 0.15andom forest 5.26 0.11
Table 17 Feature descriptions
arameter Description
1 Drive train acceleration
2 Tower acceleration
1�t−1� Drive train acceleration at time t−1
1�t−2� Drive train acceleration at time t−2
1�t−3� Drive train acceleration at time t−3
2�t−1� Tower acceleration at time t−1
2�t−2� Tower acceleration at time t−2
2�t−3� Tower acceleration at time t−3
1 Torque change rate
2 Wind speed
3 Wind deviation
4 Blade pitch angle change rate
1 Torque value
2 Blade pitch angle
Table 18 Test results for wind turbine vibrati
Acceleration Scenarios Wind speed
Drive train acceleration Scenario 1 �3.5 m/s, 5 m/s�Scenario 2 �5 m/s, 6 m/s�Scenario 3 �6 m/s, 7 m/s�Scenario 4 �7 m/s, 8 m/s�Scenario 5 �8 m/s, 9 m/s�Scenario 6 �9 m/s, 10 m/sScenario 7 �10 m/s, 11 m/s�Scenario 8 �11 m/s, 12 m/s�Scenario 9 �12 m/s, 14 m/s�
Tower acceleration Scenario 1 �3.5 m/s, 5 m/s�Scenario 2 �5 m/s, 6 m/s�Scenario 3 �6 m/s, 7 m/s�Scenario 4 �7 m/s, 8 m/s�Scenario 5 �8 m/s, 9 m/s�Scenario 6 �9 m/s, 10 m/sScenario 7 �10 m/s, 11 m/s�Scenario 8 �11 m/s, 12 m/s�Scenario 9 �12 m/s, 14 m/s�
Transactions of the ASME
E license or copyright; see http://www.asme.org/terms/Terms_Use.cfm

FdScenario 3
Ftnario 3
Journal of Solar Energy Engineering
Downloaded 14 Jun 2010 to 128.255.53.136. Redistribution subject to ASM
�Table 18� in testing the drive train acceleration. Figure 11 illus-trates the performance of the first 200 points from scenario 3�Table 18� in testing the tower acceleration.
Table 19 presents test results for predicting the two types ofaccelerations, the drive train acceleration and tower acceleration,of the models extracted from data set of Turbine 1 by applying thedata set of Turbine 2. In the prediction of the drive train accelera-tion of Turbine 2, the models maintain their performance. Themean of the MAPE for predicting the drive train acceleration isabout 0.0221, which indicates that the mean accuracy of themodel is about 97.79%. This result is quite similar to the testresults of data set of Turbine 1. In predicting the tower accelera-tion of Turbine 2, the mean MAPE is about 0.0998, which meansthat the mean accuracy across all models is about 91%. In thiscase, although its prediction accuracy drops slightly comparedwith the previous case �93%�, the models are accurate for the typeof the complex problem considered in this research. Thus, theresults demonstrate that the models are accurate enough to modelthe relationships between the parameters and the targets �the drivetrain acceleration and the tower acceleration�.
The data in Figs. 12 and 13 illustrate the performance of theselected scenario, scenario 3 of Turbine 2. For better visualization
vibration of data set of Turbine 2
MAE Std. of MAE MAPE Std. of MAPE
1.0903 2.9562 0.0240 0.04470.6721 1.5771 0.0171 0.03110.7282 1.5546 0.0158 0.02711.2036 2.1324 0.0208 0.03411.2575 2.5230 0.0175 0.03261.7197 2.9600 0.0217 0.03392.3290 3.6028 0.0264 0.03772.6222 3.9620 0.0276 0.03983.0535 4.4006 0.0275 0.0377
6.1216 10.4774 0.0985 0.13025.3249 9.3070 0.0896 0.18354.8622 8.6557 0.0784 0.74004.4078 7.1761 0.0971 0.13913.5889 8.4652 0.0687 0.13705.7685 8.0605 0.0998 0.09199.2428 12.4625 0.1130 0.103912.7809 12.9038 0.1400 0.115411.9156 11.6100 0.1128 0.1000
Fig. 12 Scatter plot of the observed and predicted values ofthe drive train acceleration for the first 200 points of Turbine 2in Scenario 3
ig. 10 Scatter plot of the observed and predicted values ofrive train acceleration for the first 200 points of Turbine 1 in
ig. 11 Scatter plot of the observed and predicted values ofower acceleration for the first 200 points of Turbine 1 in Sce-
Table 19 Test results for wind turbine
Acceleration Scenarios Wind speed
Drive train acceleration Scenario 1 �3.5 m/s, 5 m/s�Scenario 2 �5 m/s, 6 m/s�Scenario 3 �6 m/s, 7 m/s�Scenario 4 �7 m/s, 8 m/s�Scenario 5 �8 m/s, 9 m/s�Scenario 6 �9 m/s, 10 m/sScenario 7 �10 m/s, 11 m/s�Scenario 8 �11 m/s, 12 m/s�Scenario 9 �12 m/s, 14 m/s�
Tower acceleration Scenario 1 �3.5 m/s, 5 m/s�Scenario 2 �5 m/s, 6 m/s�Scenario 3 �6 m/s, 7 m/s�Scenario 4 �7 m/s, 8 m/s�Scenario 5 �8 m/s, 9 m/s�Scenario 6 �9 m/s, 10 m/sScenario 7 �10 m/s, 11 m/s�Scenario 8 �11 m/s, 12 m/s�Scenario 9 �12 m/s, 14 m/s�
AUGUST 2010, Vol. 132 / 031008-11
E license or copyright; see http://www.asme.org/terms/Terms_Use.cfm

oEta
aw
5
sttetdlvpsbtap
tipicoome
dmbp
FtS
0
Downloa
f the results, only the first 200 points are depicted in the figures.ach vertical axis represents the observed values and the horizon-
al the predicted values of the drive train acceleration �Fig. 12�nd the tower acceleration �Fig. 13�.
In this study, the MAPE of the models for predicting both twoccelerations indicate that modeling the wind turbine vibrationith data-driven models is feasible and accurate.
ConclusionThree approaches, the predictor importance analysis, global
ensitivity analysis, and correlation coefficient analysis, were usedo conduct quantitative analysis of the importance of parameterso wind turbine vibrations. Two parameters, the drive train accel-ration and the tower acceleration, were used to study the windurbine vibration. Rank values of the parameters selected for theata set were then derived by three different approaches. For theow wind speeds, e.g., between 3.5 m/s and 7 m/s, the torquealue and the torque rate of change were found to be meaningfularameters impacting the wind turbine vibration. For higher windpeeds, e.g., between 7 m/s and 12 m/s, the torque value and thelade pitch angle could potentially reduce the wind turbine vibra-ions. When wind speed was larger than 12 m/s, the blade pitchngle was suggested as the most dominant parameter that couldotentially reduce the wind turbine vibrations.
The focus of the research reported in this paper is on the rela-ionship between turbine parameters that are controllable or arempacted by the control and wind turbine vibrations. To accom-lish this, first, the data set was decomposed into nine discretentervals of the wind speed so that the impact of the wind-speedhanges in the wind turbine vibration would be minimized. Sec-nd, the frequency domain analysis was performed to offer an-ther perspective to wind turbine vibrations. The assumption wasade that the operational status of a wind turbine was normal to
xclude the impact of malfunction of wind turbine components.Five data-mining algorithms were used to extract models from
ata sets collected at two randomly selected wind turbines. Theodels have been extensively tested and the best model, derived
y the neural network algorithm, was applied to 18 data sets. The
ig. 13 Scatter plot of the observed and predicted values ofhe tower acceleration for the first 200 points of Turbine 2 incenario 3
erformance of all models was evaluated using different metrics.
31008-12 / Vol. 132, AUGUST 2010
ded 14 Jun 2010 to 128.255.53.136. Redistribution subject to ASM
The ultimate goal of this research was to drive an accuratemodel to predict vibrations of the drive train acceleration andtower acceleration. Such models will play an important role indevising control strategies minimizing wind turbine vibrations.Since these models are nonparametric, in general, conventionaloptimization algorithms cannot be applied to solve them, ratherevolutionary algorithms are needed. Such computational intelli-gence approaches will be developed in the future research.
AcknowledgmentThe research reported in the paper has been supported by fund-
ing from the Iowa Energy Center, Grant No. 07-01.
References�1� Ko, H.-S., Lee, K. Y., Kang, M.-J., and Kim, H.-C., 2008, “Power Quality
Control of an Autonomous Wind-Diesel Power System Based on Hybrid In-telligent Controller,” Neural Networks, 21�10�, pp. 1439–1446.
�2� Mutlu, Ö. S., Akpınar, E., and Balıkcı, A., 2009, “Power Quality Analysis ofWind Farm Connected to Alaçati Substation in Turkey,” Renewable Energy,34�5�, pp. 1312–1318.
�3� Kusiak, A., Zheng, H.-Y., and Song, Z., 2009, “Short-Term Prediction of WindFarm Power: A Data-Mining Approach,” IEEE Trans. Energy Convers., 24�1�,pp. 125–136.
�4� Monfared, M., Rastegar, H., and Kojabadi, H. M., 2009, “A New Strategy forWind Speed Forecasting Using Artificial Intelligent Methods,” Renewable En-ergy, 34�3�, pp. 845–848.
�5� Damousis, I. G., Alexiadis, M. C., and Theocharis, J. B., 2004, “A FuzzyModel for Wind Speed Prediction and Power Generation in Wind Parks UsingSpatial Correlation,” IEEE Trans. Energy Convers., 19�2�, pp. 352–361.
�6� Barthelmie, R. J., Frandsen, S. T., Nielsen, M. N., Pryor, S. C., Rethore, P.-E.,and Jørgensen, H. E., 2007, “Modelling and Measurements of Power Lossesand Turbulence Intensity in Wind Turbine Wakes at Middelgrunden OffshoreWind Farm,” Wind Energy, 10�6�, pp. 517–528.
�7� Castro Mora, J., Barón, J. M. C., Santos, J. M. R., and Payán, M. B., 2007,“An Evolutive Algorithm for Wind Farm Optimal Design,” Neurocomputing,70�16–18�, pp. 2651–2658.
�8� Kusiak, A., Zheng, H.-Y., and Song, Z., 2009, “On-Line Monitoring of PowerCurves,” Renewable Energy, 34�6�, pp. 1487–1493.
�9� Kusiak, A., Zheng, H.-Y., and Song, Z., 2009, “Models for Monitoring WindFarm Power,” Renewable Energy, 34�3�, pp. 583–590.
�10� Leithead, W., and Connor, B., 2000, “Control of Variable Speed Wind Tur-bines: Dynamic Models,” Int. J. Control, 73�13�, pp. 1173–1188.
�11� Fadaeinedjad, R., Moschopoulos, G., and Moallem, M., 2008, “Investigationof Voltage Sag Impact on Wind Turbine Tower Vibrations,” Wind Energy,11�4�, pp. 351–375.
�12� Murtagh, P. J., Ghosh, A., Basu, B., and Broderick, B. M., 2008, “PassiveControl of Wind Turbine Vibrations Including Blade/Tower Interaction andRotationally Sampled Turbulence,” Wind Energy, 11�4�, pp. 305–317.
�13� Hau, E., 2000, Wind-Turbines: Fundamentals, Technologies, Application andEconomics, Springer, New York.
�14� Fernando, D. B., Hernán, D. B., and Ricardo, J. M., 2007, Wind TurbineControl Systems: Principles, Modelling and Gain Scheduling Design,Springer, London, UK.
�15� Friedman, J. H., 1999, Stochastic Gradient Boosting, Department of Statistics,Stanford University, Stanford, CA.
�16� Friedman, J. H., 2001, “Greedy Function Approximation: A Gradient BoostingMachine,” Ann. Stat., 29, pp. 1189–1232.
�17� Siegelmann, H. T., and Sontag, E. D., 1994, “Analog Computation via NeuralNetworks,” Theor. Comput. Sci., 131�2�, pp. 331–360.
�18� Cybenko, G. V., 1989, “Approximation by Superpositions of a SigmoidalFunction,” Math. Control, Signals, Syst., 2, pp. 303–314.
�19� Smith, M., 1993, Neural Networks for Statistical Modeling, Van NostrandReinhold, New York.
�20� Fisher, R. A., 1915, “Frequency Distribution of the Values of the CorrelationCoefficient in Samples From an Indefinitely Large Population,” Biometrika,10, pp. 507–521.
�21� Wowk, V., 1991, Machinery Vibration: Measurement and Analysis, McGraw-Hill, New York.
�22� Schölkopf, B., Burges, C. J. C., and Smola, A. J., 1999, Advances in KernelMethods: Support Vector Learning, MIT, Cambridge, MA.
�23� Steinwart, I., and Christmann, A., 2008, Support Vector Machines, Springer-Verlag, New York.
�24� Breiman, L., 2001, “Random Forests,” Mach. Learn., 45, pp. 5–32.
Transactions of the ASME
E license or copyright; see http://www.asme.org/terms/Terms_Use.cfm