analytical analysis of roman amphorae
TRANSCRIPT
SAPIENZA UNIVERISTY OF ROME
ARCHMAT
(ERASMUS MUNDUS MASTER IN ARCHaeological MATerials Science)
ANALYTICAL ANALYSIS OF ROMAN AMPHORAE
Dauren Adilbekov 1723220
Gabriele Favero, Sapienza University of Rome
Catherine Vieillescazes, University of Avignon
Carole Mathe de Souza, University of Avignon
Rome, October 2016

ii
Abstract
The analysis of organic residues present in ancient pottery can give important information for
archaeologists. Diets, habits, technologies and original use of the vessels can be identified
through this studies.
Fourier transform infrared spectroscopy (FT–IR) and gas chromatography coupled with mass
spectrometry (GC–MS) were used in order to analyse organic resinous materials from the
interior surfaces of Roman amphorae belonging to the archaeological collection of DRASSM
and Museum of Arles Antique. In addition, wine amphorae from Grand Congloué 2 shipwreck
were analysed. The FTIR spectra obtained by the technique of KBr micropellets, prepared
directly with the materials scraped from the amphora without any further sample preparation,
provided enough information to establish their diterpenoic nature. GC–MS enabled to identify
dehydroabietic acid, 7-oxodehydroabietic acid, 7-hydroxy-dehydroabietic acid, 15-hydroxy-7-
oxodehydroabietic acid, methyl dehydroabietate, retene. The presence of diterpenoids and retene
provided evidence that the amphorae examined were waterproofed with a pitch produced from
resinous wood of plants from the Pinaceae family or mainly consist of Coniferae species.
Moreover presence of retene in samples indicates that pitch was heated. Wine and fish amphorae
were studied. Some fish amphorae samples did not show the presence of pitch in GC-MS
analyses. This work studies for the first time pitch of an fish amphorae in the laboratory of
IMBE.
KEYWORDS: ROMAN AMPHORAE, GC-MS, FT-IR, PITCH, DITERPENOIDS, WINE
AMPHORAE, FISH AMPHORAE, GRAND CONGLOUÉ 2
iii
Acknowledgement
It has been a period of intense learning for me, not only in the educational arena, but also on a
personal level. Writing this thesis has had a big impact on me. I would like to reflect on the
people who have supported and helped me so much throughout this period.
I would like to express my sincere gratitude to my thesis supervisors Prof. Catherine
Vieillescazes, Prof. Carole Mathe (IMBE, University of Avignon, France) and Prof. Gabriele
Favero (Department of Chemistry and Drug Technologies, Sapienza University of Rome, Italy)
for their valuable guidance throughout the work. I would like to thank Celine Joliot (IMBE,
University of Avignon) for assistance with GC-MS and FT-IR instruments. Special thanks to
Ph.D. student Hitomi Fujii (University of Avignon) for guidance during actual laboratory work
and during the interpretation of the results. I would like to thank IMBE team members Salma
Ghezal, Jean-Baptiste Mazzitelli and Fatina Jouni.
My sincere thanks also go to Prof. Donatella Magri (Department of Environmental Biology,
Sapienza University of Rome) for help with handling the official documents and necessary
procedures in preparing for Thesis defense.
Thanks to ARCHMAT Consortium Prof. Nick Schiavon (University of Évora), Prof. Giovanni
Ettore Gigante (Sapienza University of Rome) and Prof. Evangelia A. Varella (Aristotle
University of Thessaloniki). This work was made possible by an ARCHMAT Erasmus Mundus
scholarship under the FPA agreement 0238-2013 between EACEA agency of the EU and the
University of Évora.
I must express my profound gratitude to my parents Nurlan Adilbekov and Raushan Adilbekova
and to my brother Yerlan Adilbekov for providing me with support and encouragement, patience
and wise advices throughout my studies. I would like to say thanks for support to all my family.
Finally, there are my friends, who helped me a lot in different situations and gave me energy to
accomplish my thesis work: Aida Sundetova, Aubakir Arstanbekov, Dariy Khalitov, Alesya
Tkachenko, Francisco Centola, Ayana Tulebekova, Laura Ali, Aman Maldewo, Leonor Costa,
Diego Badillo, Rassul Zhakupov, Rauan Kurmangaliyev and Yelnar Omarov. Thank you very
much!

iv
List of tables
Table 1. The average volumes of wine, oil and fish (garum) amphorae on the
Mediterranean sites.............................................................................................
5
Table 2. The capacity and possible contents of some amphorae types......................... 6
Table 3. Characteristic IR absorptions of some functional groups............................... 22
Table 4. Samples from Grand Congloué 2 shipwreck................................................... 26
Table 5. Wine amphorae samples (apart from Grand Congloué 2 samples)................. 27
Table 6. Samples from Museum of Arles. Fish amphorae............................................ 27
Table 7. Summary of results obtained by GC-MS of wine amphorae samples................ 29

v
List of figures
Figure 1. Amphora.............................................................................................................. 3
Figure 2. Amphora stowage aboard ship............................................................................ 4
Figure 3. Relative volumes of oil, wine and garum in Western Europe............................. 6
Figure 4. Distribution of Dressel I amphorae of all types in Gaul..................................... 7
Figure 5. Beltrán 2A type of amphora................................................................................ 8
Figure 6. Beltrán 2B........................................................................................................... 8
Figure 7. Dressel 1C........................................................................................................... 9
Figure 8. Dressel 7.............................................................................................................. 10
Figure 9. Dressel ................................................................................................................ 11
Figure 10. Dressel 9.............................................................................................................. 11
Figure 11. Dressel 12 type.................................................................................................... 12
Figure 12. Dressel 14 type.................................................................................................... 12
Figure 13. Abietic acid......................................................................................................... 14
Figure 14. Dehydroabietic acid............................................................................................. 15
Figure 15. 7-oxo-dehydroabietic acid................................................................................... 15
Figure 16. Retene.................................................................................................................. 16
Figure 17. Methyl ester of dehydroabietic acid.................................................................... 16
Figure 18. Oxidation scheme of abietanes............................................................................ 17
Figure 19. Electromagnetic spectra...................................................................................... 20
Figure 20. Schematic representation of mass spectrometer.................................................. 23
Figure 21. Electron ionization.............................................................................................. 24
Figure 22. GC2.SN.11.......................................................................................................... 25
Figure 23. ARL 9 amphorae................................................................................................. 26
Figure 24. Thermo Scientific™ Nicolet™ iS™10 FTIR Spectrometer............................... 29
Figure 25. GC-MS Thermo Scientific™ ITQ700 Focus...................................................... 30
Figure 26. FT-IR spectrum of GC2.SN.5 sample................................................................. 31
Figure 27. FT-IR spectrum of the sample SL2878............................................................... 32
Figure 28. FT-IR spectrum of ARL9 fish amphorae sample................................................ 33
Figure 29. Total ion chromatogram of GE3932 wine amphorae sample............................. 35
Figure 30. Total ion chromatogram of SL2878 wine amphorae sample.............................. 36
Figure 31. Oxidation reaction paths of diterpenoid compounds of pine pitch .................... 37
Figure 32. Total ion chromatogram of ARL 9 obtained by GC-MS.................................... 38
Figure 33. Total ion chromatogram of 2970 fish amphorae sample..................................... 39
vi
Table of Contents
1. Introduction...................................................................................................................... 1
2. Background information........................................................................................................
2.1 Amphora...............................................................................................................................
2.1.1 Commercial amphora........................................................................................................
2.1.2 Types of amphorae.....................................................................................................
2.2 The chemistry of resinous substances.............................................................................
2.3 Previous studies..............................................................................................................
2.4 Analytical techniques......................................................................................................
3
3
4
7
13
18
20
3. Materials and methods......................................................................................................
3.1 Analysed samples...........................................................................................................
3.2 Analytical methods.........................................................................................................
3.2.1 Reagents and standards...............................................................................................
3.2.2 FT-IR analysis.........................................................................................................
3.2.3 GC-MS analysis......................................................................................................
25
25
28
28
28
29
4. Results and discussion......................................................................................................
4.1 FT-IR..............................................................................................................................
4.1.1 Grand Congloué 2 samples .....................................................................................
4.1.2 Wine amphorae samples ..........................................................................................
4.1.3 Fish amphorae samples ..............................................................................................
4.2 GC-MS............................................................................................................................
4.2.1 Wine amphorae samples .........................................................................................
4.2.2 Fish amphorae samples ...........................................................................................
31
31
31
32
33
34
34
38
5. Conclusion........................................................................................................................ 41
6. Bibliographical references................................................................................................. 43
Appendix 1....................................................................................................................... 47
Appendix 2....................................................................................................................... 49
Appendix 3....................................................................................................................... 50
Appendix 4....................................................................................................................... 52
Appendix 5....................................................................................................................... 53
Appendix 6....................................................................................................................... 55
Appendix 7....................................................................................................................... 76

1
1. Introduction
Presentation of the laboratory
The laboratory work and the interpretation of the results has been done at IMBE1
laboratory in IRPNC2 team of University of Avignon (France). One of the main research
axis of the team is the study of artistic and archaeological materials. Those studies have
contributed over several years to the chemical and analytical knowledge of natural plant
products by microchemical, chromatographic (HPLC with UV-vis/fluorimetry detector,
GC-MS) and spectroscopic (FT-IR, fluorimetry, UV-vis spectrometry, colorimetry)
techniques.
The laboratory develops analytical methods that enable the identification of chemical
markers, characteristic of the natural materials used in cultural heritage (resins, dyes,
pigments, binding media, etc.). This approach includes the comprehension of the
mechanisms of thermal and photochemical degradation suffered by the identified markers.
In chemistry field, the team works on the analytics, identification and use of natural
substances in fine arts and archaeology. The research addresses biomarkers and markers of
natural or anthropogenic degradation of different materials (resins, colors). The studies
concern the sectors of artwork restoration and cultural heritage conservation. The
metabolomic approach of ancient and fresh plant compounds involves collaborations with
botanists and specialists in natural substances. The cooperation with different national and
international groups of scientists (European projects mostly) put the laboratory team in the
center of the thematic and allows is to be aware of the new advances in this field of
science.
Presentation of the subject and the aim of the research work
This study concerns DRASSM3 collection of amphorae from Grand Congloué 2 shipwreck
and Museum of Arles (both – France) collections. Roman amphorae were discovered in
1952 by Commander Cousteau in the bay of Marseille in France (wreck of Grand
Congloué 2). He concluded that most of the ship's wine cargo had been stored in amphorae
produced by the wealthy Sestius family from Cosa, a port of Rome. The wrecks of Grand
1 IMBE – l'Institut Mediterraneen de la Biodiversite et d'Ecologie marine et continentale
2 IRPNC – (Ingéniérie de la Restauration des Patrimoines Naturel et Culturel) – Ecological
Restoration of Ecosystems and Cultural Heritage. 3 DRASSM – Le Departement des recherches archeologiques subaquatiques et sous-marines (The
Department of Underwater Archaeological Research)
2
Congloué are about 40 m long, loaded with Greek, Greco-Italian and Roman amphorae.
The finds were on a slope at 28 - 44 m depth. It is interesting that it took experts 25 years
of study to determine that there are actually two superimposed ships, which sank close to a
century apart.
The shipwreck Grand Congloué 1 dates to the second century BC. Its cargo consisted in
essence of about 400 wine amphorae of Greco-Roman origin, and 7000 pieces of dishes
from Campania. About 30 Greek amphorae completed the lot. The shipwreck Grand-
Congloué 2, dating to the late second or very early first century BC, contained more than a
thousand Roman wine amphorae of the type Dressel 1A. Recent studied have proven that
they came from Cosa in Etruria, the present-day Tuscany (Olmer et al.).
The aim of this study is to determine the molecular composition of the organic substances
used to proof the amphorae (pitch) and the content. The objective of this research work is
to characterize the presence of this type of substances by using spectroscopic (FT-IR) and
chromatographic (GC-MS) techniques.
The presented work is a part of a bigger project of Hitomi Fujii (Ph.D. student of the
University of Avignon), who is working on Roman amphorae under the project
"Chromatographic study of archaeological organic materials". The shipwreck of Grand
Congloué 2 is also a subject of studies of Hitomi Fujii under the project "The
characterization of resinous material inside Roman amphorae and the identification of
content" (University of Avignon).
The work "Analytical analysis of Roman amphorae" has been done under guidance of
Ph.D. student Hitomi Fujii and the supervisory guidance from Professors Catherine
Vieillescazes and Carole Mathe de Souza (University of Avignon). Gabriele Favero was
the supervisor from Consortium side (Sapienza University of Rome). The studies were
performed under European programs, i.e. program Erasmus Mundus Master in
ARCHaeological MATerials Science (ARCHMAT) (University of Avignon is an associate
partner of ArchMAT program, 2013-2017).
3
2. Background information
Before the presentation of the work itself, the general and specific information about
amphorae will be presented in this section. The background information of this paper
consists of four parts. The commercial amphora and amphorae types will be discussed in
the first section. Following by information about contents of the amphorae and pitch and
their importance in amphora studies. Special focus will be done on previous studies and
literature review to provide a link between historical importance of amphorae with the
modern analytical studies of them. Finally, the analytical techniques used in this studies
will be described.
2.1 Amphora
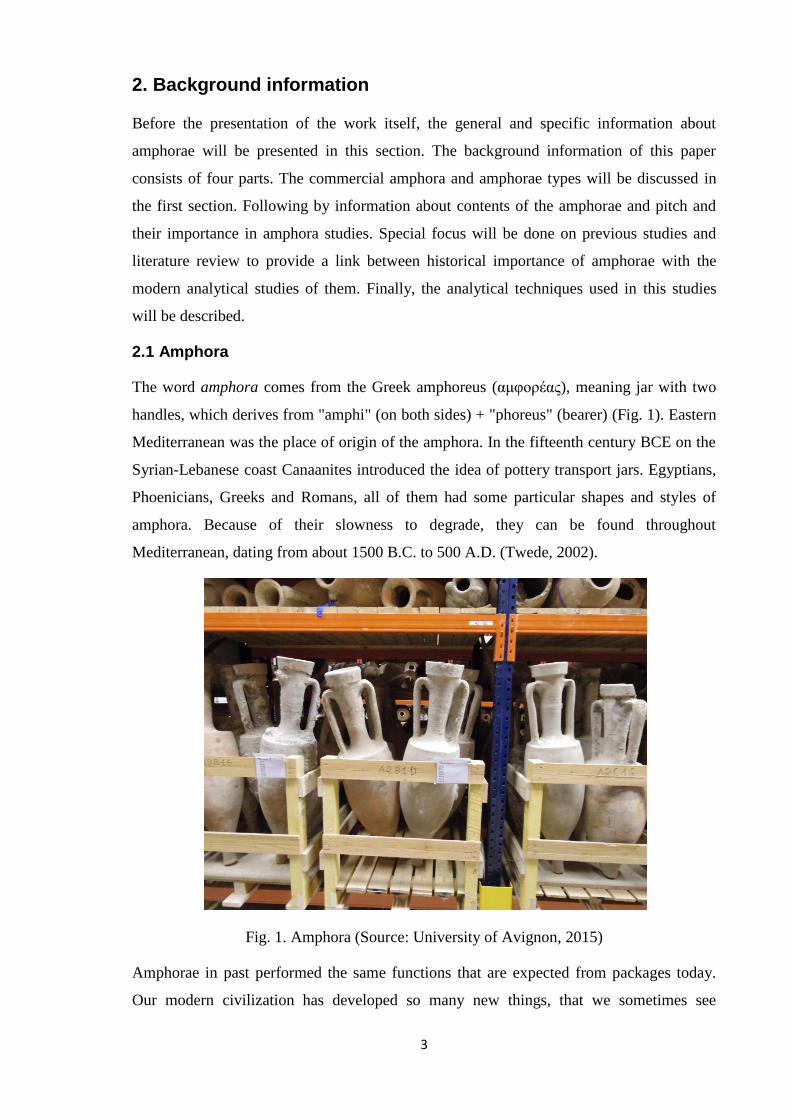
The word amphora comes from the Greek amphoreus (αμφορέας), meaning jar with two
handles, which derives from "amphi" (on both sides) + "phoreus" (bearer) (Fig. 1). Eastern
Mediterranean was the place of origin of the amphora. In the fifteenth century BCE on the
Syrian-Lebanese coast Canaanites introduced the idea of pottery transport jars. Egyptians,
Phoenicians, Greeks and Romans, all of them had some particular shapes and styles of
amphora. Because of their slowness to degrade, they can be found throughout
Mediterranean, dating from about 1500 B.C. to 500 A.D. (Twede, 2002).
Fig. 1. Amphora (Source: University of Avignon, 2015)
Amphorae in past performed the same functions that are expected from packages today.
Our modern civilization has developed so many new things, that we sometimes see

4
everything as something unique and we think that in the past there was nothing similar to
our nowadays technologies. At the same time we should always bear in mind that modern
technologies are based on cultural and practical needs that remain the same as in the past.
In this particular case use and importance of the commercial amphorae will be discussed.
2.1.1 Commercial amphora
Amphorae is a good example of past packaging technologies. Although it could be possible
that other types of packages were also used in the past, now we mostly can talk about
amphora as an example. The modern terms, like "logistics", "packaging", "ergonomically
efficient" are perfectly applied to such ancient objects as amphorae. Amphorae were
ergonomically efficient, cause their size and shape were intended for handling by one
person and they were easy to carry. Amphorae were the object of the first recorded
logistical system for managing reusable shipping containers. And indeed they were one of
the earliest consumer packages in human history. Our traditional view on packaging lays
on modern conception of square shape. In the past, however, it was the amphorae shape
that was successful for shipping and handling (Fig. 2).
Fig. 2. Amphora stowage aboard ship (Source: Diana Twede, 2002)
The pointed base served as a third handle, below the weight, useful when one inverts a
heavy vessel to pour from it (Grace, 1961). Moreover, there were advertising claims
depicted on amphorae: Peacock and Williams translate the following tituli picti from a jar

5
found in London: "Lucius Tettius Africanus finest fish sauce (liquam) from Antipolis,
product of Africanus." (Twede, 2002).
As we can see, amphorae were truly one of the best examples of ancient economy
packages. It is important to mention that amphorae were different from other types of
ceramic jars. Mainly because they were not made for any domestic or day-to-day use but
were designed specifically for shipping and storing. They were used for simple and strictly
utilitarian purpose of either storing or transporting some commodity, like a large quantity
of liquid (wine, olives, oils, and processed fish sauce) or dry products such as grain, nuts
and salted fish.
Wine together with olive and grain formed so called "big three" of Roman cuisine. And
number four, according to some studies, was taken by fish products (Ejstrud, 2005). While
it is quite well known fact that wine was transported in amphorae, less known about fish
transportation. In general, amphorae were not primarily intended as containers of fish or
fish products, but occasionally they could be used for this purpose (Lund and Gabrielsen,
2005). Garum as well as the other types of fermented fish-sauce was a popular part of
Roman cuisine and was transported all over the Roman Empire (Ejstrud, 2005). Not only
Mediterranean countries were involved in fish trading. Gallant mentions that fish from the
Black Sea "was a luxury item, aimed at a very restricted market" in Mediterranean area
(Lund, Gabrielsen, 2005).
Particularly interesting information has Bo Ejstrud's article (Ejstrud, 2005). In there it is
mentioned that the investigation on four West Europe archaeological sites had been done,
they are: Nijmegen, Avenches, Saint-Romain-en-Gal and Rome (Fig. 3). In general very
interesting picture of the average consumption of wine, olive and garum is given in this
article. The results showed that average volumes of amphorae on these Mediterranean sites
62% was wine, 28% and 10% were oil and garum, respectively (Table 1).
Due to studies of Ejstrud, we know more about amphorae types containing certain types of
food. For example, a typical Dressel 20 amphora had the capacity of 60-70 litres of olive
oil, and the average Dressel 7 amphora contained about 14-18 litres of garum (Table 2).
Table1
The average volumes of wine, oil and fish (garum) amphorae on the Mediterranean sites.
Relative volumes, %
Wine 62.25
Oil 27.92
Garum 9.83

6
In table 2, the general overview is done on some amphorae types capacity.
Table 2
The capacity and possible contents of some amphorae types.
Type Content m (litre)
Dressel 6A Garum 26
Dressel 7 Garum 16
Dressel 8 Garum 21
Dressel 9 Garum 42
Dressel 10 Garum 16
Dressel 11 Garum 16
Dressel 12 Garum 20
Dressel 14 Garum 26
Dressel 16 Garum 10
Dressel 6B Oil 20
Dressel 20 Oil 66
Dressel 1 Wine 26
Dressel 2-5 Wine 28
Dressel 43 Wine 17.5
Fig. 3. Relative volumes of oil, wine and garum in Western Europe. (Source: Ejstrud,
2005)
7
2.1.2 Types of amphorae
It is known, there are many types of amphorae. Here only some of them will be discussed,
Beltran and Dressel types. Heinrich Dressel grouped amphorae into types based on their
form and place of manufacture. Thanks to the typology began by Dressel, amphorae now
provide reliable spatial and temporal information about Roman trade throughout the
Mediterranean zone.
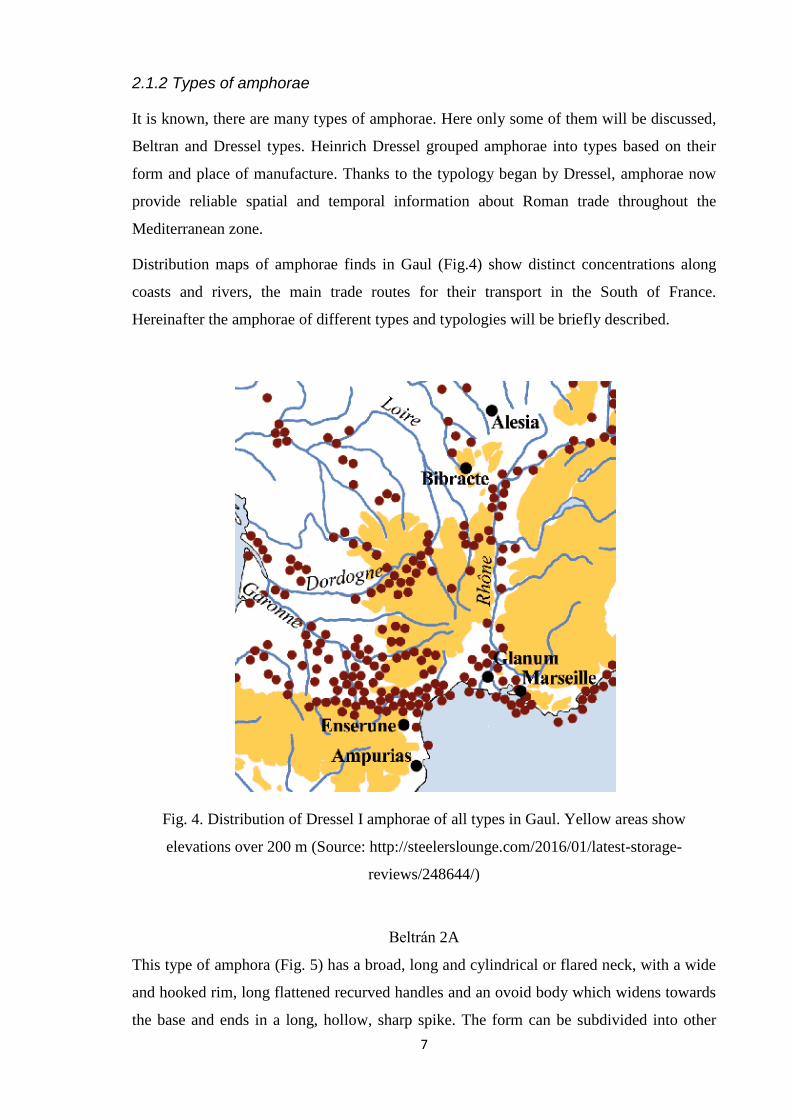
Distribution maps of amphorae finds in Gaul (Fig.4) show distinct concentrations along
coasts and rivers, the main trade routes for their transport in the South of France.
Hereinafter the amphorae of different types and typologies will be briefly described.
Fig. 4. Distribution of Dressel I amphorae of all types in Gaul. Yellow areas show
elevations over 200 m (Source: http://steelerslounge.com/2016/01/latest-storage-
reviews/248644/)
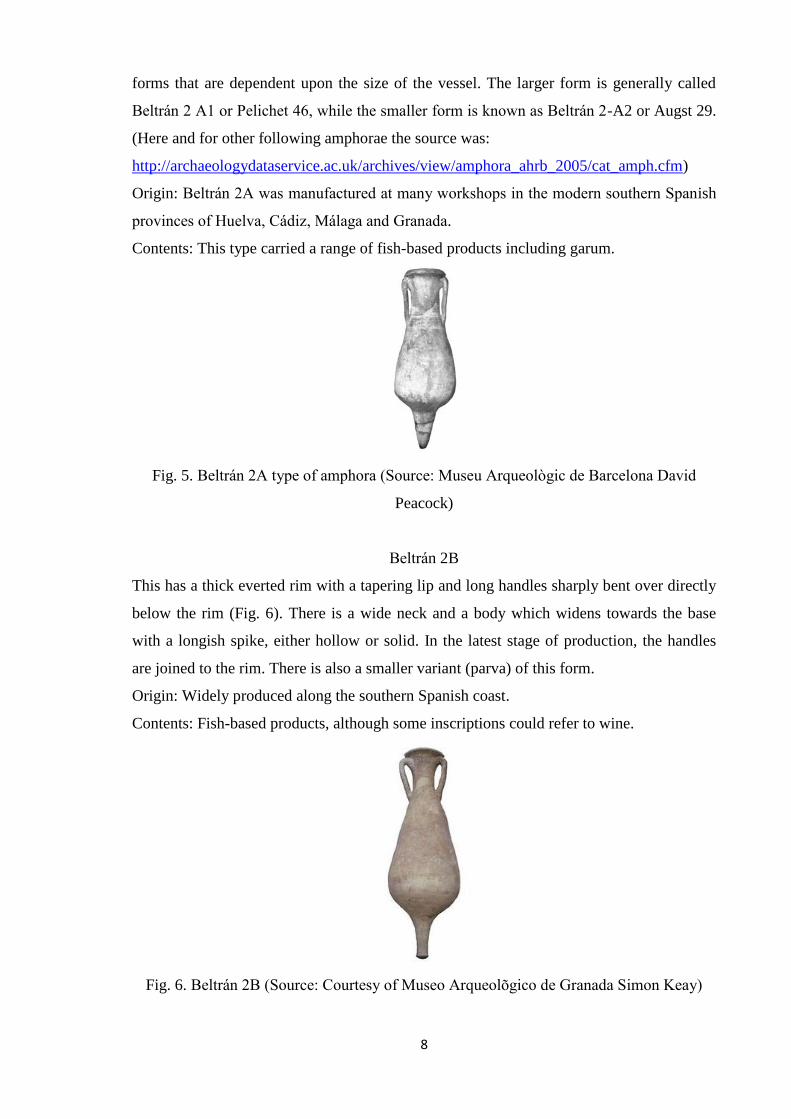
Beltrán 2A
This type of amphora (Fig. 5) has a broad, long and cylindrical or flared neck, with a wide
and hooked rim, long flattened recurved handles and an ovoid body which widens towards
the base and ends in a long, hollow, sharp spike. The form can be subdivided into other
8
forms that are dependent upon the size of the vessel. The larger form is generally called
Beltrán 2 A1 or Pelichet 46, while the smaller form is known as Beltrán 2-A2 or Augst 29.
(Here and for other following amphorae the source was:
http://archaeologydataservice.ac.uk/archives/view/amphora_ahrb_2005/cat_amph.cfm)
Origin: Beltrán 2A was manufactured at many workshops in the modern southern Spanish
provinces of Huelva, Cádiz, Málaga and Granada.
Contents: This type carried a range of fish-based products including garum.
Fig. 5. Beltrán 2A type of amphora (Source: Museu Arqueològic de Barcelona David
Peacock)
Beltrán 2B
This has a thick everted rim with a tapering lip and long handles sharply bent over directly
below the rim (Fig. 6). There is a wide neck and a body which widens towards the base
with a longish spike, either hollow or solid. In the latest stage of production, the handles
are joined to the rim. There is also a smaller variant (parva) of this form.
Origin: Widely produced along the southern Spanish coast.
Contents: Fish-based products, although some inscriptions could refer to wine.
Fig. 6. Beltrán 2B (Source: Courtesy of Museo Arqueolõgico de Granada Simon Keay)

9
Dressel 1
The earliest Roman amphorae were Dressel type I, originating in Italy from the late 2nd
century BCE to the early 1st century CE. Many came from Cosa on the Mediterranean
coast. This was the most common type of late Republican Roman amphora (Fig. 7).
Following an early classificatory scheme by Lamboglia (1955), the type is conventionally
sub-divided into three sub-types, known as the Dressel 1A, 1B and 1C, which are still used
today. These sub-types are distinguished largely on the basis of differences in the shape of
the rim (discussed critically by Tchernia, 1986: 312-20). The Dressel 1A has a pronounced
triangular rim, often quite difficult to distinguish from the rim of the Greco-Italic type; the
rim of the Dressel 1B has a thick near vertical collar rim; the rim of the Dressel 1C takes
the form of a narrow mouth and a high collar, which flares outwards in the earlier versions,
and which Will (1982) suggests is directly derived from her Greco-Italic form Will 1E.
There are few significant differences in the shape of the bodies of these three sub-types
although those of the Dressel 1A and B tend to be heavier and more cylindrical while that
of the Dressel 1C tends to be more spindle-like. Furthermore, the neck of the Dressel 1C
tends to be wider at the bottom closer to its junction with the shoulder. A broad scheme to
distinguish between the varieties of Dressel 1A and 1B handles and spikes has been
suggested by Stockli (1979), based mainly on the size of these features, but its practical use
is perhaps doubtful given the nuances of form which are sometimes apparent in the general
class of Dressel 1 amphora. The Dressel 1 is sometimes stamped on the rim and very
occasionally on the neck. Where present, the stamp normally consists of two or three
letters, sometimes more, or a symbol (such as an anchor or trident) or both. Alphabetical
symbols were used in the ager cosanus, particularly at the kiln at Albinia, while elsewhere
the stamps are quite often in the form of names (e.g. Sestius).
Fig. 7. Dressel 1C. (Source: Courtesy of Prof. D.P.S. Peacock David Peacock)

10
Contents. Tituli picti (painted inscriptions) make it clear that the predominant content
carried was wine (Tchernia, 1986). However, spondylus shells, resin and hazelnuts have
been found in examples of the Dressel 1B, while garum has been suggested as a possible
content for examples of the Dressel 1C at Pompeii, and olives were found in a Dressel 1C
from the Cavalière wreck.
Dressel 7
This type has a straight mouth, with a thick external band, a heavy cylindrical neck (10-15
cms diameter) around 12-20 cm long, flattened handles which have a median furrow
groove on the external face and an ovoid body. The spike is 15-20 cms long, hollow. It can
be ascribed to the broader Dressel 7-11 and Beltrán 1 groupings (Fig.8).
Origin. This type was produced in a myriad of workshops such as Gallineras, El
Rinconcillo and Cerro del Mar in the coastal areas of southern Spain (Cádiz and Málaga
provinces). Production has also been attested along the west coast of Morocco at Khédis
and Sala, as well as at Volubilis.
Contents. Tituli picti suggests several types of fish-sauce.
Fig. 8. Dressel 7 (Source: Courtesy of the Trustees of the British Museum David Williams)
Dressel 8
This form has a bell shaped mouth with a thickened short rim which has a concave outer
face, a heavy cylindrical neck with long flattened handles sharply bent over below the rim
and a 'radish-shaped' body which has a long hollow spike (Fig. 9).
Contents. Tituli picti suggests fish-sauce.

11
Fig. 9. Dressel 8.
Dressel 9
This type has a bell mouth with a rim which has a concave outer face, sometimes similar to
Dressel 7 or Dressel 8 rims (Fig. 10); a cylindrical neck generally smaller than Dressel 7 or
Dressel 8, flattened handles, sharply bent below the rim and straight to the body; and a
piriform or ovoid body which has a long hollow spike ending in a flat bottom.
Contents. Tituli picti suggests fish sauce
Fig. 10. Dressel 9. (Source: Musée Archaéologique Intercommunal d’Istres David
Williams)
Dressel 12
A short everted rim and long slim neck with ovoid handles (Fig.11). The body is
cylindrical with a short solid spike. The rim becomes gently wider towards the top. The
shoulder is noticeably present, usually supporting the handles, but there is no ridge. These
handles generaly appear on long-necked amphorae, attaching near the top of the neck
progressing vertically downwards to the shoulder. The handle appears to be ovoid or
elliptical in section.
Contents. Tituli picti suggest fish-based products.
Distribution. Spain and Italy (Beltrán, 1970), but rare in the northern provinces.

12
Fig. 11. Dressel 12 type. (Source: City Hall of Puerto Real, Cádiz (Lazaro Lagóstena)
Villanueva site)
Dressel 14
This has a thickish beaded rim and ovoid handles with a shallow groove down the centre
(Fig. 12). The cylindrical body has a long hollow spike. In the southernmost part of
Portugal, near Castro Marim, a production centre was identified in the late 19th century
which produced amphorae similar to the Dressel 14 but with a short neck and an oval
body.
Contents. Tituli picti suggest fish-based products. The discovery of kilns in Portugal
confirm this suggestion.
Fig. 12. Dressel 14 type. (Source: Courtesy of Jewry Wall Museum, Leicester
David Peacock)

13
2.2 The Chemistry of Resinous Substances
Amphorae were obtained by cooking clays at moderate temperatures. Due to high porosity
of clay they were permeable and unsuitable for storing liquids. Thus, waterproofing was
made necessary before amphorae could be used for transportation and storage purposes.
From Plinii and Columella – the Roman authors of the first century B.C. – we know that a
material called pix (pitch) was used for waterproofing. With this product, internal
waterproofing was carried out on every type of ceramic recipient for wine and probably for
any type of food container (Font et al., 2007).
Pitch is the residue after the distillation of volatile resin components in an open vessel. It is
an organic substance obtained by combustion of resin exudates or resinous wood, insoluble
in water but soluble in organic solvents like acetone, methanol and dichloromethane.
Usually pitch has a variable colour from light ochre to black. This substance was probably
preferred to other organic compounds for its capacity to impart a particular aromatic
strength to the wine, so called flavor enhancement (Izzo et al., 2012). When obtained from
pine resin, it may be called pine pitch; when obtained from other plant resins, it may be
called more generally wood pitch. The resinous substances secreted by trees have been
widely used either in their natural form or as tar and pitch to waterproof the planking of
ships and vessels (Duce et al., 2014).
A resin is one of a number of natural products defined as a plant exudate. Resins are non-
cellular, water insoluble substances and serve to protect higher plants, if wounded, from
excessive water loss and the invasion of microorganisms. Resins often comprise both
volatile and non-volatile fractions. The derivatives produced by heating resin, as well as
resinous wood, are collectively referred to as pyroligeneous substances. These include tar,
the initial pyrolysate, and pitch (Gianno, 1990). Resin-producing trees are found over vast
areas encompassing much of the torrid and temperate parts of the world. Resin preserves
reasonably well and possesses a wide array of functional attributes. The properties of
adhesiveness, insolubility in water, inflammability, healing and poisoning properties,
fragrance, plasticity, vitreosity, colorability, pigment mediability, and resistance to
spoilage are qualities that apply, to a greater or lesser degree, to all resins (Gianno, 1998).
As such, these natural substances have played a role in most communities. The ancient
Greeks, and probably not only them, noticed that the pine resin had not only helped to seal
amphorae and isolate it from moisture, but also had played the role of a curing agent and
helped to keep the wine during transporting it by sea (Zlateva et al. 2015). The pine resin
was also used to suppress the smell of goat skin, which was used as vessel for a short
distance transport of wine. Resin made from pine trees was most often used as the barrier

14
lining for wine amphora. For this reason, Plutarch claimed that the pine tree is sacred to
Dionysos (Twede, 2002).
The major components of resins are terpenoids. They have been found to survive in a large
number of archaeological contexts from around the world and are distributed widely in
plants from marine and terrestrial sources. Survivability and visibility of this compound
class in a range of burial environments is quite high. Terpenoids occur widely in the
sedimentary record, such as deep-sea sediments, fossil resin, petroleum, coal and so on
(Simoneit et al, 1986). The term terpene derives from 'terpen' and is attributed to Kekule
who used it to describe C10H16 hydrocarbons in turpentine oil.
Terpenoids are divided up into special classes of mono-, sesqui-, di-, and triterpenoids
which have 10, 15, 20, and 30 carbon atoms per molecule respectively. At normal
temperatures the first two of the classes are usually liquids, whereas di- and triterpenoids
normally are solids. It should be also noted that di- and triterpenoids have never so far been
found together in resins. On this basis, they can be divided in two main groups.
In this work focus will be on diterpenoids. The main group of diterpenoid (C20 compounds)
resin producers are the Coniferae families (Pinaceae, Cupressaceae and Araucariaceae).
The second main group comes from trees of the sub-family Caesalpinioideae of the
enormous Leguminosae family. Diterpenoids serve as valuable marker compounds of
terrigenous resinous plants. The most abundant sources of resin in temperate regions are
trees of the genus Pinus. Diterpenoid compounds possess mainly abietane, pimarine and
labdane skeletons. In 'soft' resins (i.e. those containing no polymerized structures), such as
those derived from Pinaceae, abietane and pimarine compounds are predominant. The
Pinaceae, and especially Pinus, generally have resins with a high content of abietic acid
(AA) (Fig. 13), a tricyclic molecule, and a small number of abietane isomers (Mills and
White, 1994).
Fig. 13. Abietic acid

15
The double bonds in abietane acids are conjugated and in fresh Pinus resins will undergo
significant modification during treatment. Warming of the resin (e.g. during distillation to
remove oil of turpentine) induces isomerization reactions leading to a mixture enriched in
abietic acid at the expense of other abietane molecules (Mills and White, 1977). The solid
product remaining is referred to as rosin or colophony.
Fig. 14. Dehydroabietic acid
Terpenoids are susceptible to a number of alterations mediated by oxidation and reduction
reactions. For example, the most abundant molecule in aged Pinus samples is
dehydroabietic acid (DHA) (Fig. 14), a monoaromatic diterpenoid based on the abietane
skeleton which occurs in fresh (bleed) resins only as a minor component. This molecule
forms during the oxidative dehydrogenation of abietic acid, which predominates in rosins.
Further atmospheric oxidation (autoxidation) leads to 7-oxodehydroabietic acid (Fig. 15)
(Pollard, Heron, 2008). In general, oxygenated products (such as 7-oxo-DHA or 7-oxo-15-
hydroxy-DHA) are the consequence of an aging process due to contact with the
atmosphere.
Fig. 15. 7-oxo-dehydroabietic acid
16
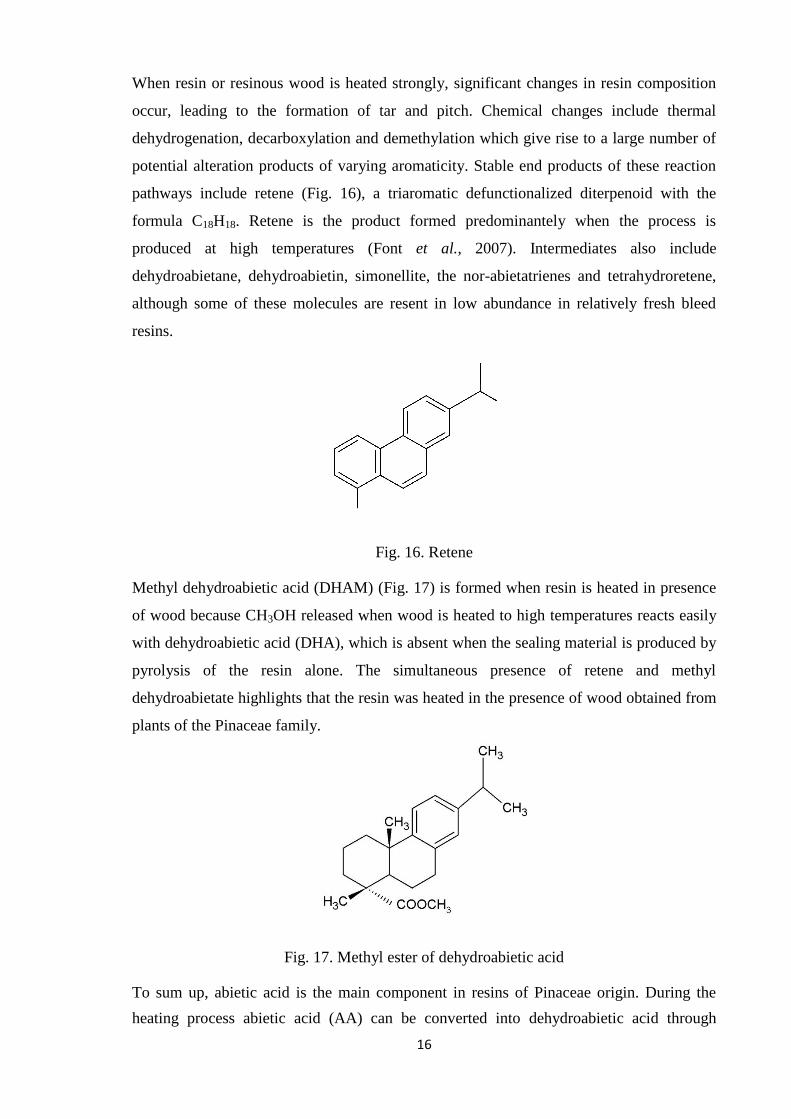
When resin or resinous wood is heated strongly, significant changes in resin composition
occur, leading to the formation of tar and pitch. Chemical changes include thermal
dehydrogenation, decarboxylation and demethylation which give rise to a large number of
potential alteration products of varying aromaticity. Stable end products of these reaction
pathways include retene (Fig. 16), a triaromatic defunctionalized diterpenoid with the
formula C18H18. Retene is the product formed predominantely when the process is
produced at high temperatures (Font et al., 2007). Intermediates also include
dehydroabietane, dehydroabietin, simonellite, the nor-abietatrienes and tetrahydroretene,
although some of these molecules are resent in low abundance in relatively fresh bleed
resins.
Fig. 16. Retene
Methyl dehydroabietic acid (DHAM) (Fig. 17) is formed when resin is heated in presence
of wood because CH3OH released when wood is heated to high temperatures reacts easily
with dehydroabietic acid (DHA), which is absent when the sealing material is produced by
pyrolysis of the resin alone. The simultaneous presence of retene and methyl
dehydroabietate highlights that the resin was heated in the presence of wood obtained from
plants of the Pinaceae family.
Fig. 17. Methyl ester of dehydroabietic acid
To sum up, abietic acid is the main component in resins of Pinaceae origin. During the
heating process abietic acid (AA) can be converted into dehydroabietic acid through

17
dehydrogenation. A series of other transformations can produce many other intermediate
organic compounds when the thermal treatment is maintained and is more intense (Fig.
18). Although the main reaction is dehydrogenation of AA to DHA, decarboxylation of
DHA produces dehydroabietin. Increasing aromatization of dehydroabietin as well as
decarboxylation of DHA generates norabietamene. Norabietamene is further
dehydrogenated to tetradydroretene and retene. Further retene dealkylation produces
phenanthrene (Fig. 18).
Fig. 18. Oxidation scheme of abietanes (Source: Pastorova et al, 1997)
Identification of ancient resin is not a straightforward task. Although ancient resins have
been researched for a long time, their chemical complexity has hindered confident
assignments. Visual characteristics and examination of simple chemical or physical
properties may offer little or no clue as to the identity of resin samples, whether ancient or
modern. Consequently, chemical analysis must be performed in order to characterize
which molecular species are present.

18
2.3 Previous studies
The first important study of amphora was performed in 1899 by Heinrich Dressel who
recorded examples of painted inscriptions and shapes. Another notable researcher was
American archaeologist Virginia Grace (in 1940-1970s). Her work has been decisive in
calling attention to the importance of amphora. As a result of her work, amphorae and their
stamped handles are now useful as a tool for dating and serve as a primary indicator for
tracing and understanding ancient trade in the Mediterranean. Callender was also one of
the pioneers in studying amphorae. He described amphorae as simply a carriers of their
contents and stresses the differences between amphorae and the other classes of pottery.
Pottery, by his opinion, were manufactured and sold as objects to be used in their own
right, while amphorae were simply carriers of their contents: "it was after all the latter (i.e.
the particular commodity that they were destined to carry) which was being sold and not
the amphora" (Callender, 1950).
The identification of a wide variety of resins in archaeological and art historical contexts
were pioneered by Mills and his coworkers at the Research Laboratory of the National
Gallery in London (Mills, 1977). Shackley (1982) used gas chromatography to examine
resinous crusts, believed to represent the former vessel contents, from a sixth century
storage jar from a site in Israel. GC analyses indicated the major constituents of the residue
were dehydroabietic and 7-oxo-dehydroabietic acid. While the presence of Pinus-type resin
was confirmed, firm conclusions about the nature of the deposit were not possible.
Historically, similar resins were used (1) in the production of unguents, (2) for caulking
and waterproofing, and (3) in resinated wine. Evershed et al. in 1985 performed studies on
pitch from the Mary Rose ship. Through studies they have found out the evidence that
pitches from Mary Rose were from pine wood.
One of the most recent studies were performed by J. Font et al. In this work, the resinous
materials from the interior surfaces of two Roman and one Iberian amphora were studied
with Fourier transform infrared (FT-IR) spectroscopy. Gas chromatography-mass
spectrometry (GC-MS) was also used in order to compare the results with those of FTIR.
The diterpenoic nature of samples from amphorae was established. Note that this work has
repeated Font's procedures in GC-MS and FT-IR analyses.
In works of Izzo et al. the pitch of Roman amphorae from Monte Poro, Calabria (Italy) was
studied by FT-IR and GC-MS. In the work it was discovered that the presence of
monocarboxylic acids and terpenic species can prove that the organic residues were of
vegetable origin and mainly consist of vegetable-based resins. The presence of methyl
19
dehydroabietic acid shows the link to the use of wood tar and not only to the pine pitch.
Izzo et al. also stated that absence of typical oxidation products of abietic acid might be
due to the different conditions of conservation. In Colombini's studies on pottery vessels
from Roman times (Colombini et al., 2005) it was established that the presence of
characteristic diterpenic biomarkers enables to assess the use of both pine resin and pine
pitch. In the work of Regert the prehistoric glues were analysed. In this article, the
triterpenoids and diterpenoids were connected with the historical periods. It was shown
that during prehistoric times, people mostly used birch bark tars. During Bronze Age, pine
resin began to be utilized in a big amounts. It was also shown that diterpenoids like
dehydroabietic, abietic and 7-oxodehydroabietic acids are markers of pine resins (Regert,
2004).
In general in amphorae resin, waterproofing materials and pitch can be studied along with
organic residues. Amphorae have been studied and classified by archaeologists, historians,
economists and ceramic petrologists. Recently with the development of technologies and
specific techniques the analytical, mainly chemical, research of amphora has been possible.

20
2.4 Analytical techniques
There has been conducted many works in the study of amphorae, mainly archaeological
and historical. With the help of new analytical techniques, it is possible to dive into the
past and to recheck and prove the information obtained from those studies or even to
discover some new data. Artefacts such as amphorae were used frequently in the past to
store and transport foodstuffs and other natural products. Consequently, traces of these
substances may survive, preserved on the surface of the amphora. Similarly, organic
molecules can occlude in the permeable ceramic matrix. These chemical remnants offer
valuable clues to the use of pottery and other artefacts and may provide novel
identifications of organic substances in the archaeological record (Pollard, Heron, 2008). In
general, to make the connection between amphorae themselves and their contents it is
important to study the organic residues of the amphora. And means of analytical chemistry
are very helpful in this case.
Most modern techniques for determining molecular structures are based on spectroscopy,
which involves interactions of electromagnetic radiation (light) with molecules. The
spectral range which is used in the determination of molecular structure is broadly
classified into X-ray, ultraviolet (UV), visible (vis), and infrared (IR) radiations, and
microwaves and radiowaves, in order of decreasing frequency (i.e. energy) or increasing
wavelength (Fig.19)
Fig.19 Electromagnetic spectra
(Source: http://www.apiste-global.com/fsv/technology_fsv/detail/id=1204)

21
Molecular spectroscopic techniques, i.e. infrared play an important role in classifying
materials and assessing the state of oxidation. Fourier Transform Infrared Spectroscopy
(FT-IR) gives information on the functional groups and on the degree of oxidation and/or
aromatization correlated with the degradation of the organic material. The technique is
suitable as an initial prospective screening technique. An infrared spectrum represents a
fingerprint of a sample with absorption peaks which correspond to the frequencies of
vibrations between the bonds of the atoms making up the material. Different materials
consist of unique combination of atoms and therefore no two compounds produce the exact
same infrared spectrum. Infrared spectroscopy can result in a positive identification
(qualitative analysis) of different kind of material and in addition, the size of the peaks in
the spectrum is a direct indication of the amount of material present.
Different kinds of bonds vibrate with different frequencies and radiative excitation of a
particular vibration corresponds to absorption of IR radiation of a particular frequency
(energy). The absorption pattern plotted against the radiation frequency is the IR spectrum.
Since functional groups have characteristic bonds and hence characteristic vibrational
frequencies, IR spectroscopy may be used analytically to identify functional groups in a
substance.
IR radiation is normally described by its wavenumber ( in cm-1
where 1/ ) and the
range is typically 4000-400 cm-1
(corresponding to of 2.5-25 μm). Another difference is
that transmittance ( 0/T I I ) is recorded in IR spectra rather than absorbance.
Characteristic absorption bands (peaks) which are useful for identifying particular
molecular structural features are summarized in Table 1.
Table 3 lists the characteristic IR absorption bands due mainly to bond stretching
vibrations of the main functional groups of organic compounds. Most of the characteristic
bands are above 1500 cm-1
; the region below 1500 cm-1
is called the fingerprint region
where many peaks correspond to various C-O, C-C and C-N single bond stretching and
bending vibrations.

22
Table 3
Characteristic IR absorptions of some functional groupsa
alkane C-H 2850-3960 (m-s)
alkene (arene) C(sp2)-H 3020-3100 (m) C C 1620-1680 (m-w)
b
alkyne C(sp)-H ~3300 (s) C C 2100-2260 (m-w)
alcohol (ether) O-Hc
free O-H
3200-3600 (s, br)
3590-3650 (m) C O 1050-1250 (s)
aldehyde (ketone) C(O)-H ~2720 and 2820 (w) C O 1630-1750 (s)d
carboxylic acid O-H 2500-3300 (s, br) C O 1710-1780 (s)d
amine N-H 3300-3500(m, br) C N 1020-1230 (m)
a. Absorption bands are given in cm-1
with indications of their intensities in parentheses: s,
strong; m, medium; w, weak; br, broad;
b. The skeletal vibrations of the benzene ring are typically four bands of variable
intensities in the region 1450-1600 cm-1
c. H-bonded OH.
d. The wavenumber of the stretching band for carbonyl compounds RC(O)X is
characteristically dependent on the nature of the X group.
The mass spectrometric method
The research of amphora's contents also strongly relies on structural information at a
molecular level, and thus the application of mass spectrometry (MS) plays a prominent
role. The coupling of mass spectrometry with gas chromatography (GC) make MS the
most powerful tool for investigation of the complex and aged mixtures of organic
molecules encountered as constituents of historic and archaeological objects.
Mass spectrometry (MS)4 is a useful technique for determining the molecular formula of
an organic compound as well as structures of parts of a molecule if not its whole structure.
In this method, the masses of ionized molecules and their ionic fragments are measured, so
the technique is fundamentally different from the spectroscopic methods (UV, IR).
Mass spectrometry (MS) can determine the molecular formula of a molecule ionized by
loss of an electron following collision with a high-energy electron in an electron beam. In
4 The term spectroscopy is used for techniques involving interactions between molecules
and electromagnetic radiation. In MS, a beam of electrons is normally used to energize and ionize
molecules, and the term spectrometry is used.

23
addition, the ionic fragments formed by subsequent decomposition of the molecular ion
provide important information about the molecular structure. Molecular formulas were
once deduced from elemental analyses combined with molecular weights usually
determined by the effect of the compound upon the boiling point (an elevation) or freezing
point (a depression) of a solvent; these measurements were time- and labour-consuming
tasks, and required appreciable amounts of pure compounds. Mass spectrometry now
allows us to obtain the same information (and much more) in less time with only one
minute amounts of material.
In a mass spectrometer, a sample of the compound under investigation is introduced as a
molecular beam into a high vacuum chamber and ionized (usually) by bombardment with a
beam of high-energy electrons (typically 70 eV), as illustrated in Figure 20.
Fig.20 Schematic representation of mass spectrometer (Source:
http://www.slideshare.net/banuman35/mass-spectrometrymassspec2013-pravisankar)
In this electron impact (EI) ionization mass spectrometric method, the molecular ion (a
radical cation), formed by ejection of an electron following collision with one of the high-
energy electrons, mainly decomposes into fragment radicals and cations (Fig. 21).

24
Fig. 21. Electron ionization
The cationic species (the molecular ion and its charged fragments) are separated by their
mass (more exactly, their mass-to-charge ratio, m/z) to provide a mass spectrum by
plotting the intensity of each ion against its mass (or m/z ratio). The separation is achieved
by diverting the flow of gaseous ions with a magnetic field (the ions are deflected
according to their m/z) or by their time of flight (the velocity of an ion depends on its m/z).
A conventional low resolution mass spectrometer records intensities of whole-number m/z
ratios, and the highest (most intense) peak in the spectrum is called the base peak;
intensities of all other peaks are given relative to this. The molecular ion (identified as M.+
,
M+, or sometimes simply as M in spectra) generated in the ionization chamber by loss of
an electron will appear at the highest m/z value in the mass spectrum if it is sufficiently
stable to reach the detector before fragmenting.
Gas chromatography (GC) and mass spectrometry (MS) can be combined to analyse
mixtures of compounds. In order to determine the structure of an organic compound,
generally a pure sample and purification of compounds depends on intermolecular
interactions. Chromatography is the most useful technique for separation and purification
of organic compounds (Varella, 2013)
The gas chromatograph separates a mixture, and the individual components pass directly
into the mass spectrometer so that individual mass spectra can be recorded. The
quantitative analysis of the components of the mixture is carried out by the GC and, at the
same time, identification of the components is achieved by MS. Gas chromatography
combined with mass spectrometry (GC-MS) found wide application in the chemical
characterisation of different organic compounds. High sensitivity is the main advantage of
this analytical technique and thus very small amount of samples is required for the
analysis. Gas chromatography is a separation technique that separates a mixture of volatile
compounds for further individual analysis of each component by MS.

25
3. Materials and methods
3.1 Analysed samples
A set of samples was received from Museum of Arles collection and DRASSM collection
of Grand Congloué 2 shipwreck near Marseille, France. The resinous materials were
studied and are presented into three categories:
– 16 samples from Grand Congloué 2 shipwreck (Fig. 22). Dark resinous layers in large
quantity with little impurity. Some grains of white sand and pieces of sea shell, and
probably fish bones. Amphorae have been dated as of beginning of II-I century B.C. And
provenance was defined as from Cosa in Italy. In Table 4 the list of Grand Congloué 2
samples are presented.
– 9 samples from other amphorae collection. Table 5 contains the list of samples. The
amphorae are Dressel I and Dressel II types, Haltern 70 and Lamboglia 2 are presented as
well. Amphorae' provenance is mostly Italian coast. The content presumably was wine.
– 21 samples of fish amphorae with presence of fish, brine or fish sauce (garum) were from
collections of Museum of Arles Antique, France (Fig. 23). Preliminary studies shows that
the reuse of amphorae was unlikely. Pitch keeps the original material. Presence of fish,
brine or sauce. Samples of mud brown ochre and yellow colour, fine-grained. Translucent
dark brown resinous layer. Dated as I B.C. - I A.D. In Table 6 the list of fish amphorae
samples is indicated.
Since archaeological work is still in progress, the archaeologists have not definitively
assessed the typology and provenance of all the amphorae that have been discovered.
Fig. 22. GC2.SN.11

26
The samples were carefully extracted mechanically with cutting tools from amphorae's
inner surfaces by scratching the waterproofing coating – the pitch. In total, 46 samples
were analysed. Among them 25 were wine amphorae samples and 21 were samples from
amphorae containing fish. 24 samples were analysed by both FT-IR and GC-MS
instruments, 6 only by FT-IR and 16 only by GC-MS instruments. Among the samples
41% of the amphorae were Dressel I type.
Fig. 23. ARL 9 amphorae
Table 4
Samples from Grand Congloué 2 shipwreck.
# Sample Amphora type
1 GC2.SN.2 Dressel I A
2 GC2.SN.3 Dressel I A
3 GC2.SN.4 Dressel I A
4 GC2.SN.5 Dressel I A
5 GC2.SN.6 Dressel I A
6 GC2.SN.8 Dressel I A
7 GC2.SN.9 Dressel I A
8 GC2.SN.10 Dressel I A
9 GC2.SN.11 Dressel I A
10 Li 2.83 Dressel I
11 24210 Dressel I
12 24255 Dressel I
13 24265 Dressel I
14 24268 Dressel I
15 24270 Dressel I
16 24281 Dressel I

27
Table 5
Wine amphorae samples (apart from Grand Congloué 2 samples)
# Sample Amphora type Provenance
1 AV22 Dressel II/4 ?
2 AV23 Dressel I ?
3 AV24 Dressel I ?
4 AV25 Dressel I ?
5 C98 Dressel II/4 Pompei
6 CB4155 Dressel II/4 Italy(?)
7 GE3932 Haltern 70 Baetica (Spain)
8 SL2878 Lamboglia 2 Adriatic
9 4928 ? Italy
Table 6
Samples from Museum of Arles. Fish amphorae.
# Sample Amphora type Provenance
1 ARL3 Beltran II A
2 ARL4 Dressel 9
3 ARL5 Dressel 9
4 ARL6 Dressel 8
5 ARL7 Dressel 1C
6 ARL8 Pompei 7(?)
7 ARL9 Dressel 9
8 ARL12 Beltran II B
9 RL15 Dressel 8
10 RL16 Beltran II A
11 RL17 Dressel 8
12 RL18 Beltran II A
13 RL19 Beltran II A
14 RL20 Beltran II A
15 RL21 Dressel 8
16 Amphora 1 ?
17 2928 Pompei 7 Baetica (Spain)
18 SL 2930 Pompei 7 Baetica (Spain)
19 2970 Dressel 9 Baetica (Spain)
20 6028 Dressel 12 Baetica (Spain)
21 Amphora a poix ?

28
3.2 Analytical methods
The nature of organic residues and pitch were analyzed with Fourier-transformed infrared
spectroscopy (FT-IR) and gas chromatography-mass spectrometry (GC-MS). FTIR allows
the identification of the class of substance analysed based on the transitional vibrations of
the functional groups. GC-MS permits a more specific identification of organic compounds
present in the samples.
3.2.1 Reagents and standards
Potassium hydroxide (KOH), and N,O bis(trimethyl)silyltrifluoro acetamide (BSTFA)
containing 1% trimethylchlorosilane were purchased from Thermo Scientific, Bellefonte,
PA, U.S.A. The solvents acetone from Sigma-Aldrich Chromasolv, dichloromethane were
from SupraSolv Merck KGaA Darmstadt Germany. KBr of infrared analysis was from
Fisher Chemical, Loughborough, Leies, UK. Sodium carbonate (Soda ash) Na2CO3 was
from Fluka, BioChemica, Switzerland. Methanol ultrapure 99.8+% from AlfaAesar,
Thermofisher, Karlsruhe, Germany.
3.2.2 FT-IR analysis
Samples were analyzed in FT-IR KBr pellets. All samples of fish amphora were ground,
homogenized and prepared for analysis by FT-IR and GC-MS. Samples (1 mg) were
extracted using 5 mL of acetone. After drying, the extracts were mixed with KBr,
compressed as micropellets (10 Tons pressure) and then analyzed in Thermo Scientific™
Nicolet™ iS™10 FTIR Spectrometer (Fig. 24). Thermo Scientific™ OMNIC™ Specta
Software program was used for instrumental control and spectra acquisition. All the
spectra were collected in the range of 400 to 4000 cm-1
with 4 cm-1
resolution. The raw
data from the FTIR analysis was collected in 32 scans.

29
Fig. 24. Thermo Scientific™ Nicolet™ iS™10 FTIR Spectrometer (Source: Dauren
Adilbekov, 2016)
3.2.3 GC-MS analysis
GC-MS analysis, which permits the separation and identification of single molecular
species in complex mixtures, has been successfully used to characterize waterproofing
materials (Colombini et al.). In the analysis of organic materials in ancient objects, it
should be taken into consideration that their chemical composition may have been
profoundly changed by treatment before use, such as heating or distillation, and by ageing.
Samples of 8 mg each were taken for the GC-MS analysis. 1.5 mL of acetone and
dichloromethane (1:2, v/v) mixture was added and the mixture was sonicated for 5
minutes. After filtration with PTFE (polythetrafluoroethylene) filters, 1.0 mL and 1.0 mL
of dichloromethane and potassium hydroxide (KOH) of 0.5M were added. Centrifugation
(4000 rpm for 15 min) was performed for the separation of organic phase. Again 1.0 mL of
KOH 0.5M was added, again, followed by centrifugation (4000 rpm for 15 min) was done
again. After separation of the organic phase, sodium carbonate (Na2CO3) was added to
avoid water. Samples were filtered with PTFE and dried in a sample concentrator. The
reaction of derivatisation was done with BSTFA (N,O-bis
(trimethylsilyl)trifluoroacetamide) with 1% TMCS (trimethylchlorosilane). (Pierce).
GC/MS analyses were carried out with a Thermo Scientific™ Focus gas chromatographic
system mounted with a Thermo Scientific Al 3000 auto-injector (Fig. 25), coupled with a
ITQ™ 700 Series GC-Ion Trap Mass Spectrometer (Thermo Fisher Scientific, Austin, TX

30
USA). GC separation was performed on a fused silica capillary column TG-5MS (Thermo
Fisher Scientific, Austin, TX USA) stationary phase 5% diphenyl-95% dimethyl-
polysiloxane.
Fig. 25. GC-MS Thermo Scientific™ ITQ700 Focus (Source: Dauren Adilbekov, 2016)
A volume of 1 µL for each sample was injected into the injector chamber in splitless mode
at a ratio of 1:20. And injector temperature was set at 250°C. Molecular components were
eluted using helium at a constant flow of 1.2 mL/min. The following temperature program
was used: initial temperature 50 °C for 2 min, 50-220°C at 8 °C/min, 220-260°C at 2
°C/min, 260-330°C at 10 °C/min.
Mass spectra was recorded in Electron Impact (EI) mode with an electron ionization
voltage of 70 eV and a mass range of 50-650 m/z. Ion trap and interface transfer line were
respectively at 250 °C and 300 °C. Thermo Xcalibur™ 2.2 software (Thermo Fisher
Scientific Inc.) was used for instrumental control and data acquisition. Mass spectra peak
assignment were based on a comparison with internal mass spectrum databank (from
commercial standards and from fresh and artificially aged resins and oils) and NIST
databank (NIST MS Search 2.0).

31
4. Results and discussion
4.1 FT-IR
In this section the FT-IR results of Grand-Congloué 2, other wine amphorae and fish
amphorae samples will be discussed.
4.1.1 Grand Congloué 2 samples
The FT-IR spectrum of the GC2.SN.5 sample of wine amphora is shown on Fig. 26. The
FT-IR spectrum shows the typical transmittance profile of a diterpenoid resin such as that
of the Pinus species (Izzo et al., 2013). It is possible to observe the stretching bands of O-H
from alcohol groups at 3428-3429 cm-1
. It is also possible to observe the stretching
vibrations due to –СH2 and –CH3 groups at 2955, 2929 and 2868 cm-1
awardable to
hydrocarbon skeleton of the resin. Also it is possible to see the shoulder band at about
1720 cm-1
. The stretching vibrations due to aromatic ring at 1605, 1496 cm-1
, 886 and 821
cm-1
are present. Other bands are those at 1459 and 1384 cm-1
due to the –CH2, –CH3
bending and at 1235 cm-1
due to the OH bending.
Fig. 26. FT-IR spectrum of GC2.SN.5 sample

32
4.1.2 Wine amphorae samples
Fig. 27 shows the FT-IR spectrum of the pitch of SL2878 sample. It is possible to observe
the stretching bands of O-H from alcohol groups at 3428 cm-1
. It is also possible to observe
the stretching vibrations due to -СH2 and –CH3 groups at 2955, 2930 and 2868 cm-1
awardable to hydrocarbon skeleton of the resin. Carbonilic group is at 1724 and 1697 cm-1
.
The stretching vibrations due to aromatic groups at 1605 and 1497 cm-1
, 885 and 821 cm-1
are also present. The 1458 and 1384 cm−1
bands are due to methyl bending bands at 1242
and 1173 cm−1
are different bending signals from COOH.
Fig. 27. FT-IR spectrum of the sample SL2878

33
4.1.3 Fish amphorae samples
The FT-IR spectrum of the ARL 9 sample of amphora that probably contained fish is
shown on Fig. 28. It is possible to observe the stretching bands of O-H from alcohol groups
at 3420 cm-1
. It is also possible to observe the stretching vibrations due to –СH2 and –CH3
groups at 2955, 2929 and 2868 cm-1
awardable to hydrocarbon skeleton of the resin.
Ketones are observed at 1724 cm-1
. The stretching vibrations due to aromatic ring at 1606
and 1497 cm-1
, 886 and 821 cm-1
are also present. Other bands are those at 1457 and 1383
cm-1
due to the –CH2, –CH3 bending and at 1238 and 1172 cm-1
due to the OH bending.
Fig. 28. FT-IR spectrum of ARL9 fish amphorae sample
Complete list of FT-IR results of all other samples could be found in Appendix 6 section.
34
4.2 GC-MS
In this section the results of GC-MS analysis are presented. GC-MS was applied to wine
and fish amphorae samples. GC-MS technique was used in order to corroborate the results
obtained with FT-IR spectroscopy. Pitch marker, degradation products and methyl esters
are discussed in this part. 9 wine and 21 fish amphorae samples were analysed by GC-MS.
4.2.1 Wine amphorae samples
Different chemical markers of natural resin were found (Fig. 29 and Fig. 30). Wine
amphorae samples contain diterpenic compounds, specific of resins exuded from conifer
trees. In fact, all identified compounds came from abietic acid, a molecule present in fresh
confer resins (Ménager et al., 2014).
GE3932 sample (Fig. 29): the presence of monocarboxylic acids (in this case palmitic acid)
and terpenic species shows that the organic residues were of vegetable origin or mainly
consist of vegetable-based resins. Moreover, the presence of characteristic diterpenic
biomarkers permits to recognize the use of pine resin and pine pitch, while the presence of
dehydroabietic acid methyl ester is likely linked to the use of wood tar and not only the
pine pitch (Izzo et al., 2013). Retene was found as well. And these two compounds (retene
and methyl dehydroabietic acid) are the indicators of the presence of a Pinacea pitch. In
particular, the occurrence of methyl dehydroabietate indicates that this substance was
produced by destructive distillation of the softwood, rather than by processing of the
isolated resin (Mills and White, 1994). During pyrolysis of wood methanol is formed,
which converts diterpenoid acids to their corresponding methyl esters (Colombini et al.,
2005).
A molecule of abietic acid undergoes degradation reactions through time leading to
dehydroabietic acid. Dehydroabietic acid also undergo different reactions of oxidation
leading to 7-oxodehydroabietic acid and 7-hydroxy-dehydroabietic acid. Such compounds
are widely cited in the literature (Berg et al., 2000). All above mentioned compounds were
detected in the GC-MS analysis of the sample. Table 7 shows the important compounds
that were found in wine amphorae samples.

35
Table 7
Summary of results obtained by GC-MS of wine amphorae samples.
Compounds AV22 AV23 AV24 AV25 C98 CB4155 GE3932 SL2878 4928
Norabietanes Yes Yes Yes Yes Yes No Yes Yes Yes
Retene No Yes Yes Yes Yes No Yes Yes Yes
DHAM Yes Yes Yes Yes Yes No Yes Yes Yes
7-oxo-DHAM Yes Yes No Yes Yes No Yes Yes Yes
Fig. 29. Total ion chromatogram of GE3932 wine amphorae sample
36
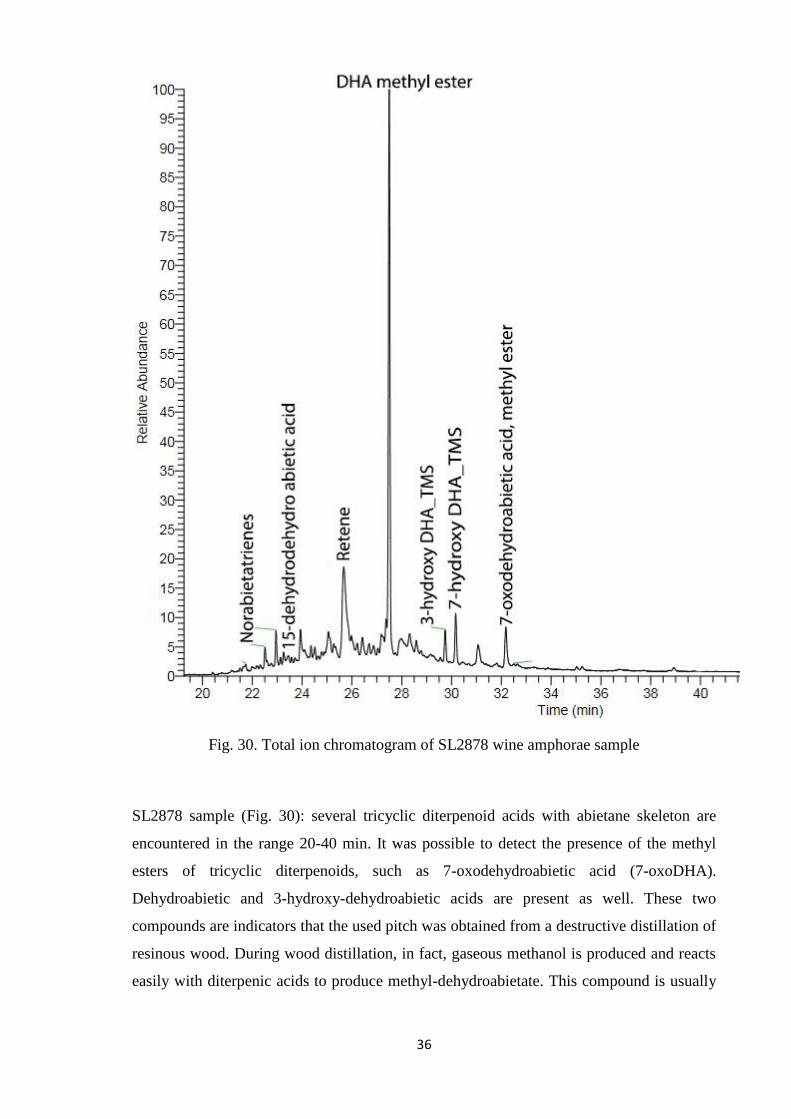
Fig. 30. Total ion chromatogram of SL2878 wine amphorae sample
SL2878 sample (Fig. 30): several tricyclic diterpenoid acids with abietane skeleton are
encountered in the range 20-40 min. It was possible to detect the presence of the methyl
esters of tricyclic diterpenoids, such as 7-oxodehydroabietic acid (7-oxoDHA).
Dehydroabietic and 3-hydroxy-dehydroabietic acids are present as well. These two
compounds are indicators that the used pitch was obtained from a destructive distillation of
resinous wood. During wood distillation, in fact, gaseous methanol is produced and reacts
easily with diterpenic acids to produce methyl-dehydroabietate. This compound is usually

37
absent when pitch is produced by pyrolysis of the resin alone; this conclusion agrees also
with the presence of band at 1724 cm-1
in the FT-IR spectrum of Fig.27.
In addition, 15-didehydroabietic acid, 7-hydroxy-dehydroabietic acid, and norabietanes
were found. The GC-MS chromatogram shows also the presence of retene which is
considered a marker for pine pitch since it appears when the resin is heated to high
temperatures. (Font et al., 2007).
Fig. 31 shows the oxidation undergone by some diterpenoid compounds of pine pitch due
to the incorporation of one or more oxygen atoms. The relative degree of oxidation is
indicated by the position of the various compounds.
Fig. 31. Oxidation reaction paths of diterpenoid compounds of pine pitch with the relative state of
aromatization and oxidation (0,I,II,III) linkable to the numbers of oxygen atoms incorporated.

38
4.2.2 Fish amphorae samples
The pitch markers such as retene and methyldehydroabietic acid were not detected in fish
samples (except for ARL7 sample) from Museum of Arles. However, pitch can be found in
four another samples that are from Baetica in Spain and in sample "amphore a poix
(pitch)". This question needs further investigation.
The correspondent chromatogram in Fig. 32 shows the presence of methyl esters of
saturated fatty acids such as palmitic acid. The presence of the methyl esters of tricyclic
diterpenoids, such as 7-oxo-dehydroabietic acid (7-oxoDHA), 15-hydroxy-dehydroabietic
acid (15HyDA) were not detected. These compounds are some of the typical oxidation
products of a resin from the Pinaceae family (Colombini and Modugno, 2009). The reason
is unknown. Only in four fish amphorae samples 15-hydroxy-7-oxo-dehydroabietic acid
have been found. From the above mentioned data the following assumptions can be made:
(i) either some of the fish amphorae did not contain pitch or (ii) during the sampling the
pitch was not taken in enough quantities or (iii) during the sample preparation the pitch
component was not taken in enough quantity. Further studies need to be applied in order to
be able to answer this question. However, FT-IR analyses showed the presence of pitch ()
Fig. 32. Total ion chromatogram of ARL 9 obtained by GC-MS.

39
In most fish amphorae and some wine amphorae new compounds that have not been
described in literature (at least in that the student had access) were found, they are androst
2-en-17-amine, 4,4-dimethyl-N-(2-phenylethyl)-,(5alpha)- and oleamide, N-trimethylsilyl.
Further studies should be applied. Complete list of GC-MS analyses results of all other
samples could be found in Appendix 7 section.
Fig. 33. Total ion chromatogram of 2970 fish amphorae sample.
Fig. 33 shows the chromatogram from another fish sample (2970). Here the pitch markers,
i.e. retene, DHA methyl ester, 3-hydroxyDHA, 7-oxodehydroabietic acid and 15-hydroxy-
7-oxodehydroabietic acid are detected. Results of the GC-MS analyses reveals the presence
of two diagnostic peaks relative to retene and to the methyl ester of dehydroabietic acid.
Retene is considered as a marker for pine pitch because when the resin is heated to high
temperatures or distilled in a low oxygen environment to obtain a pitch, aromatisation,
demethylation, and defunctionalisation reaction occur in the abietadiene and pimaradiene
acids. This leads to the formation of a series of products as norabietatrienes and
tetrahydroretene, and the final stable product of all these transformations is retene
40
(Colombini, 2005). The methyl dehydroabietate is formed when the resin is heated in the
presence of wood because the methanol released when wood is heated to high temperatures
reacts easily with diterpenic acids to produce above all methyl-dehydroabietate, which is
absent when the pitch is produced by pyrolysis of the resin alone.
The simultaneous presence of abietanic acids, retene and methyl dehydroabietate
highlights that the material contains a pitch obtained from a destructive of wood of plants
of the Pinaceae family.
For all the organic samples considered in this study, it was not possible to identify with
accuracy the species of Pine used to prepare the pitch since the profile of diterpenoid acids
of an aged and thermal treated resin is very different from the one of fresh resin.
Triterpenoids or labdane compounds were not found, indicating that the material does not
originate from angiosperms or from conifers other than Pinaceae (Romanus et al., 2009).

41
5. Conclusion
Chemical analysis was performed in order to characterise the organic components of the
pitch of Roman amphorae from DRASSM and Museum of Arles Antique collections.
Samples were analysed by gas chromatography/mass spectrometry (GC-MS) and Fourier
Transform Infrared spectroscopy (FT-IR) techniques. In brief, the combine use of both of
these techniques showed great complementarity. FT-IR spectroscopy is a simple technique
that in many cases can give fast and economical information about the nature of the
coatings of amphorae. FT-IR spectroscopy reduces the number of steps necessary in the
preparation of the sample since the micropellets of KBr are prepared directly from one
single milligram of waterproofing pitch obtained from the amphorae under study.
Although GC-MS technique is destructive, it can give more precise information on the
chemical composition of the samples. Conifer resins were discovered in GC-MS analyses
of the pitch. Many identified byproducts indicated degradation reactions taking place in
such archaeological material. For instance, the degradation products of abietane
(dehydroabietic acid, 15-didehydroabietic acid, 15-hydroxy-7-oxodehydroabietic acid, 7-
oxodehydroabietic acid) were found in the samples.
The use of pine resin, tar and pitch derived from plant resins is documented in antiquity not
only as sealant or caulking materials but also as a medicine, antiseptic, or ritual balms.
Scientific publications on wine amphorae are well presented in the literature. But it is still
difficult to find the bibliography on ancient materials containing fish due to the fact that
fatty acids (which fish comprise of) are very susceptible to deterioration. This work is
adding a new information on amphorae from Grand Congloué 2 shipwreck, Museum of
Arles and DRASSM amphorae collection. This work studies for the first time the pitch of
fish amphorae in the IMBE laboratory at Avignon University.
Most of the studied wine samples and samples from Grand Congloué 2 showed the
presence of pine resin and pine pitch. For wine samples this information is moreover
confirmed by the presence of retene and of methyl esther of dehydroabietic acid (DHAM),
which are products of the chemical reaction between gaseous methanol and diterpenic
acids formed during the distillation of wood. The high degree of oxidation of diterpenoids,
present in the organic residue collected from waterproofing treatment, suggests that resin
was cooked in an oxidant atmosphere and/or was subjected to ageing processes by
oxidation.

42
After completing the work, the student is able to distinguish pitch markers, degradation
products of abietic acid and methyl esters. It was also possible to distinguish different
organic families and to define exactly the botanical family of the material of which pitch
was made of. We can have information on degradation and alteration of the pitch in
archaeological artefacts as amphorae.
Clearly there is considerable further potential for using archaeological chemistry to
identify a wide range of naturally occurring organic molecules used in the past. This will
undoubtedly contribute substantially to our understanding of the relationship between
human populations and their use of plant and animal resources, as well as in the
determination of the myriad ways in which artefacts were used.
43
6. Bibliographical references
1. Barilaro D., Barone G., Crupi V., Majolino D., Mazzoleni P., Triscari M., Venuti
V., 2006. Characterization of ancient amphorae by spectroscopic techniques.
Vibrational Spectroscopy (42), 381-386.
2. Beck C.W., Smart C.J., Ossenkop D.J., 1989. Residues and linings in ancient
Mediterranean transport amphoras. American Chemical Society. Archaeological
Chemistry (4), 369-379.
3. Berg K.J., Boon J.J., Pastorova I., Spetter L.F., 2000. Mass spectrometric
methodology for the analysis of highly oxidized diterpenoid acids in Old Master
paintings. Journal of Mass Spectrometry (35), 512-533.
4. Callender M.H., 1950. Roman amphorae. Durham theses, Durham University.
Available at Durham E-Theses Online: http://etheses.dur.ac.uk/8387/
5. Colombini M.P., Giachi G., Modugno F., Ribechini E., 2005. Characterisation of
organic residues in pottery vessels of the Roman age from Antinoe (Egypt).
Microchemical Journal (79), 83-90.
6. Colombini M.P., Giachi G., Modugno F., Pallecchi P. and Ribechini E., 2003. The
characterization of paints and waterproofing materials from the shipwrecks found at
the archaeological site of the Etruscan and Roman harbour of Pisa (Italy).
Archaeometry 45, 659-674.
7. Colombini M.P., Modugno F., Ribechini E., 2005. Direct exposure electron
ionization mass spectrometry and gas chromatography/mass spectrometry
techniques to study organic coatings on archaeological amphorae. J. Mass
Spectrom (40), 675-687.
8. Condamin J., Formenti F., Metais M.O., Michel M., Blond P., 1976. The
application of gas chromatography to the tracing of oil in ancient amphorae.
Archaeometry (18), 195-201.
9. Derrick M. R., Stulik D., Landry J.M., 1999. Infrared spectroscopy in conservation
science. The Getty Conservation Institute, Los Angeles.
10. Derrick M., 1989. Fourier Transform infrared spectral analysis of natural resins
used in furniture finishes. Journal of the American Institute for Conservation (28),
43-56.
11. Duce C., Orsini S., Spepi A., Colombini M.P., Tine M.R., Ribechini E., 2015.
Thermal degradation chemistry of archaeological pine pitch containing beeswax as
an additive. Journal of Analytical and Applied Pyrolysis (111), 254-264.

44
12. Ejstrud Bo, 2005. Size matters: Estimating trade of wine, oil and fish-sauce from
amphorae in the first century AD. In: Bekker-Nielsen T. (Editor), Ancient fishing
and fish processing. Aarhus University Press, Denmark, 171-181.
13. Evershed R.P., Jerman K., Eglinton G., 1985. Pine wood origin for pitch from the
Mary Rose. Nature (314), 528-530.
14. Evershed R.P., Heron C., Goad L.J., 1990. Analysis of organic residues of
archaeological origin by High-temperature Gas Chromatography and Gas
Chromatography-Mass Spectrometry. Analyst (115), 1339-1342.
15. Facchetti F., Ribechini E., Betro M., Colombini M.P., 2012. Organic residues
analysis: the case of a beaker found in Theban Necropolis, Egypt. International
Journal of Conservation Science (3), 259-264.
16. Font J., Salvado N., S.Buti, J.Enrich., 2007. Fourier transform infrared
spectroscopy as a suitable technique in the study of the materials used in
waterproofing of archaeological amphorae. Analytica Chimica Acta (598), 119-
127.
17. Gianno R., 1990. Semelai Culture and Resin Technology, New Haven, Conn.:
Academy of Arts and Sciences (xxxiv), 238 pp.
18. Izzo F.C., Zendri E., Bernardi A., Balliana E., Sgobbi M., 2013. The study of pitch
via gas chromatography - mass spectrometry and Fourier transformed infrared
spectroscopy: the case of the Roman amphora from Monte Poro, Calabria (Italy).
Journal of Archaeological Science (40), 595-600.
19. Jerkovic I., Marijanovic Z., Gugic M., Roje M., 2011. Chemical Profile of the
Organic Residue from Ancient Amphora Found in the Adriatic Sea Determined by
Direct GC and GC-MS Analysis. Molecules (16), 7936-7948.
20. Lund John, Gabrielsen V. 2005. A fishy business: transport amphorae of the Black
sea region as a source for the trade in fish and fish products in the Classical and
Hellenistic periods. In: Bekker-Nielsen T. (Editor), Ancient fishing and fish
processing. Aarhus University Press, Denmark, 161-169.
21. Malainey E. M., 2010. A consumer's guide to Archaeological Science. Springer
Science and Business Media. Social Science, 603 pp.
22. Ménager M., Azémard C., Vieillescazes C., 2014. Study of Egyptian
mummification balms by FT-IR spectroscopy and GC-MS. Microchemical Journal
(114), 32-41.
23. McGovern P.E. et al. 2013. Beginning of viniculture in France. PNAS. (110, 25),
10147-10152.

45
24. McGovern P.E., Fleming S.J., Katz S.H. (Editors), 2013. The origins and ancient
history of wine, 57-65.
25. Mills J.S., White R., 1977. Natural resins of art and archaeology. Their sources,
chemistry and identification. Studies in Conservation (22), 12-31.
26. Olmer F., Bohbot H., Joliot C., Mathe C. Histoire d'epave. Origine, fonction et
destin de la cargaison d'amphores du Grand Congloue 2.
27. Osete-Cortina L., Doménech-Carbó M.T., Mateo-Castro R., Gimeno-Adelantado
J.V., Bosch-Reig F., 2004. Identification of diterpenes in canvas painting varnishes
by gas chromatography–mass spectrometry with combined derivatisation. Journal
of Chromatography A. (1024), 187-194.
28. Pastorova I., van der Berg K.J., Boon J.J., Verhoeven J.W., 1997. Analysis of
oxidised diterpenoid acids using thermally assisted methylation with TMAH.
Journal of Analytical and Applied Pyrolysis (43), 41-57.
29. Pollard A.M., Heron C., 2008. Archaeological Chemistry, RCS Paperbacks, Royal
Society of Chemistry Publishing, Cambridge, 235-261.
30. Regert M., 2004. Investigating the history of prehistoric glues by gas
chromatography – mass spectrometry, J.Sep.Sci (27), Wiley, 244-254.
31. Reynolds P., Transport amphorae of the first to seventh centuries: early Roman to
Byzantine periods, 93-161.
32. Robinson N., Evershed R.P., Higgs W.J., Jerman K., Eglinton G., 1987. Proof of a
Pine Wood Origin for Pitch from Tudor (Mary Rose) and Etruscan shipwrecks:
Application of Analytical Organic Chemistry in Archaeology. Analyst (112), 637-
644.
33. Romanus K., Baeten J., Poblome J., Accardo S., Degryse P., Jacobs P., De Vos D.,
Waekens M., 2009. Wine and olive permeation in pitched and non-pitched
ceramics: relation with results from archaeological amphorae from Sagalassos,
Turkey. Journal of Archaeological Science (36), 900-909.
34. Scalarone D., Lazzari M., Chiantore O., 2002. Ageing behaviour and pyrolytic
characterisation of diterpenic resins used as art materials: colophony and Venice
turpentine. Journal of Analytical and Applied Pyrolysis (64), 345-361.
35. Stern B., Heron C., Tellefsen T., Serpico M., 2008. New investigations into the
Uluburun resin cargo. Journal of Archaeological Science (35), Elsevier, 2188-2203.
36. Twede D., 2002. Commercial amphora: the earliest consumer packages? Journal of
Macromarketing (22,1), 98-108.

46
37. Van Neer W., Ervynck A., Monsieur P., 2010. Fish bones and amphorae: evidence
for the production and consumption of salted fish products outside the
Mediterranean region. Journal of Roman Archaeology (23), 161-195.
38. Varella E.A. (Editor), 2013. Conservation Science for the Cultural Heritage.
Applications of Instrumental Analysis. Springer, 334 pp.
39. Will E.L., 1977. The Ancient commercial amphora. Archaeology (30), 264-278.
40. Zlateva. B., Rangelov M., 2015. Chemical analysis of organic residues found in
Hellenistic time amphorae from SE Bulgaria. Journal of Applied Spectroscopy (82,
2), 221-227.
41. http://archaeologydataservice.ac.uk/archives/view/amphora_ahrb_2005/cat_amph.c
fm
42. http://www.promare.org/elizabeth-lyding-will/publications
43. https://www.abc.se/~pa/mar/dressel.htm
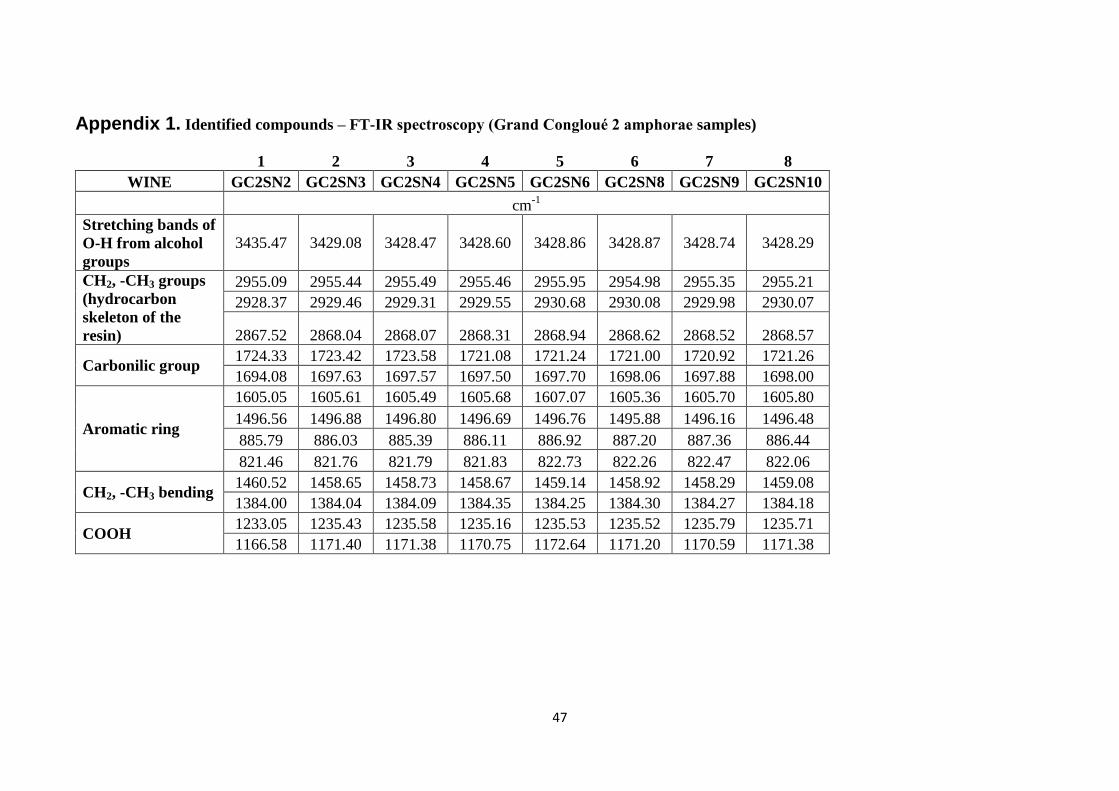
47
Appendix 1. Identified compounds – FT-IR spectroscopy (Grand Congloué 2 amphorae samples)
1 2 3 4 5 6 7 8
WINE GC2SN2 GC2SN3 GC2SN4 GC2SN5 GC2SN6 GC2SN8 GC2SN9 GC2SN10
cm-1
Stretching bands of
O-H from alcohol
groups
3435.47 3429.08 3428.47 3428.60 3428.86 3428.87 3428.74 3428.29
СH2, -CH3 groups
(hydrocarbon
skeleton of the
resin)
2955.09 2955.44 2955.49 2955.46 2955.95 2954.98 2955.35 2955.21
2928.37 2929.46 2929.31 2929.55 2930.68 2930.08 2929.98 2930.07
2867.52 2868.04 2868.07 2868.31 2868.94 2868.62 2868.52 2868.57
Carbonilic group 1724.33 1723.42 1723.58 1721.08 1721.24 1721.00 1720.92 1721.26
1694.08 1697.63 1697.57 1697.50 1697.70 1698.06 1697.88 1698.00
Aromatic ring
1605.05 1605.61 1605.49 1605.68 1607.07 1605.36 1605.70 1605.80
1496.56 1496.88 1496.80 1496.69 1496.76 1495.88 1496.16 1496.48
885.79 886.03 885.39 886.11 886.92 887.20 887.36 886.44
821.46 821.76 821.79 821.83 822.73 822.26 822.47 822.06
CH2, -CH3 bending 1460.52 1458.65 1458.73 1458.67 1459.14 1458.92 1458.29 1459.08
1384.00 1384.04 1384.09 1384.35 1384.25 1384.30 1384.27 1384.18
COOH 1233.05 1235.43 1235.58 1235.16 1235.53 1235.52 1235.79 1235.71
1166.58 1171.40 1171.38 1170.75 1172.64 1171.20 1170.59 1171.38
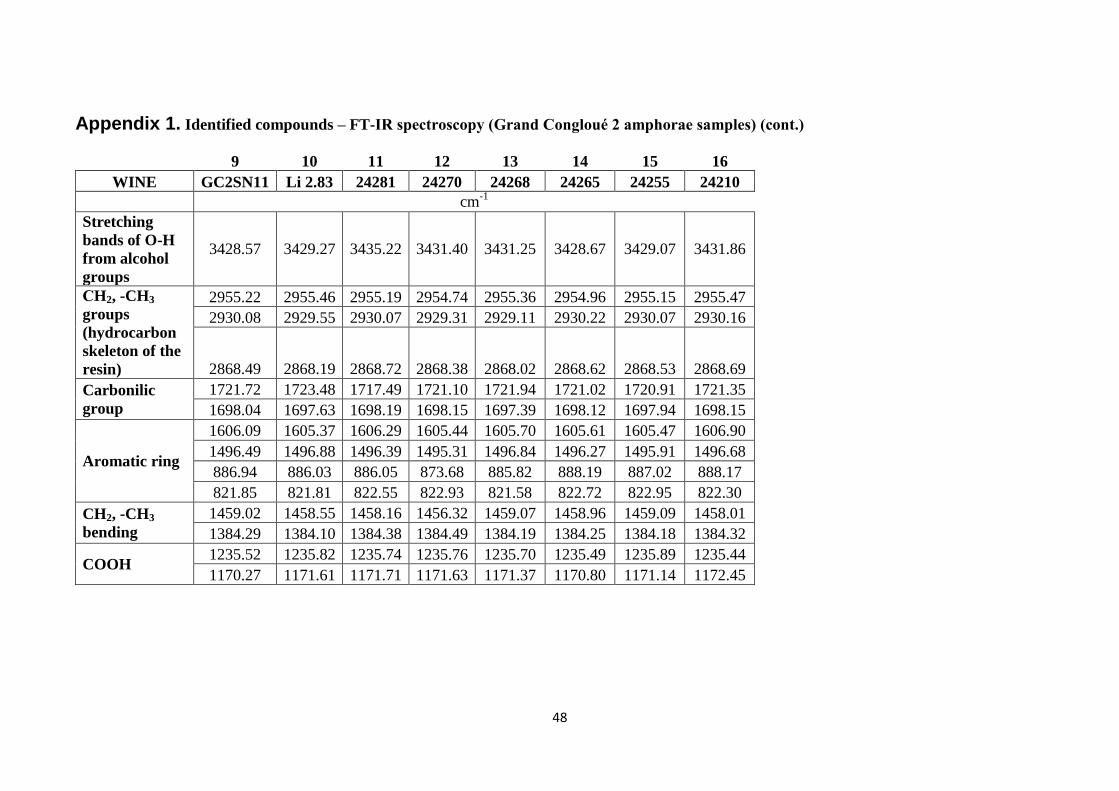
48
Appendix 1. Identified compounds – FT-IR spectroscopy (Grand Congloué 2 amphorae samples) (cont.)
9 10 11 12 13 14 15 16
WINE GC2SN11 Li 2.83 24281 24270 24268 24265 24255 24210
cm-1
Stretching
bands of O-H
from alcohol
groups
3428.57 3429.27 3435.22 3431.40 3431.25 3428.67 3429.07 3431.86
СH2, -CH3
groups
(hydrocarbon
skeleton of the
resin)
2955.22 2955.46 2955.19 2954.74 2955.36 2954.96 2955.15 2955.47
2930.08 2929.55 2930.07 2929.31 2929.11 2930.22 2930.07 2930.16
2868.49 2868.19 2868.72 2868.38 2868.02 2868.62 2868.53 2868.69
Carbonilic
group
1721.72 1723.48 1717.49 1721.10 1721.94 1721.02 1720.91 1721.35
1698.04 1697.63 1698.19 1698.15 1697.39 1698.12 1697.94 1698.15
Aromatic ring
1606.09 1605.37 1606.29 1605.44 1605.70 1605.61 1605.47 1606.90
1496.49 1496.88 1496.39 1495.31 1496.84 1496.27 1495.91 1496.68
886.94 886.03 886.05 873.68 885.82 888.19 887.02 888.17
821.85 821.81 822.55 822.93 821.58 822.72 822.95 822.30
CH2, -CH3
bending
1459.02 1458.55 1458.16 1456.32 1459.07 1458.96 1459.09 1458.01
1384.29 1384.10 1384.38 1384.49 1384.19 1384.25 1384.18 1384.32
COOH 1235.52 1235.82 1235.74 1235.76 1235.70 1235.49 1235.89 1235.44
1170.27 1171.61 1171.71 1171.63 1171.37 1170.80 1171.14 1172.45
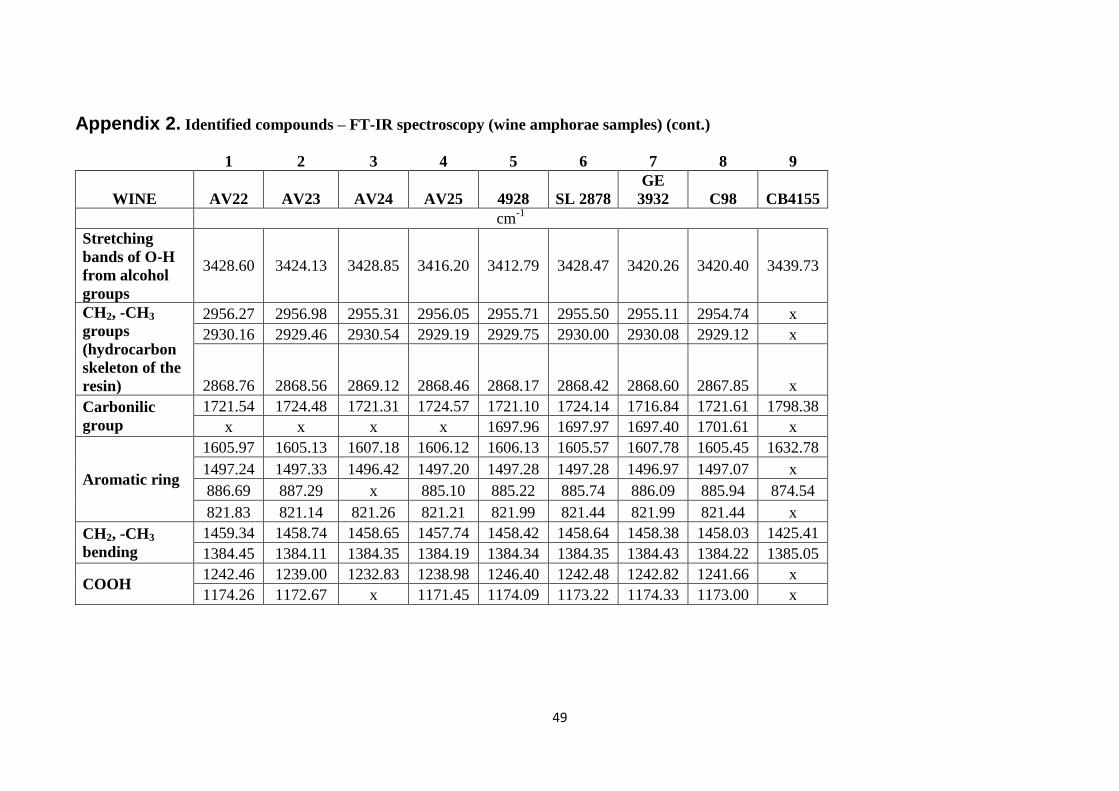
49
Appendix 2. Identified compounds – FT-IR spectroscopy (wine amphorae samples) (cont.)
1 2 3 4 5 6 7 8 9
WINE AV22 AV23 AV24 AV25 4928 SL 2878
GE
3932 C98 CB4155
cm-1
Stretching
bands of O-H
from alcohol
groups
3428.60 3424.13 3428.85 3416.20 3412.79 3428.47 3420.26 3420.40 3439.73
СH2, -CH3
groups
(hydrocarbon
skeleton of the
resin)
2956.27 2956.98 2955.31 2956.05 2955.71 2955.50 2955.11 2954.74 x
2930.16 2929.46 2930.54 2929.19 2929.75 2930.00 2930.08 2929.12 x
2868.76 2868.56 2869.12 2868.46 2868.17 2868.42 2868.60 2867.85 x
Carbonilic
group
1721.54 1724.48 1721.31 1724.57 1721.10 1724.14 1716.84 1721.61 1798.38
x x x x 1697.96 1697.97 1697.40 1701.61 x
Aromatic ring
1605.97 1605.13 1607.18 1606.12 1606.13 1605.57 1607.78 1605.45 1632.78
1497.24 1497.33 1496.42 1497.20 1497.28 1497.28 1496.97 1497.07 x
886.69 887.29 x 885.10 885.22 885.74 886.09 885.94 874.54
821.83 821.14 821.26 821.21 821.99 821.44 821.99 821.44 x
CH2, -CH3
bending
1459.34 1458.74 1458.65 1457.74 1458.42 1458.64 1458.38 1458.03 1425.41
1384.45 1384.11 1384.35 1384.19 1384.34 1384.35 1384.43 1384.22 1385.05
COOH 1242.46 1239.00 1232.83 1238.98 1246.40 1242.48 1242.82 1241.66 x
1174.26 1172.67 x 1171.45 1174.09 1173.22 1174.33 1173.00 x
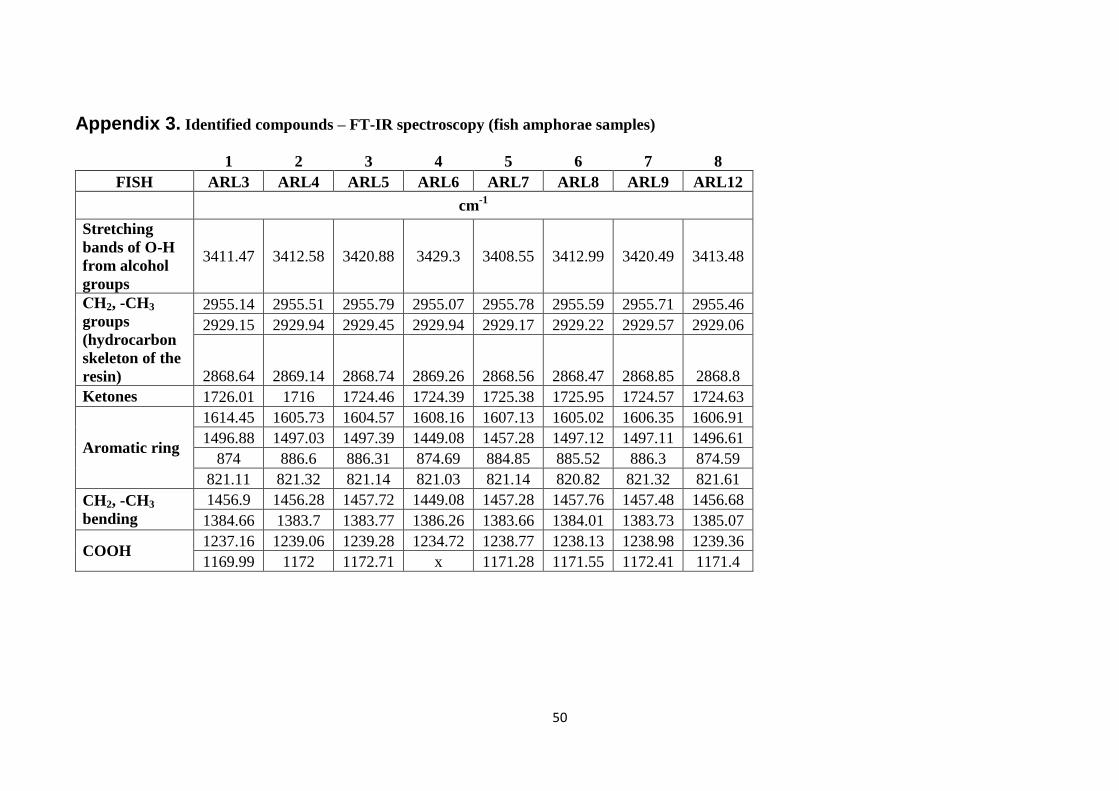
50
Appendix 3. Identified compounds – FT-IR spectroscopy (fish amphorae samples)
1 2 3 4 5 6 7 8
FISH ARL3 ARL4 ARL5 ARL6 ARL7 ARL8 ARL9 ARL12
cm-1
Stretching
bands of O-H
from alcohol
groups
3411.47 3412.58 3420.88 3429.3 3408.55 3412.99 3420.49 3413.48
СH2, -CH3
groups
(hydrocarbon
skeleton of the
resin)
2955.14 2955.51 2955.79 2955.07 2955.78 2955.59 2955.71 2955.46
2929.15 2929.94 2929.45 2929.94 2929.17 2929.22 2929.57 2929.06
2868.64 2869.14 2868.74 2869.26 2868.56 2868.47 2868.85 2868.8
Ketones 1726.01 1716 1724.46 1724.39 1725.38 1725.95 1724.57 1724.63
Aromatic ring
1614.45 1605.73 1604.57 1608.16 1607.13 1605.02 1606.35 1606.91
1496.88 1497.03 1497.39 1449.08 1457.28 1497.12 1497.11 1496.61
874 886.6 886.31 874.69 884.85 885.52 886.3 874.59
821.11 821.32 821.14 821.03 821.14 820.82 821.32 821.61
CH2, -CH3
bending
1456.9 1456.28 1457.72 1449.08 1457.28 1457.76 1457.48 1456.68
1384.66 1383.7 1383.77 1386.26 1383.66 1384.01 1383.73 1385.07
COOH 1237.16 1239.06 1239.28 1234.72 1238.77 1238.13 1238.98 1239.36
1169.99 1172 1172.71 x 1171.28 1171.55 1172.41 1171.4
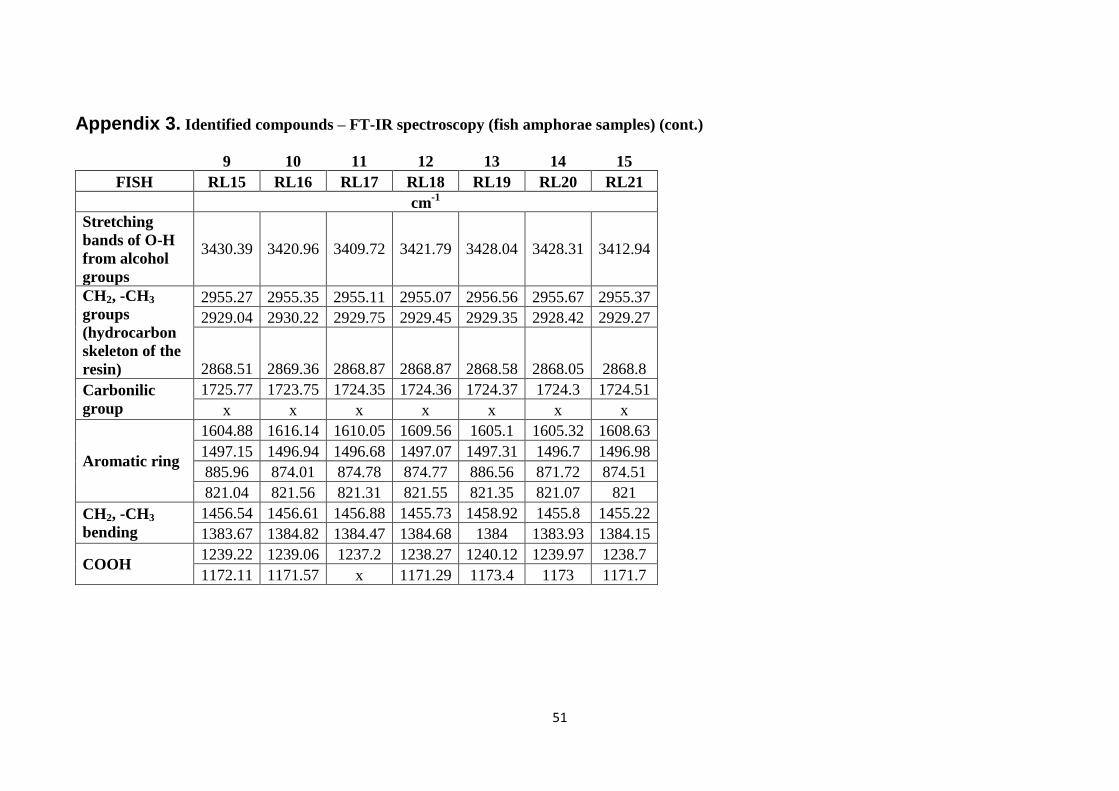
51
Appendix 3. Identified compounds – FT-IR spectroscopy (fish amphorae samples) (cont.)
9 10 11 12 13 14 15
FISH RL15 RL16 RL17 RL18 RL19 RL20 RL21
cm-1
Stretching
bands of O-H
from alcohol
groups
3430.39 3420.96 3409.72 3421.79 3428.04 3428.31 3412.94
СH2, -CH3
groups
(hydrocarbon
skeleton of the
resin)
2955.27 2955.35 2955.11 2955.07 2956.56 2955.67 2955.37
2929.04 2930.22 2929.75 2929.45 2929.35 2928.42 2929.27
2868.51 2869.36 2868.87 2868.87 2868.58 2868.05 2868.8
Carbonilic
group
1725.77 1723.75 1724.35 1724.36 1724.37 1724.3 1724.51
x x x x x x x
Aromatic ring
1604.88 1616.14 1610.05 1609.56 1605.1 1605.32 1608.63
1497.15 1496.94 1496.68 1497.07 1497.31 1496.7 1496.98
885.96 874.01 874.78 874.77 886.56 871.72 874.51
821.04 821.56 821.31 821.55 821.35 821.07 821
CH2, -CH3
bending
1456.54 1456.61 1456.88 1455.73 1458.92 1455.8 1455.22
1383.67 1384.82 1384.47 1384.68 1384 1383.93 1384.15
COOH 1239.22 1239.06 1237.2 1238.27 1240.12 1239.97 1238.7
1172.11 1171.57 x 1171.29 1173.4 1173 1171.7

52
Appendix 4. Identified compounds – GC-MS analysis (wine amphorae samples)
* – retention time (min)
1 2 3 4 5 6 7 8 9
# Compound AV22 AV23 AV24 AV25 CB4155 GE3932 SL2878 C98 4928
1 Pentane 7.95* 7.96 7.95 7.95 x x 7.94 7.95 7.96
2 Benzene propanoic acid TMS x 8.43 x x x x x x x
3 Nonanoic acid TMS 13.72 13.72 13.74 x x x x x x
5 18_Norabieta_diene_TMS 22.53 22.96 22.53 22.51 x 22.51 22.51 22.52 22.5
4 18_Norabieta_diene_TMS x x x 22.95 x 22.96 x x x
6 18-Norabieta 811013, TMS x x x x x x 22.95 22.96 22.95
7 palmitic acid TMS 23.12 23.13 23.13 x 23.13 23.13 x x x
8 10,18 - Bisnorabieta -5,7,9,11,13-pentaene 23.93 23.93 x 23.93 x 23.95 23.93 23.94 23.93
9 15-Dehydrodehydro abietic acid (Piti_TMS…) 24.37 24.37 24.37 24.35 x 24.37 24.36 24.36 28.6
10
Androst 2-en-17-amine, 4,4-dimethyl-N-(2-phenylethyl)-
,(5alpha)- 25.43 25.42 25.44 x 25.43 25.43 x x x
11 Retene x 25.62 25.74 25.73 x 25.72 25.67 25.7 25.63
12 7-isopropyl-1,1,4a-trimethyl-1,2,3,4,4a,9,10,10a 26.21 26.21 26.23 26.2 x 26.21 x 26.21 26.21
13 DHA_Methyl ester 27.49 27.49 27.5 27.47 x 27.5 27.5 27.48 27.49
14 Dehydroabietic acid (DHA) TMS x x 28.3 x x 28.3 x 28.3 28.3
15 Acetic acid x 28.34 x 28.33 x x x x x
16 Oleamide, N-trimethylsilyl x x 28.68 x 28.68 28.67 x x x
17 3-hydroxy DHA_TMS 29.75 x 29.76 29.74 x 29.76 29.74 29.74 29.75
18 7-hydroxy DHA_TMS 30.18 x 30.19 30.16 x 30.18 30.16 30.16 30.16
19 7-oxodehydroabietic acid, methyl ester 32.2 32.2 x 32.19 x 32.2 32.18 32.18 32.18
20 7-oxodehydroabietic acid TMS 33.89 x x x x 33.89 x x x
21 15-hydroxy-7oxodehydroabietic acid TMS x x x x x x x x x
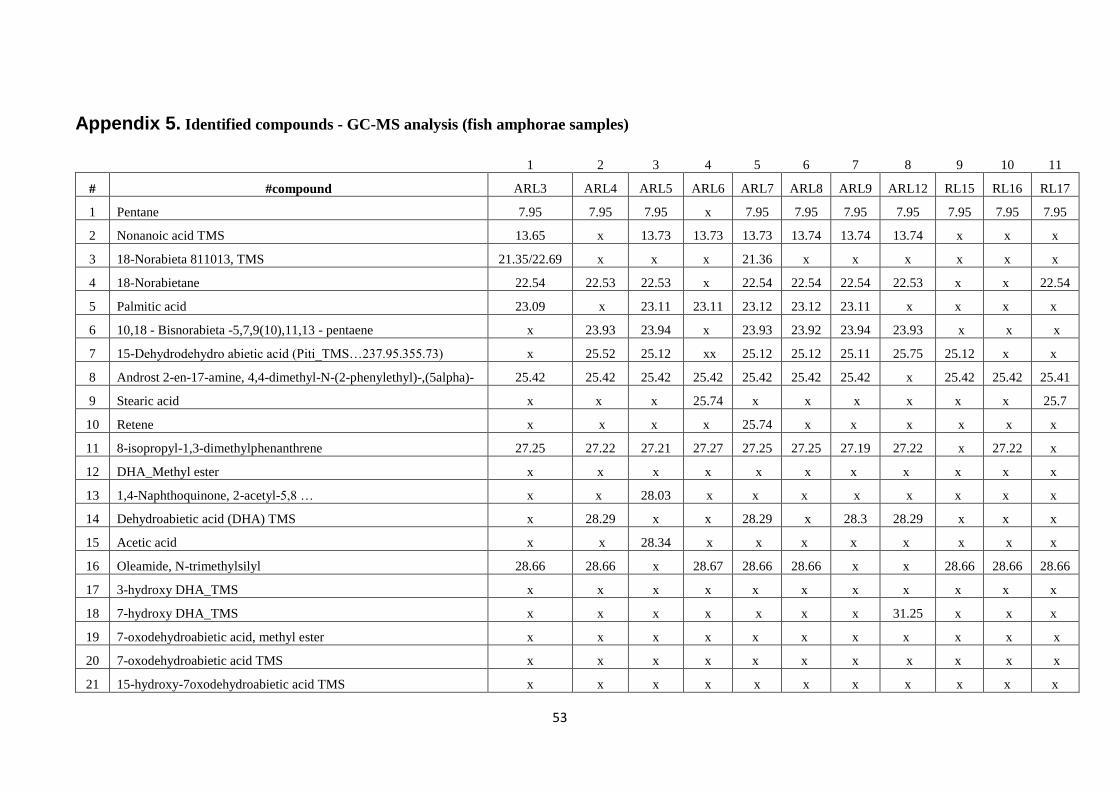
53
Appendix 5. Identified compounds - GC-MS analysis (fish amphorae samples)
1 2 3 4 5 6 7 8 9 10 11
# #compound ARL3 ARL4 ARL5 ARL6 ARL7 ARL8 ARL9 ARL12 RL15 RL16 RL17
1 Pentane 7.95 7.95 7.95 x 7.95 7.95 7.95 7.95 7.95 7.95 7.95
2 Nonanoic acid TMS 13.65 x 13.73 13.73 13.73 13.74 13.74 13.74 x x x
3 18-Norabieta 811013, TMS 21.35/22.69 x x x 21.36 x x x x x x
4 18-Norabietane 22.54 22.53 22.53 x 22.54 22.54 22.54 22.53 x x 22.54
5 Palmitic acid 23.09 x 23.11 23.11 23.12 23.12 23.11 x x x x
6 10,18 - Bisnorabieta -5,7,9(10),11,13 - pentaene x 23.93 23.94 x 23.93 23.92 23.94 23.93 x x x
7 15-Dehydrodehydro abietic acid (Piti_TMS…237.95.355.73) x 25.52 25.12 xx 25.12 25.12 25.11 25.75 25.12 x x
8 Androst 2-en-17-amine, 4,4-dimethyl-N-(2-phenylethyl)-,(5alpha)- 25.42 25.42 25.42 25.42 25.42 25.42 25.42 x 25.42 25.42 25.41
9 Stearic acid x x x 25.74 x x x x x x 25.7
10 Retene x x x x 25.74 x x x x x x
11 8-isopropyl-1,3-dimethylphenanthrene 27.25 27.22 27.21 27.27 27.25 27.25 27.19 27.22 x 27.22 x
12 DHA_Methyl ester x x x x x x x x x x x
13 1,4-Naphthoquinone, 2-acetyl-5,8 … x x 28.03 x x x x x x x x
14 Dehydroabietic acid (DHA) TMS x 28.29 x x 28.29 x 28.3 28.29 x x x
15 Acetic acid x x 28.34 x x x x x x x x
16 Oleamide, N-trimethylsilyl 28.66 28.66 x 28.67 28.66 28.66 x x 28.66 28.66 28.66
17 3-hydroxy DHA_TMS x x x x x x x x x x x
18 7-hydroxy DHA_TMS x x x x x x x 31.25 x x x
19 7-oxodehydroabietic acid, methyl ester x x x x x x x x x x x
20 7-oxodehydroabietic acid TMS x x x x x x x x x x x
21 15-hydroxy-7oxodehydroabietic acid TMS x x x x x x x x x x x

54
Appendix 5. Identified compounds - GC-MS analysis (fish amphorae samples) (cont.)
# #compound 12 13 14 15 16 17 18 19 20 21
RL 18 RL19 RL20 RL21 amph1 2928 SL 2930 2970 6028 Amph
a poix
1 Pentane 7.95 7.95 7.95 7.96 7.96 7.95 7.95 7.95 7.95 7.95
2 Nonanoic acid TMS x x x x x x x x x x
3 18-Norabieta 811013, TMS x x x x x x x 22.94 22.5 22.94
4 18-Norabietane 22.54 22.53 22.54 22.53 x x 22.5 22.5 x 22.5
5 Palmitic acid x x x x x x x 23.11 x x
6 10,18 - Bisnorabieta -5,7,9(10),11,13 - pentaene x 23.92 x x 23.94 x 23.92 23.93 23.94 23.94
7 15-Dehydrodehydro abietic acid (Piti_TMS…237.95.355.73) 25.12 x 25.11 x x x 24.34 24.34 24.35 24.35
8 Androst 2-en-17-amine, 4,4-dimethyl-N-(2-phenylethyl)-,(5alpha)- 25.41 25.41 25.41 25.41 25.41 25.4 25.41 25.4 25.4 25.41
9 Stearic acid 25.71 x x x x x x x x x
10 Retene x x x x x 25.62 25.63 25.63 25.68 25.61
11 8-isopropyl-1,3-dimethylphenanthrene x x 27.21 27.23 x x x x x x
12 DHA_Methyl ester x x x x x 27.48 x 27.49 27.47 22.59
13 1,4-Naphthoquinone, 2-acetyl-5,8 … x x x x x x x x x x
14 Dehydroabietic acid (DHA) TMS x x 28.26 28.26 x 28.26 28.28 28.27 28.27 28.3
15 Acetic acid x x x x 28.32 x x x x x
16 Oleamide, N-trimethylsilyl 28.66 x x x 28.64 x 28.65 x 28.64 x
17 3-hydroxy DHA_TMS x x x x x x 29.72 29.73 29.72 x
18 7-hydroxy DHA_TMS x x x x x x 30.15 30.15 30.15 31.22
19 7-oxodehydroabietic acid, methyl ester x 32.17 x x x 32.15 32.16 32.16 32.16 32.18
20 7-oxodehydroabietic acid TMS x 30.15 x x x x x x x x
21 15-hydroxy-7oxodehydroabietic acid TMS x x x x x 37.03 37.03 37.03 37.04 x
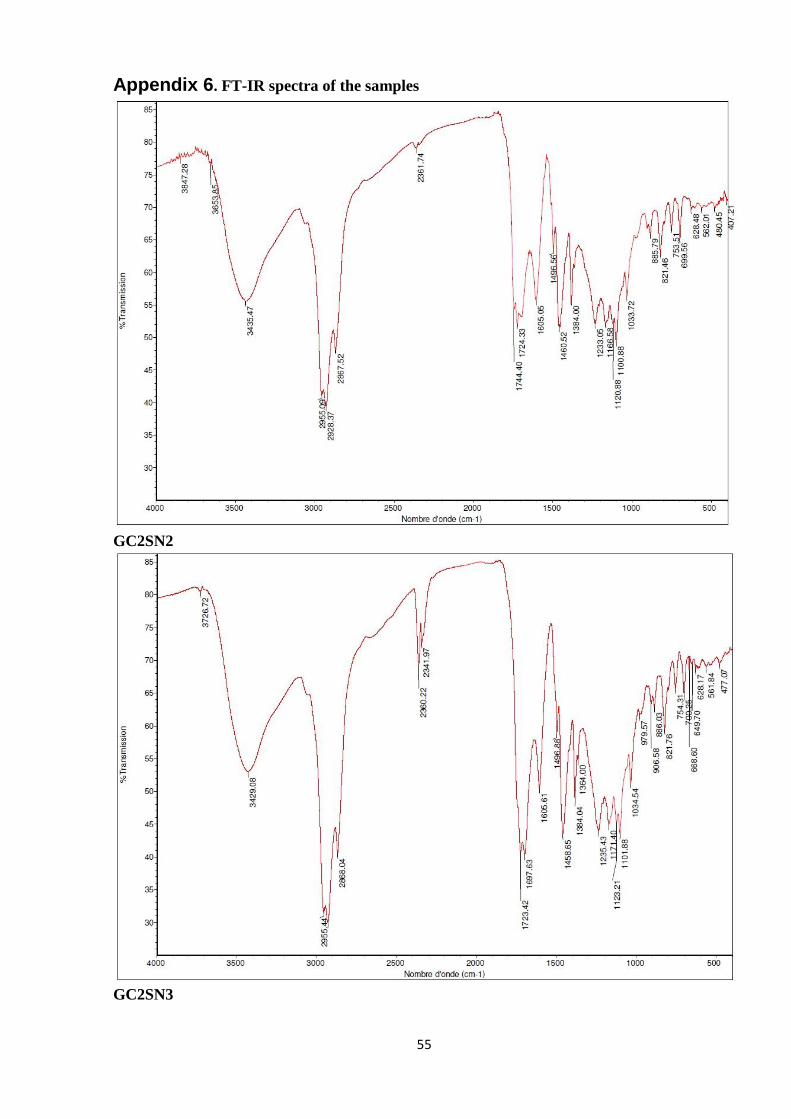
55
Appendix 6. FT-IR spectra of the samples
GC2SN2
GC2SN3

56
GC2SN4
GC2SN5

57
GC2SN6
GC2SN8
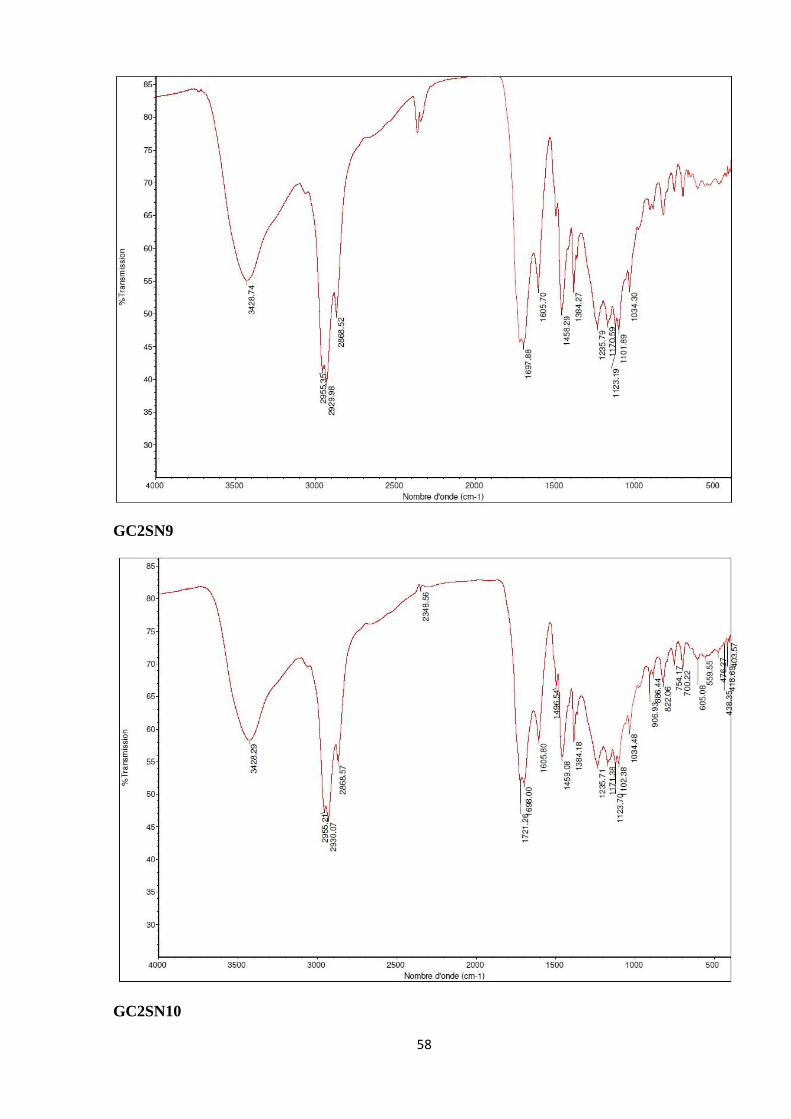
58
GC2SN9
GC2SN10
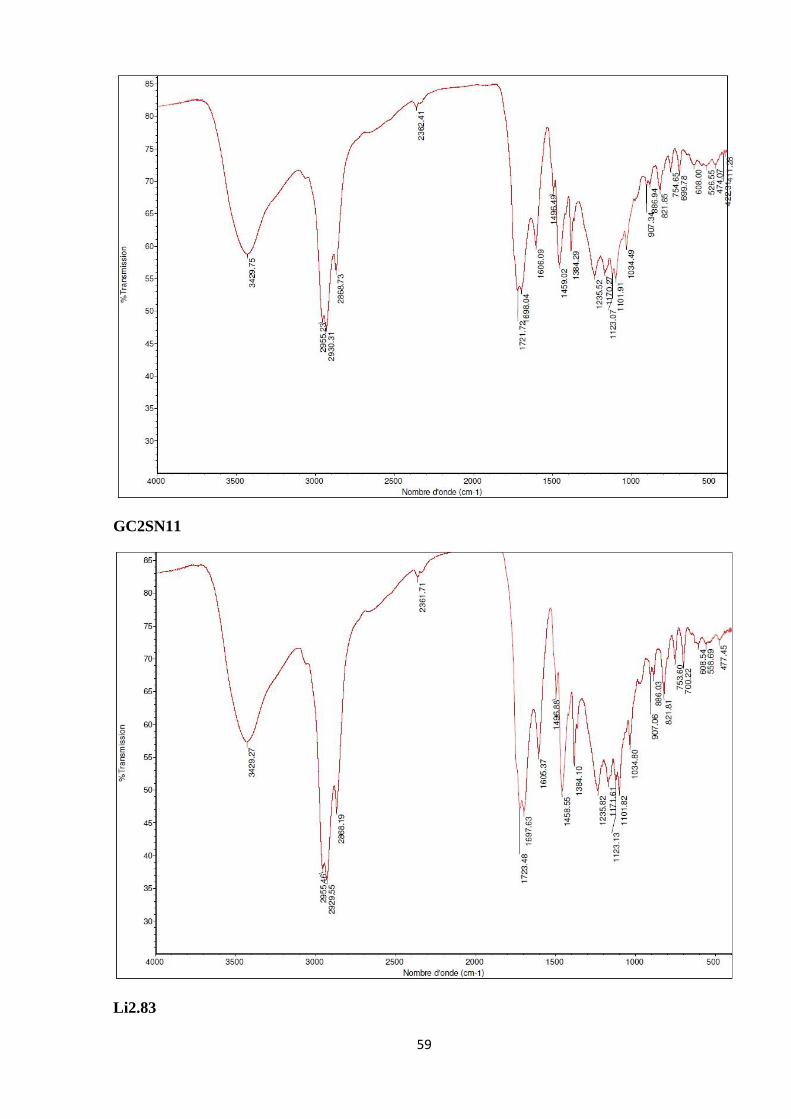
59
GC2SN11
Li2.83

60
24210
24255

61
24265
24268

62
24270
24281

63
AV22
AV23

64
AV24
AV25

65
C98
CB4155

66
GE3932
SL2878

67
4928

68
ARL 3
ARL 4
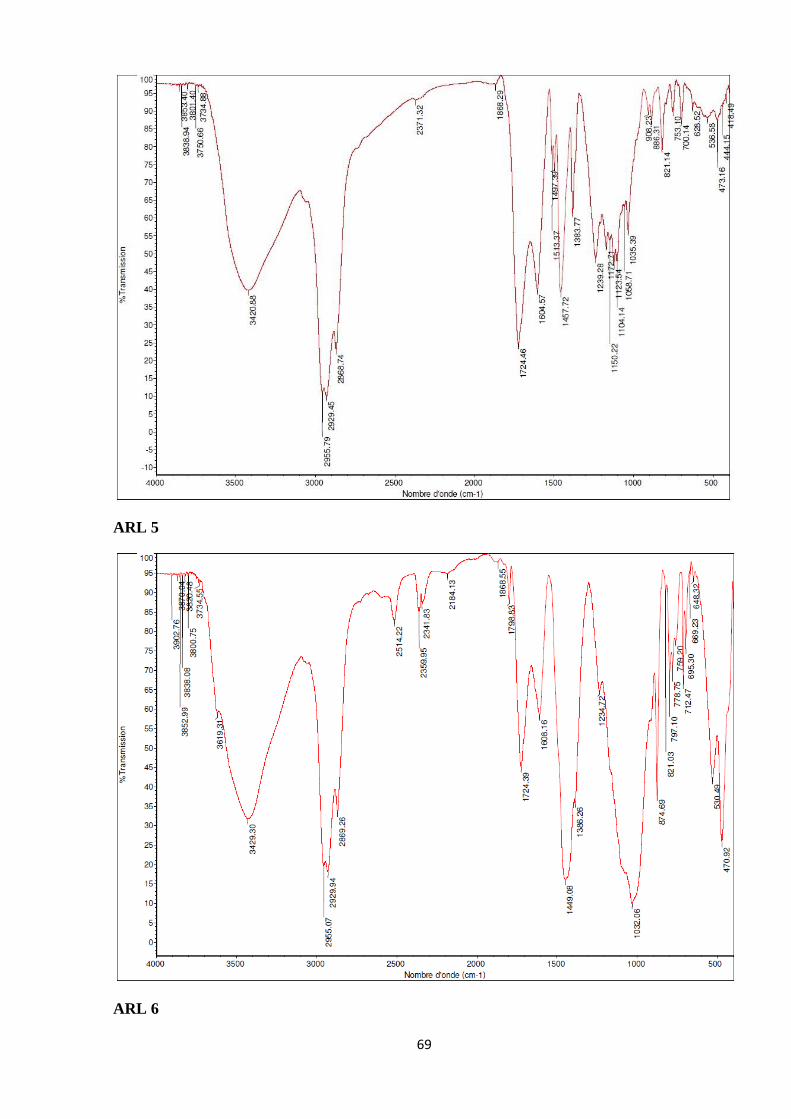
69
ARL 5
ARL 6

70
ARL 7
ARL 8

71
ARL 9
ARL 12
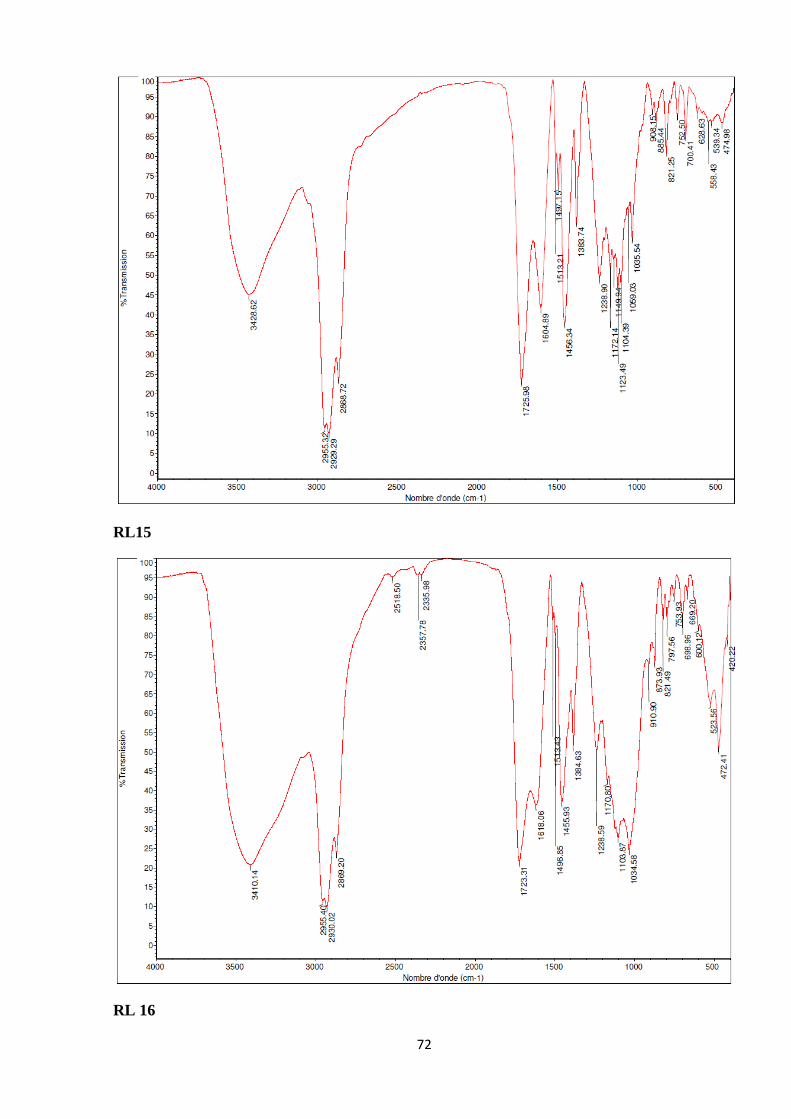
72
RL15
RL 16

73
RL 17
RL 18

74
RL 19
RL 20

75
RL 21

76
Appendix 7. GC-MS results. Total ion chromatograms of the samples.
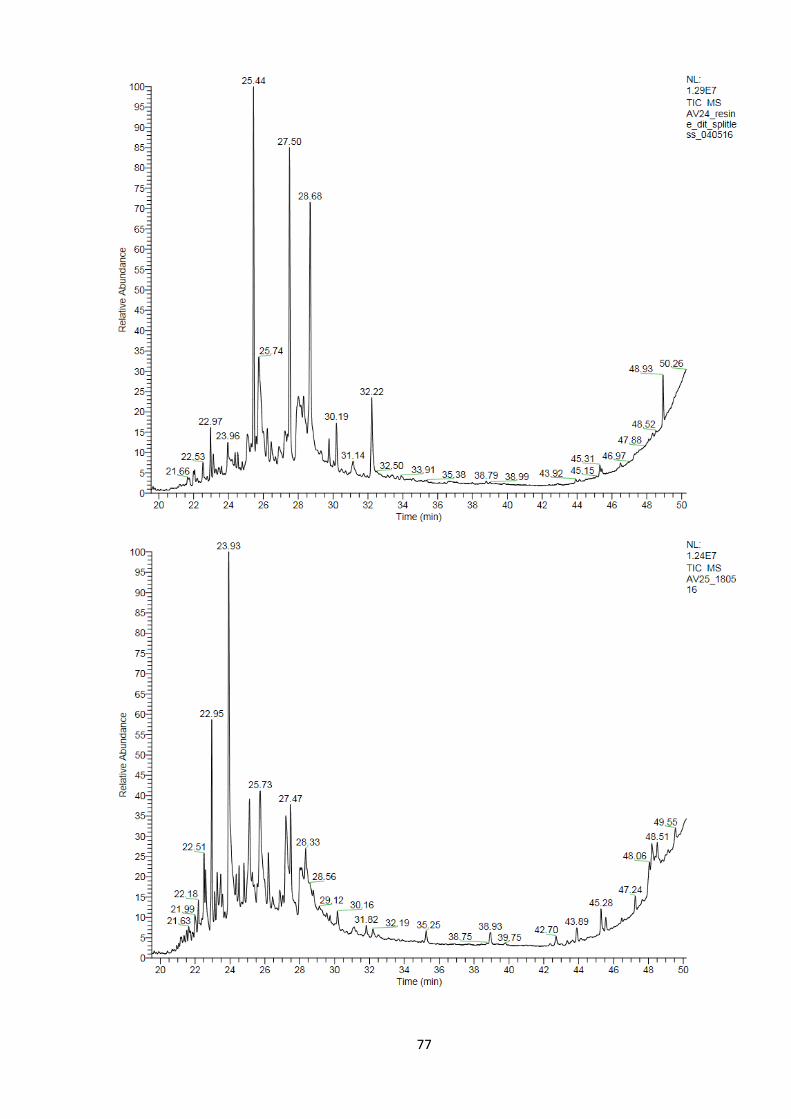
77
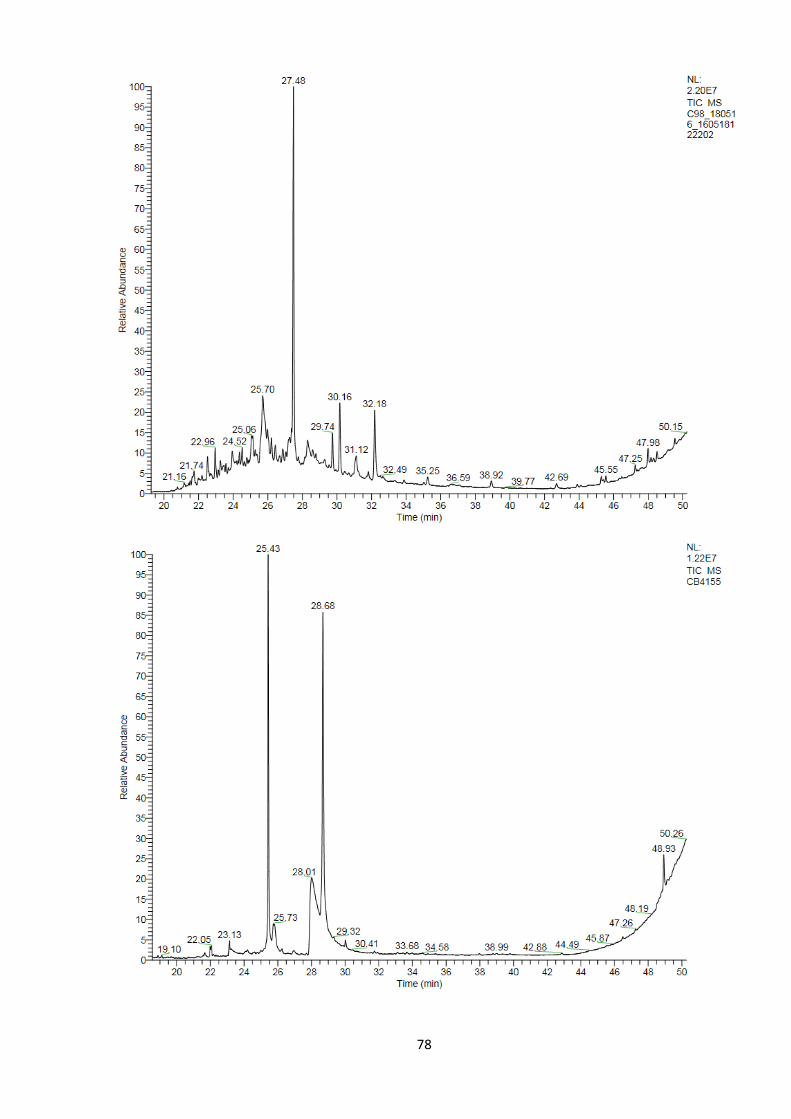
78
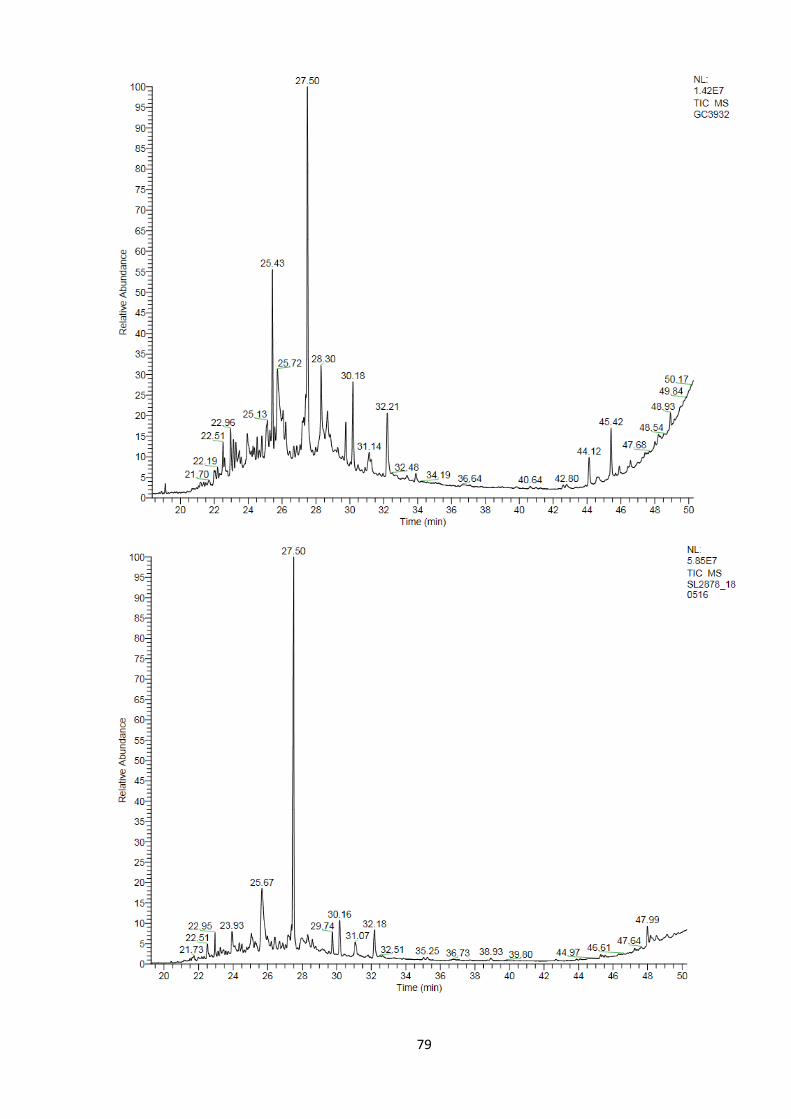
79
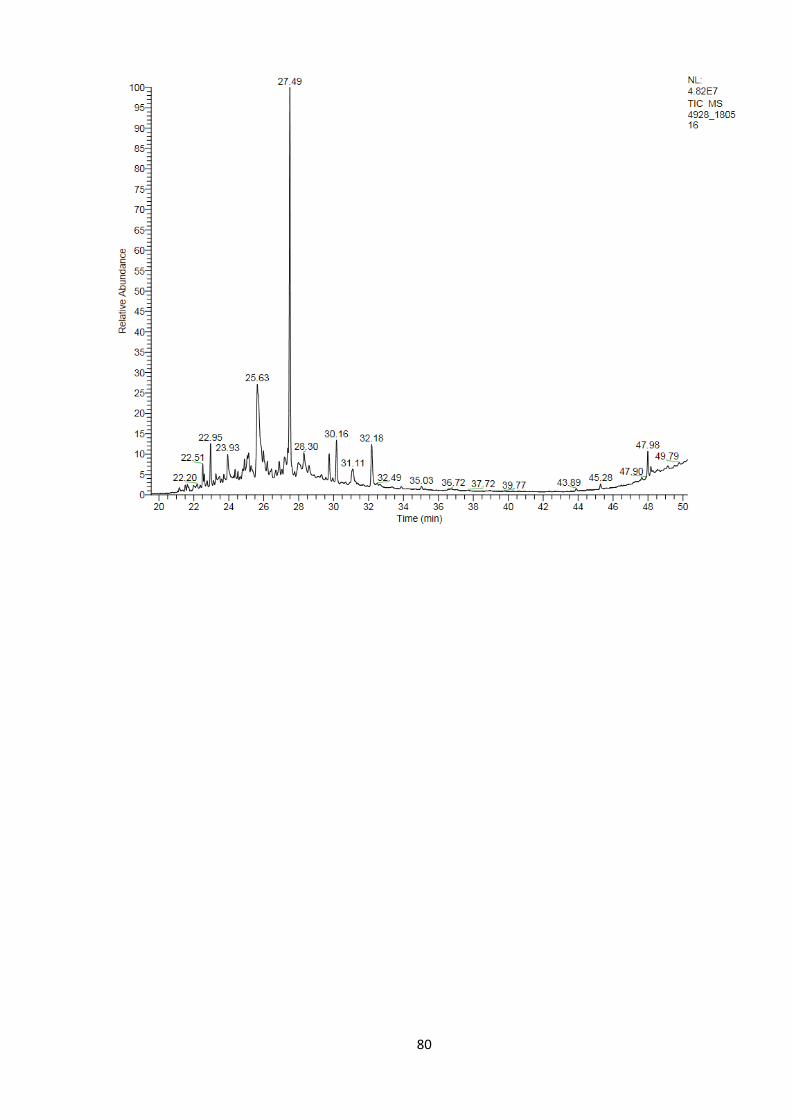
80
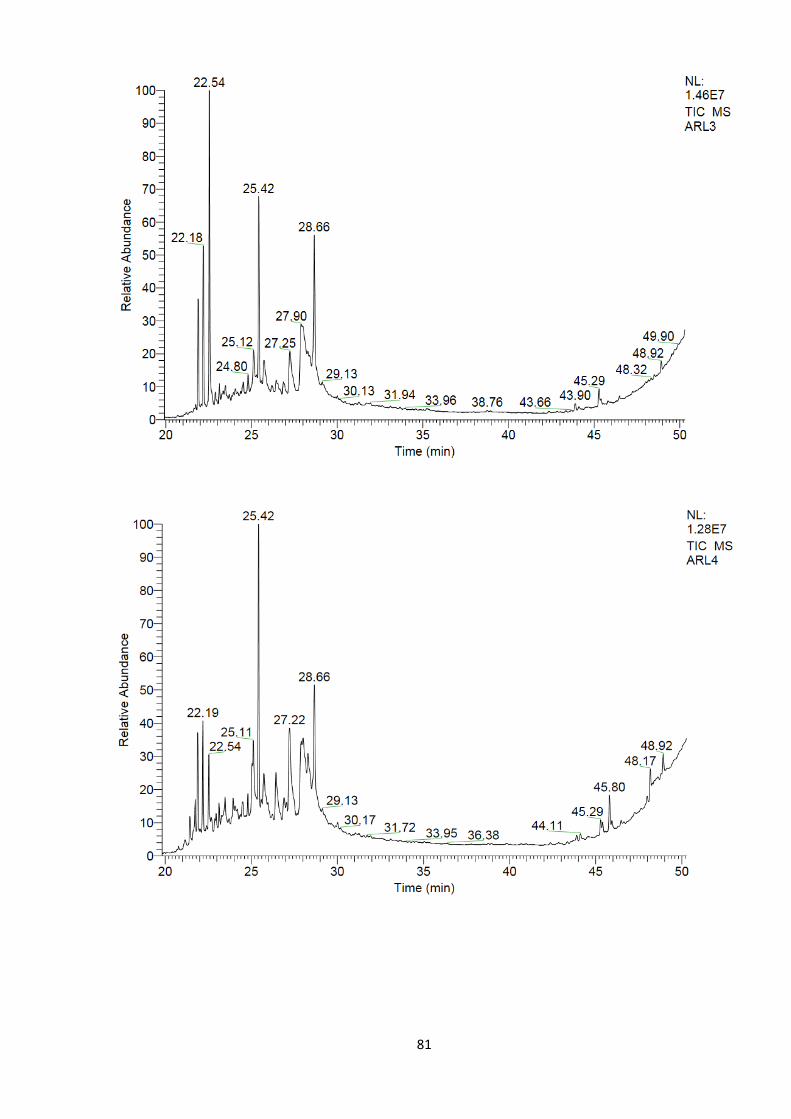
81

82

83

84

85

86
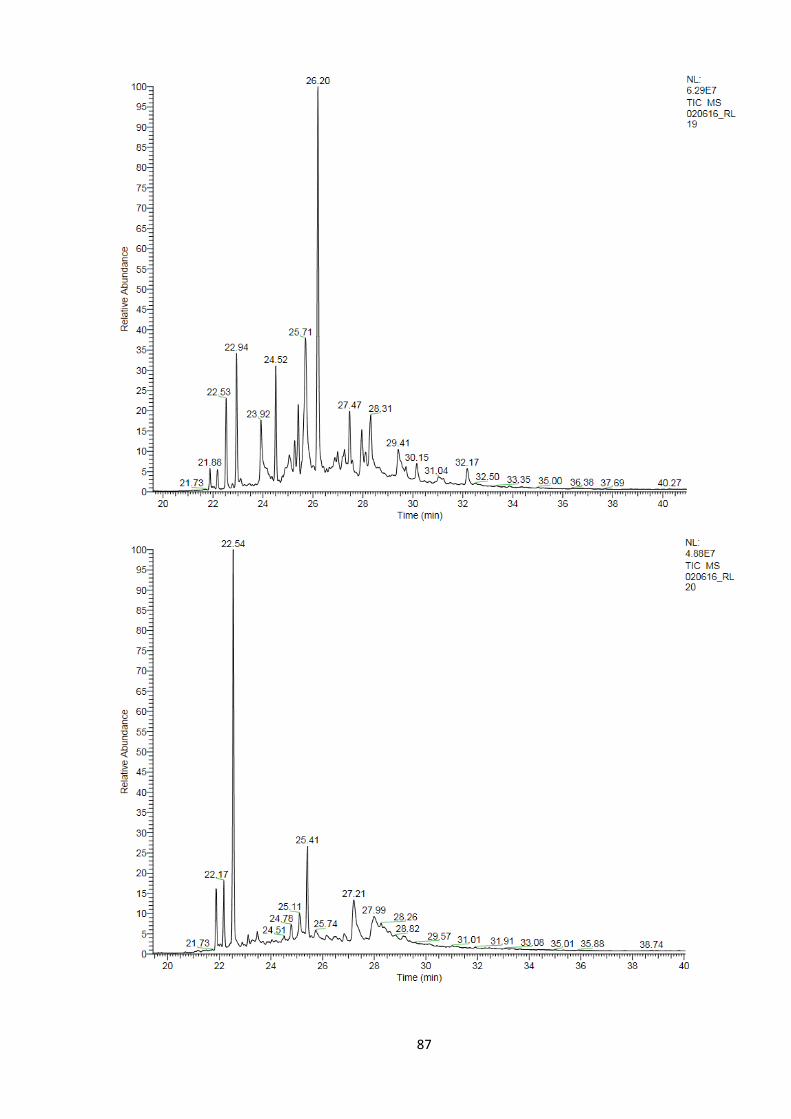
87

88

89
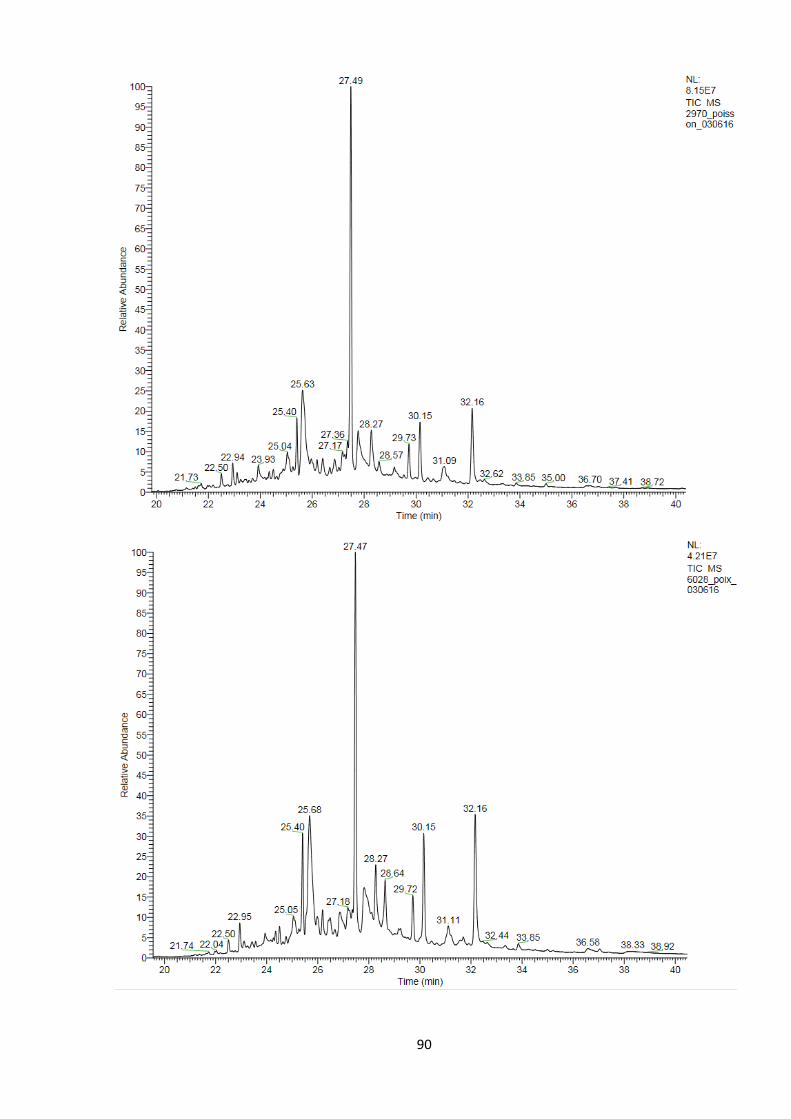
90

91